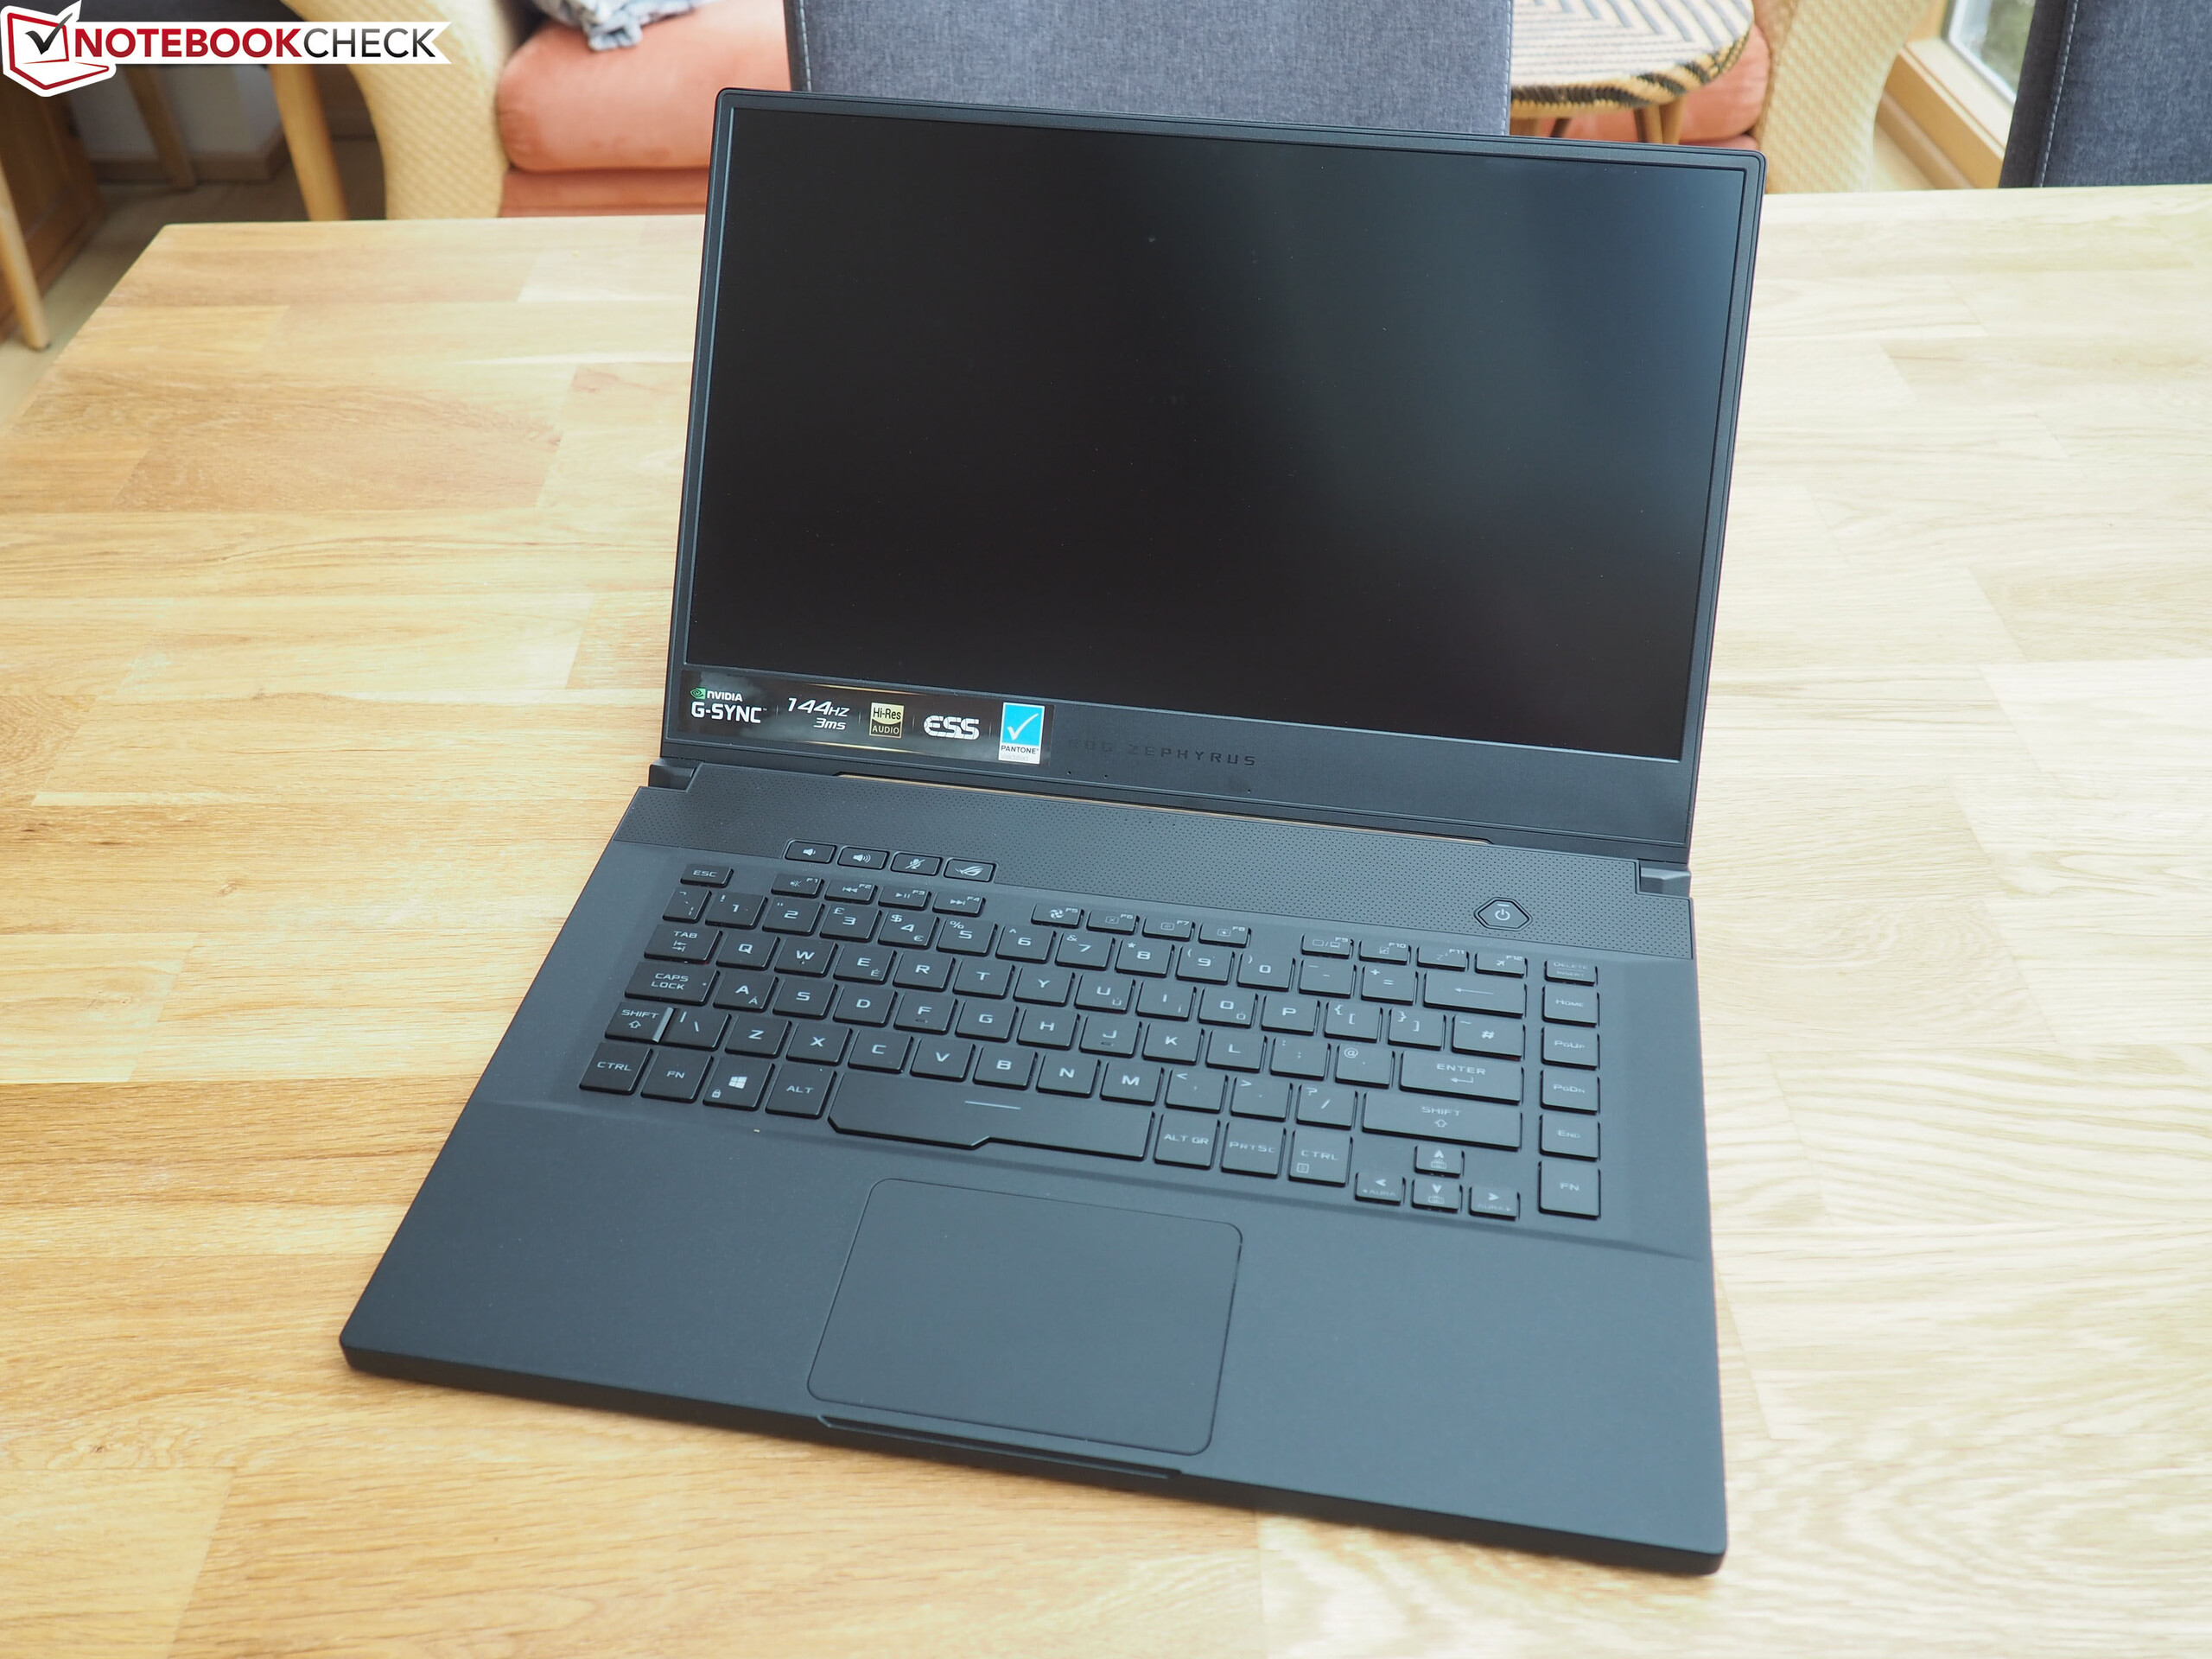
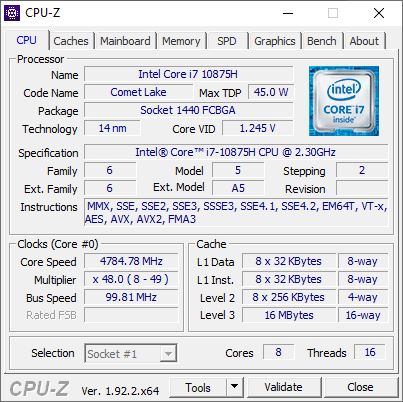
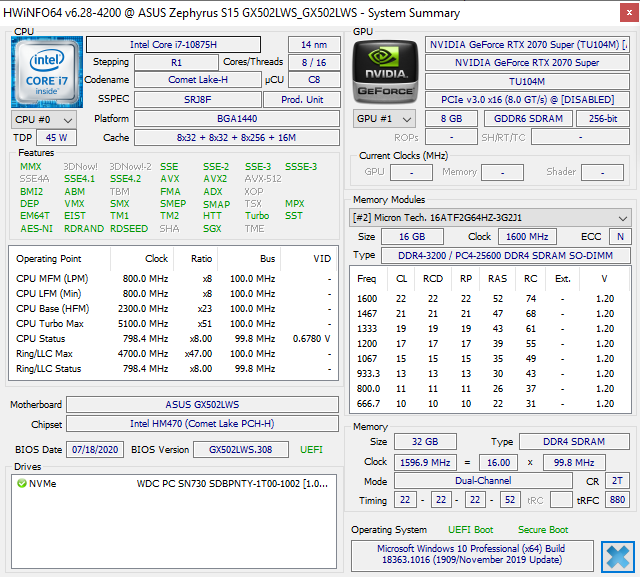
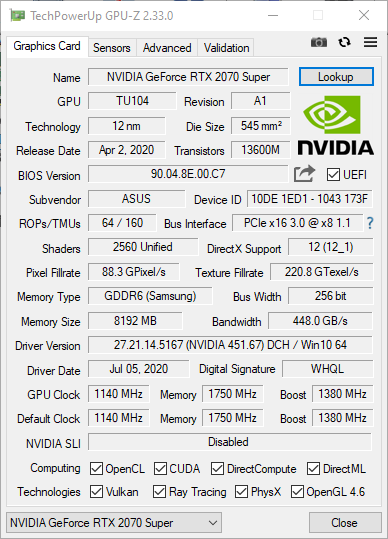
Breve Análise do Portátil Asus ROG Zephyrus S15 GX502L: Portátil de jogos atualizado para Comet Lake
Avaliação | Data | Modelo | Peso | Altura | Size | Resolução | Preço |
|---|---|---|---|---|---|---|---|
| 82.9 % v7 (old) | 10/2020 | Asus Zephyrus S15 GX502L i7-10875H, GeForce RTX 2070 Super Mobile | 2.1 kg | 19 mm | 15.60" | 1920x1080 | |
| 81.3 % v7 (old) | 05/2019 | Asus Zephyrus S GX502GW i7-9750H, GeForce RTX 2070 Mobile | 2.1 kg | 19 mm | 15.60" | 1920x1080 | |
| 84.6 % v7 (old) | 07/2020 | MSI GE66 Raider 10SFS i9-10980HK, GeForce RTX 2070 Super Mobile | 2.4 kg | 23 mm | 15.60" | 1920x1080 | |
| 86.9 % v7 (old) | 08/2020 | Razer Blade 15 RTX 2070 Super Max-Q i7-10875H, GeForce RTX 2070 Super Max-Q | 2.1 kg | 17.8 mm | 15.60" | 1920x1080 | |
| 86.5 % v7 (old) | 08/2020 | Aorus 15G XB i7-10875H, GeForce RTX 2070 Super Max-Q | 2.3 kg | 25 mm | 15.60" | 1920x1080 |
| |||||||||||||||||||||||||
iluminação: 90 %
iluminação com acumulador: 283 cd/m²
Contraste: 1179:1 (Preto: 0.24 cd/m²)
ΔE ColorChecker Calman: 2.26 | ∀{0.5-29.43 Ø4.71}
calibrated: 1.11
ΔE Greyscale Calman: 3.4 | ∀{0.09-98 Ø4.96}
93% sRGB (Argyll 1.6.3 3D)
71% AdobeRGB 1998 (Argyll 1.6.3 3D)
71.1% AdobeRGB 1998 (Argyll 3D)
99.7% sRGB (Argyll 3D)
69.7% Display P3 (Argyll 3D)
Gamma: 2.228
CCT: 7249 K
| Asus Zephyrus S15 GX502L B156HAN12.0 (AUOBC8C), IPS, 1920x1080, 15.6" | Asus Zephyrus S GX502GW AU Optronics B156HAN08.2 (AUO82ED), IPS, 1920x1080, 15.6" | MSI GE66 Raider 10SFS Sharp LQ156M1JW03 (SHP14C5), IPS-Level, 1920x1080, 15.6" | Razer Blade 15 RTX 2070 Super Max-Q AU Optronics B156HAN12.0, IPS, 1920x1080, 15.6" | Aorus 15G XB Sharp LQ156M1JW03, IGZO, 1920x1080, 15.6" | |
|---|---|---|---|---|---|
| Display | -8% | -2% | -1% | -3% | |
| Display P3 Coverage (%) | 69.7 | 64.9 -7% | 68 -2% | 69.4 0% | 67.2 -4% |
| sRGB Coverage (%) | 99.7 | 91 -9% | 99 -1% | 98.8 -1% | 97.8 -2% |
| AdobeRGB 1998 Coverage (%) | 71.1 | 65.9 -7% | 69.8 -2% | 70.5 -1% | 68 -4% |
| Response Times | 29% | -13% | 47% | -16% | |
| Response Time Grey 50% / Grey 80% * (ms) | 14 ? | 7.2 ? 49% | 16.4 ? -17% | 3.2 ? 77% | 16 ? -14% |
| Response Time Black / White * (ms) | 9.6 ? | 8.8 ? 8% | 10.4 ? -8% | 8 ? 17% | 11.2 ? -17% |
| PWM Frequency (Hz) | 23580 ? | 23580 ? | |||
| Screen | -14% | 13% | -13% | 8% | |
| Brightness middle (cd/m²) | 283 | 286 1% | 291 3% | 345.4 22% | 264 -7% |
| Brightness (cd/m²) | 289 | 275 -5% | 278 -4% | 342 18% | 248 -14% |
| Brightness Distribution (%) | 90 | 90 0% | 91 1% | 90 0% | 89 -1% |
| Black Level * (cd/m²) | 0.24 | 0.37 -54% | 0.25 -4% | 0.34 -42% | 0.3 -25% |
| Contrast (:1) | 1179 | 773 -34% | 1164 -1% | 1016 -14% | 880 -25% |
| Colorchecker dE 2000 * | 2.26 | 2.19 3% | 1.19 47% | 3.18 -41% | 1.21 46% |
| Colorchecker dE 2000 max. * | 5.64 | 4.4 22% | 3.04 46% | 6.57 -16% | 3.07 46% |
| Colorchecker dE 2000 calibrated * | 1.11 | 2.27 -105% | 1.77 -59% | 0.92 17% | |
| Greyscale dE 2000 * | 3.4 | 2.2 35% | 1.9 44% | 3.8 -12% | 1.6 53% |
| Gamma | 2.228 99% | 2.41 91% | 2.216 99% | 2.15 102% | 2.192 100% |
| CCT | 7249 90% | 6405 101% | 7018 93% | 7109 91% | 6340 103% |
| Color Space (Percent of AdobeRGB 1998) (%) | 71 | 59 -17% | 70 -1% | 64.3 -9% | 68 -4% |
| Color Space (Percent of sRGB) (%) | 93 | 91 -2% | 92 -1% | 99 6% | 90 -3% |
| Média Total (Programa/Configurações) | 2% /
-8% | -1% /
7% | 11% /
-3% | -4% /
3% |
* ... menor é melhor
Exibir tempos de resposta
| ↔ Tempo de resposta preto para branco | ||
|---|---|---|
| 9.6 ms ... ascensão ↗ e queda ↘ combinadas | ↗ 5.2 ms ascensão | 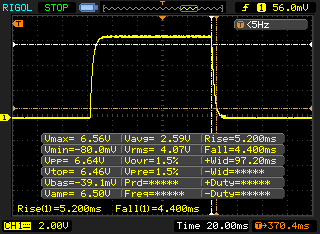 |
| ↘ 4.4 ms queda | ||
| A tela mostra taxas de resposta rápidas em nossos testes e deve ser adequada para jogos. Em comparação, todos os dispositivos testados variam de 0.1 (mínimo) a 240 (máximo) ms. » 26 % de todos os dispositivos são melhores. Isso significa que o tempo de resposta medido é melhor que a média de todos os dispositivos testados (19.8 ms). | ||
| ↔ Tempo de resposta 50% cinza a 80% cinza | ||
| 14 ms ... ascensão ↗ e queda ↘ combinadas | ↗ 6.8 ms ascensão | 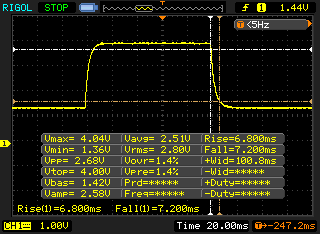 |
| ↘ 7.2 ms queda | ||
| A tela mostra boas taxas de resposta em nossos testes, mas pode ser muito lenta para jogadores competitivos. Em comparação, todos os dispositivos testados variam de 0.165 (mínimo) a 636 (máximo) ms. » 28 % de todos os dispositivos são melhores. Isso significa que o tempo de resposta medido é melhor que a média de todos os dispositivos testados (31 ms). | ||
Cintilação da tela / PWM (modulação por largura de pulso)
| Tela tremeluzindo / PWM não detectado | 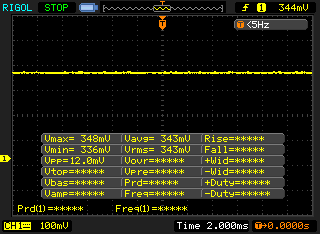 | ||
[pwm_comparison] Em comparação: 52 % de todos os dispositivos testados não usam PWM para escurecer a tela. Se PWM foi detectado, uma média de 7754 (mínimo: 5 - máximo: 343500) Hz foi medida. | |||
* ... menor é melhor
| DPC Latencies / LatencyMon - interrupt to process latency (max), Web, Youtube, Prime95 | |
| Asus Zephyrus S15 GX502L | |
| Aorus 15G XB | |
| Razer Blade 15 RTX 2070 Super Max-Q | |
| MSI GE66 Raider 10SFS | |
* ... menor é melhor
| Asus Zephyrus S15 GX502L WDC PC SN730 SDBPNTY-1T00 | Asus Zephyrus S GX502GW 2x Intel SSD 660p SSDPEKNW512G8 (RAID 0) | MSI GE66 Raider 10SFS WDC PC SN730 SDBPNTY-1T00 | Razer Blade 15 RTX 2070 Super Max-Q Samsung SSD PM981a MZVLB512HBJQ | Aorus 15G XB Samsung SSD PM981a MZVLB512HBJQ | Média WDC PC SN730 SDBPNTY-1T00 | |
|---|---|---|---|---|---|---|
| CrystalDiskMark 5.2 / 6 | -11% | 15% | 12% | 7% | 7% | |
| Write 4K (MB/s) | 127.4 | 97 -24% | 158.2 24% | 139.8 10% | 121.6 -5% | 139.9 ? 10% |
| Read 4K (MB/s) | 46.38 | 49.58 7% | 50.7 9% | 48.62 5% | 44.37 -4% | 44.5 ? -4% |
| Write Seq (MB/s) | 2034 | 1838 -10% | 1790 -12% | 2260 11% | 2617 29% | 2346 ? 15% |
| Read Seq (MB/s) | 2172 | 2421 11% | 2469 14% | 2135 -2% | 1297 -40% | 2102 ? -3% |
| Write 4K Q32T1 (MB/s) | 413.7 | 326.9 -21% | 503 22% | 499.3 21% | 499 21% | 442 ? 7% |
| Read 4K Q32T1 (MB/s) | 354 | 372.9 5% | 579 64% | 552 56% | 557 57% | 460 ? 30% |
| Write Seq Q32T1 (MB/s) | 3063 | 1894 -38% | 3102 1% | 2960 -3% | 2978 -3% | 3049 ? 0% |
| Read Seq Q32T1 (MB/s) | 3396 | 2828 -17% | 3413 1% | 3269 -4% | 3360 -1% | 3285 ? -3% |
| AS SSD | -18% | 33% | -9% | 13% | 0% | |
| Seq Read (MB/s) | 2714 | 2506 -8% | 2979 10% | 1957 -28% | 1795 -34% | 2606 ? -4% |
| Seq Write (MB/s) | 928 | 1712 84% | 2581 178% | 2092 125% | 2724 194% | 1935 ? 109% |
| 4K Read (MB/s) | 42.83 | 48.32 13% | 47.33 11% | 50.2 17% | 49.67 16% | 42.9 ? 0% |
| 4K Write (MB/s) | 120.5 | 103.6 -14% | 140 16% | 96.5 -20% | 109.3 -9% | 129.1 ? 7% |
| 4K-64 Read (MB/s) | 978 | 624 -36% | 1710 75% | 1594 63% | 1284 31% | 1361 ? 39% |
| 4K-64 Write (MB/s) | 2797 | 1253 -55% | 2188 -22% | 2005 -28% | 1962 -30% | 1920 ? -31% |
| Access Time Read * (ms) | 0.057 | 0.08 -40% | 0.05 12% | 0.057 -0% | 0.063 -11% | 0.0689 ? -21% |
| Access Time Write * (ms) | 0.032 | 0.04 -25% | 0.026 19% | 0.112 -250% | 0.034 -6% | 0.06215 ? -94% |
| Score Read (Points) | 1292 | 923 -29% | 2055 59% | 1840 42% | 1513 17% | 1664 ? 29% |
| Score Write (Points) | 3011 | 1528 -49% | 2586 -14% | 2310 -23% | 2344 -22% | 2242 ? -26% |
| Score Total (Points) | 4881 | 2896 -41% | 5673 16% | 5103 5% | 4685 -4% | 4726 ? -3% |
| Média Total (Programa/Configurações) | -15% /
-15% | 24% /
25% | 2% /
-0% | 10% /
10% | 4% /
3% |
* ... menor é melhor

Continuous load read: DiskSpd Read Loop, Queue Depth 8
| 3DMark 11 Performance | 23795 pontos | |
| 3DMark Cloud Gate Standard Score | 48072 pontos | |
| 3DMark Fire Strike Score | 19416 pontos | |
| 3DMark Time Spy Score | 8293 pontos | |
Ajuda | ||
| The Witcher 3 - 1920x1080 Ultra Graphics & Postprocessing (HBAO+) | |
| Média da turma Gaming (104.7 - 240, n=7, últimos 2 anos) | |
| Média NVIDIA GeForce RTX 2070 Super Mobile (76.3 - 94.6, n=8) | |
| MSI GE66 Raider 10SFS | |
| Asus Zephyrus S15 GX502L | |
| Aorus 15G XB | |
| Razer Blade 15 RTX 2070 Super Max-Q | |
| Asus Zephyrus S GX502GW | |
| Far Cry 5 - 1920x1080 Ultra Preset AA:T | |
| Média da turma Gaming (70 - 151, n=6, últimos 2 anos) | |
| Média NVIDIA GeForce RTX 2070 Super Mobile (98 - 112, n=2) | |
| Asus Zephyrus S15 GX502L | |
| Final Fantasy XV Benchmark - 1920x1080 High Quality | |
| Média da turma Gaming (41 - 215, n=95, últimos 2 anos) | |
| MSI GE66 Raider 10SFS | |
| Média NVIDIA GeForce RTX 2070 Super Mobile (79.7 - 91.1, n=2) | |
| Razer Blade 15 RTX 2070 Super Max-Q | |
| Asus Zephyrus S15 GX502L | |
| X-Plane 11.11 - 1920x1080 high (fps_test=3) | |
| Média da turma Gaming (55.5 - 143.5, n=109, últimos 2 anos) | |
| Razer Blade 15 RTX 2070 Super Max-Q | |
| MSI GE66 Raider 10SFS | |
| Média NVIDIA GeForce RTX 2070 Super Mobile (78.5 - 87, n=4) | |
| Asus Zephyrus S15 GX502L | |
| baixo | média | alto | ultra | |
|---|---|---|---|---|
| The Witcher 3 (2015) | 76.3 | |||
| Dota 2 Reborn (2015) | 156 | 136 | 111 | 104 |
| Final Fantasy XV Benchmark (2018) | 79.7 | |||
| X-Plane 11.11 (2018) | 107 | 89.4 | 78.5 | |
| Far Cry 5 (2018) | 98 | |||
| Doom Eternal (2020) | 190.4 |
Barulho
| Ocioso |
| 28 / 31 / 36 dB |
| Carga |
| 56 / 57 dB |
 | ||
30 dB silencioso 40 dB(A) audível 50 dB(A) ruidosamente alto |
||
min: | ||
(-) A temperatura máxima no lado superior é 51 °C / 124 F, em comparação com a média de 40.4 °C / 105 F , variando de 21.2 a 68.8 °C para a classe Gaming.
(±) A parte inferior aquece até um máximo de 44 °C / 111 F, em comparação com a média de 43.2 °C / 110 F
(+) Em uso inativo, a temperatura média para o lado superior é 28.3 °C / 83 F, em comparação com a média do dispositivo de 33.9 °C / ### class_avg_f### F.
(-) Jogando The Witcher 3, a temperatura média para o lado superior é 44.1 °C / 111 F, em comparação com a média do dispositivo de 33.9 °C / ## #class_avg_f### F.
(±) Os apoios para as mãos e o touchpad podem ficar muito quentes ao toque, com um máximo de 37 °C / 98.6 F.
(-) A temperatura média da área do apoio para as mãos de dispositivos semelhantes foi 28.8 °C / 83.8 F (-8.2 °C / -14.8 F).
Asus Zephyrus S15 GX502L análise de áudio
(+) | os alto-falantes podem tocar relativamente alto (###valor### dB)
Graves 100 - 315Hz
(±) | graves reduzidos - em média 12.1% menor que a mediana
(±) | a linearidade dos graves é média (7.9% delta para a frequência anterior)
Médios 400 - 2.000 Hz
(+) | médios equilibrados - apenas 2.9% longe da mediana
(+) | médios são lineares (3.3% delta para frequência anterior)
Altos 2 - 16 kHz
(+) | agudos equilibrados - apenas 2.4% longe da mediana
(+) | os máximos são lineares (6% delta da frequência anterior)
Geral 100 - 16.000 Hz
(+) | o som geral é linear (10.5% diferença em relação à mediana)
Comparado com a mesma classe
» 6% de todos os dispositivos testados nesta classe foram melhores, 2% semelhantes, 92% piores
» O melhor teve um delta de 6%, a média foi 18%, o pior foi 132%
Comparado com todos os dispositivos testados
» 5% de todos os dispositivos testados foram melhores, 1% semelhantes, 93% piores
» O melhor teve um delta de 4%, a média foi 23%, o pior foi 134%
Asus Zephyrus S GX502GW análise de áudio
(+) | os alto-falantes podem tocar relativamente alto (###valor### dB)
Graves 100 - 315Hz
(±) | graves reduzidos - em média 12.7% menor que a mediana
(±) | a linearidade dos graves é média (8.5% delta para a frequência anterior)
Médios 400 - 2.000 Hz
(+) | médios equilibrados - apenas 4.5% longe da mediana
(+) | médios são lineares (4.1% delta para frequência anterior)
Altos 2 - 16 kHz
(±) | máximos mais altos - em média 6.7% maior que a mediana
(±) | a linearidade dos máximos é média (10.8% delta para frequência anterior)
Geral 100 - 16.000 Hz
(+) | o som geral é linear (14.6% diferença em relação à mediana)
Comparado com a mesma classe
» 28% de todos os dispositivos testados nesta classe foram melhores, 7% semelhantes, 65% piores
» O melhor teve um delta de 6%, a média foi 18%, o pior foi 132%
Comparado com todos os dispositivos testados
» 19% de todos os dispositivos testados foram melhores, 4% semelhantes, 77% piores
» O melhor teve um delta de 4%, a média foi 23%, o pior foi 134%
| desligado | |
| Ocioso | |
| Carga |
|
Key:
min: | |
| Asus Zephyrus S15 GX502L i7-10875H, GeForce RTX 2070 Super Mobile | Asus Zephyrus S GX502GW i7-9750H, GeForce RTX 2070 Mobile | MSI GE66 Raider 10SFS i9-10980HK, GeForce RTX 2070 Super Mobile | Razer Blade 15 RTX 2070 Super Max-Q i7-10875H, GeForce RTX 2070 Super Max-Q | Aorus 15G XB i7-10875H, GeForce RTX 2070 Super Max-Q | Média da turma Gaming | |
|---|---|---|---|---|---|---|
| Power Consumption | -61% | 0% | -31% | -29% | -23% | |
| Idle Minimum * (Watt) | 7 | 24 -243% | 6 14% | 14.3 -104% | 16 -129% | 13 ? -86% |
| Idle Average * (Watt) | 13 | 27 -108% | 14 -8% | 22.3 -72% | 20 -54% | 19 ? -46% |
| Idle Maximum * (Watt) | 25 | 33 -32% | 25 -0% | 36.9 -48% | 30 -20% | 24.6 ? 2% |
| Load Average * (Watt) | 148 | 129 13% | 108 27% | 118.4 20% | 102 31% | 110.7 ? 25% |
| Witcher 3 ultra * (Watt) | 175 | 176 -1% | 195 -11% | 153.7 12% | 156 11% | |
| Load Maximum * (Watt) | 232 | 216 7% | 280 -21% | 220.8 5% | 256 -10% | 259 ? -12% |
* ... menor é melhor
| Asus Zephyrus S15 GX502L i7-10875H, GeForce RTX 2070 Super Mobile, 76 Wh | Asus Zephyrus S GX502GW i7-9750H, GeForce RTX 2070 Mobile, 76 Wh | MSI GE66 Raider 10SFS i9-10980HK, GeForce RTX 2070 Super Mobile, 99.99 Wh | Razer Blade 15 RTX 2070 Super Max-Q i7-10875H, GeForce RTX 2070 Super Max-Q, 80 Wh | Aorus 15G XB i7-10875H, GeForce RTX 2070 Super Max-Q, 94 Wh | Média da turma Gaming | |
|---|---|---|---|---|---|---|
| Duração da bateria | -14% | 37% | 110% | 70% | 44% | |
| Reader / Idle (h) | 8.7 | 5.9 -32% | 7.6 -13% | 9.7 11% | 8.27 ? -5% | |
| WiFi v1.3 (h) | 3 | 3.7 23% | 6.1 103% | 6.3 110% | 7 133% | 7.11 ? 137% |
| Load (h) | 1.5 | 1 -33% | 1.8 20% | 2.5 67% | 1.502 ? 0% |
Pro
Contra
Verdict - Shorter battery life with a "Super" GPU
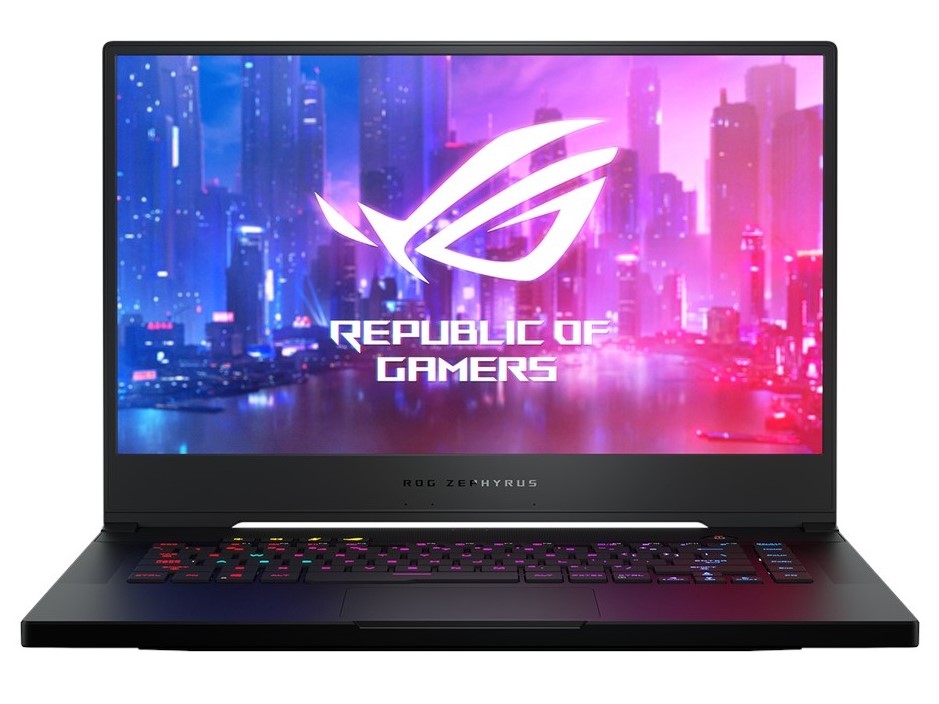
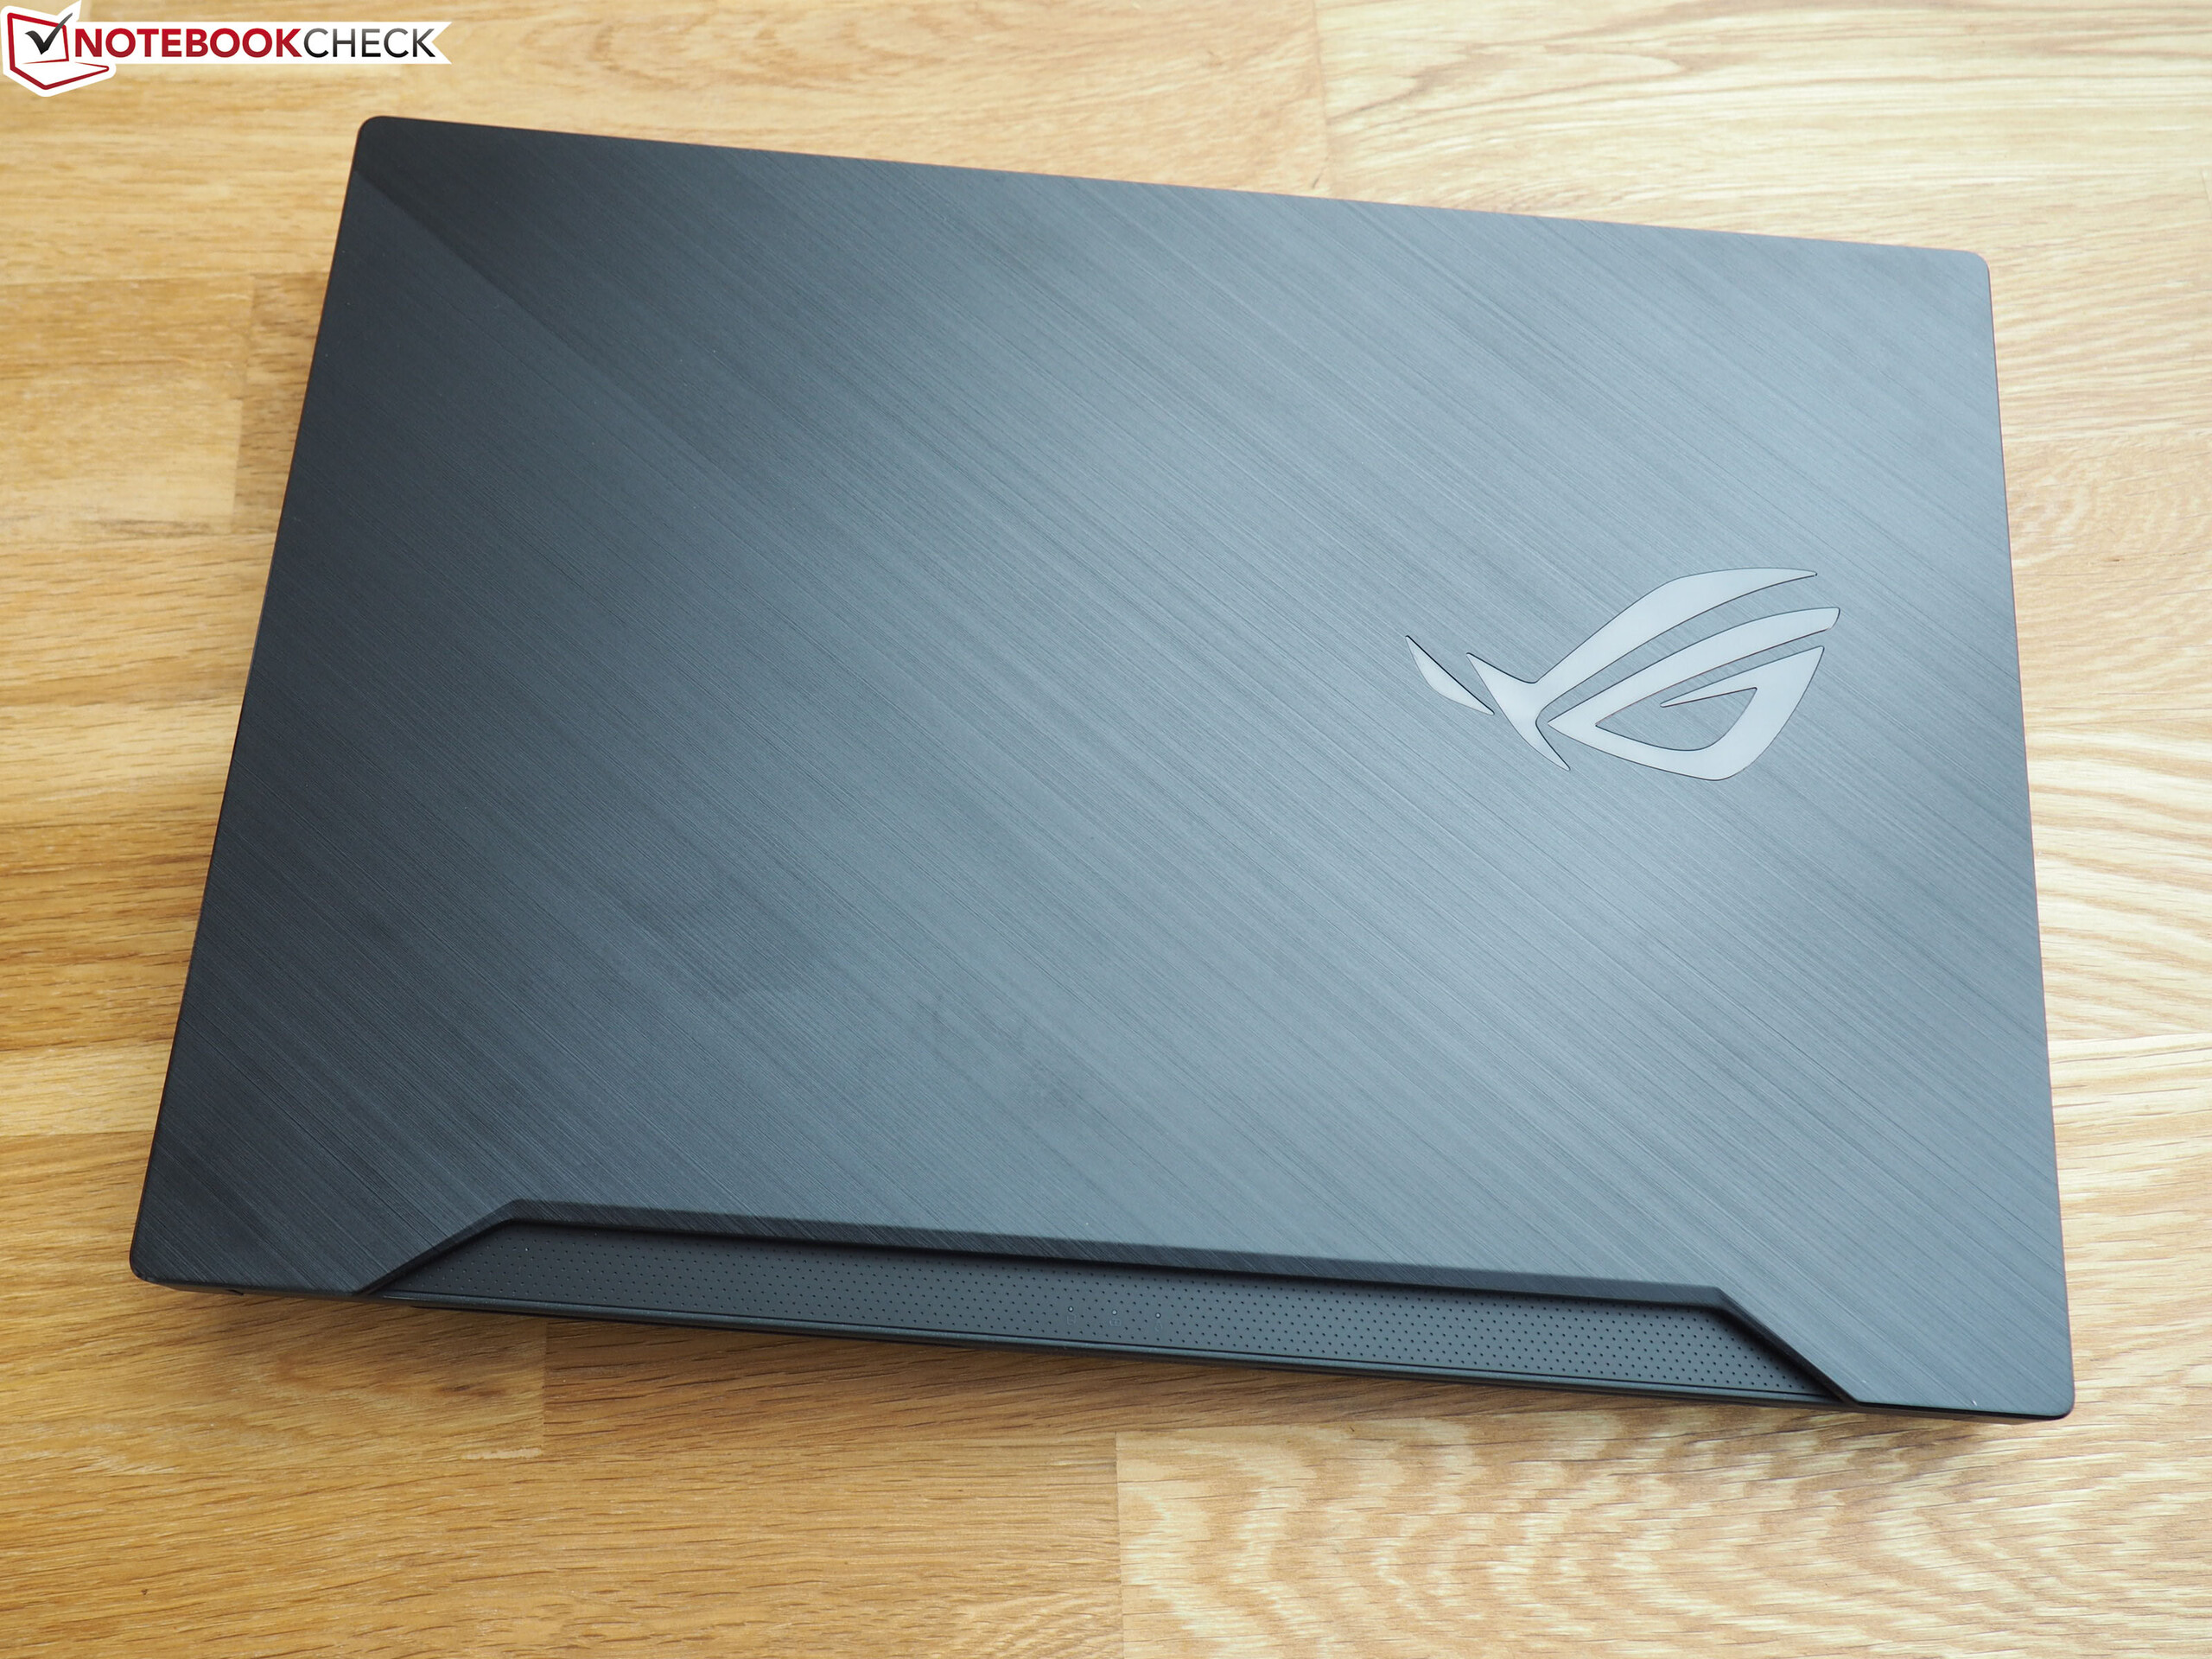
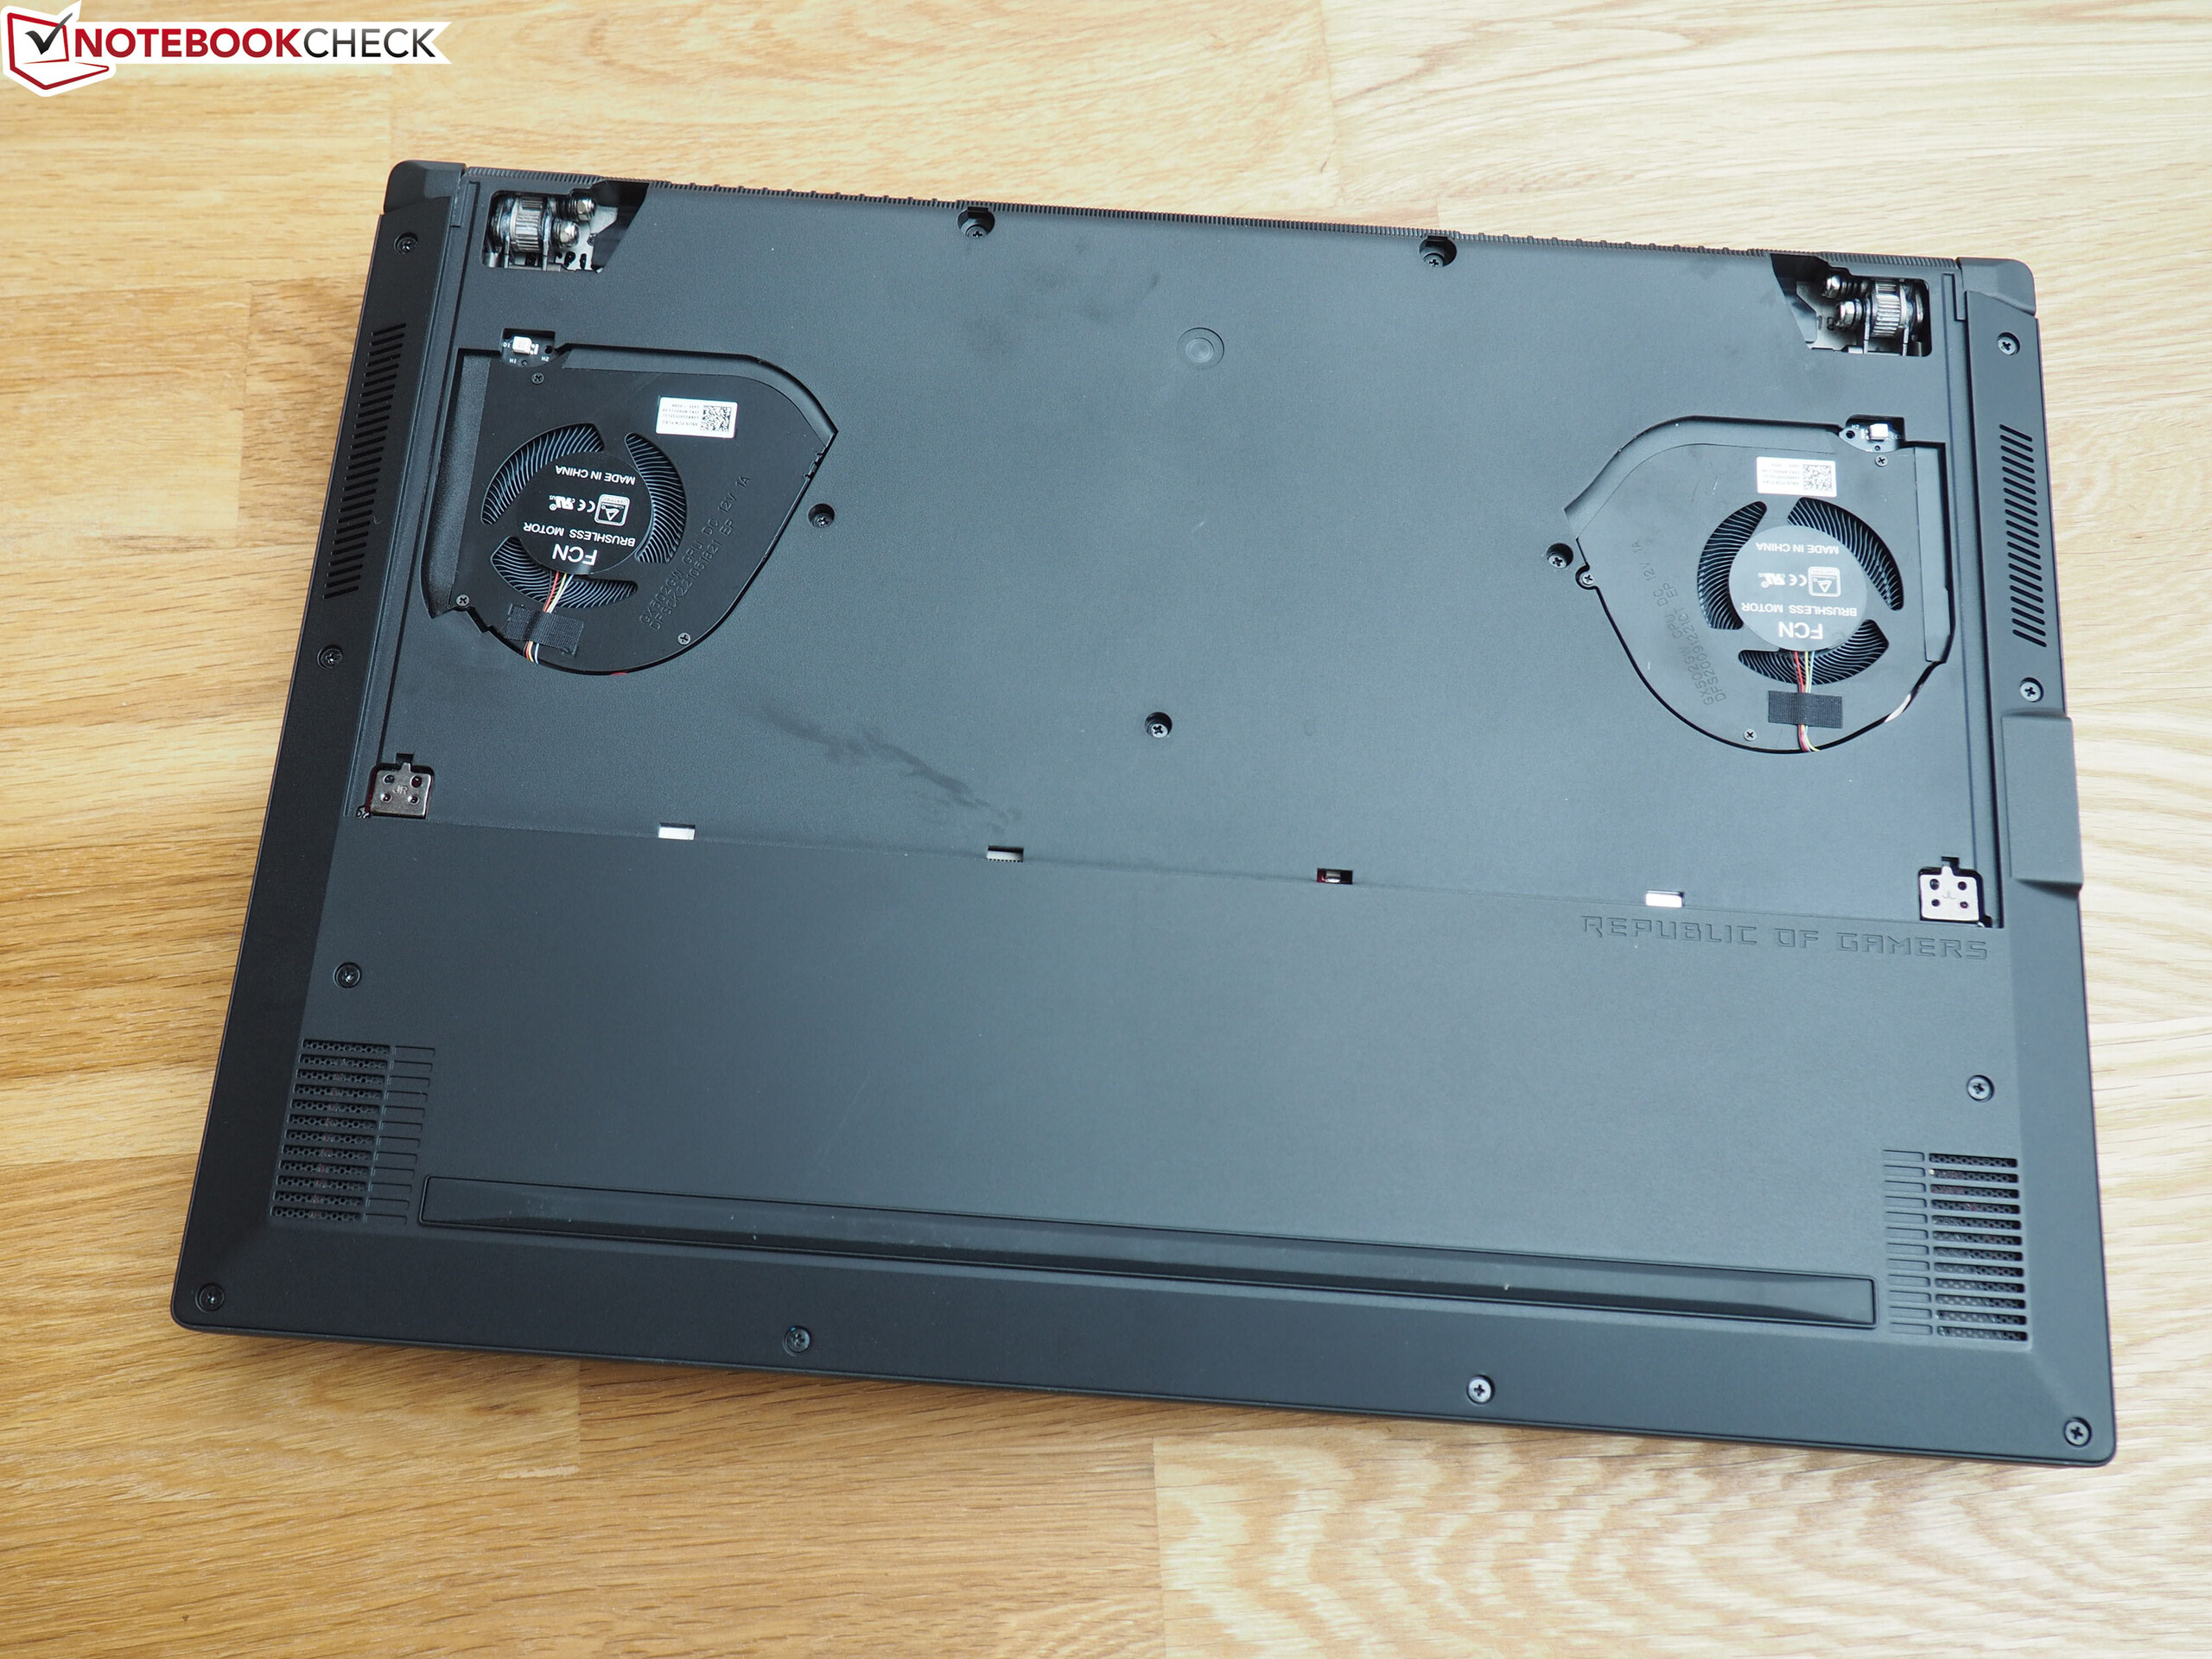
O Asus ROG Zephyrus S15 GX502L é, sem dúvida, um poderoso portátil para jogos. O design fino também o torna um dispositivo bastante móvel se estiver disposto a procurar regularmente uma tomada para o menor dos dois adaptadores de energia. No modo de jogo, o sistema de ventilação garante boas taxas de quadros, mesmo sem que os ventiladores tenham que funcionar ao máximo.
Com o Asus ROG Zephyrus S15, os jogos modernos podem ser jogados com os detalhes no máximo sem problemas.
Mas isso levanta a questão para os compradores em potencial de por que eles deveriam escolher este modelo. O dispositivo predecessor está disponível por um preço semelhante, oferece um desempenho de jogo comparável e dura um pouco mais com a energia da bateria. O aumento no desempenho não é muito grande apesar da CPU mais atual e da inclusão da RTX 2070 Super ao invés de "apenas" a RTX 2070. Mas se você valoriza o desempenho máximo em relação à duração da bateria, ficará muito satisfeito com o Zephyrus S15.
Asus Zephyrus S15 GX502L
- 09/27/2020 v7 (old)
Mike Wobker
Price comparison
