Breve Análise do Razer Blade 15 GeForce RTX 2070 Super Max-Q: O mesmo portátil, só que mais rápido
Avaliação | Data | Modelo | Peso | Altura | Size | Resolução | Preço |
|---|---|---|---|---|---|---|---|
| 86.9 % v7 (old) | 08/2020 | Razer Blade 15 RTX 2070 Super Max-Q i7-10875H, GeForce RTX 2070 Super Max-Q | 2.1 kg | 17.8 mm | 15.60" | 1920x1080 | |
| 82.8 % v7 (old) | 05/2020 | MSI GS66 Stealth 10SFS i9-10980HK, GeForce RTX 2070 Super Max-Q | 2.2 kg | 20 mm | 15.60" | 1920x1080 | |
| 81.3 % v7 (old) | 05/2019 | Asus Zephyrus S GX502GW i7-9750H, GeForce RTX 2070 Mobile | 2.1 kg | 19 mm | 15.60" | 1920x1080 | |
| 84 % v7 (old) | 05/2019 | Gigabyte Aero 15 Classic-XA i7-9750H, GeForce RTX 2070 Max-Q | 2.1 kg | 19 mm | 15.60" | 1920x1080 | |
| 84.8 % v7 (old) | Lenovo Legion Y740-15ICHg i7-9750H, GeForce RTX 2070 Max-Q | 2.3 kg | 25 mm | 15.60" | 1920x1080 | ||
| 83 % v7 (old) | 08/2020 | HP Envy 15-ep0098nr i7-10750H, GeForce RTX 2060 Max-Q | 2 kg | 19 mm | 15.60" | 3840x2160 |
| SD Card Reader | |
| average JPG Copy Test (av. of 3 runs) | |
| Razer Blade 15 RTX 2070 Super Max-Q (Toshiba Exceria Pro SDXC 64 GB UHS-II) | |
| Gigabyte Aero 15 Classic-XA (Toshiba Exceria Pro SDXC 64 GB UHS-II) | |
| HP Envy 15-ep0098nr (Toshiba Exceria Pro M501 UHS-II) | |
| maximum AS SSD Seq Read Test (1GB) | |
| Gigabyte Aero 15 Classic-XA (Toshiba Exceria Pro SDXC 64 GB UHS-II) | |
| Razer Blade 15 RTX 2070 Super Max-Q (Toshiba Exceria Pro SDXC 64 GB UHS-II) | |
| HP Envy 15-ep0098nr (Toshiba Exceria Pro M501 UHS-II) | |
| Networking | |
| iperf3 transmit AX12 | |
| MSI GS66 Stealth 10SFS | |
| HP Envy 15-ep0098nr | |
| Razer Blade 15 RTX 2070 Super Max-Q | |
| iperf3 receive AX12 | |
| HP Envy 15-ep0098nr | |
| Razer Blade 15 RTX 2070 Super Max-Q | |
| MSI GS66 Stealth 10SFS | |


| |||||||||||||||||||||||||
iluminação: 90 %
iluminação com acumulador: 345.4 cd/m²
Contraste: 1016:1 (Preto: 0.34 cd/m²)
ΔE ColorChecker Calman: 3.18 | ∀{0.5-29.43 Ø4.71}
calibrated: 1.77
ΔE Greyscale Calman: 3.8 | ∀{0.09-98 Ø4.96}
99% sRGB (Argyll 1.6.3 3D)
64.3% AdobeRGB 1998 (Argyll 1.6.3 3D)
70.5% AdobeRGB 1998 (Argyll 3D)
98.8% sRGB (Argyll 3D)
69.4% Display P3 (Argyll 3D)
Gamma: 2.15
CCT: 7109 K
| Razer Blade 15 RTX 2070 Super Max-Q AU Optronics B156HAN12.0, IPS, 15.6", 1920x1080 | MSI GS66 Stealth 10SFS AUO B156HAN12.0 (AUO328E), IPS, 15.6", 1920x1080 | Asus Zephyrus S GX502GW AU Optronics B156HAN08.2 (AUO82ED), IPS, 15.6", 1920x1080 | Gigabyte Aero 15 Classic-XA Sharp LQ156M1JW03 (SHP14C5), IGZO, 15.6", 1920x1080 | Lenovo Legion Y740-15ICHg BOE NV156FHM-N4J, IPS, 15.6", 1920x1080 | HP Envy 15-ep0098nr Samsung SDC4145, AMOLED, 15.6", 3840x2160 | |
|---|---|---|---|---|---|---|
| Display | 0% | -7% | -5% | -5% | 24% | |
| Display P3 Coverage (%) | 69.4 | 69.5 0% | 64.9 -6% | 65.3 -6% | 67.7 -2% | 88.5 28% |
| sRGB Coverage (%) | 98.8 | 99.6 1% | 91 -8% | 95.5 -3% | 91.6 -7% | 100 1% |
| AdobeRGB 1998 Coverage (%) | 70.5 | 70.8 0% | 65.9 -7% | 66.5 -6% | 67.1 -5% | 99.9 42% |
| Response Times | -179% | -68% | -208% | -260% | 71% | |
| Response Time Grey 50% / Grey 80% * (ms) | 3.2 ? | 14 ? -338% | 7.2 ? -125% | 15.2 ? -375% | 19 ? -494% | 0.8 ? 75% |
| Response Time Black / White * (ms) | 8 ? | 9.6 ? -20% | 8.8 ? -10% | 11.2 ? -40% | 10 ? -25% | 2.7 ? 66% |
| PWM Frequency (Hz) | 23580 ? | 242.7 ? | ||||
| Screen | 9% | -1% | 1% | 17% | -18% | |
| Brightness middle (cd/m²) | 345.4 | 316 -9% | 286 -17% | 266 -23% | 477 38% | 374.3 8% |
| Brightness (cd/m²) | 342 | 311 -9% | 275 -20% | 248 -27% | 431 26% | 379 11% |
| Brightness Distribution (%) | 90 | 92 2% | 90 0% | 89 -1% | 84 -7% | 91 1% |
| Black Level * (cd/m²) | 0.34 | 0.21 38% | 0.37 -9% | 0.31 9% | 0.175 49% | |
| Contrast (:1) | 1016 | 1505 48% | 773 -24% | 858 -16% | 2726 168% | |
| Colorchecker dE 2000 * | 3.18 | 3.03 5% | 2.19 31% | 2.78 13% | 4.17 -31% | 5.47 -72% |
| Colorchecker dE 2000 max. * | 6.57 | 7.32 -11% | 4.4 33% | 5.96 9% | 6.97 -6% | 8.22 -25% |
| Colorchecker dE 2000 calibrated * | 1.77 | 1.1 38% | 2.27 -28% | 0.91 49% | 2.51 -42% | 4.61 -160% |
| Greyscale dE 2000 * | 3.8 | 3.9 -3% | 2.2 42% | 3.58 6% | 3.49 8% | 2.3 39% |
| Gamma | 2.15 102% | 2.42 91% | 2.41 91% | 2.46 89% | 2.5 88% | 2.09 105% |
| CCT | 7109 91% | 7439 87% | 6405 101% | 7186 90% | 7076 92% | 6340 103% |
| Color Space (Percent of AdobeRGB 1998) (%) | 64.3 | 65 1% | 59 -8% | 62 -4% | 60 -7% | 87.8 37% |
| Color Space (Percent of sRGB) (%) | 99 | 100 1% | 91 -8% | 96 -3% | 91 -8% | 100 1% |
| Média Total (Programa/Configurações) | -57% /
-16% | -25% /
-10% | -71% /
-26% | -83% /
-22% | 26% /
4% |
* ... menor é melhor
Exibir tempos de resposta
| ↔ Tempo de resposta preto para branco | ||
|---|---|---|
| 8 ms ... ascensão ↗ e queda ↘ combinadas | ↗ 4 ms ascensão | 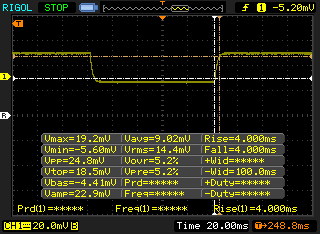 |
| ↘ 4 ms queda | ||
| A tela mostra taxas de resposta rápidas em nossos testes e deve ser adequada para jogos. Em comparação, todos os dispositivos testados variam de 0.1 (mínimo) a 240 (máximo) ms. » 22 % de todos os dispositivos são melhores. Isso significa que o tempo de resposta medido é melhor que a média de todos os dispositivos testados (19.8 ms). | ||
| ↔ Tempo de resposta 50% cinza a 80% cinza | ||
| 3.2 ms ... ascensão ↗ e queda ↘ combinadas | ↗ 1.4 ms ascensão | 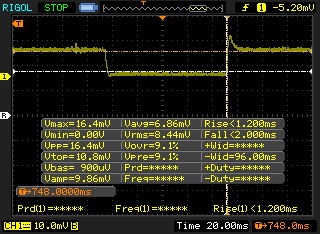 |
| ↘ 1.8 ms queda | ||
| A tela mostra taxas de resposta muito rápidas em nossos testes e deve ser muito adequada para jogos em ritmo acelerado. Em comparação, todos os dispositivos testados variam de 0.165 (mínimo) a 636 (máximo) ms. » 13 % de todos os dispositivos são melhores. Isso significa que o tempo de resposta medido é melhor que a média de todos os dispositivos testados (31 ms). | ||
Cintilação da tela / PWM (modulação por largura de pulso)
| Tela tremeluzindo / PWM não detectado | 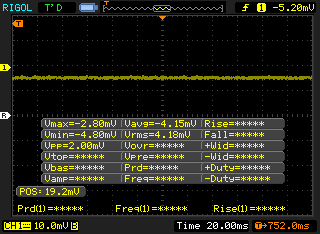 | ||
[pwm_comparison] Em comparação: 52 % de todos os dispositivos testados não usam PWM para escurecer a tela. Se PWM foi detectado, uma média de 7754 (mínimo: 5 - máximo: 343500) Hz foi medida. | |||
Cinebench R15: CPU Multi 64Bit | CPU Single 64Bit
Blender: v2.79 BMW27 CPU
7-Zip 18.03: 7z b 4 -mmt1 | 7z b 4
Geekbench 5.5: Single-Core | Multi-Core
HWBOT x265 Benchmark v2.2: 4k Preset
LibreOffice : 20 Documents To PDF
R Benchmark 2.5: Overall mean
| Cinebench R20 / CPU (Multi Core) | |
| MSI Bravo 15 A4DCR | |
| Asus ROG Strix Scar 15 G532LWS | |
| Eurocom Nightsky RX15 | |
| MSI GE65 Raider 9SF-049US | |
| Média Intel Core i7-10875H (1986 - 4176, n=32) | |
| Alienware m15 R3 P87F | |
| Razer Blade 15 RTX 2070 Super Max-Q | |
| Maingear Vector 15 | |
| Dell G5 15 5590 | |
| Lenovo Legion 5 15IMH05H | |
| Cinebench R20 / CPU (Single Core) | |
| Asus ROG Strix Scar 15 G532LWS | |
| Razer Blade 15 RTX 2070 Super Max-Q | |
| Média Intel Core i7-10875H (430 - 524, n=32) | |
| Eurocom Nightsky RX15 | |
| Alienware m15 R3 P87F | |
| MSI Bravo 15 A4DCR | |
| MSI GE65 Raider 9SF-049US | |
| Lenovo Legion 5 15IMH05H | |
| Maingear Vector 15 | |
| Dell G5 15 5590 | |
| Cinebench R15 / CPU Multi 64Bit | |
| Eurocom Nightsky RX15 | |
| MSI Bravo 15 A4DCR | |
| Asus ROG Strix Scar 15 G532LWS | |
| MSI GE65 Raider 9SF-049US | |
| Média Intel Core i7-10875H (1003 - 1833, n=38) | |
| Razer Blade 15 RTX 2070 Super Max-Q | |
| Alienware m15 R3 P87F | |
| Maingear Vector 15 | |
| Dell G5 15 5590 | |
| Lenovo Legion 5 15IMH05H | |
| Cinebench R15 / CPU Single 64Bit | |
| Asus ROG Strix Scar 15 G532LWS | |
| Média Intel Core i7-10875H (190 - 220, n=37) | |
| Eurocom Nightsky RX15 | |
| Razer Blade 15 RTX 2070 Super Max-Q | |
| Alienware m15 R3 P87F | |
| MSI GE65 Raider 9SF-049US | |
| Lenovo Legion 5 15IMH05H | |
| Maingear Vector 15 | |
| MSI Bravo 15 A4DCR | |
| Dell G5 15 5590 | |
| Blender / v2.79 BMW27 CPU | |
| Eurocom Nightsky RX15 | |
| Lenovo Legion 5 15IMH05H | |
| Razer Blade 15 RTX 2070 Super Max-Q | |
| Média Intel Core i7-10875H (259 - 535, n=30) | |
| Alienware m15 R3 P87F | |
| MSI Bravo 15 A4DCR | |
| Asus ROG Strix Scar 15 G532LWS | |
| 7-Zip 18.03 / 7z b 4 -mmt1 | |
| Asus ROG Strix Scar 15 G532LWS | |
| Eurocom Nightsky RX15 | |
| Média Intel Core i7-10875H (5071 - 5780, n=31) | |
| Razer Blade 15 RTX 2070 Super Max-Q | |
| Lenovo Legion 5 15IMH05H | |
| MSI Bravo 15 A4DCR | |
| Alienware m15 R3 P87F | |
| 7-Zip 18.03 / 7z b 4 | |
| Asus ROG Strix Scar 15 G532LWS | |
| MSI Bravo 15 A4DCR | |
| Eurocom Nightsky RX15 | |
| Média Intel Core i7-10875H (29844 - 49562, n=31) | |
| Razer Blade 15 RTX 2070 Super Max-Q | |
| Alienware m15 R3 P87F | |
| Lenovo Legion 5 15IMH05H | |
| Geekbench 5.5 / Single-Core | |
| Asus ROG Strix Scar 15 G532LWS | |
| Média Intel Core i7-10875H (1233 - 1371, n=29) | |
| Razer Blade 15 RTX 2070 Super Max-Q | |
| Alienware m15 R3 P87F | |
| Lenovo Legion 5 15IMH05H | |
| MSI Bravo 15 A4DCR | |
| Geekbench 5.5 / Multi-Core | |
| Asus ROG Strix Scar 15 G532LWS | |
| Média Intel Core i7-10875H (5715 - 8620, n=29) | |
| MSI Bravo 15 A4DCR | |
| Razer Blade 15 RTX 2070 Super Max-Q | |
| Alienware m15 R3 P87F | |
| Lenovo Legion 5 15IMH05H | |
| HWBOT x265 Benchmark v2.2 / 4k Preset | |
| Asus ROG Strix Scar 15 G532LWS | |
| Eurocom Nightsky RX15 | |
| MSI Bravo 15 A4DCR | |
| Média Intel Core i7-10875H (7.27 - 14.1, n=27) | |
| Alienware m15 R3 P87F | |
| Razer Blade 15 RTX 2070 Super Max-Q | |
| Lenovo Legion 5 15IMH05H | |
| LibreOffice / 20 Documents To PDF | |
| MSI Bravo 15 A4DCR | |
| Alienware m15 R3 P87F | |
| Lenovo Legion 5 15IMH05H | |
| Média Intel Core i7-10875H (30.2 - 84.3, n=30) | |
| Asus ROG Strix Scar 15 G532LWS | |
| Razer Blade 15 RTX 2070 Super Max-Q | |
| R Benchmark 2.5 / Overall mean | |
| Alienware m15 R3 P87F | |
| Lenovo Legion 5 15IMH05H | |
| MSI Bravo 15 A4DCR | |
| Razer Blade 15 RTX 2070 Super Max-Q | |
| Média Intel Core i7-10875H (0.546 - 0.662, n=29) | |
| Asus ROG Strix Scar 15 G532LWS | |
* ... menor é melhor
| PCMark 8 | |
| Home Score Accelerated v2 | |
| Razer Blade 15 RTX 2070 Super Max-Q | |
| Lenovo Legion Y740-15ICHg | |
| Média Intel Core i7-10875H, NVIDIA GeForce RTX 2070 Super Max-Q (4719 - 5840, n=2) | |
| Gigabyte Aero 15 Classic-XA | |
| HP Envy 15-ep0098nr | |
| Work Score Accelerated v2 | |
| Razer Blade 15 RTX 2070 Super Max-Q | |
| Média Intel Core i7-10875H, NVIDIA GeForce RTX 2070 Super Max-Q (6081 - 6825, n=2) | |
| Gigabyte Aero 15 Classic-XA | |
| Lenovo Legion Y740-15ICHg | |
| HP Envy 15-ep0098nr | |
| PCMark 8 Home Score Accelerated v2 | 5840 pontos | |
| PCMark 8 Work Score Accelerated v2 | 6825 pontos | |
| PCMark 10 Score | 6739 pontos | |
Ajuda | ||
| DPC Latencies / LatencyMon - interrupt to process latency (max), Web, Youtube, Prime95 | |
| Aorus 15G XB | |
| MSI GS66 Stealth 10SFS | |
| Razer Blade 15 RTX 2070 Super Max-Q | |
| Asus ROG Strix Scar 15 G532LWS | |
| Alienware m15 R3 P87F | |
| Razer Blade 15 RTX 2080 Super Max-Q | |
| Lenovo Legion 5 15IMH05H | |
| Eluktronics RP-15 | |
* ... menor é melhor
| Razer Blade 15 RTX 2070 Super Max-Q Samsung SSD PM981a MZVLB512HBJQ | MSI GS66 Stealth 10SFS Samsung SSD PM981 MZVLB1T0HALR | Asus Zephyrus S GX502GW 2x Intel SSD 660p SSDPEKNW512G8 (RAID 0) | Gigabyte Aero 15 Classic-XA Intel SSD 760p SSDPEKKW512G8 | Lenovo Legion Y740-15ICHg WDC PC SN520 SDAPMUW-128G | |
|---|---|---|---|---|---|
| AS SSD | 0% | -17% | -12% | -51% | |
| Seq Read (MB/s) | 1957 | 1065 -46% | 2506 28% | 2517 29% | 1372 -30% |
| Seq Write (MB/s) | 2092 | 2360 13% | 1712 -18% | 924 -56% | 746 -64% |
| 4K Read (MB/s) | 50.2 | 48.09 -4% | 48.32 -4% | 59.1 18% | 35.42 -29% |
| 4K Write (MB/s) | 96.5 | 110.7 15% | 103.6 7% | 126.5 31% | 99.9 4% |
| 4K-64 Read (MB/s) | 1594 | 1635 3% | 624 -61% | 876 -45% | 302.1 -81% |
| 4K-64 Write (MB/s) | 2005 | 1829 -9% | 1253 -38% | 922 -54% | 191.4 -90% |
| Access Time Read * (ms) | 0.057 | 0.071 -25% | 0.08 -40% | 0.042 26% | 0.132 -132% |
| Access Time Write * (ms) | 0.112 | 0.034 70% | 0.04 64% | 0.065 42% | 0.037 67% |
| Score Read (Points) | 1840 | 1790 -3% | 923 -50% | 1186 -36% | 475 -74% |
| Score Write (Points) | 2310 | 2176 -6% | 1528 -34% | 1141 -51% | 366 -84% |
| Score Total (Points) | 5103 | 4950 -3% | 2896 -43% | 2870 -44% | 1065 -79% |
| Copy ISO MB/s (MB/s) | 1793 | 2086 16% | 1062 -41% | ||
| Copy Program MB/s (MB/s) | 573 | 454.2 -21% | 426 -26% | ||
| Copy Game MB/s (MB/s) | 1418 | 1141 -20% | 650 -54% | ||
| CrystalDiskMark 5.2 / 6 | -7% | -19% | -14% | -47% | |
| Write 4K (MB/s) | 139.8 | 131.3 -6% | 97 -31% | 115.5 -17% | 134.2 -4% |
| Read 4K (MB/s) | 48.62 | 45.84 -6% | 49.58 2% | 58 19% | 37.72 -22% |
| Write Seq (MB/s) | 2260 | 2370 5% | 1838 -19% | 1555 -31% | 389.2 -83% |
| Read Seq (MB/s) | 2135 | 1509 -29% | 2421 13% | 2590 21% | 1030 -52% |
| Write 4K Q32T1 (MB/s) | 499.3 | 481.5 -4% | 326.9 -35% | 369.3 -26% | 238.9 -52% |
| Read 4K Q32T1 (MB/s) | 552 | 560 1% | 372.9 -32% | 441.7 -20% | 343.9 -38% |
| Write Seq Q32T1 (MB/s) | 2960 | 2392 -19% | 1894 -36% | 1547 -48% | 789 -73% |
| Read Seq Q32T1 (MB/s) | 3269 | 3232 -1% | 2828 -13% | 2969 -9% | 1502 -54% |
| Write 4K Q8T8 (MB/s) | 293.4 | ||||
| Read 4K Q8T8 (MB/s) | 405.8 | ||||
| Média Total (Programa/Configurações) | -4% /
-3% | -18% /
-18% | -13% /
-13% | -49% /
-50% |
* ... menor é melhor

Disk Throttling: DiskSpd Read Loop, Queue Depth 8
| 3DMark 11 | |
| 1280x720 Performance GPU | |
| Asus Strix Scar 17 G732LXS | |
| Asus Zephyrus S17 GX701LXS | |
| Asus ROG Strix RTX 2070 OC | |
| Asus ROG Strix Scar 15 G532LWS | |
| Razer Blade 15 RTX 2070 Super Max-Q | |
| Razer Blade 15 RTX 2080 Super Max-Q | |
| Média NVIDIA GeForce RTX 2070 Super Max-Q (24244 - 28900, n=10) | |
| MSI RTX 2060 Gaming Z 6G | |
| Dell G5 15 SE 5505 P89F | |
| MSI GS66 Stealth 10SE-045 | |
| Maingear Vector 15 | |
| MSI Bravo 17 A4DDR | |
| Asus ROG Strix G15 G512LI | |
| 1280x720 Performance Combined | |
| Asus Strix Scar 17 G732LXS | |
| Asus ROG Strix Scar 15 G532LWS | |
| Média NVIDIA GeForce RTX 2070 Super Max-Q (12819 - 16347, n=9) | |
| Razer Blade 15 RTX 2070 Super Max-Q | |
| Asus Zephyrus S17 GX701LXS | |
| Asus ROG Strix RTX 2070 OC | |
| MSI RTX 2060 Gaming Z 6G | |
| MSI Bravo 17 A4DDR | |
| Dell G5 15 SE 5505 P89F | |
| Asus ROG Strix G15 G512LI | |
| MSI GS66 Stealth 10SE-045 | |
| Maingear Vector 15 | |
| Razer Blade 15 RTX 2080 Super Max-Q | |
| 3DMark 11 Performance | 23678 pontos | |
| 3DMark Cloud Gate Standard Score | 48815 pontos | |
| 3DMark Fire Strike Score | 17915 pontos | |
| 3DMark Time Spy Score | 8052 pontos | |
Ajuda | ||
| Final Fantasy XV Benchmark - 1920x1080 High Quality | |
| Asus Strix Scar 17 G732LXS | |
| Asus ROG Strix RTX 2070 OC | |
| Razer Blade 15 RTX 2070 Super Max-Q | |
| Média NVIDIA GeForce RTX 2070 Super Max-Q (80 - 83.7, n=2) | |
| MSI RTX 2060 Gaming Z 6G | |
| Asus Zephyrus S17 GX701LXS | |
| Gigabyte Aero 15 Classic-XA | |
| HP Envy 15-ep0098nr | |
| Dell G5 15 5590 | |
| MSI Bravo 15 A4DCR | |
| baixo | média | alto | ultra | |
|---|---|---|---|---|
| The Witcher 3 (2015) | 348.3 | 235.4 | 141.4 | 74 |
| Dota 2 Reborn (2015) | 144 | 132 | 127 | 120 |
| Final Fantasy XV Benchmark (2018) | 162 | 110 | 83.7 | |
| X-Plane 11.11 (2018) | 121 | 109 | 90 |
| Razer Blade 15 RTX 2070 Super Max-Q GeForce RTX 2070 Super Max-Q, i7-10875H, Samsung SSD PM981a MZVLB512HBJQ | MSI GS66 Stealth 10SFS GeForce RTX 2070 Super Max-Q, i9-10980HK, Samsung SSD PM981 MZVLB1T0HALR | Asus Zephyrus S GX502GW GeForce RTX 2070 Mobile, i7-9750H, 2x Intel SSD 660p SSDPEKNW512G8 (RAID 0) | Gigabyte Aero 15 Classic-XA GeForce RTX 2070 Max-Q, i7-9750H, Intel SSD 760p SSDPEKKW512G8 | Lenovo Legion Y740-15ICHg GeForce RTX 2070 Max-Q, i7-9750H, WDC PC SN520 SDAPMUW-128G | Razer Blade 15 RTX 2080 Super Max-Q GeForce RTX 2080 Super Max-Q, i7-10875H, Samsung PM981a MZVLB1T0HBLR | |
|---|---|---|---|---|---|---|
| Noise | -16% | -16% | -15% | -3% | -4% | |
| desligado / ambiente * (dB) | 27 | 30 -11% | 30 -11% | 30 -11% | 30 -11% | 30.1 -11% |
| Idle Minimum * (dB) | 27 | 32 -19% | 31 -15% | 31 -15% | 31.3 -16% | 30.1 -11% |
| Idle Average * (dB) | 27 | 34 -26% | 33 -22% | 34 -26% | 31.3 -16% | 30.1 -11% |
| Idle Maximum * (dB) | 27 | 39 -44% | 38 -41% | 39 -44% | 31.3 -16% | 30.1 -11% |
| Load Average * (dB) | 44.7 | 53 -19% | 50 -12% | 46 -3% | 42 6% | 46.8 -5% |
| Witcher 3 ultra * (dB) | 51.2 | 48 6% | 53 -4% | 53 -4% | 42.1 18% | 48.4 5% |
| Load Maximum * (dB) | 54 | 53 2% | 56 -4% | 55 -2% | 46.5 14% | 46 15% |
* ... menor é melhor
Barulho
| Ocioso |
| 27 / 27 / 27 dB |
| Carga |
| 44.7 / 54 dB |
 | ||
30 dB silencioso 40 dB(A) audível 50 dB(A) ruidosamente alto |
||
min: | ||
(-) A temperatura máxima no lado superior é 50 °C / 122 F, em comparação com a média de 40.4 °C / 105 F , variando de 21.2 a 68.8 °C para a classe Gaming.
(-) A parte inferior aquece até um máximo de 52.2 °C / 126 F, em comparação com a média de 43.2 °C / 110 F
(±) Em uso inativo, a temperatura média para o lado superior é 33.3 °C / 92 F, em comparação com a média do dispositivo de 33.9 °C / ### class_avg_f### F.
(-) Jogando The Witcher 3, a temperatura média para o lado superior é 40 °C / 104 F, em comparação com a média do dispositivo de 33.9 °C / ## #class_avg_f### F.
(±) Os apoios para as mãos e o touchpad podem ficar muito quentes ao toque, com um máximo de 38 °C / 100.4 F.
(-) A temperatura média da área do apoio para as mãos de dispositivos semelhantes foi 28.8 °C / 83.8 F (-9.2 °C / -16.6 F).
Razer Blade 15 RTX 2070 Super Max-Q análise de áudio
(+) | os alto-falantes podem tocar relativamente alto (###valor### dB)
Graves 100 - 315Hz
(-) | quase nenhum baixo - em média 16.2% menor que a mediana
(±) | a linearidade dos graves é média (9.4% delta para a frequência anterior)
Médios 400 - 2.000 Hz
(±) | médios mais altos - em média 5.7% maior que a mediana
(+) | médios são lineares (4.8% delta para frequência anterior)
Altos 2 - 16 kHz
(+) | agudos equilibrados - apenas 3.6% longe da mediana
(+) | os máximos são lineares (3.2% delta da frequência anterior)
Geral 100 - 16.000 Hz
(±) | a linearidade do som geral é média (15.5% diferença em relação à mediana)
Comparado com a mesma classe
» 35% de todos os dispositivos testados nesta classe foram melhores, 7% semelhantes, 58% piores
» O melhor teve um delta de 6%, a média foi 18%, o pior foi 132%
Comparado com todos os dispositivos testados
» 23% de todos os dispositivos testados foram melhores, 4% semelhantes, 73% piores
» O melhor teve um delta de 4%, a média foi 23%, o pior foi 134%
Apple MacBook 12 (Early 2016) 1.1 GHz análise de áudio
(+) | os alto-falantes podem tocar relativamente alto (###valor### dB)
Graves 100 - 315Hz
(±) | graves reduzidos - em média 11.3% menor que a mediana
(±) | a linearidade dos graves é média (14.2% delta para a frequência anterior)
Médios 400 - 2.000 Hz
(+) | médios equilibrados - apenas 2.4% longe da mediana
(+) | médios são lineares (5.5% delta para frequência anterior)
Altos 2 - 16 kHz
(+) | agudos equilibrados - apenas 2% longe da mediana
(+) | os máximos são lineares (4.5% delta da frequência anterior)
Geral 100 - 16.000 Hz
(+) | o som geral é linear (10.2% diferença em relação à mediana)
Comparado com a mesma classe
» 7% de todos os dispositivos testados nesta classe foram melhores, 2% semelhantes, 90% piores
» O melhor teve um delta de 5%, a média foi 18%, o pior foi 53%
Comparado com todos os dispositivos testados
» 5% de todos os dispositivos testados foram melhores, 1% semelhantes, 94% piores
» O melhor teve um delta de 4%, a média foi 23%, o pior foi 134%
| desligado | |
| Ocioso | |
| Carga |
|
Key:
min: | |
| Razer Blade 15 RTX 2070 Super Max-Q i7-10875H, GeForce RTX 2070 Super Max-Q, Samsung SSD PM981a MZVLB512HBJQ, IPS, 1920x1080, 15.6" | MSI GS66 Stealth 10SFS i9-10980HK, GeForce RTX 2070 Super Max-Q, Samsung SSD PM981 MZVLB1T0HALR, IPS, 1920x1080, 15.6" | Asus Zephyrus S GX502GW i7-9750H, GeForce RTX 2070 Mobile, 2x Intel SSD 660p SSDPEKNW512G8 (RAID 0), IPS, 1920x1080, 15.6" | Gigabyte Aero 15 Classic-XA i7-9750H, GeForce RTX 2070 Max-Q, Intel SSD 760p SSDPEKKW512G8, IGZO, 1920x1080, 15.6" | Lenovo Legion Y740-15ICHg i7-9750H, GeForce RTX 2070 Max-Q, WDC PC SN520 SDAPMUW-128G, IPS, 1920x1080, 15.6" | Razer Blade 15 RTX 2080 Super Max-Q i7-10875H, GeForce RTX 2080 Super Max-Q, Samsung PM981a MZVLB1T0HBLR, IPS, 1920x1080, 15.6" | |
|---|---|---|---|---|---|---|
| Power Consumption | 11% | -17% | -2% | -2% | 24% | |
| Idle Minimum * (Watt) | 14.3 | 13 9% | 24 -68% | 21 -47% | 22.2 -55% | 10.6 26% |
| Idle Average * (Watt) | 22.3 | 16 28% | 27 -21% | 23 -3% | 24.9 -12% | 13.1 41% |
| Idle Maximum * (Watt) | 36.9 | 27 27% | 33 11% | 32 13% | 30.6 17% | 15.8 57% |
| Load Average * (Watt) | 118.4 | 109 8% | 129 -9% | 97 18% | 101 15% | 131 -11% |
| Witcher 3 ultra * (Watt) | 153.7 | 155 -1% | 176 -15% | 148 4% | 143 7% | 146 5% |
| Load Maximum * (Watt) | 220.8 | 236 -7% | 216 2% | 213 4% | 186 16% | 169 23% |
* ... menor é melhor
| Razer Blade 15 RTX 2070 Super Max-Q i7-10875H, GeForce RTX 2070 Super Max-Q, 80 Wh | MSI GS66 Stealth 10SFS i9-10980HK, GeForce RTX 2070 Super Max-Q, 99.99 Wh | Asus Zephyrus S GX502GW i7-9750H, GeForce RTX 2070 Mobile, 76 Wh | Gigabyte Aero 15 Classic-XA i7-9750H, GeForce RTX 2070 Max-Q, 94.24 Wh | Lenovo Legion Y740-15ICHg i7-9750H, GeForce RTX 2070 Max-Q, 57 Wh | HP Envy 15-ep0098nr i7-10750H, GeForce RTX 2060 Max-Q, 83 Wh | |
|---|---|---|---|---|---|---|
| Duração da bateria | -3% | -41% | 11% | -52% | -5% | |
| WiFi v1.3 (h) | 6.3 | 6.1 -3% | 3.7 -41% | 7 11% | 3 -52% | 6 -5% |
| Reader / Idle (h) | 8.4 | 5.9 | 9.1 | 15 | ||
| Load (h) | 1.7 | 1 | 3 | 1.6 |
Pro
Contra
Atualizar da configuração GeForce RTX 2070 Super Max-Q para a configuração GeForce RTX 2080 Super Max-Q trará cerca de 15 por cento a mais de desempenho sem afetar a vida útil da bateria, ruído do ventilador, consumo de energia ou temperatura, de forma significativa. É uma diferença de $ 400 entre esses dois SKUs, entretanto, então os usuários devem decidir cuidadosamente se eles acham que o aumento nos gráficos valeria o investimento extra em relação à nossa opção GeForce RTX 2070 Super Max-Q mais barata.
Quando tudo estiver dito e feito, a GeForce RTX 2070 Super Max-Q tem um desempenho mais semelhante a uma GeForce RTX 2060 de desktop comum, mas em um atraente portátil. Este continua sendo um dos melhores portáteis para jogos ultrafinos que você pode obter no momento em termos de desempenho e design visual, mesmo depois de levar em consideração as mesmas desvantagens que vimos nos anos anteriores. Se você não quer gastar muito no último Blade 15, a GeForce RTX 2070 Super Max-Q não é muito diferente da GeForce RTX 2070 Max-Q mais antiga e mais barata.
Razer Blade 15 RTX 2070 Super Max-Q
- 08/19/2020 v7 (old)
Allen Ngo
Price comparison
