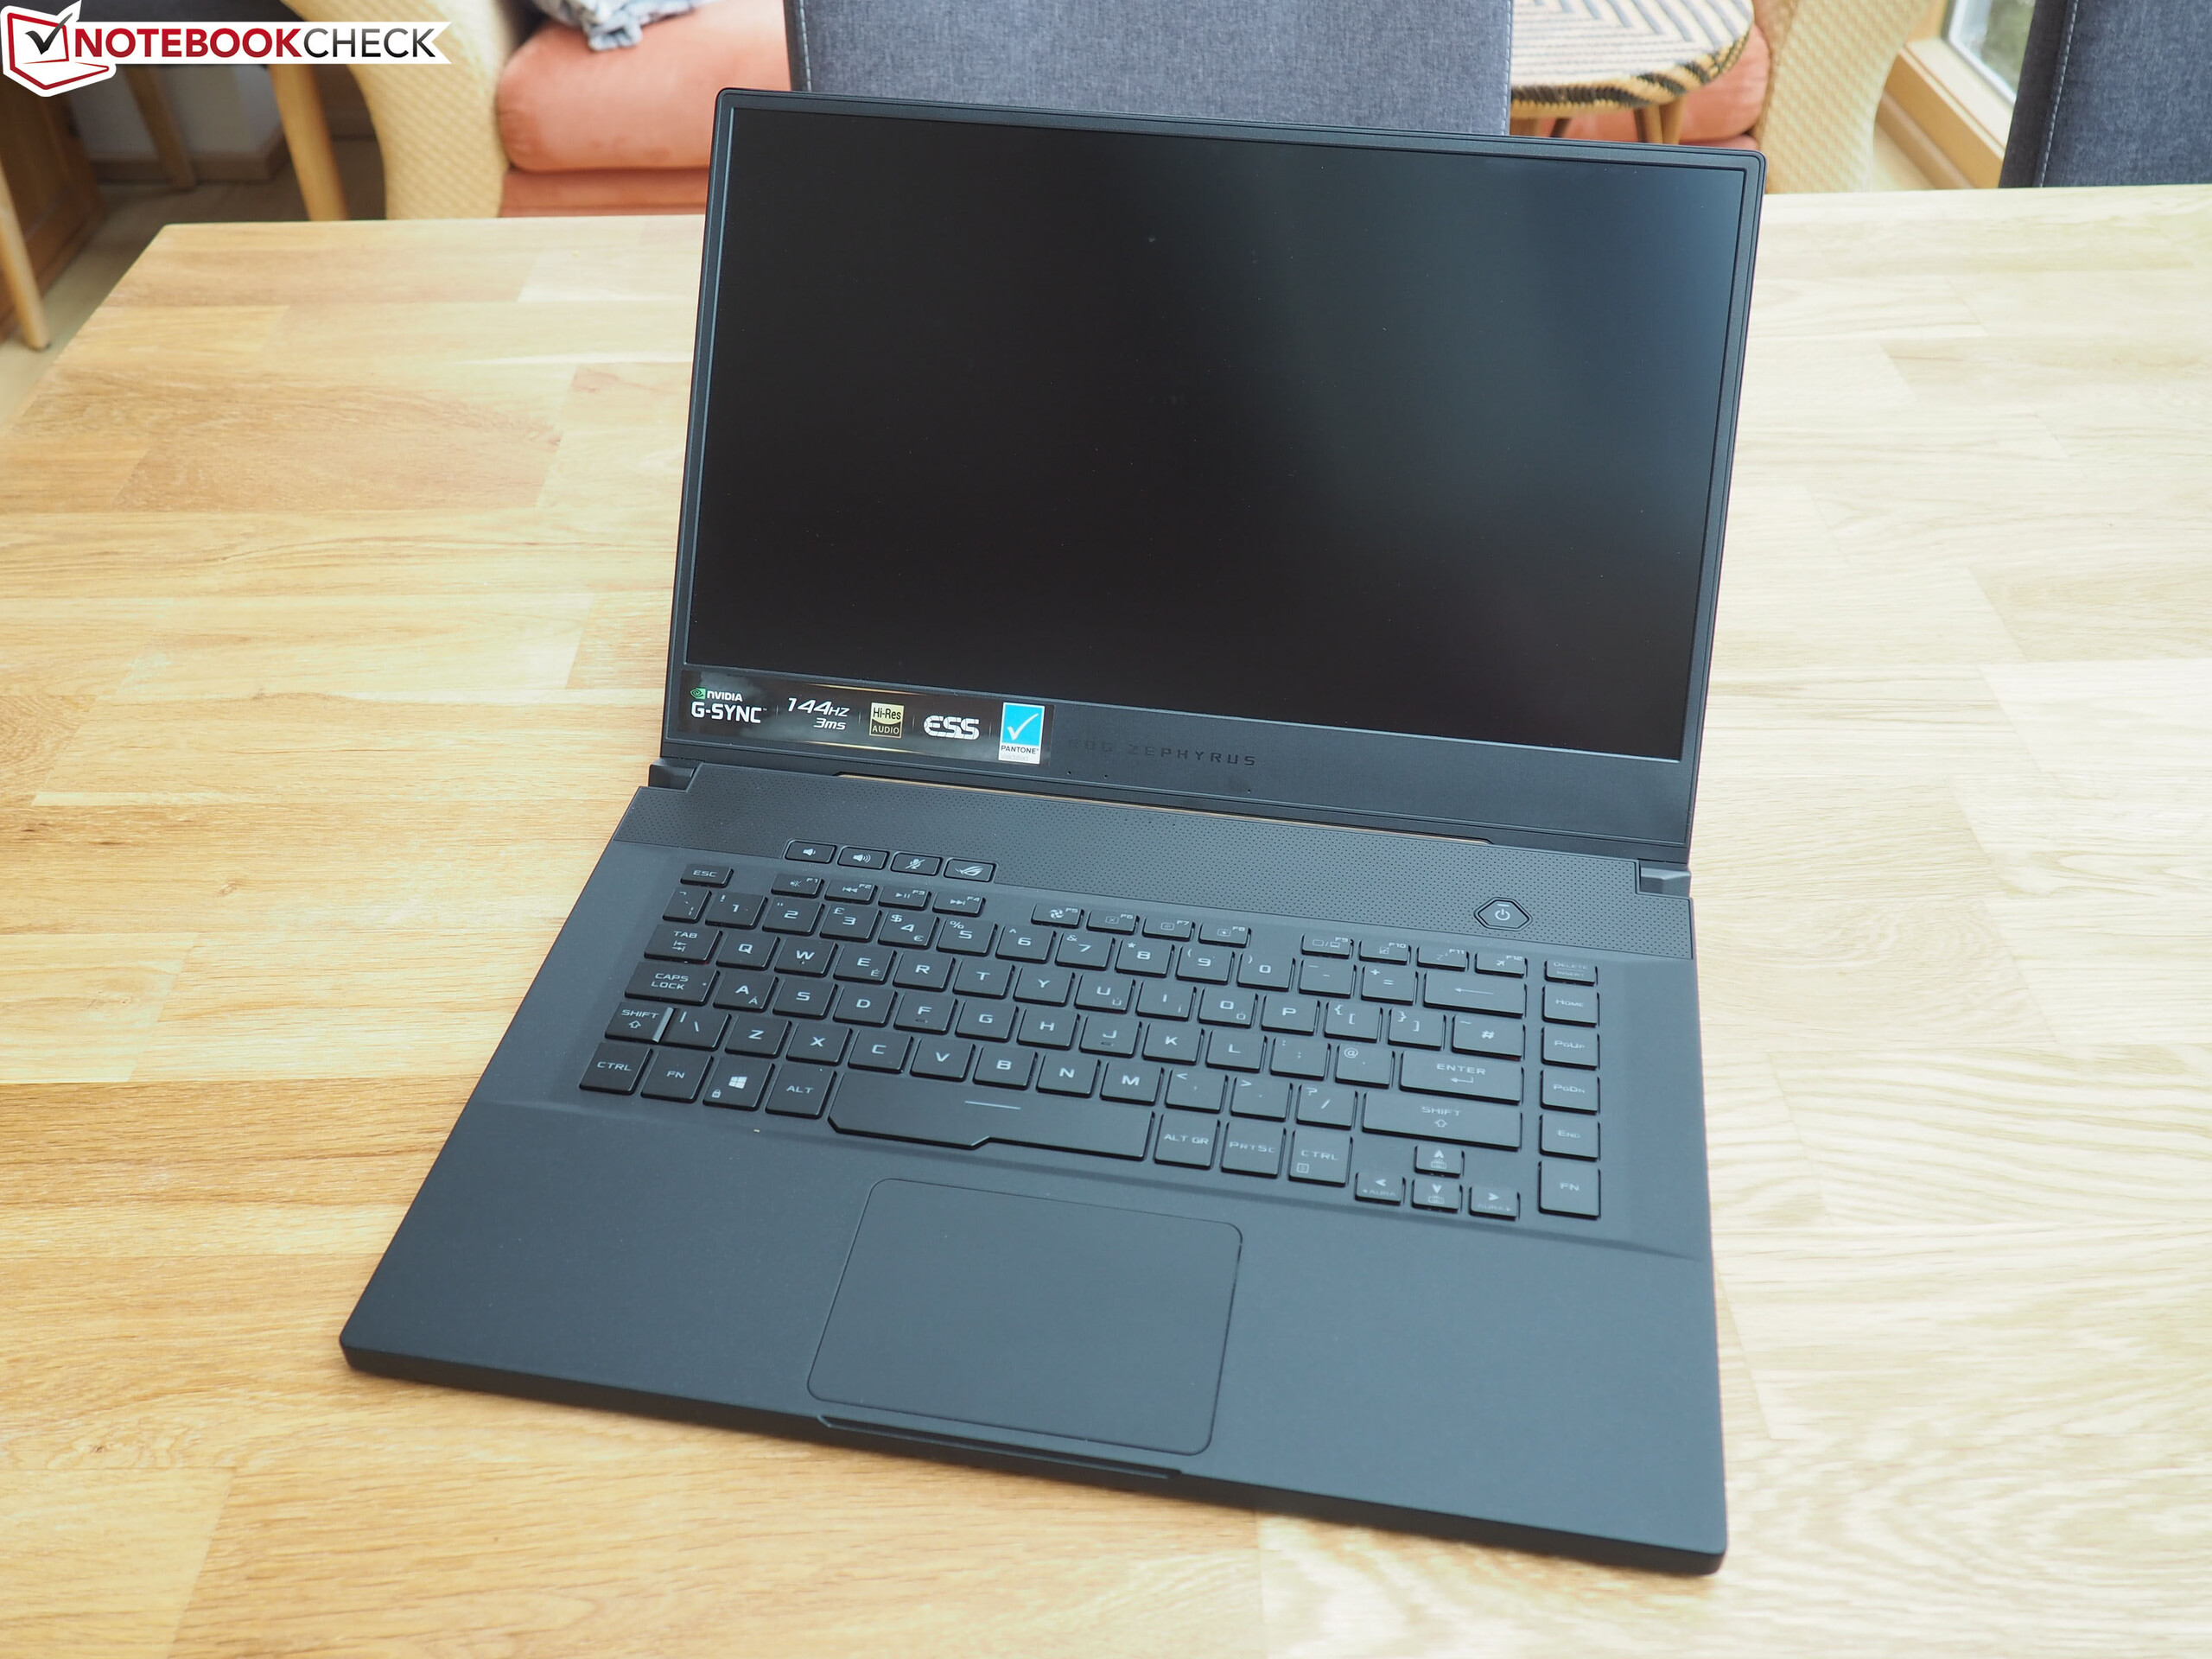
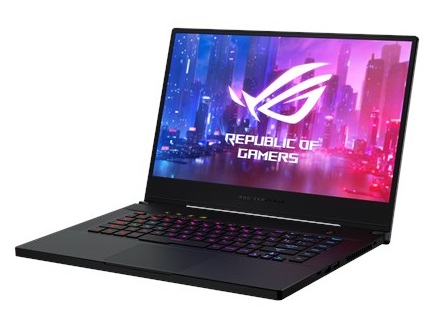
Breve Análise do Portátil ASUS ROG Zephyrus S GX502GW (Core i7-9750H, RTX 2070)
| |||||||||||||||||||||||||
iluminação: 90 %
iluminação com acumulador: 286 cd/m²
Contraste: 773:1 (Preto: 0.37 cd/m²)
ΔE ColorChecker Calman: 2.19 | ∀{0.5-29.43 Ø4.71}
calibrated: 2.27
ΔE Greyscale Calman: 2.2 | ∀{0.09-98 Ø4.96}
91% sRGB (Argyll 1.6.3 3D)
59% AdobeRGB 1998 (Argyll 1.6.3 3D)
65.9% AdobeRGB 1998 (Argyll 3D)
91% sRGB (Argyll 3D)
64.9% Display P3 (Argyll 3D)
Gamma: 2.41
CCT: 6405 K
| Asus Zephyrus S GX502GW AU Optronics B156HAN08.2 (AUO82ED), IPS, 1920x1080 | Asus Zephyrus S GX531GX AU Optronics B156HAN08.2, IPS, 1920x1080 | Acer Predator Triton 500 AU Optronics B156HAN08.2 (AUO82ED), IPS, 1920x1080 | Razer Blade 15 RTX 2070 Max-Q LG Philips LGD05C0, IPS, 1920x1080 | Gigabyte Aero 15-X9 LGD05C0, IPS, 1920x1080 | |
|---|---|---|---|---|---|
| Display | 1% | 0% | 2% | -1% | |
| Display P3 Coverage (%) | 64.9 | 65.6 1% | 64.2 -1% | 65.3 1% | 63.5 -2% |
| sRGB Coverage (%) | 91 | 92.2 1% | 92.6 2% | 94.9 4% | 93.1 2% |
| AdobeRGB 1998 Coverage (%) | 65.9 | 66.9 2% | 65.7 0% | 66.3 1% | 64.5 -2% |
| Response Times | -3% | -19% | -83% | -92% | |
| Response Time Grey 50% / Grey 80% * (ms) | 7.2 ? | 7 ? 3% | 8 ? -11% | 16.8 ? -133% | 16.4 ? -128% |
| Response Time Black / White * (ms) | 8.8 ? | 9.6 ? -9% | 11.2 ? -27% | 11.6 ? -32% | 13.6 ? -55% |
| PWM Frequency (Hz) | |||||
| Screen | -3% | -24% | -2% | 12% | |
| Brightness middle (cd/m²) | 286 | 323.6 13% | 304 6% | 314.7 10% | 250 -13% |
| Brightness (cd/m²) | 275 | 315 15% | 299 9% | 312 13% | 235 -15% |
| Brightness Distribution (%) | 90 | 91 1% | 89 -1% | 90 0% | 85 -6% |
| Black Level * (cd/m²) | 0.37 | 0.29 22% | 0.27 27% | 0.38 -3% | 0.29 22% |
| Contrast (:1) | 773 | 1116 44% | 1126 46% | 828 7% | 862 12% |
| Colorchecker dE 2000 * | 2.19 | 3.31 -51% | 4.66 -113% | 2.56 -17% | 1.46 33% |
| Colorchecker dE 2000 max. * | 4.4 | 5.74 -30% | 9.65 -119% | 4.89 -11% | 2.47 44% |
| Colorchecker dE 2000 calibrated * | 2.27 | 2.73 -20% | 1.72 24% | 1.71 25% | |
| Greyscale dE 2000 * | 2.2 | 2.9 -32% | 5.53 -151% | 3.4 -55% | 1.27 42% |
| Gamma | 2.41 91% | 2.29 96% | 2.5 88% | 2.3 96% | 2.4 92% |
| CCT | 6405 101% | 6765 96% | 8028 81% | 6435 101% | 6749 96% |
| Color Space (Percent of AdobeRGB 1998) (%) | 59 | 59.7 1% | 60 2% | 60.7 3% | 60 2% |
| Color Space (Percent of sRGB) (%) | 91 | 91.8 1% | 93 2% | 94.6 4% | 93 2% |
| Média Total (Programa/Configurações) | -2% /
-2% | -14% /
-19% | -28% /
-11% | -27% /
-4% |
* ... menor é melhor
Exibir tempos de resposta
| ↔ Tempo de resposta preto para branco | ||
|---|---|---|
| 8.8 ms ... ascensão ↗ e queda ↘ combinadas | ↗ 4.4 ms ascensão | 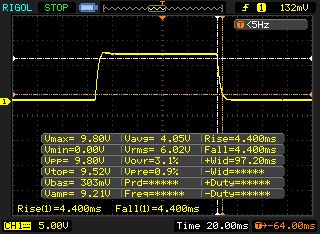 |
| ↘ 4.4 ms queda | ||
| A tela mostra taxas de resposta rápidas em nossos testes e deve ser adequada para jogos. Em comparação, todos os dispositivos testados variam de 0.1 (mínimo) a 240 (máximo) ms. » 25 % de todos os dispositivos são melhores. Isso significa que o tempo de resposta medido é melhor que a média de todos os dispositivos testados (19.8 ms). | ||
| ↔ Tempo de resposta 50% cinza a 80% cinza | ||
| 7.2 ms ... ascensão ↗ e queda ↘ combinadas | ↗ 3.8 ms ascensão | 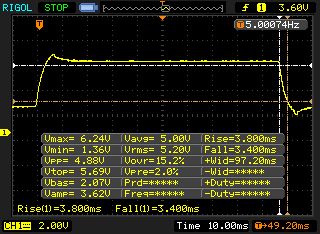 |
| ↘ 3.4 ms queda | ||
| A tela mostra taxas de resposta muito rápidas em nossos testes e deve ser muito adequada para jogos em ritmo acelerado. Em comparação, todos os dispositivos testados variam de 0.165 (mínimo) a 636 (máximo) ms. » 20 % de todos os dispositivos são melhores. Isso significa que o tempo de resposta medido é melhor que a média de todos os dispositivos testados (30.9 ms). | ||
Cintilação da tela / PWM (modulação por largura de pulso)
| Tela tremeluzindo / PWM não detectado | 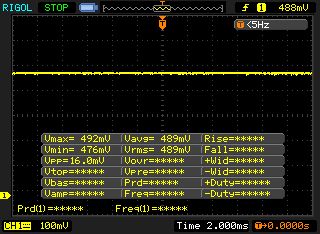 | ||
[pwm_comparison] Em comparação: 52 % de todos os dispositivos testados não usam PWM para escurecer a tela. Se PWM foi detectado, uma média de 7744 (mínimo: 5 - máximo: 343500) Hz foi medida. | |||
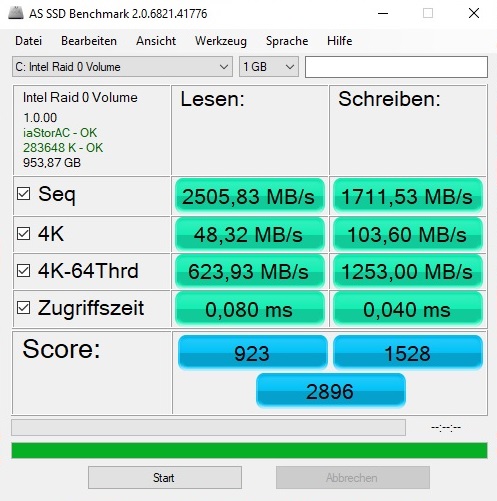
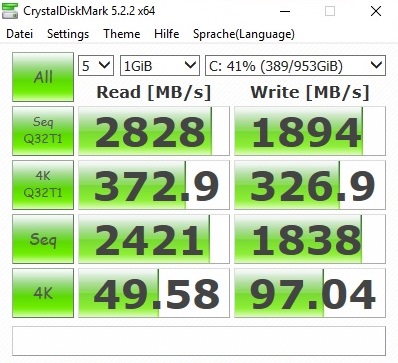
| Asus Zephyrus S GX502GW 2x Intel SSD 660p SSDPEKNW512G8 (RAID 0) | Asus Zephyrus S GX531GX Intel SSD 660p SSDPEKNW512G8 | Acer Predator Triton 500 2x WDC PC SN720 SDAPNTW-256G-1014 (RAID 0) | Razer Blade 15 RTX 2070 Max-Q Samsung SSD PM981 MZVLB512HAJQ | Gigabyte Aero 15-X9 Intel SSD 760p SSDPEKKW010T8 | |
|---|---|---|---|---|---|
| CrystalDiskMark 5.2 / 6 | -29% | 7% | -10% | -11% | |
| Write 4K (MB/s) | 97 | 93.9 -3% | 93.6 -4% | 93.9 -3% | 97.1 0% |
| Read 4K (MB/s) | 49.58 | 46.29 -7% | 38.82 -22% | 40.56 -18% | 53.7 8% |
| Write Seq (MB/s) | 1838 | 974 -47% | 2455 34% | 1468 -20% | 1526 -17% |
| Read Seq (MB/s) | 2421 | 1425 -41% | 2107 -13% | 1540 -36% | 2020 -17% |
| Write 4K Q32T1 (MB/s) | 326.9 | 259.4 -21% | 298.7 -9% | 293.5 -10% | 285.6 -13% |
| Read 4K Q32T1 (MB/s) | 372.9 | 296.5 -20% | 338.7 -9% | 346 -7% | 321.8 -14% |
| Write Seq Q32T1 (MB/s) | 1894 | 977 -48% | 2902 53% | 1941 2% | 1533 -19% |
| Read Seq Q32T1 (MB/s) | 2828 | 1666 -41% | 3536 25% | 3266 15% | 2351 -17% |

| 3DMark 11 Performance | 18686 pontos | |
| 3DMark Cloud Gate Standard Score | 30754 pontos | |
| 3DMark Fire Strike Score | 16290 pontos | |
| 3DMark Time Spy Score | 6890 pontos | |
Ajuda | ||
| The Witcher 3 - 1920x1080 Ultra Graphics & Postprocessing (HBAO+) | |
| Média da turma Gaming (104.7 - 240, n=7, últimos 2 anos) | |
| Asus Zephyrus S GX531GX | |
| Acer Predator Triton 500 | |
| Asus Zephyrus S GX502GW | |
| Razer Blade 15 RTX 2070 Max-Q | |
| Gigabyte Aero 15-X9 | |
| baixo | média | alto | ultra | |
|---|---|---|---|---|
| The Witcher 3 (2015) | 130 | 70.2 | ||
| Shadow of the Tomb Raider (2018) | 91.3 | 86 | 80.3 | 74.2 |
| Apex Legends (2019) | 128 | 126 | ||
| Far Cry New Dawn (2019) | 91 | 83 | ||
| Metro Exodus (2019) | 91.1 | 82.6 | 66.3 | 54.6 |
| Anthem (2019) | 84 | 79 | ||
| Dirt Rally 2.0 (2019) | 121 | 75 | ||
| The Division 2 (2019) | 121 | 111 | 94 | 73 |
| Anno 1800 (2019) | 76.8 | 39.5 | ||
| Rage 2 (2019) | 180 | 122 | 103 | 101 |
| Control (2019) | 152 | 90 | 68 | |
| Borderlands 3 (2019) | 94 | 84 | 71 | 61 |
Barulho
| Ocioso |
| 31 / 33 / 38 dB |
| Carga |
| 50 / 56 dB |
 | ||
30 dB silencioso 40 dB(A) audível 50 dB(A) ruidosamente alto |
||
min: | ||
| Asus Zephyrus S GX502GW GeForce RTX 2070 Mobile, i7-9750H | Asus Zephyrus S GX531GX GeForce RTX 2080 Max-Q, i7-8750H | Acer Predator Triton 500 GeForce RTX 2080 Max-Q, i7-8750H | Razer Blade 15 RTX 2070 Max-Q GeForce RTX 2070 Max-Q, i7-8750H | Gigabyte Aero 15-X9 GeForce RTX 2070 Max-Q, i7-8750H | Média da turma Gaming | |
|---|---|---|---|---|---|---|
| Noise | 4% | 9% | 17% | 7% | 15% | |
| desligado / ambiente * (dB) | 30 | 28.7 4% | 29 3% | 28.8 4% | 30 -0% | 24.1 ? 20% |
| Idle Minimum * (dB) | 31 | 29.8 4% | 30 3% | 28.8 7% | 32 -3% | 25.9 ? 16% |
| Idle Average * (dB) | 33 | 32.4 2% | 32 3% | 28.8 13% | 34 -3% | 27.4 ? 17% |
| Idle Maximum * (dB) | 38 | 38 -0% | 34 11% | 29.4 23% | 36 5% | 30.1 ? 21% |
| Load Average * (dB) | 50 | 38.2 24% | 44 12% | 35.7 29% | 42 16% | 43.7 ? 13% |
| Witcher 3 ultra * (dB) | 53 | 56.6 -7% | 46 13% | 42.5 20% | 44 17% | |
| Load Maximum * (dB) | 56 | 56.6 -1% | 47 16% | 45 20% | 48 14% | 54.3 ? 3% |
* ... menor é melhor
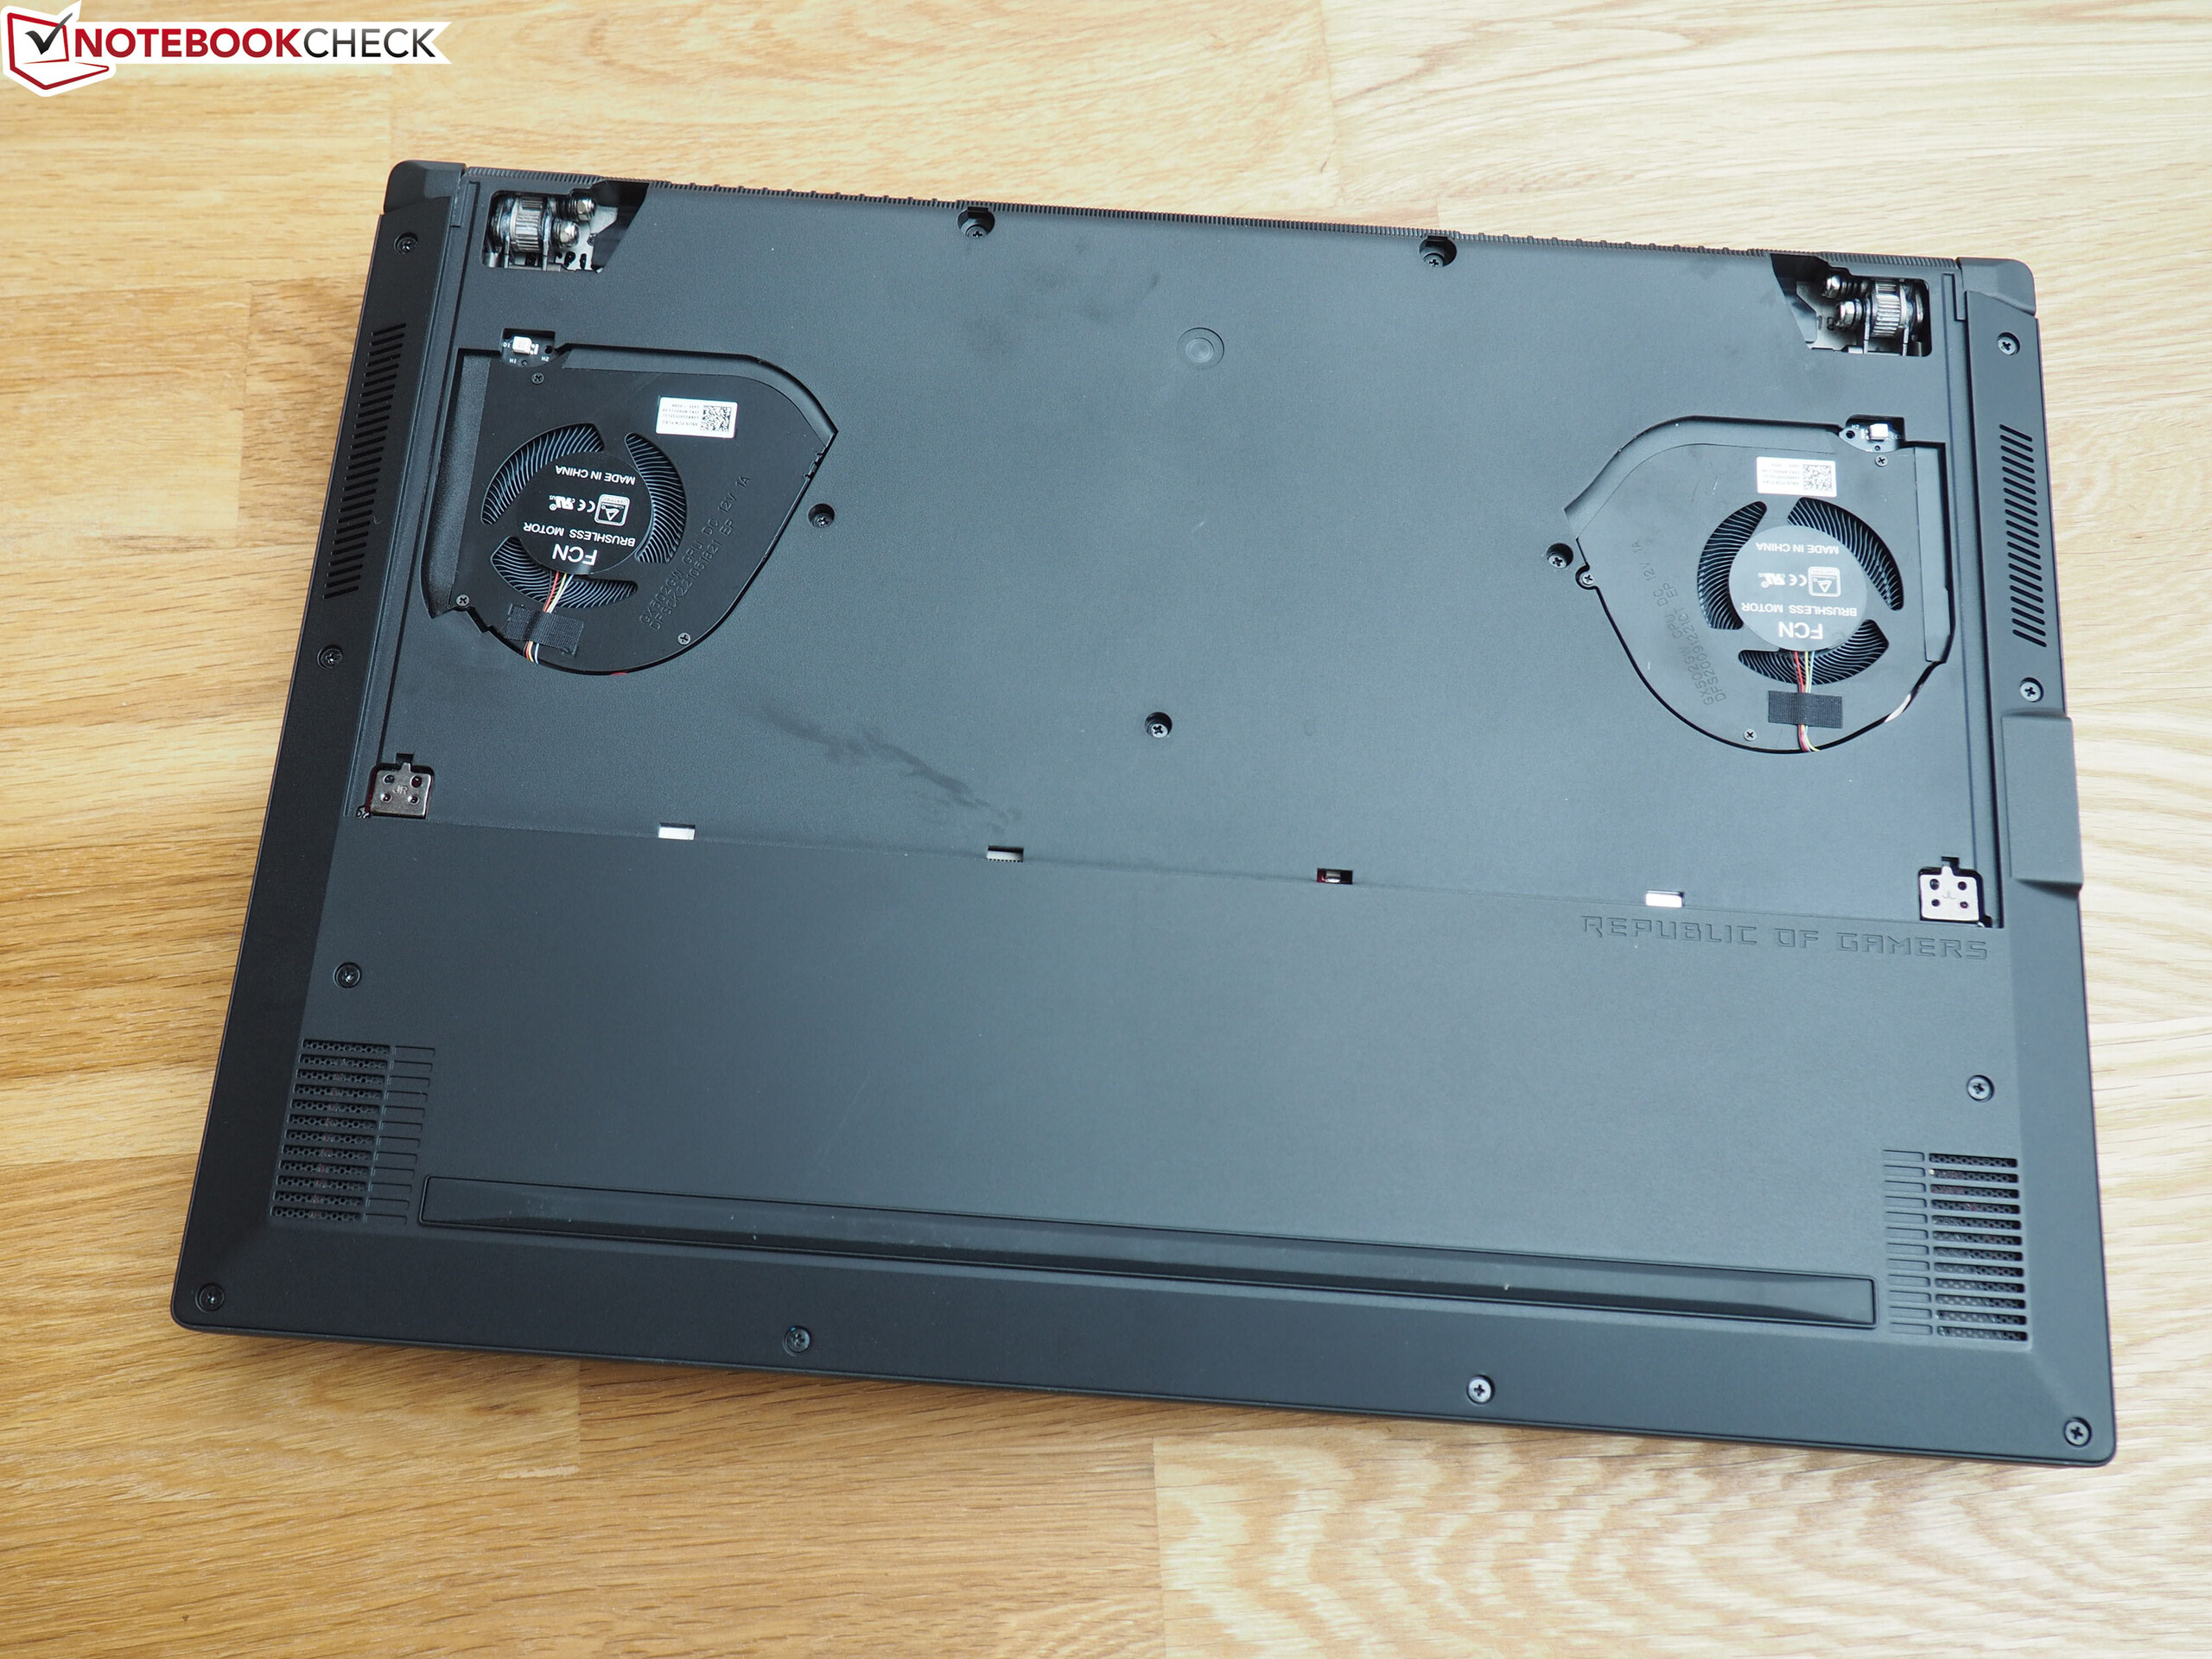
(-) A temperatura máxima no lado superior é 54 °C / 129 F, em comparação com a média de 40.4 °C / 105 F , variando de 21.2 a 68.8 °C para a classe Gaming.
(-) A parte inferior aquece até um máximo de 47 °C / 117 F, em comparação com a média de 43.2 °C / 110 F
(+) Em uso inativo, a temperatura média para o lado superior é 31.2 °C / 88 F, em comparação com a média do dispositivo de 33.9 °C / ### class_avg_f### F.
(-) Jogando The Witcher 3, a temperatura média para o lado superior é 44.1 °C / 111 F, em comparação com a média do dispositivo de 33.9 °C / ## #class_avg_f### F.
(±) Os apoios para as mãos e o touchpad podem ficar muito quentes ao toque, com um máximo de 38 °C / 100.4 F.
(-) A temperatura média da área do apoio para as mãos de dispositivos semelhantes foi 28.8 °C / 83.8 F (-9.2 °C / -16.6 F).
| Asus Zephyrus S GX502GW GeForce RTX 2070 Mobile, i7-9750H | Asus Zephyrus S GX531GX GeForce RTX 2080 Max-Q, i7-8750H | Acer Predator Triton 500 GeForce RTX 2080 Max-Q, i7-8750H | Razer Blade 15 RTX 2070 Max-Q GeForce RTX 2070 Max-Q, i7-8750H | Gigabyte Aero 15-X9 GeForce RTX 2070 Max-Q, i7-8750H | Média da turma Gaming | |
|---|---|---|---|---|---|---|
| Heat | 6% | -3% | 12% | -1% | 5% | |
| Maximum Upper Side * (°C) | 54 | 47 13% | 49 9% | 49 9% | 56 -4% | 45.1 ? 16% |
| Maximum Bottom * (°C) | 47 | 48.6 -3% | 58 -23% | 49 -4% | 66 -40% | 48.1 ? -2% |
| Idle Upper Side * (°C) | 33 | 28.8 13% | 33 -0% | 25.4 23% | 27 18% | 31 ? 6% |
| Idle Bottom * (°C) | 34 | 33.2 2% | 33 3% | 27.2 20% | 27 21% | 34.2 ? -1% |
* ... menor é melhor
Asus Zephyrus S GX502GW análise de áudio
(+) | os alto-falantes podem tocar relativamente alto (###valor### dB)
Graves 100 - 315Hz
(±) | graves reduzidos - em média 12.7% menor que a mediana
(±) | a linearidade dos graves é média (8.5% delta para a frequência anterior)
Médios 400 - 2.000 Hz
(+) | médios equilibrados - apenas 4.5% longe da mediana
(+) | médios são lineares (4.1% delta para frequência anterior)
Altos 2 - 16 kHz
(±) | máximos mais altos - em média 6.7% maior que a mediana
(±) | a linearidade dos máximos é média (10.8% delta para frequência anterior)
Geral 100 - 16.000 Hz
(+) | o som geral é linear (14.6% diferença em relação à mediana)
Comparado com a mesma classe
» 28% de todos os dispositivos testados nesta classe foram melhores, 8% semelhantes, 65% piores
» O melhor teve um delta de 6%, a média foi 18%, o pior foi 132%
Comparado com todos os dispositivos testados
» 19% de todos os dispositivos testados foram melhores, 4% semelhantes, 77% piores
» O melhor teve um delta de 4%, a média foi 23%, o pior foi 134%
Asus Zephyrus S GX531GX análise de áudio
(±) | o volume do alto-falante é médio, mas bom (###valor### dB)
Graves 100 - 315Hz
(±) | graves reduzidos - em média 13.3% menor que a mediana
(±) | a linearidade dos graves é média (14.9% delta para a frequência anterior)
Médios 400 - 2.000 Hz
(+) | médios equilibrados - apenas 1.9% longe da mediana
(+) | médios são lineares (5.2% delta para frequência anterior)
Altos 2 - 16 kHz
(±) | máximos mais altos - em média 5.6% maior que a mediana
(±) | a linearidade dos máximos é média (10.8% delta para frequência anterior)
Geral 100 - 16.000 Hz
(±) | a linearidade do som geral é média (18.3% diferença em relação à mediana)
Comparado com a mesma classe
» 58% de todos os dispositivos testados nesta classe foram melhores, 9% semelhantes, 33% piores
» O melhor teve um delta de 6%, a média foi 18%, o pior foi 132%
Comparado com todos os dispositivos testados
» 40% de todos os dispositivos testados foram melhores, 8% semelhantes, 52% piores
» O melhor teve um delta de 4%, a média foi 23%, o pior foi 134%
| desligado | |
| Ocioso | |
| Carga |
|
Key:
min: | |
| Asus Zephyrus S GX502GW GeForce RTX 2070 Mobile, i7-9750H | Asus Zephyrus S GX531GX GeForce RTX 2080 Max-Q, i7-8750H | Acer Predator Triton 500 GeForce RTX 2080 Max-Q, i7-8750H | Razer Blade 15 RTX 2070 Max-Q GeForce RTX 2070 Max-Q, i7-8750H | Gigabyte Aero 15-X9 GeForce RTX 2070 Max-Q, i7-8750H | Média da turma Gaming | |
|---|---|---|---|---|---|---|
| Power Consumption | 18% | 20% | 36% | 31% | 19% | |
| Idle Minimum * (Watt) | 24 | 16.1 33% | 16 33% | 10.4 57% | 16 33% | 13.1 ? 45% |
| Idle Average * (Watt) | 27 | 20.9 23% | 22 19% | 14.6 46% | 18 33% | 19 ? 30% |
| Idle Maximum * (Watt) | 33 | 27 18% | 32 3% | 16.3 51% | 23 30% | 24.6 ? 25% |
| Load Average * (Watt) | 129 | 93.4 28% | 89 31% | 88.5 31% | 88 32% | 111.3 ? 14% |
| Witcher 3 ultra * (Watt) | 176 | 168.2 4% | 147 16% | 155.4 12% | 120 32% | |
| Load Maximum * (Watt) | 216 | 215.3 -0% | 173 20% | 182.4 16% | 167 23% | 260 ? -20% |
* ... menor é melhor
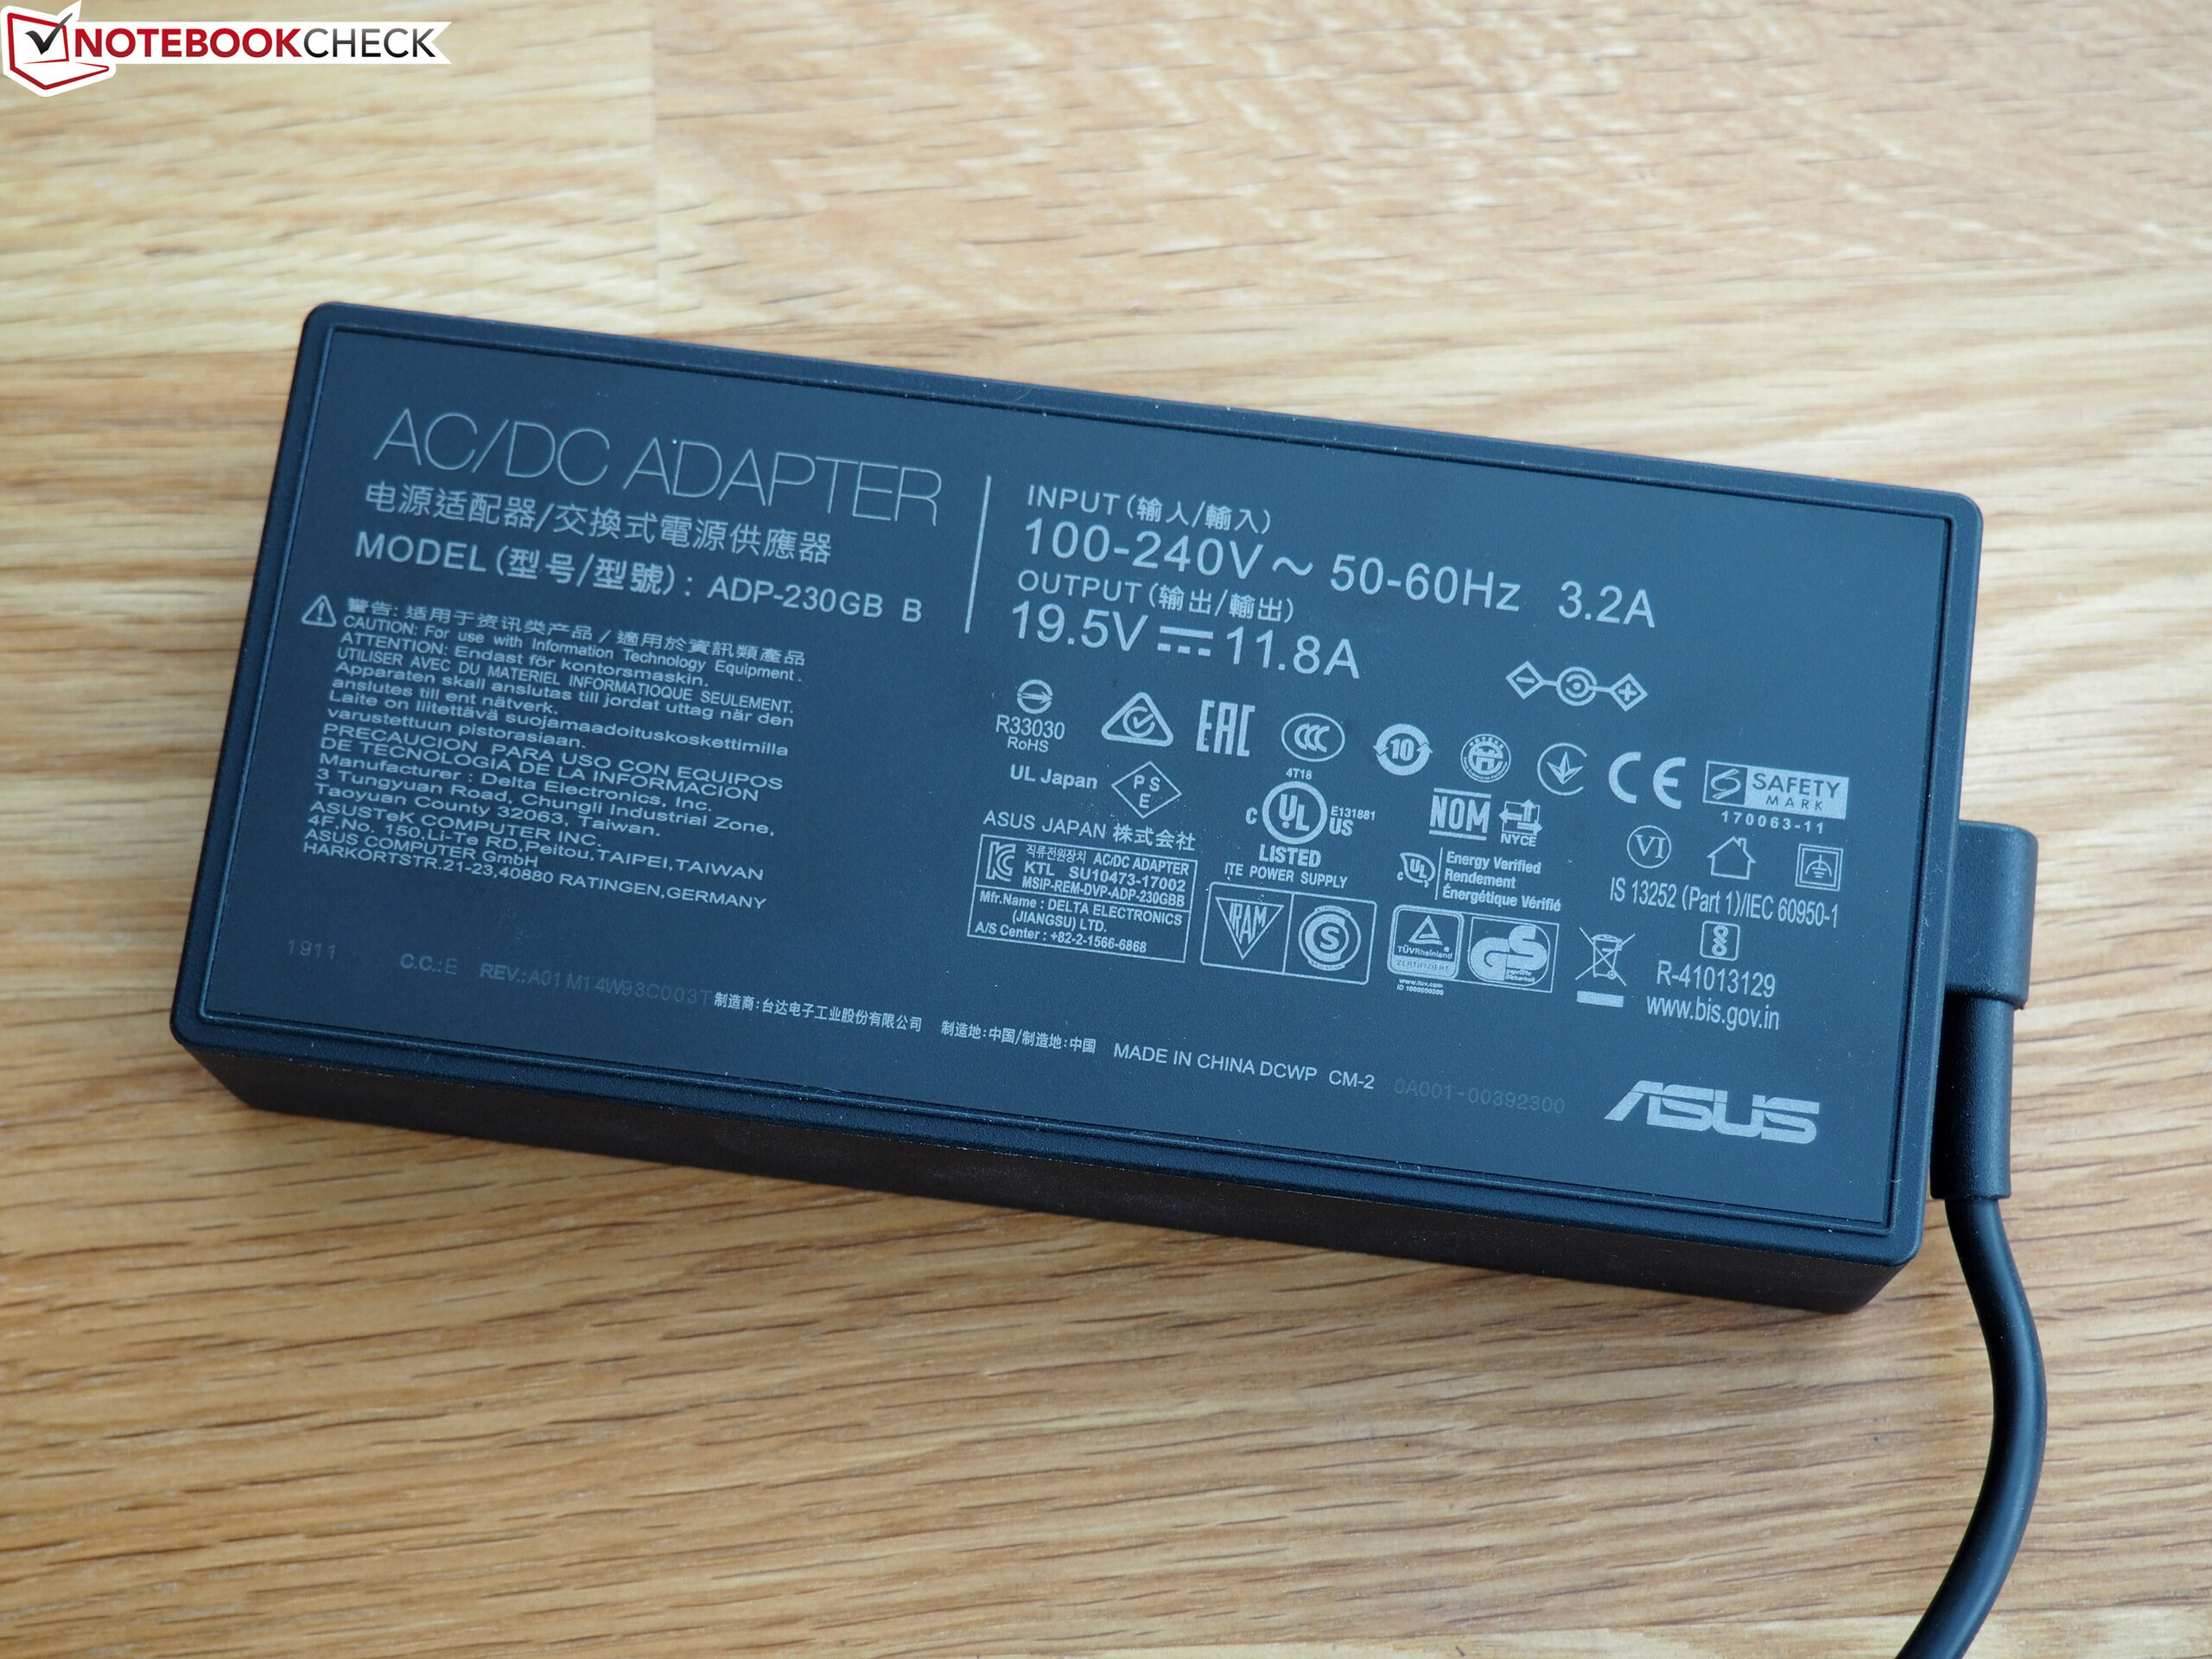
| Asus Zephyrus S GX502GW GeForce RTX 2070 Mobile, i7-9750H, 76 Wh | Asus Zephyrus S GX531GX GeForce RTX 2080 Max-Q, i7-8750H, 50 Wh | Acer Predator Triton 500 GeForce RTX 2080 Max-Q, i7-8750H, 82 Wh | Razer Blade 15 RTX 2070 Max-Q GeForce RTX 2070 Max-Q, i7-8750H, 80 Wh | Gigabyte Aero 15-X9 GeForce RTX 2070 Max-Q, i7-8750H, 94.24 Wh | Média da turma Gaming | |
|---|---|---|---|---|---|---|
| Duração da bateria | -19% | 7% | 73% | 106% | 58% | |
| Reader / Idle (h) | 5.9 | 5.6 -5% | 11.4 93% | 9.2 56% | 7.84 ? 33% | |
| WiFi v1.3 (h) | 3.7 | 3 -19% | 3.2 -14% | 6.5 76% | 6.4 73% | 7.08 ? 91% |
| Load (h) | 1 | 1.4 40% | 1.5 50% | 2.9 190% | 1.496 ? 50% | |
| H.264 (h) | 6.1 | 8.27 ? |
Pro
Contra
Na superfície, o ASUS ROG Zephyrus S GX502GW é atualmente um dos melhores portáteis de jogos que você pode comprar. Ele tem algumas fraquezas frustrantes que podem afastar as pessoas.
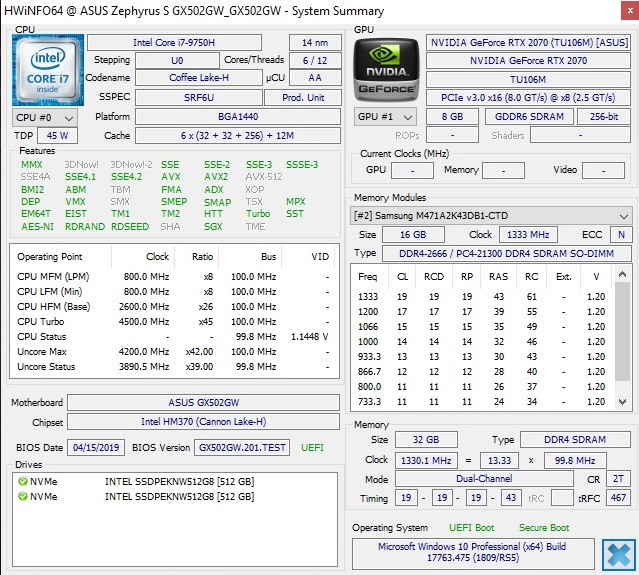
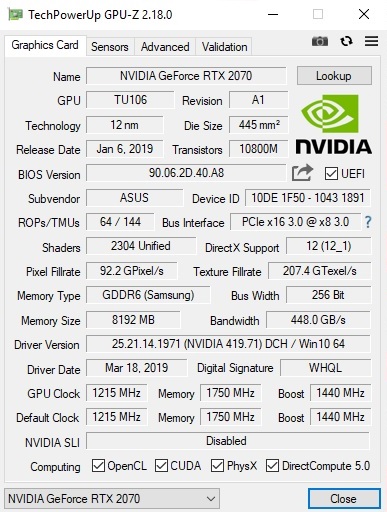
O dispositivo tem um design compacto e fino, mas ainda assim consegue alojar componentes incrivelmente poderosos. Suas CPU e GPU topo de gama permitem-lhe rodar facilmente todos os jogos triple-A lançados ao longo dos últimos anos, com configurações gráficas altas a máximas. Seus tempos de resposta baixos, suporte a G-Sync e taxa de atualização de 144 Hz devem fazer com que os jogos pareçam mais fluentes também. No entanto, você terá que suportar visuais de baixo contraste e uma duração de bateria terrível. Ainda assim recomendamos a ativação do Nvidia Optimus quando você não estiver jogando, já que a GPU consumirá a muita energia da bateria se estiver sempre ativada.
O ASUS ROG Zephyrus S GX502GW tem muito a oferecer. É elegante, compacto e proporciona uma excelente experiência de jogo. No entanto, é barulhento, não possui algumas portas úteis e tem uma duração de bateria horrível.
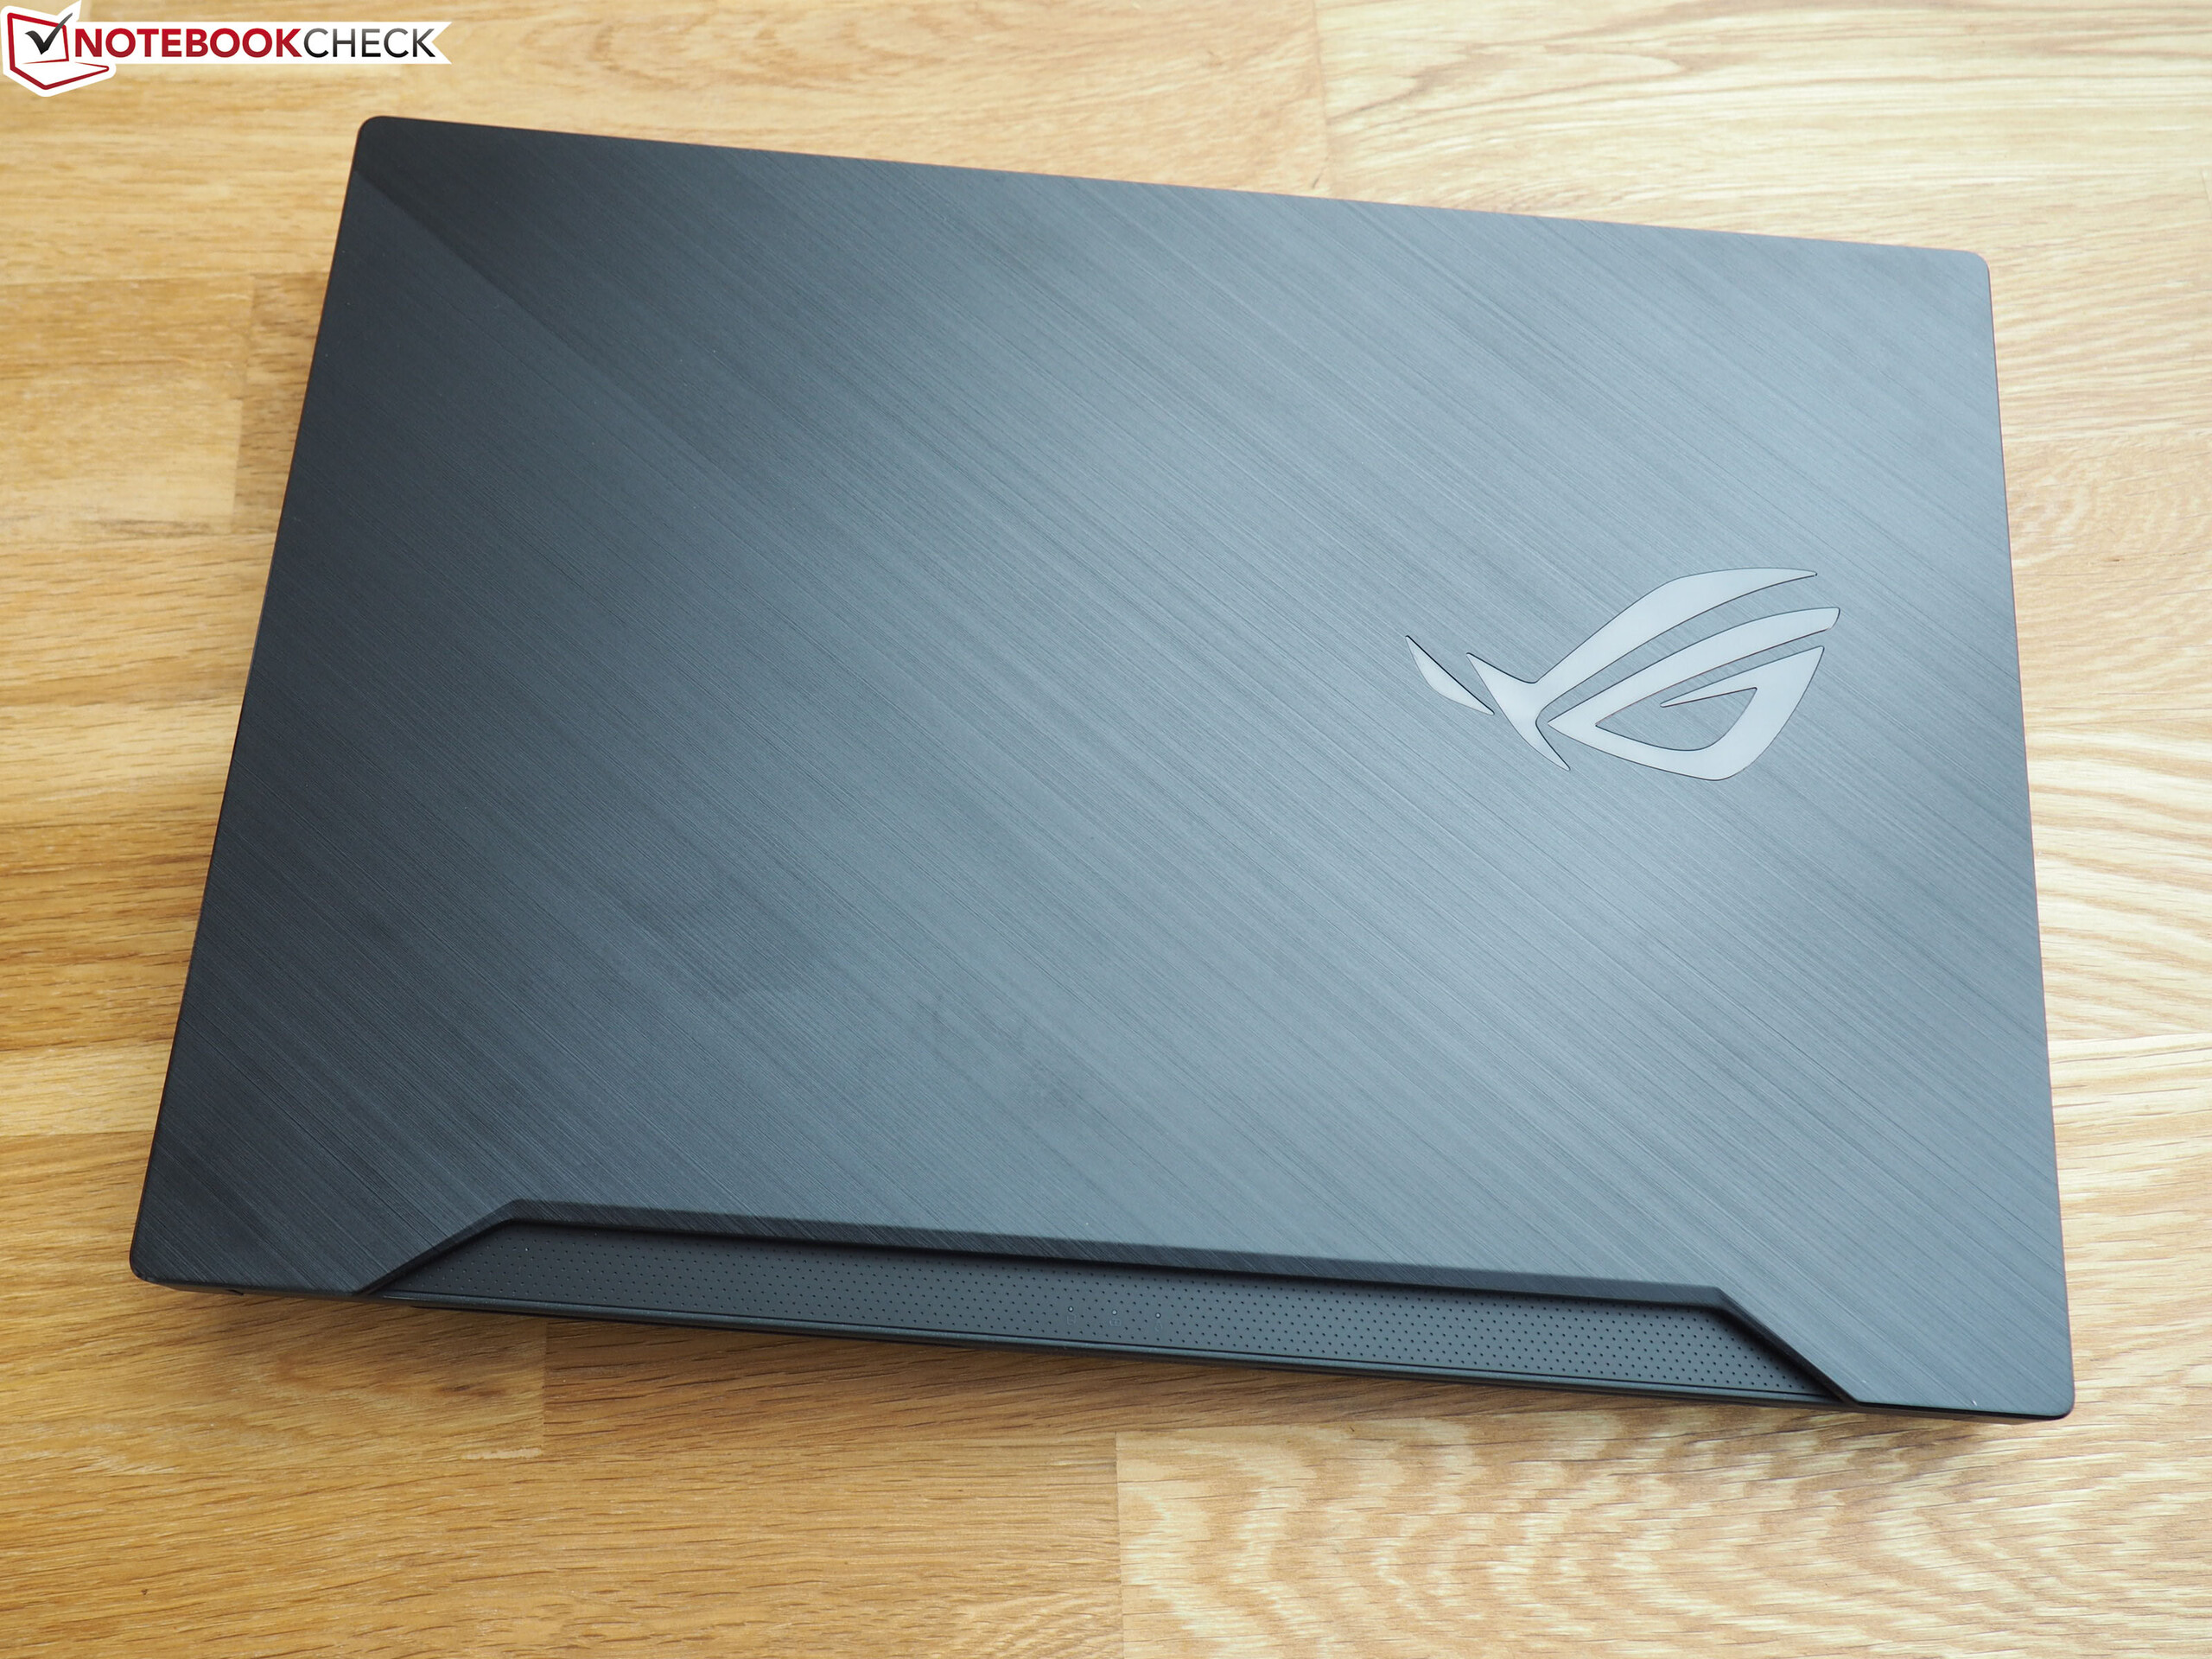
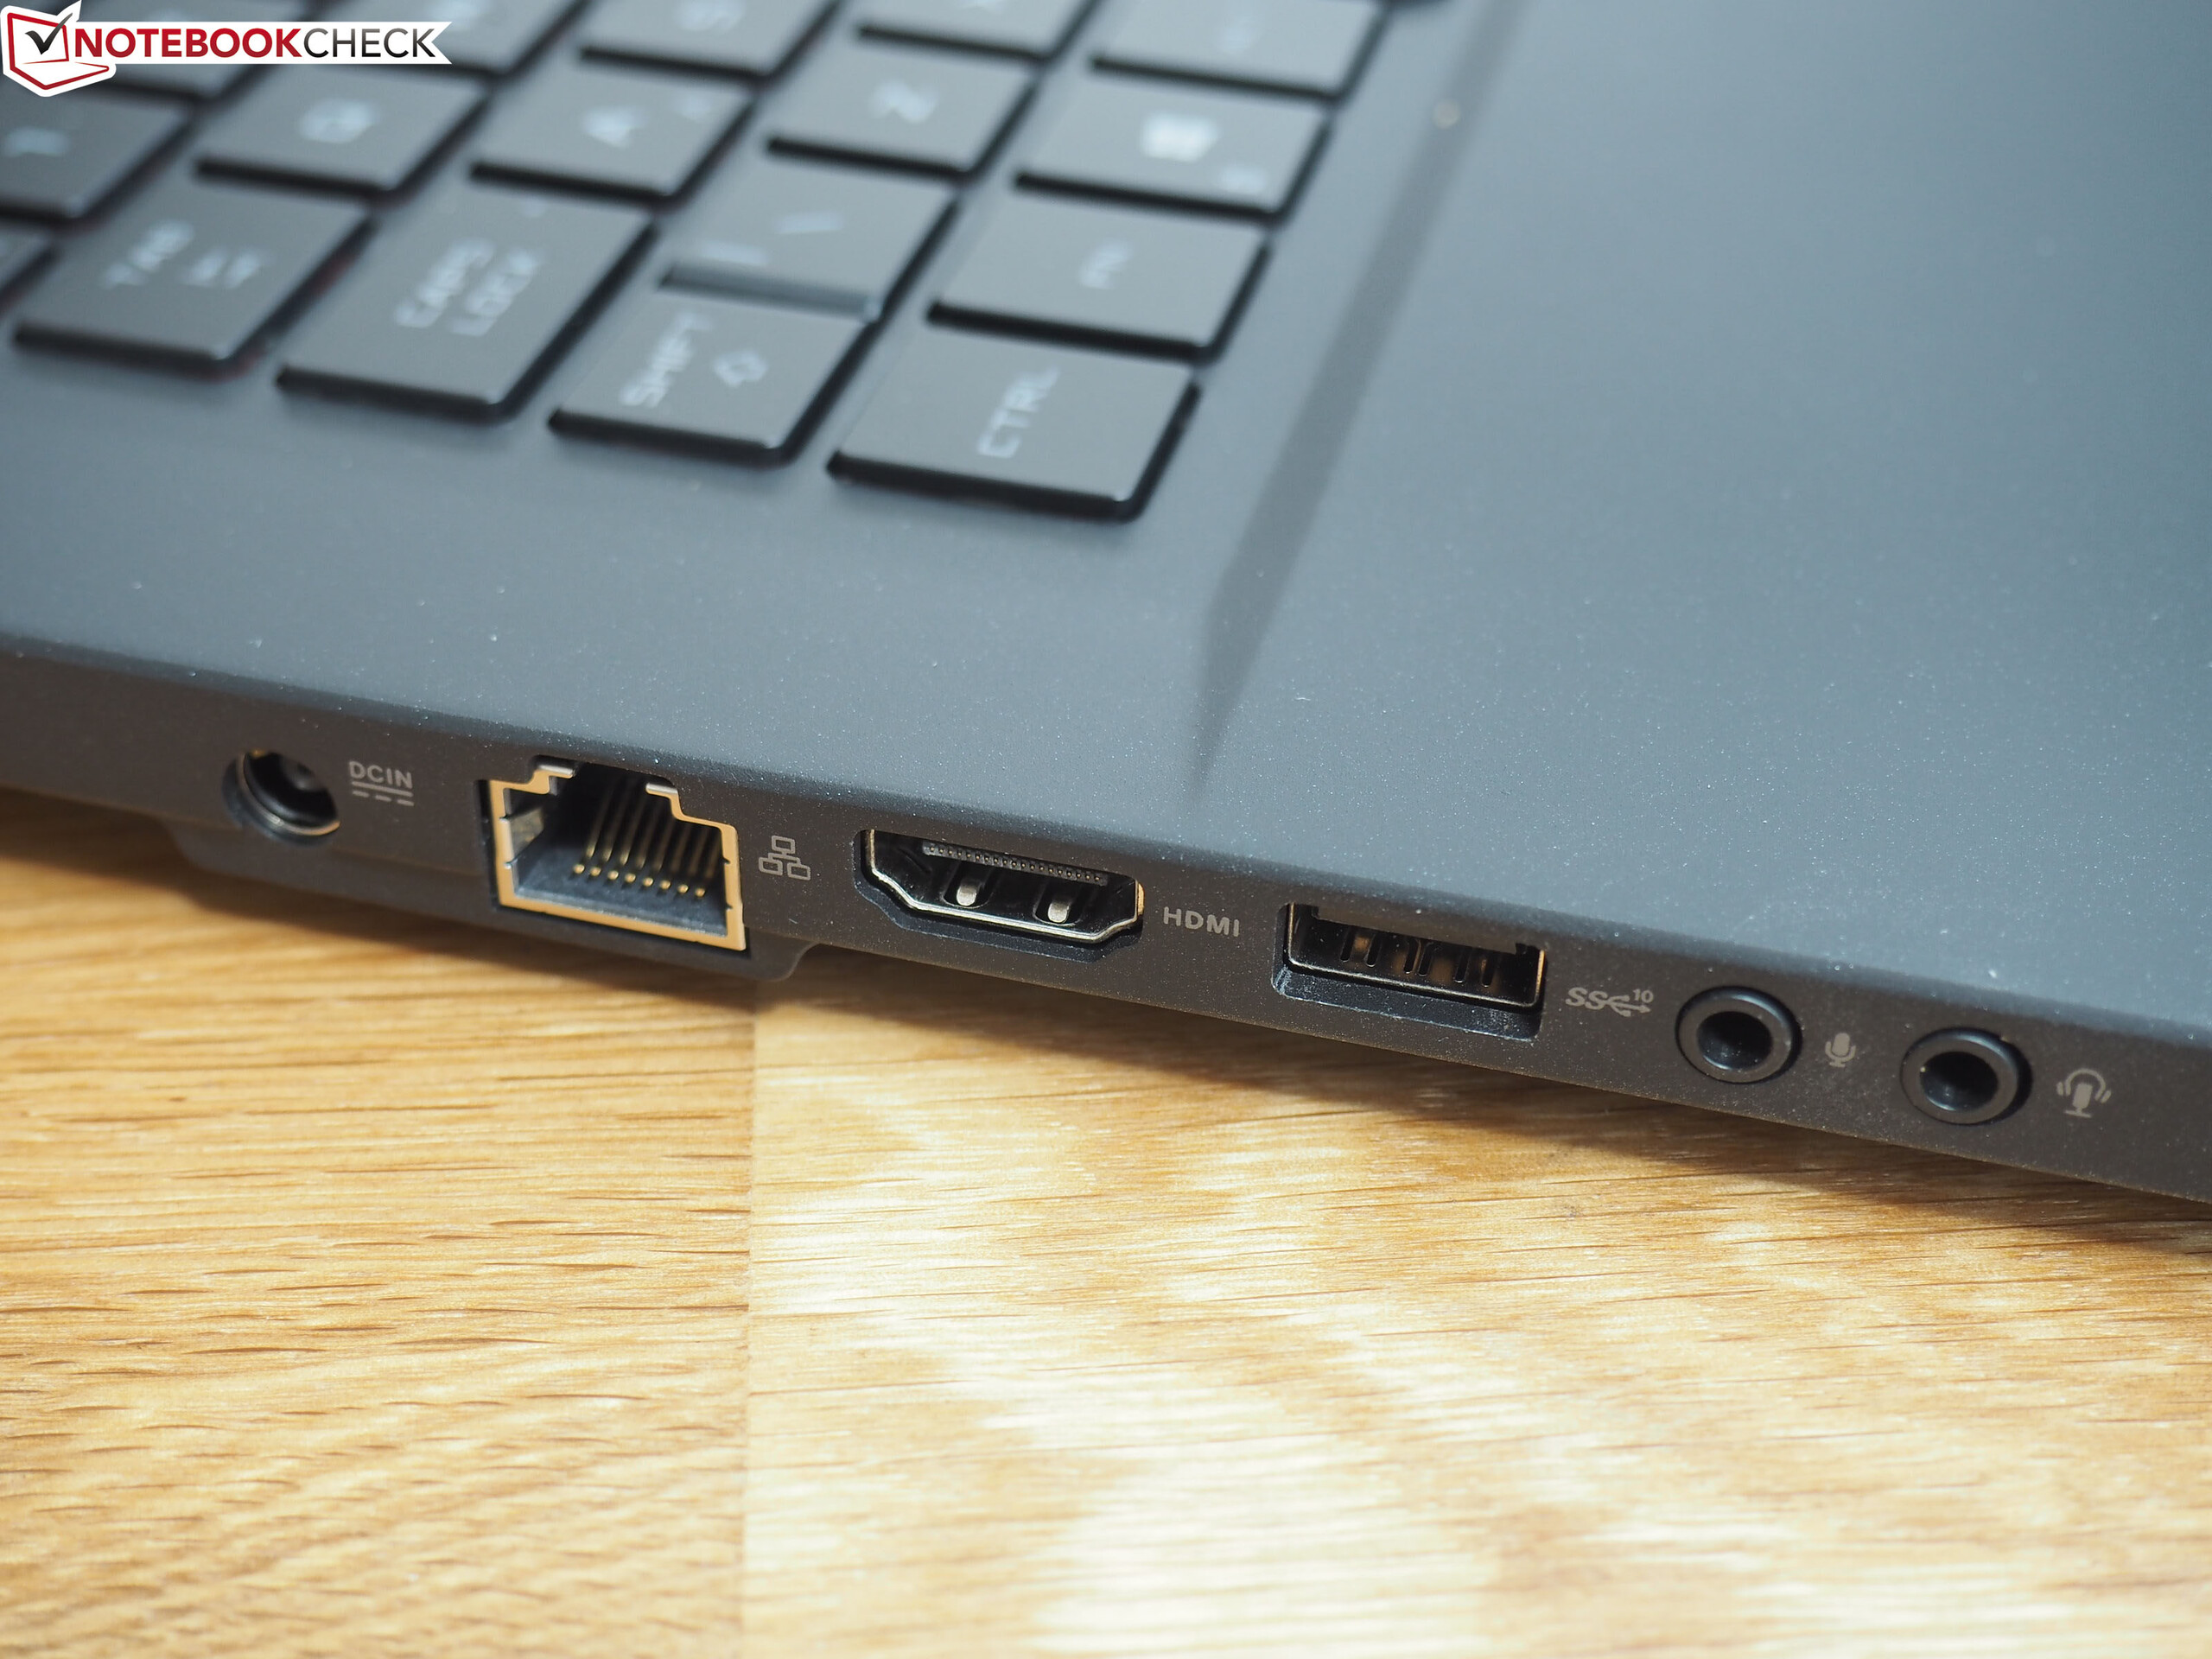
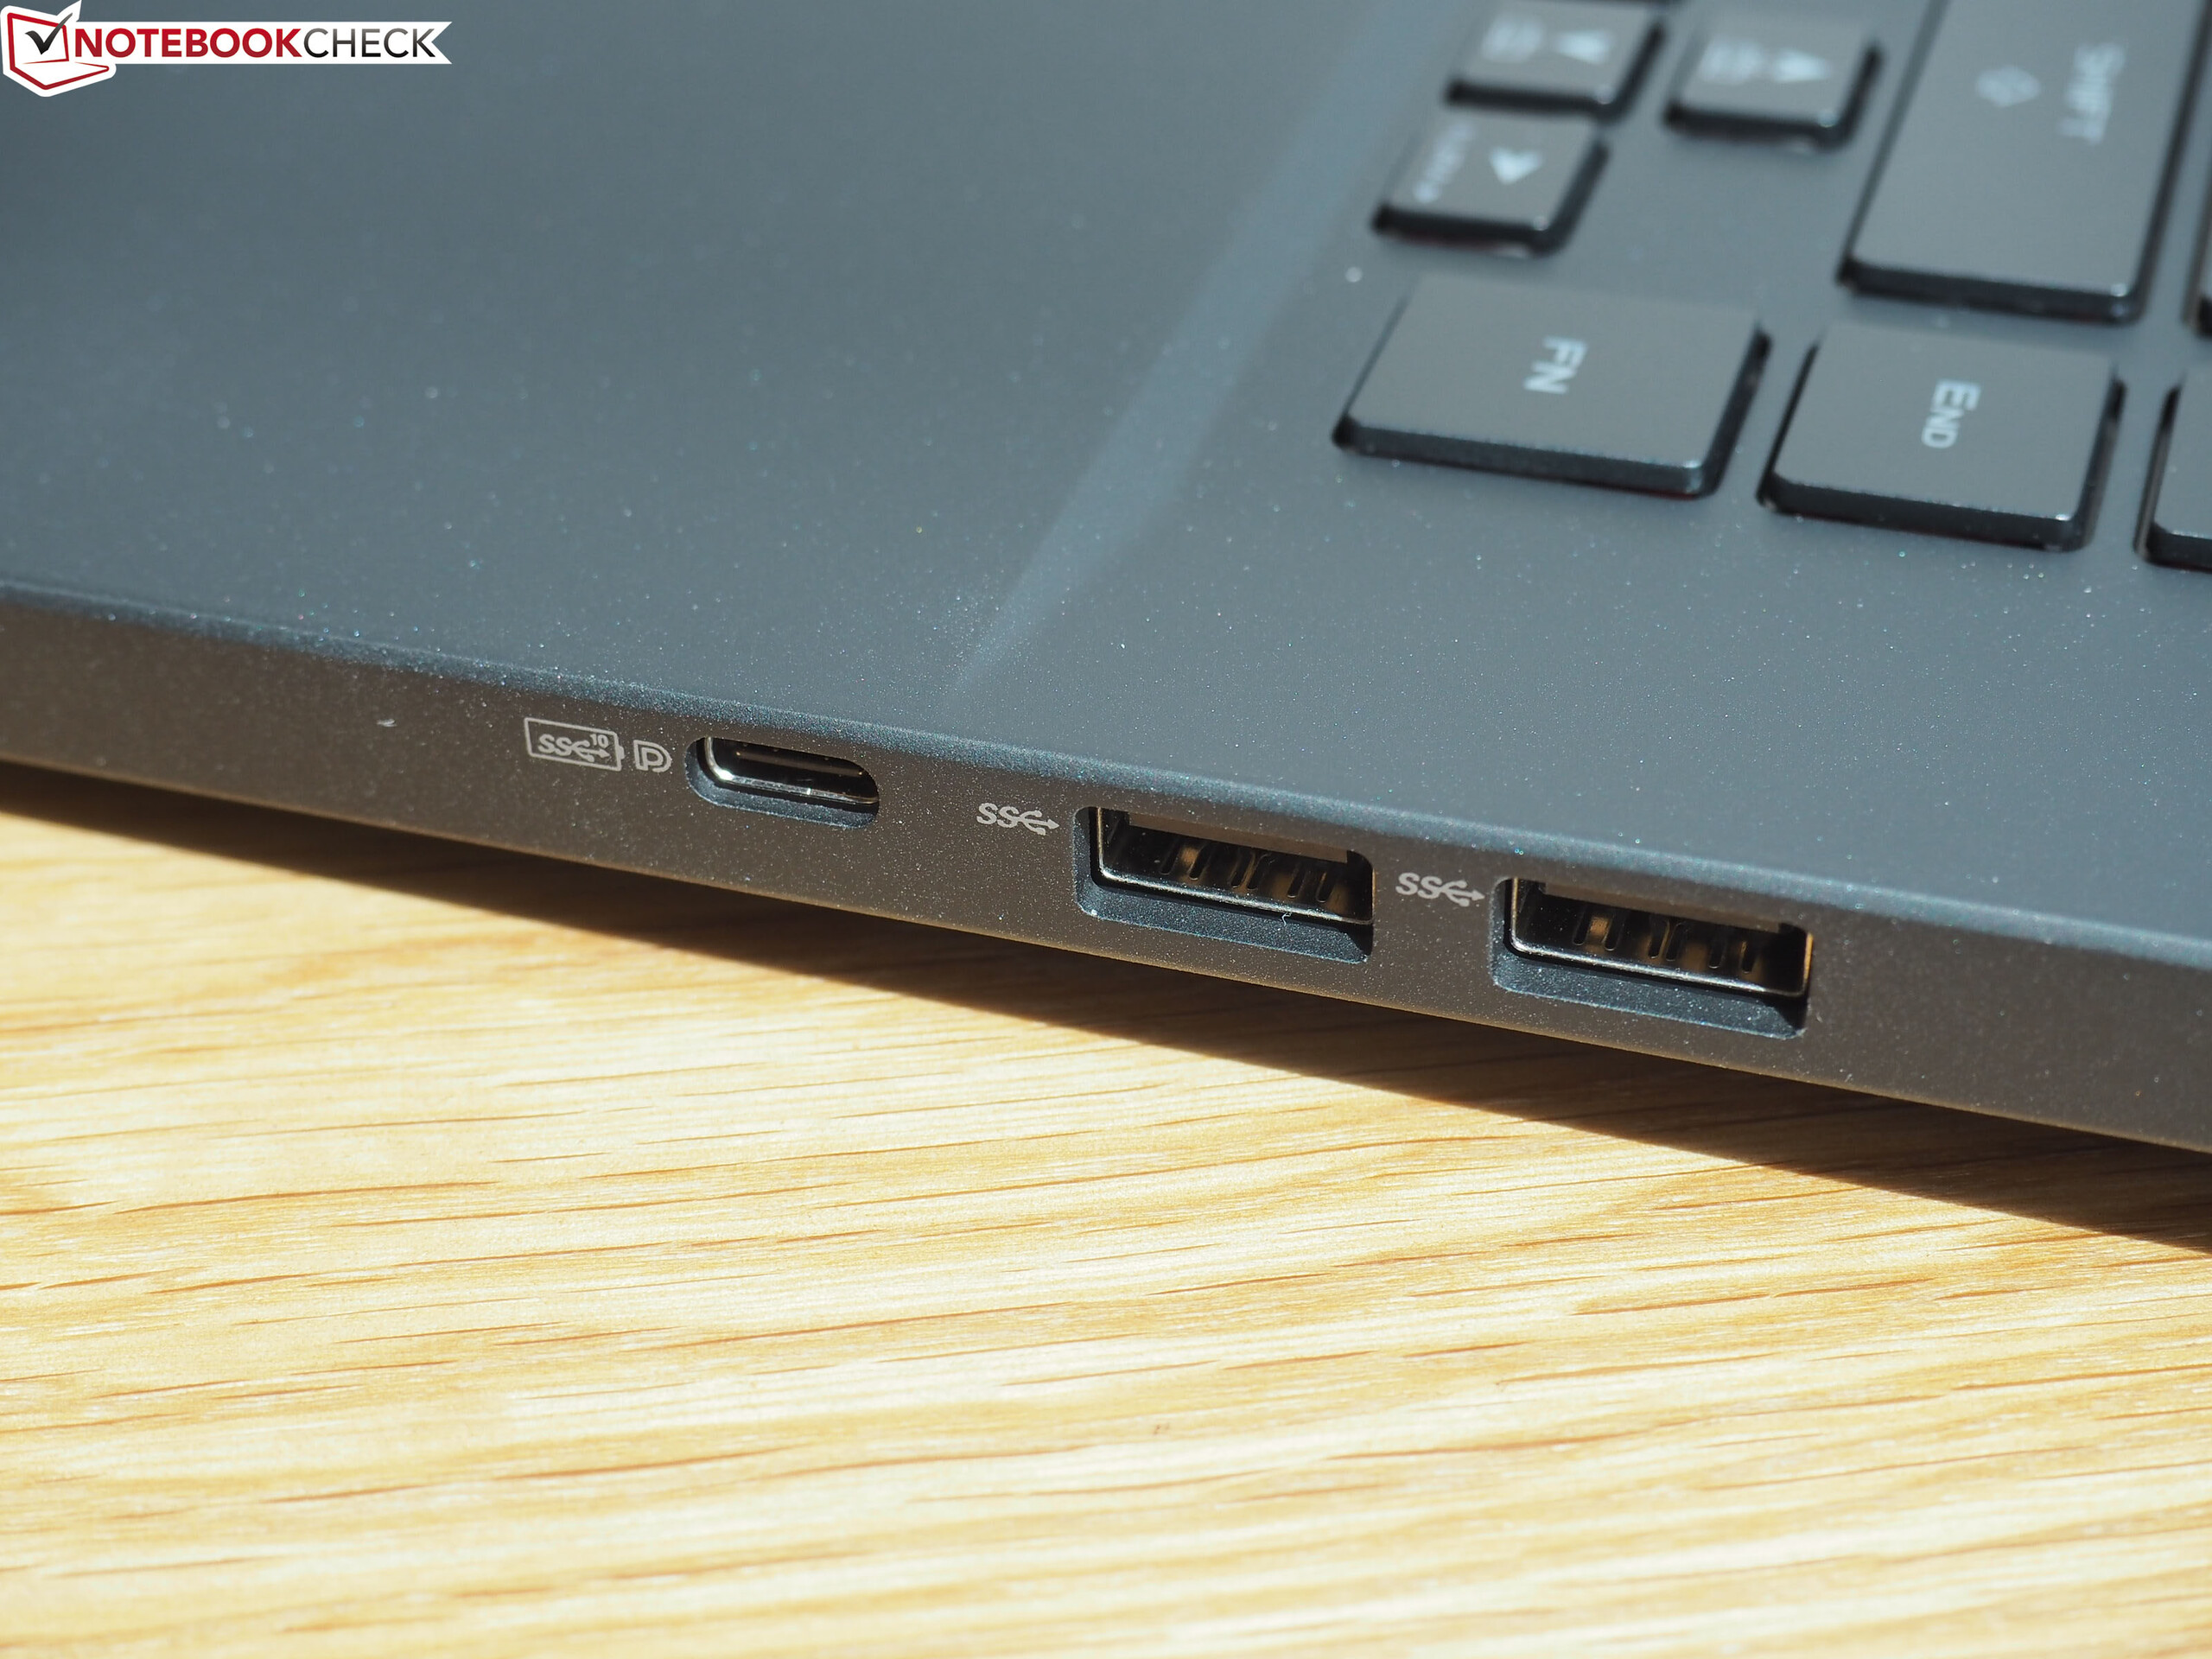
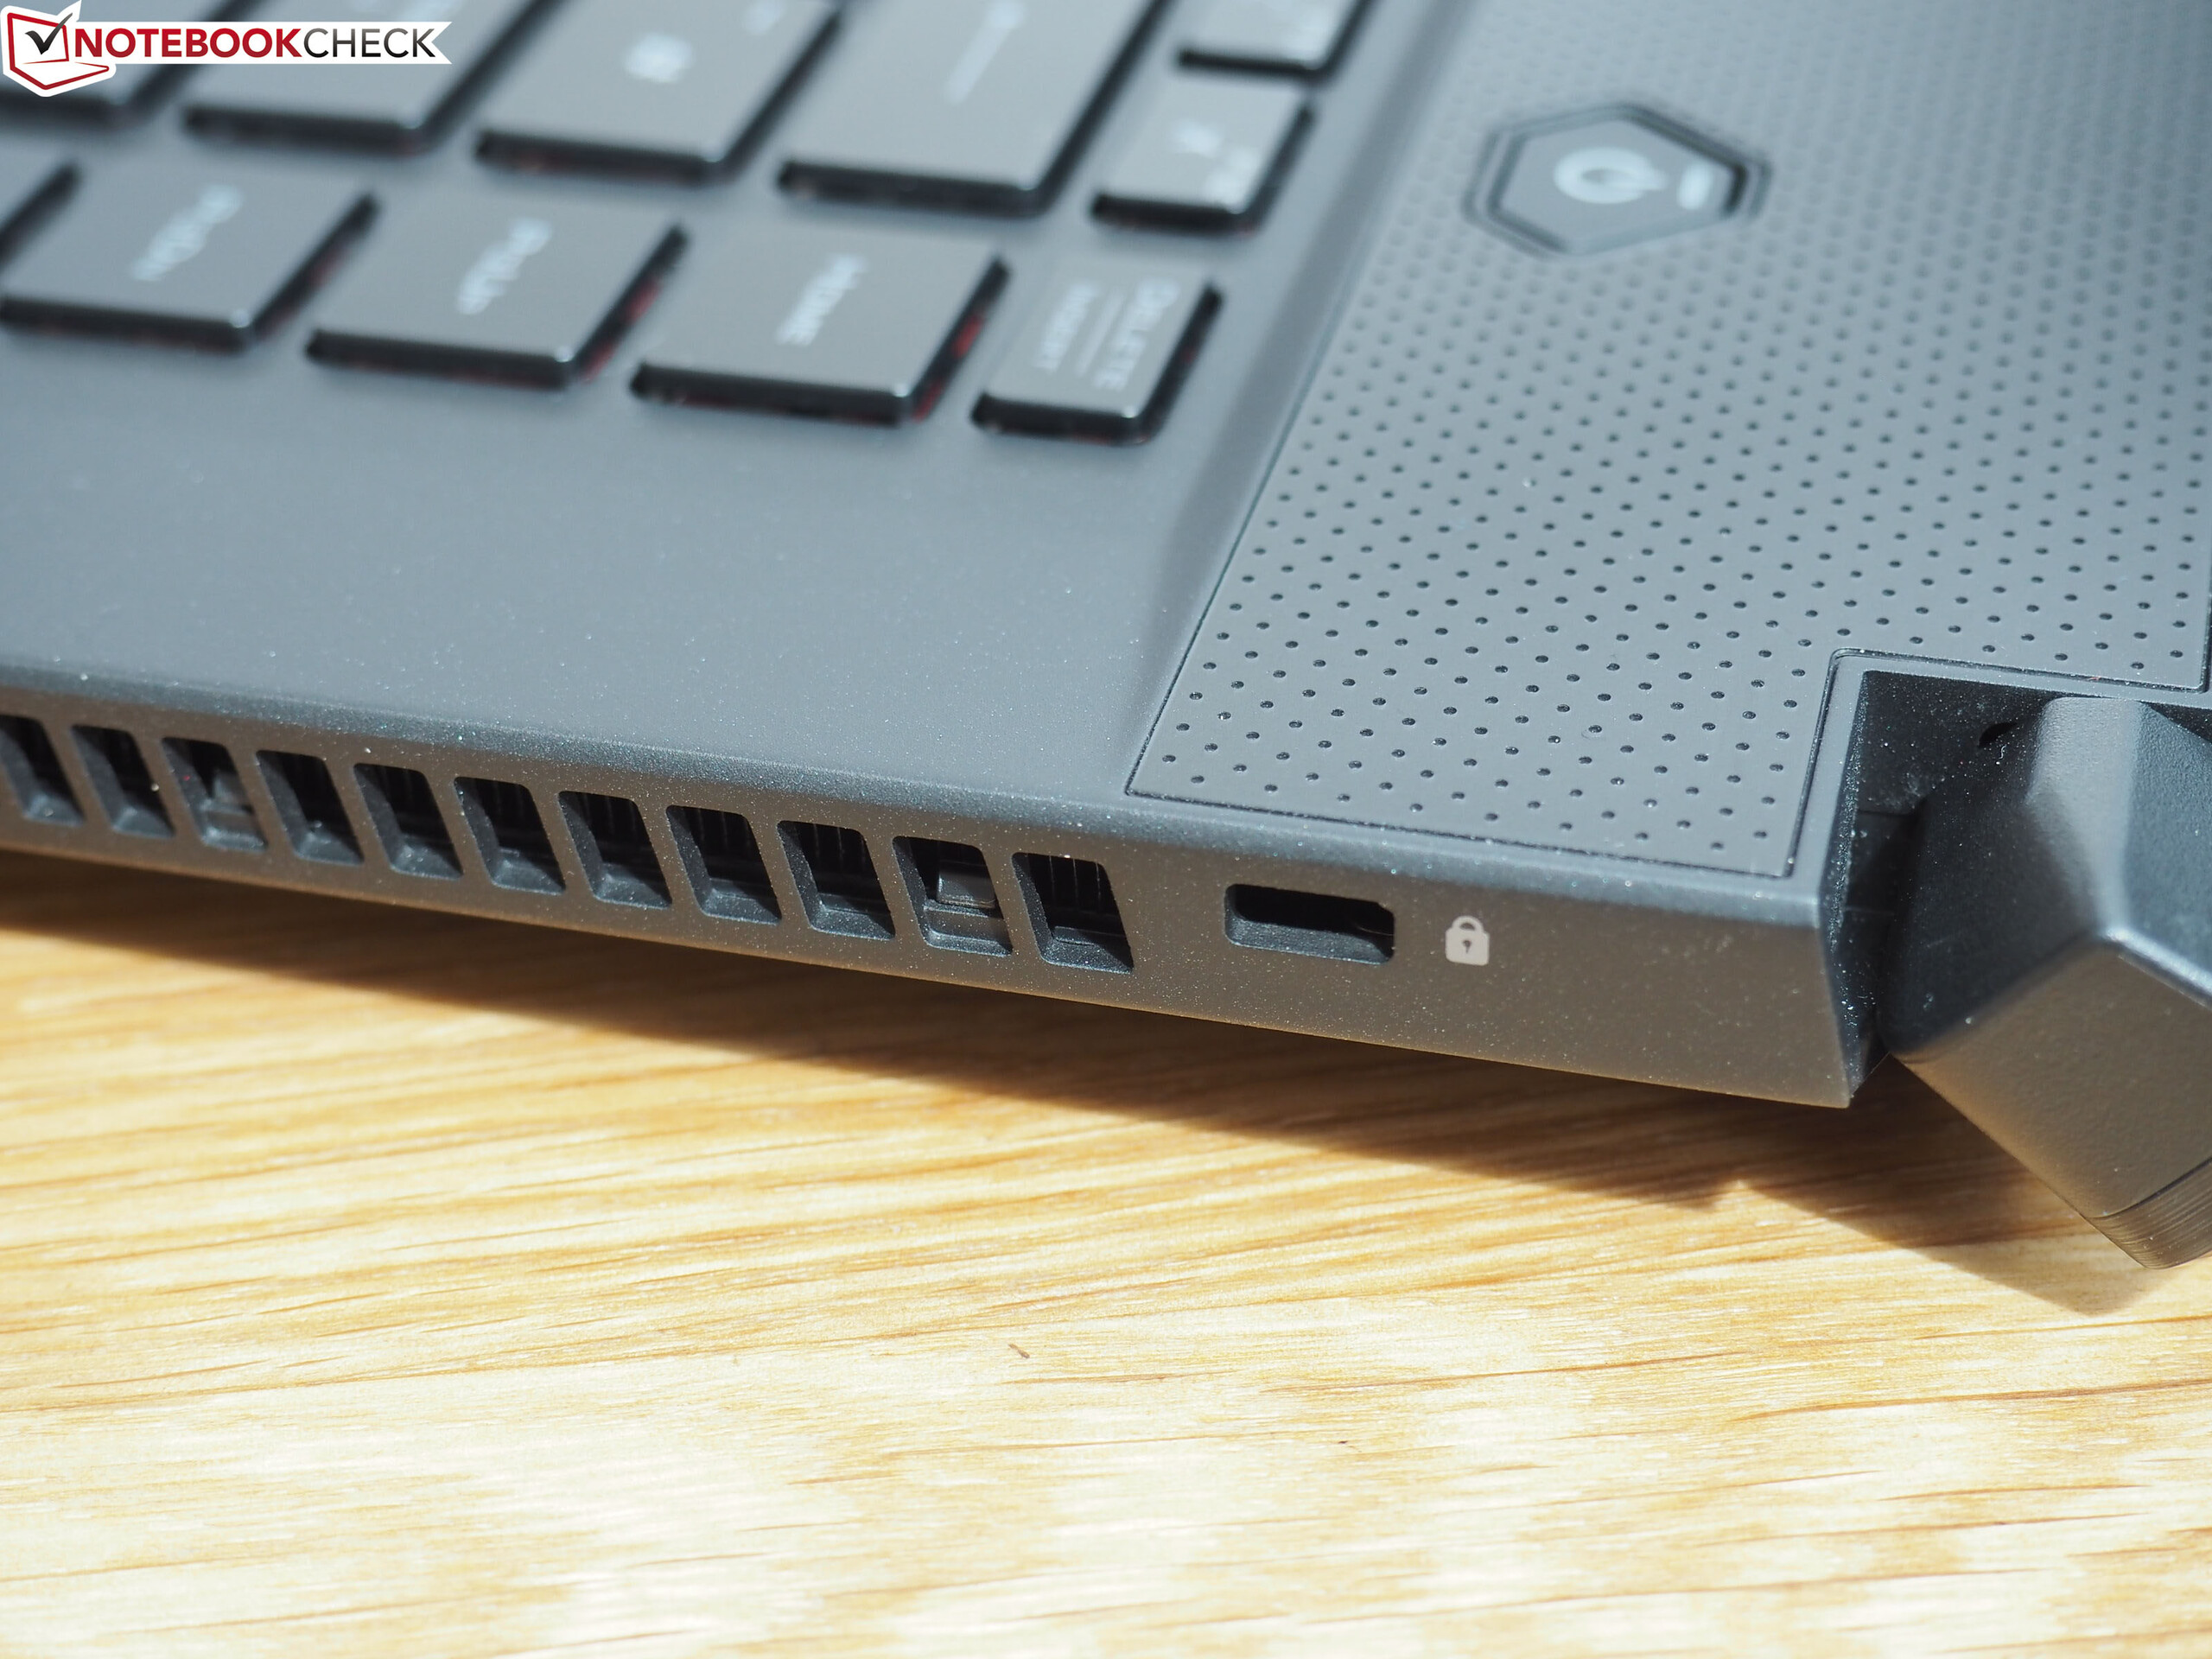
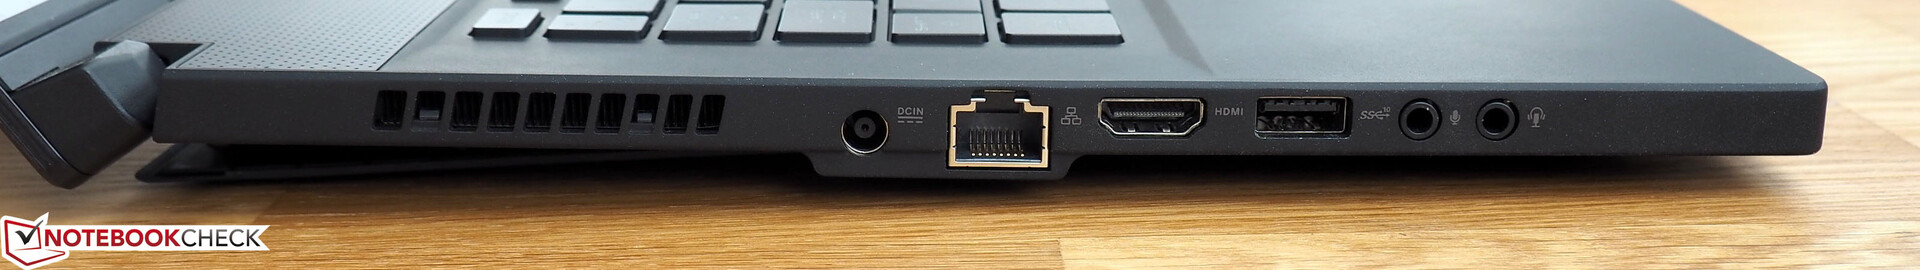
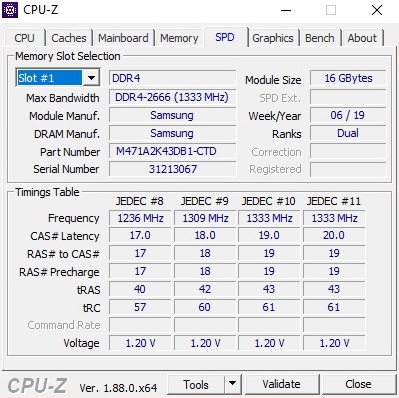
Não podemos entender algumas das decisões que a ASUS tomou. Soldar metade da RAM na placa-mãe parece tolice, assim como a decisão de não incluir um leitor de cartões, uma câmera ou uma porta Thunderbolt 3. Em última análise, o GX502GW funciona de forma muito barulhenta e quente para um portátil de jogos premium fino e leve.
Em suma, existem algumas razões para considerar a série GX502 sobre o Aero 15-X9 ou o Razer Blade 15. Uma delas pode ser sua GPU não Max-Q, mas ter um portátil completo da série RTX 20 vem com desvantagens. O GX502GW ainda é uma boa opção se estiver procurando um portátil para jogos de 15,6 polegadas, mas ele simplesmente perde o padrão que a Gigabyte e a Razer definiram.
Asus Zephyrus S GX502GW
- 05/14/2020 v7 (old)
Florian Glaser
Price comparison