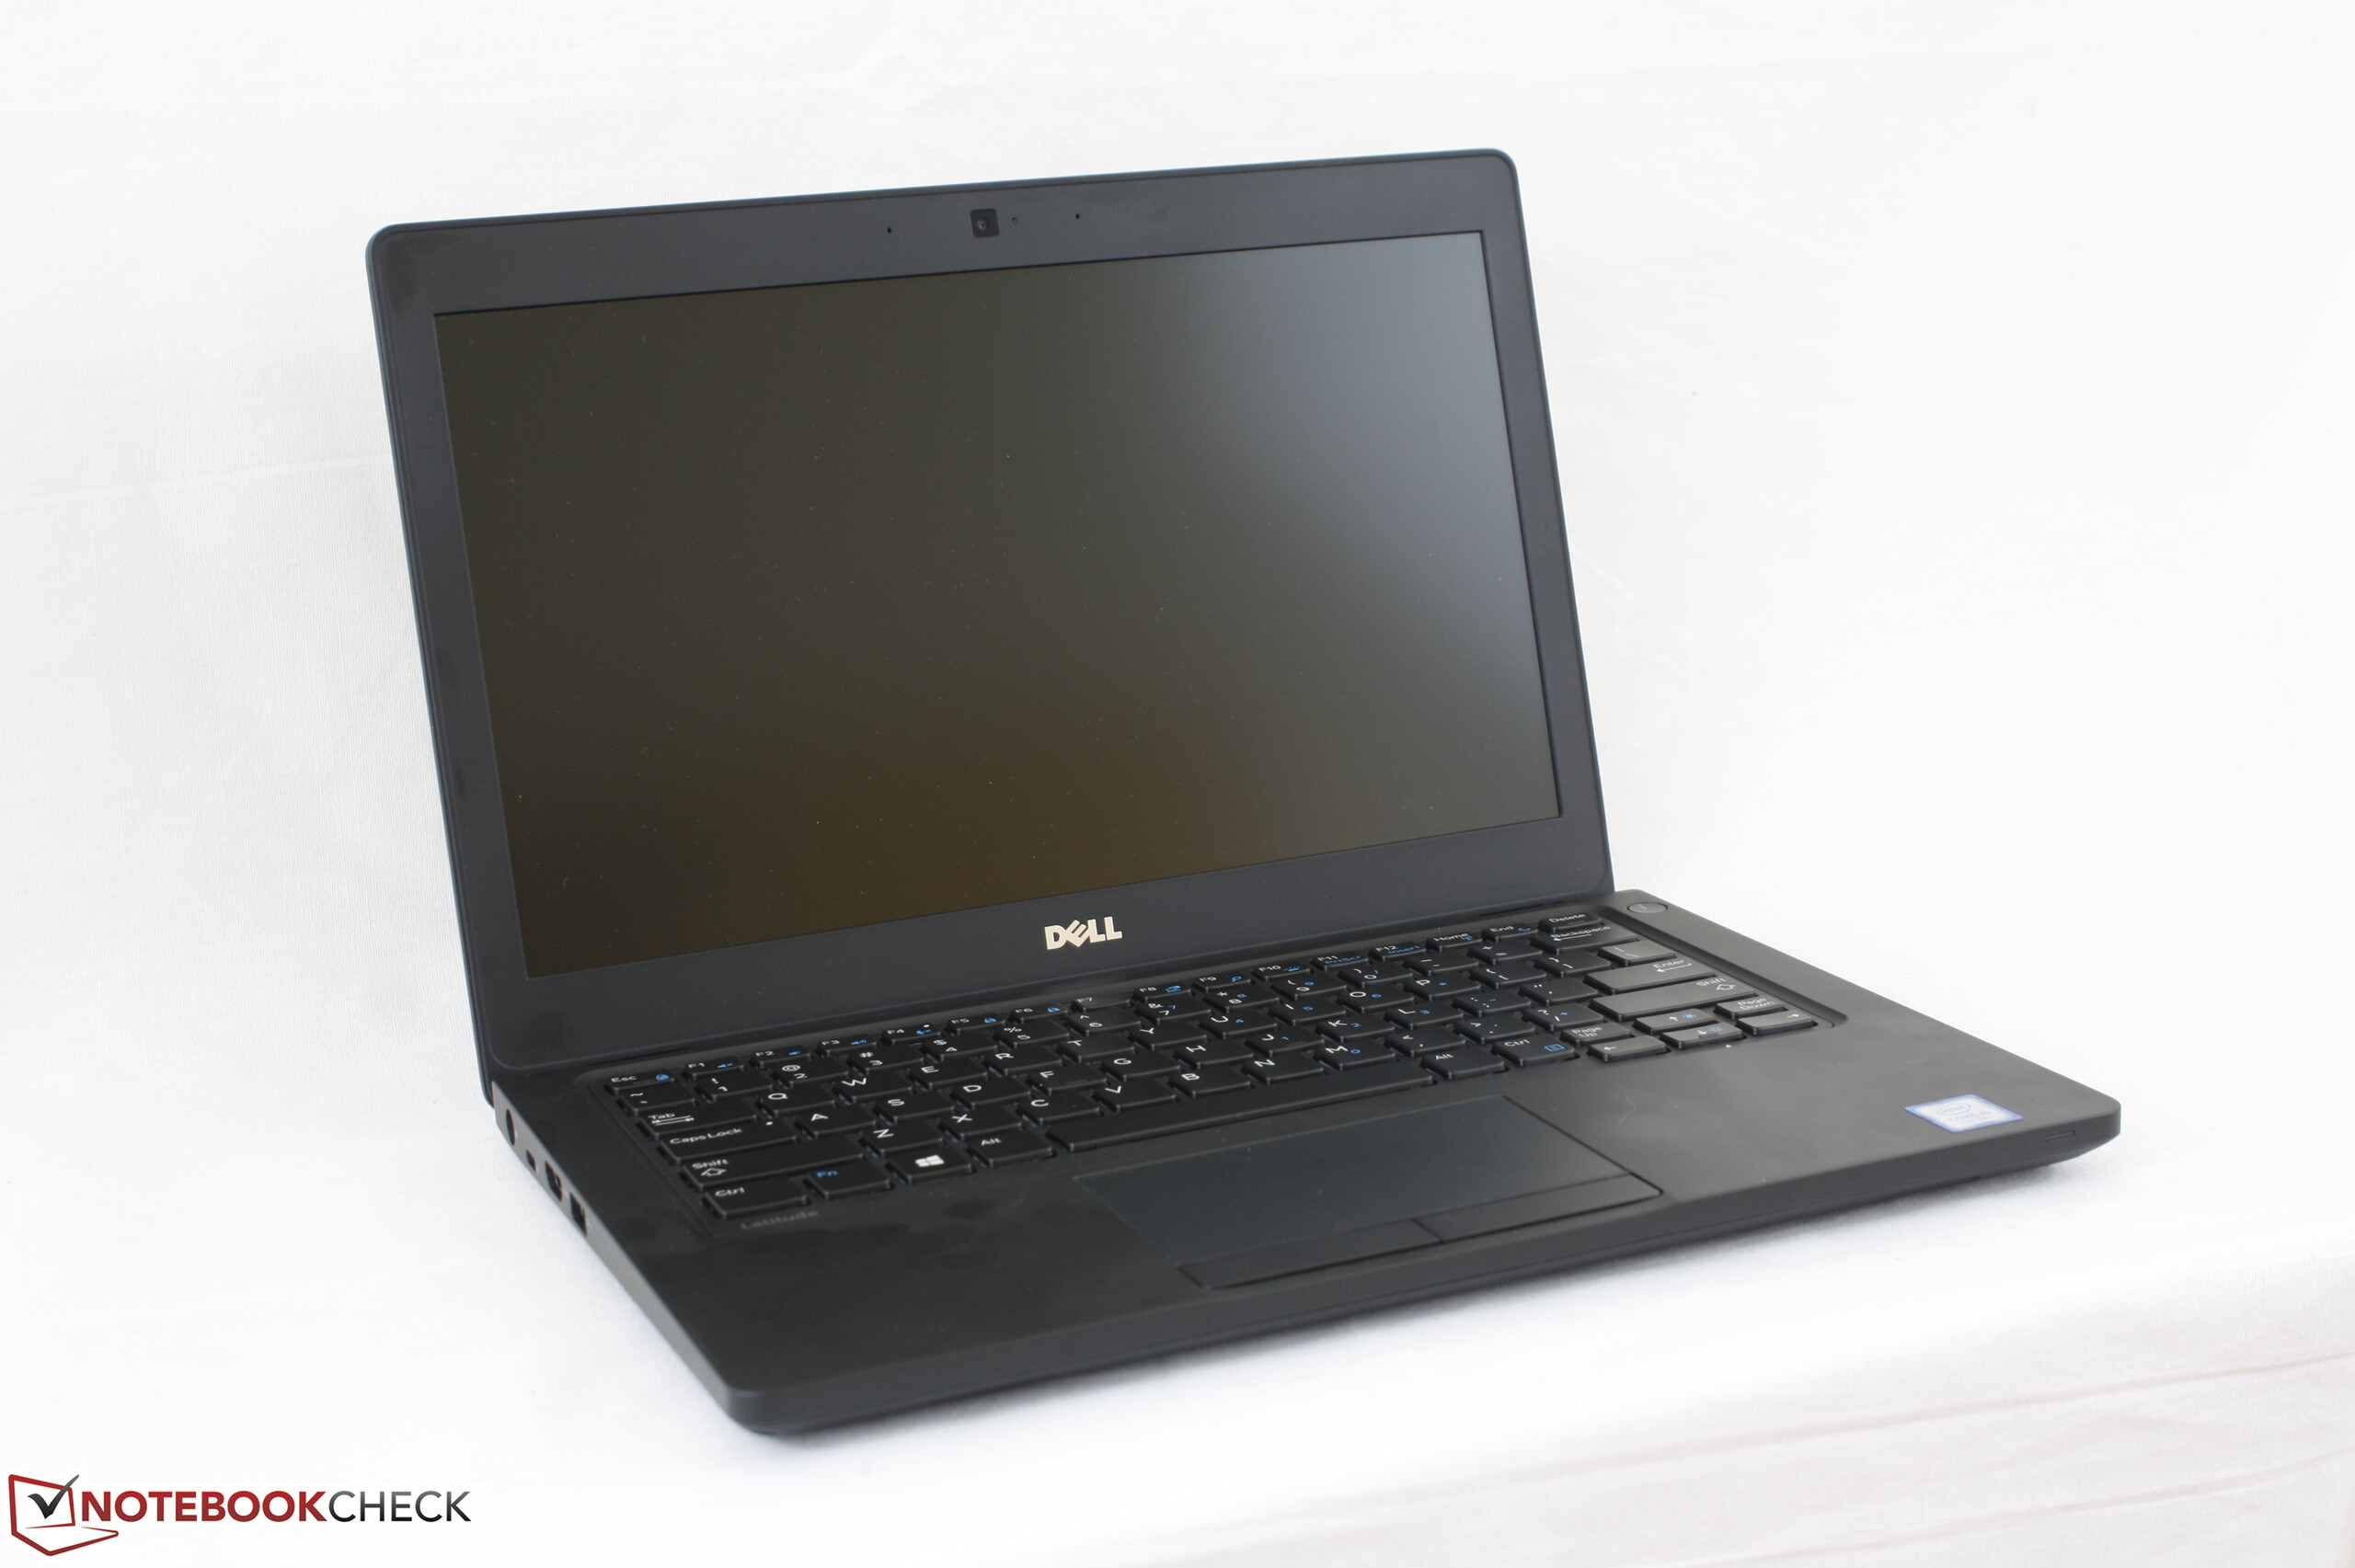
Breve Análise do Portátil Dell Latitude 5280 (7200U, HD)
| SD Card Reader | |
| average JPG Copy Test (av. of 3 runs) | |
| Lenovo ThinkPad X270-20HMS00T00 | |
| HP EliteBook 725 G4 | |
| Dell Latitude 5280 | |
| maximum AS SSD Seq Read Test (1GB) | |
| Dell Latitude 5280 | |
| Lenovo ThinkPad X270-20HMS00T00 | |
| HP EliteBook 725 G4 | |
| Networking | |
| iperf3 transmit AX12 | |
| Lenovo ThinkPad X270-20HMS00T00 | |
| Dell Latitude 5289 | |
| Dell Latitude 5280 | |
| iperf3 receive AX12 | |
| Lenovo ThinkPad X270-20HMS00T00 | |
| Dell Latitude 5280 | |
| Dell Latitude 5289 | |
| |||||||||||||||||||||||||
iluminação: 90 %
iluminação com acumulador: 251.8 cd/m²
Contraste: 336:1 (Preto: 0.75 cd/m²)
ΔE ColorChecker Calman: 11.3 | ∀{0.5-29.43 Ø4.71}
ΔE Greyscale Calman: 13.2 | ∀{0.09-98 Ø4.96}
59.2% sRGB (Argyll 1.6.3 3D)
37.6% AdobeRGB 1998 (Argyll 1.6.3 3D)
40.67% AdobeRGB 1998 (Argyll 3D)
59.2% sRGB (Argyll 3D)
39.34% Display P3 (Argyll 3D)
Gamma: 2.05
CCT: 14912 K
| Dell Latitude 5280 TN LED, 12.5", 1366x768 | Dell Latitude 5289 BOE NV12N51, IPS LED, 12.5", 1920x1080 | Lenovo ThinkPad X270-20HMS00T00 Innolux N125HCE-GN1, IPS LED, 12.5", 1920x1080 | HP EliteBook 725 G4 AU Optronics, IPS, 12.5", 1920x1080 | Dell Latitude 12 E5270 BOE05F4, TN, 12.5", 1366x768 | |
|---|---|---|---|---|---|
| Display | 9% | 12% | 24% | -1% | |
| Display P3 Coverage (%) | 39.34 | 42.79 9% | 44.6 13% 44.6 13% | 49.16 25% | 39.06 -1% |
| sRGB Coverage (%) | 59.2 | 64.3 9% | 65.9 11% 65.9 11% | 72.3 22% | 58.7 -1% |
| AdobeRGB 1998 Coverage (%) | 40.67 | 44.21 9% | 46.11 13% 46.11 13% | 50.8 25% | 40.36 -1% |
| Response Times | -17% | -14% | -8% | -6% | |
| Response Time Grey 50% / Grey 80% * (ms) | 42 ? | 42 ? -0% | 40.8 ? 3% | 47 ? -12% | 45.2 ? -8% |
| Response Time Black / White * (ms) | 23.2 ? | 31 ? -34% | 30.4 ? -31% | 24 ? -3% | 24 ? -3% |
| PWM Frequency (Hz) | 531 ? | 26040 ? | 1000 ? | ||
| Screen | 55% | 49% | 81% | 9% | |
| Brightness middle (cd/m²) | 251.8 | 336 33% | 283 12% | 329 31% | 161 -36% |
| Brightness (cd/m²) | 246 | 320 30% | 281 14% | 310 26% | 152 -38% |
| Brightness Distribution (%) | 90 | 90 0% | 94 4% | 88 -2% | 90 0% |
| Black Level * (cd/m²) | 0.75 | 0.34 55% | 0.25 67% | 0.19 75% | 0.29 61% |
| Contrast (:1) | 336 | 988 194% | 1132 237% | 1732 415% | 555 65% |
| Colorchecker dE 2000 * | 11.3 | 3.45 69% | 6.1 46% | 2.69 76% | 10.31 9% |
| Colorchecker dE 2000 max. * | 23.1 | 7.95 66% | 15.4 33% | 4.47 81% | 18.58 20% |
| Greyscale dE 2000 * | 13.2 | 1.68 87% | 6 55% | 4.23 68% | 11.3 14% |
| Gamma | 2.05 107% | 2.49 88% | 2.05 107% | 2.21 100% | 2.57 86% |
| CCT | 14912 44% | 6782 96% | 6832 95% | 6011 108% | 13574 48% |
| Color Space (Percent of AdobeRGB 1998) (%) | 37.6 | 41 9% | 42.26 12% | 46 22% | 37.32 -1% |
| Color Space (Percent of sRGB) (%) | 59.2 | 64 8% | 65.43 11% | 72 22% | 58.82 -1% |
| Média Total (Programa/Configurações) | 16% /
36% | 16% /
30% | 32% /
58% | 1% /
5% |
* ... menor é melhor
Exibir tempos de resposta
| ↔ Tempo de resposta preto para branco | ||
|---|---|---|
| 23.2 ms ... ascensão ↗ e queda ↘ combinadas | ↗ 17.2 ms ascensão | 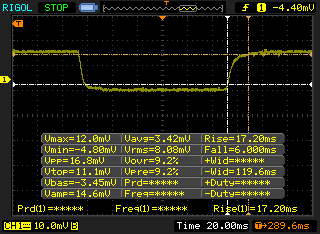 |
| ↘ 6 ms queda | ||
| A tela mostra boas taxas de resposta em nossos testes, mas pode ser muito lenta para jogadores competitivos. Em comparação, todos os dispositivos testados variam de 0.1 (mínimo) a 240 (máximo) ms. » 53 % de todos os dispositivos são melhores. Isso significa que o tempo de resposta medido é pior que a média de todos os dispositivos testados (19.8 ms). | ||
| ↔ Tempo de resposta 50% cinza a 80% cinza | ||
| 42 ms ... ascensão ↗ e queda ↘ combinadas | ↗ 21.2 ms ascensão | 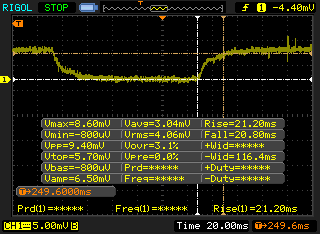 |
| ↘ 20.8 ms queda | ||
| A tela mostra taxas de resposta lentas em nossos testes e será insatisfatória para os jogadores. Em comparação, todos os dispositivos testados variam de 0.165 (mínimo) a 636 (máximo) ms. » 67 % de todos os dispositivos são melhores. Isso significa que o tempo de resposta medido é pior que a média de todos os dispositivos testados (31 ms). | ||
Cintilação da tela / PWM (modulação por largura de pulso)
| Tela tremeluzindo / PWM não detectado |  | ||
[pwm_comparison] Em comparação: 52 % de todos os dispositivos testados não usam PWM para escurecer a tela. Se PWM foi detectado, uma média de 7747 (mínimo: 5 - máximo: 343500) Hz foi medida. | |||
| wPrime 2.10 - 1024m | |
| Lenovo Thinkpad 13-20J1001BUS | |
| Dell Latitude E7470 N001LE747014EMEA | |
| Dell Latitude 7280 | |
| HP EliteBook 725 G4 | |
| Dell Latitude 5580 | |
| Dell Latitude 5280 | |
| Lenovo ThinkPad T470s-20HF0012US | |
* ... menor é melhor
| PCMark 8 | |
| Home Score Accelerated v2 | |
| Lenovo ThinkPad X270-20HMS00T00 | |
| Dell Latitude 5289 | |
| Dell Latitude 5280 | |
| Dell Latitude 12 E5270 | |
| HP EliteBook 725 G4 | |
| Work Score Accelerated v2 | |
| Dell Latitude 5289 | |
| Lenovo ThinkPad X270-20HMS00T00 | |
| Dell Latitude 5280 | |
| Dell Latitude 12 E5270 | |
| HP EliteBook 725 G4 | |
| Creative Score Accelerated v2 | |
| Dell Latitude 5280 | |
| Dell Latitude 12 E5270 | |
| HP EliteBook 725 G4 | |
| PCMark 8 Home Score Accelerated v2 | 3409 pontos | |
| PCMark 8 Creative Score Accelerated v2 | 3928 pontos | |
| PCMark 8 Work Score Accelerated v2 | 4365 pontos | |
Ajuda | ||
| Dell Latitude 5280 Toshiba MQ01ACF050 | Dell Latitude 5289 SanDisk X400 256GB, SATA (SD8SB8U-256G) | Lenovo ThinkPad X270-20HMS00T00 Toshiba NVMe THNSF5512GPUK | HP EliteBook 725 G4 Samsung PM961 MZVLW256HEHP | Dell Latitude 12 E5270 Seagate ST500LM021-1KJ15 | |
|---|---|---|---|---|---|
| CrystalDiskMark 3.0 | 9086% | 18752% | 6641% | -1% | |
| Read Seq (MB/s) | 107.5 | 423.7 294% | 1190 1007% | 1963 1726% | 113.8 6% |
| Write Seq (MB/s) | 95.3 | 406.4 326% | 985 934% | 1409 1378% | 108.5 14% |
| Read 512 (MB/s) | 31.13 | 260.8 738% | 858 2656% | 949 2949% | 24.9 -20% |
| Write 512 (MB/s) | 45.49 | 255.6 462% | 528 1061% | 890 1856% | 51.9 14% |
| Read 4k (MB/s) | 0.357 | 22.73 6267% | 35.27 9780% | 29.75 8233% | 0.398 11% |
| Write 4k (MB/s) | 0.827 | 27.92 3276% | 124.5 14954% | 47.35 5626% | 0.654 -21% |
| Read 4k QD32 (MB/s) | 0.737 | 306.2 41447% | 495.3 67105% | 139.7 18855% | 0.798 8% |
| Write 4k QD32 (MB/s) | 0.795 | 158.8 19875% | 418.3 52516% | 100.2 12504% | 0.636 -20% |

| 3DMark 11 | |
| 1280x720 Performance GPU | |
| Intel Skull Canyon NUC6i7KYK | |
| Dell Latitude 7480 | |
| Acer Swift 3 SF314-51-731X | |
| Dell Latitude 5280 | |
| Dell Latitude 5580 | |
| Dell XPS 13 9365-4537 2-in-1 | |
| Lenovo Yoga 900S-12ISK-80ML | |
| 1280x720 Performance Combined | |
| Intel Skull Canyon NUC6i7KYK | |
| Dell Latitude 7480 | |
| Acer Swift 3 SF314-51-731X | |
| Dell XPS 13 9365-4537 2-in-1 | |
| Dell Latitude 5280 | |
| Dell Latitude 5580 | |
| Lenovo Yoga 900S-12ISK-80ML | |
| 3DMark | |
| 1280x720 Cloud Gate Standard Graphics | |
| Intel Skull Canyon NUC6i7KYK | |
| Dell Latitude 7480 | |
| Acer Swift 3 SF314-51-731X | |
| Dell Latitude 5280 | |
| Dell Latitude 5580 | |
| Lenovo Yoga 900S-12ISK-80ML | |
| 1920x1080 Fire Strike Graphics | |
| Intel Skull Canyon NUC6i7KYK | |
| Dell Latitude 7480 | |
| Dell Latitude 5280 | |
| Dell Latitude 5580 | |
| Lenovo Yoga 900S-12ISK-80ML | |
| 1920x1080 Ice Storm Extreme Graphics | |
| Intel Skull Canyon NUC6i7KYK | |
| Dell Latitude 7480 | |
| Dell Latitude 5280 | |
| Dell Latitude 5580 | |
| Lenovo Yoga 900S-12ISK-80ML | |
| 3DMark 11 Performance | 1378 pontos | |
| 3DMark Ice Storm Standard Score | 49846 pontos | |
| 3DMark Cloud Gate Standard Score | 5281 pontos | |
| 3DMark Fire Strike Score | 633 pontos | |
Ajuda | ||
| baixo | média | alto | ultra | |
|---|---|---|---|---|
| BioShock Infinite (2013) | 29.9 | 20.9 | 18 | |
| Rise of the Tomb Raider (2016) | 14 |
Barulho
| Ocioso |
| 32.6 / 32.7 / 32.7 dB |
| HDD |
| 33 dB |
| Carga |
| 33.4 / 37 dB |
 | ||
30 dB silencioso 40 dB(A) audível 50 dB(A) ruidosamente alto |
||
min: | ||
| Dell Latitude 5280 HD Graphics 620, i5-7200U, Toshiba MQ01ACF050 | Dell Latitude 5289 HD Graphics 620, i5-7300U, SanDisk X400 256GB, SATA (SD8SB8U-256G) | Lenovo ThinkPad X270-20HMS00T00 HD Graphics 620, i5-7200U, Toshiba NVMe THNSF5512GPUK | HP EliteBook 725 G4 Radeon R7 (Bristol Ridge), PRO A12-9800B, Samsung PM961 MZVLW256HEHP | Dell Latitude 12 E5270 HD Graphics 520, 6300U, Seagate ST500LM021-1KJ15 | |
|---|---|---|---|---|---|
| Noise | 1% | 3% | 4% | -1% | |
| desligado / ambiente * (dB) | 27.6 | 30.5 -11% | 29 -5% | 30.4 -10% | 29.2 -6% |
| Idle Minimum * (dB) | 32.6 | 30.5 6% | 29 11% | 30.4 7% | 32.9 -1% |
| Idle Average * (dB) | 32.7 | 30.5 7% | 29 11% | 30.4 7% | 32.9 -1% |
| Idle Maximum * (dB) | 32.7 | 30.5 7% | 30.4 7% | 30.4 7% | 32.9 -1% |
| Load Average * (dB) | 33.4 | 36 -8% | 34.1 -2% | 31.7 5% | 33.7 -1% |
| Load Maximum * (dB) | 37 | 34.6 6% | 37.6 -2% | 34.4 7% | 34.9 6% |
* ... menor é melhor
(-) A temperatura máxima no lado superior é 48.4 °C / 119 F, em comparação com a média de 35.9 °C / 97 F , variando de 21.4 a 59 °C para a classe Subnotebook.
(-) A parte inferior aquece até um máximo de 49.2 °C / 121 F, em comparação com a média de 39.2 °C / 103 F
(+) Em uso inativo, a temperatura média para o lado superior é 25 °C / 77 F, em comparação com a média do dispositivo de 30.8 °C / ### class_avg_f### F.
(+) Os apoios para as mãos e o touchpad são mais frios que a temperatura da pele, com um máximo de 28.4 °C / 83.1 F e, portanto, são frios ao toque.
(±) A temperatura média da área do apoio para as mãos de dispositivos semelhantes foi 28.2 °C / 82.8 F (-0.2 °C / -0.3 F).
Dell Latitude 5280 análise de áudio
(±) | o volume do alto-falante é médio, mas bom (###valor### dB)
Graves 100 - 315Hz
(-) | quase nenhum baixo - em média 20.2% menor que a mediana
(±) | a linearidade dos graves é média (12.4% delta para a frequência anterior)
Médios 400 - 2.000 Hz
(+) | médios equilibrados - apenas 4% longe da mediana
(±) | a linearidade dos médios é média (9.5% delta para frequência anterior)
Altos 2 - 16 kHz
(±) | máximos mais altos - em média 5.8% maior que a mediana
(±) | a linearidade dos máximos é média (9.8% delta para frequência anterior)
Geral 100 - 16.000 Hz
(±) | a linearidade do som geral é média (25.4% diferença em relação à mediana)
Comparado com a mesma classe
» 85% de todos os dispositivos testados nesta classe foram melhores, 3% semelhantes, 11% piores
» O melhor teve um delta de 5%, a média foi 18%, o pior foi 53%
Comparado com todos os dispositivos testados
» 78% de todos os dispositivos testados foram melhores, 5% semelhantes, 17% piores
» O melhor teve um delta de 4%, a média foi 23%, o pior foi 134%
Apple MacBook 12 (Early 2016) 1.1 GHz análise de áudio
(+) | os alto-falantes podem tocar relativamente alto (###valor### dB)
Graves 100 - 315Hz
(±) | graves reduzidos - em média 11.3% menor que a mediana
(±) | a linearidade dos graves é média (14.2% delta para a frequência anterior)
Médios 400 - 2.000 Hz
(+) | médios equilibrados - apenas 2.4% longe da mediana
(+) | médios são lineares (5.5% delta para frequência anterior)
Altos 2 - 16 kHz
(+) | agudos equilibrados - apenas 2% longe da mediana
(+) | os máximos são lineares (4.5% delta da frequência anterior)
Geral 100 - 16.000 Hz
(+) | o som geral é linear (10.2% diferença em relação à mediana)
Comparado com a mesma classe
» 7% de todos os dispositivos testados nesta classe foram melhores, 2% semelhantes, 90% piores
» O melhor teve um delta de 5%, a média foi 18%, o pior foi 53%
Comparado com todos os dispositivos testados
» 5% de todos os dispositivos testados foram melhores, 1% semelhantes, 94% piores
» O melhor teve um delta de 4%, a média foi 23%, o pior foi 134%
| desligado | |
| Ocioso | |
| Carga |
|
Key:
min: | |
| Dell Latitude 5280 i5-7200U, HD Graphics 620, Toshiba MQ01ACF050, TN LED, 1366x768, 12.5" | Dell Latitude 5289 i5-7300U, HD Graphics 620, SanDisk X400 256GB, SATA (SD8SB8U-256G), IPS LED, 1920x1080, 12.5" | Lenovo ThinkPad X270-20HMS00T00 i5-7200U, HD Graphics 620, Toshiba NVMe THNSF5512GPUK, IPS LED, 1920x1080, 12.5" | HP EliteBook 725 G4 PRO A12-9800B, Radeon R7 (Bristol Ridge), Samsung PM961 MZVLW256HEHP, IPS, 1920x1080, 12.5" | Dell Latitude 12 E5270 6300U, HD Graphics 520, Seagate ST500LM021-1KJ15, TN, 1366x768, 12.5" | |
|---|---|---|---|---|---|
| Power Consumption | 12% | -1% | 0% | 2% | |
| Idle Minimum * (Watt) | 5.7 | 2.7 53% | 3.5 39% | 4.5 21% | 3.9 32% |
| Idle Average * (Watt) | 6.9 | 5.1 26% | 5.8 16% | 6.3 9% | 6 13% |
| Idle Maximum * (Watt) | 7.1 | 7.6 -7% | 7.6 -7% | 8.3 -17% | 6.6 7% |
| Load Average * (Watt) | 28.3 | 33 -17% | 33.2 -17% | 27.6 2% | 28.9 -2% |
| Load Maximum * (Watt) | 30.2 | 29 4% | 40.4 -34% | 34.5 -14% | 41.7 -38% |
* ... menor é melhor
| Dell Latitude 5280 i5-7200U, HD Graphics 620, 51 Wh | Dell Latitude 5289 i5-7300U, HD Graphics 620, 60 Wh | Lenovo ThinkPad X270-20HMS00T00 i5-7200U, HD Graphics 620, 46 Wh | HP EliteBook 725 G4 PRO A12-9800B, Radeon R7 (Bristol Ridge), 49 Wh | Dell Latitude 12 E5270 6300U, HD Graphics 520, 47 Wh | |
|---|---|---|---|---|---|
| Duração da bateria | 36% | -22% | -22% | -18% | |
| Reader / Idle (h) | 18.5 | 28.8 56% | 17.1 -8% | 11.7 -37% | 12.9 -30% |
| WiFi v1.3 (h) | 7.8 | 11.8 51% | 5.4 -31% | 6.3 -19% | 6.6 -15% |
| Load (h) | 2.3 | 2.3 0% | 1.7 -26% | 2.1 -9% | 2.1 -9% |
Pro
Contra
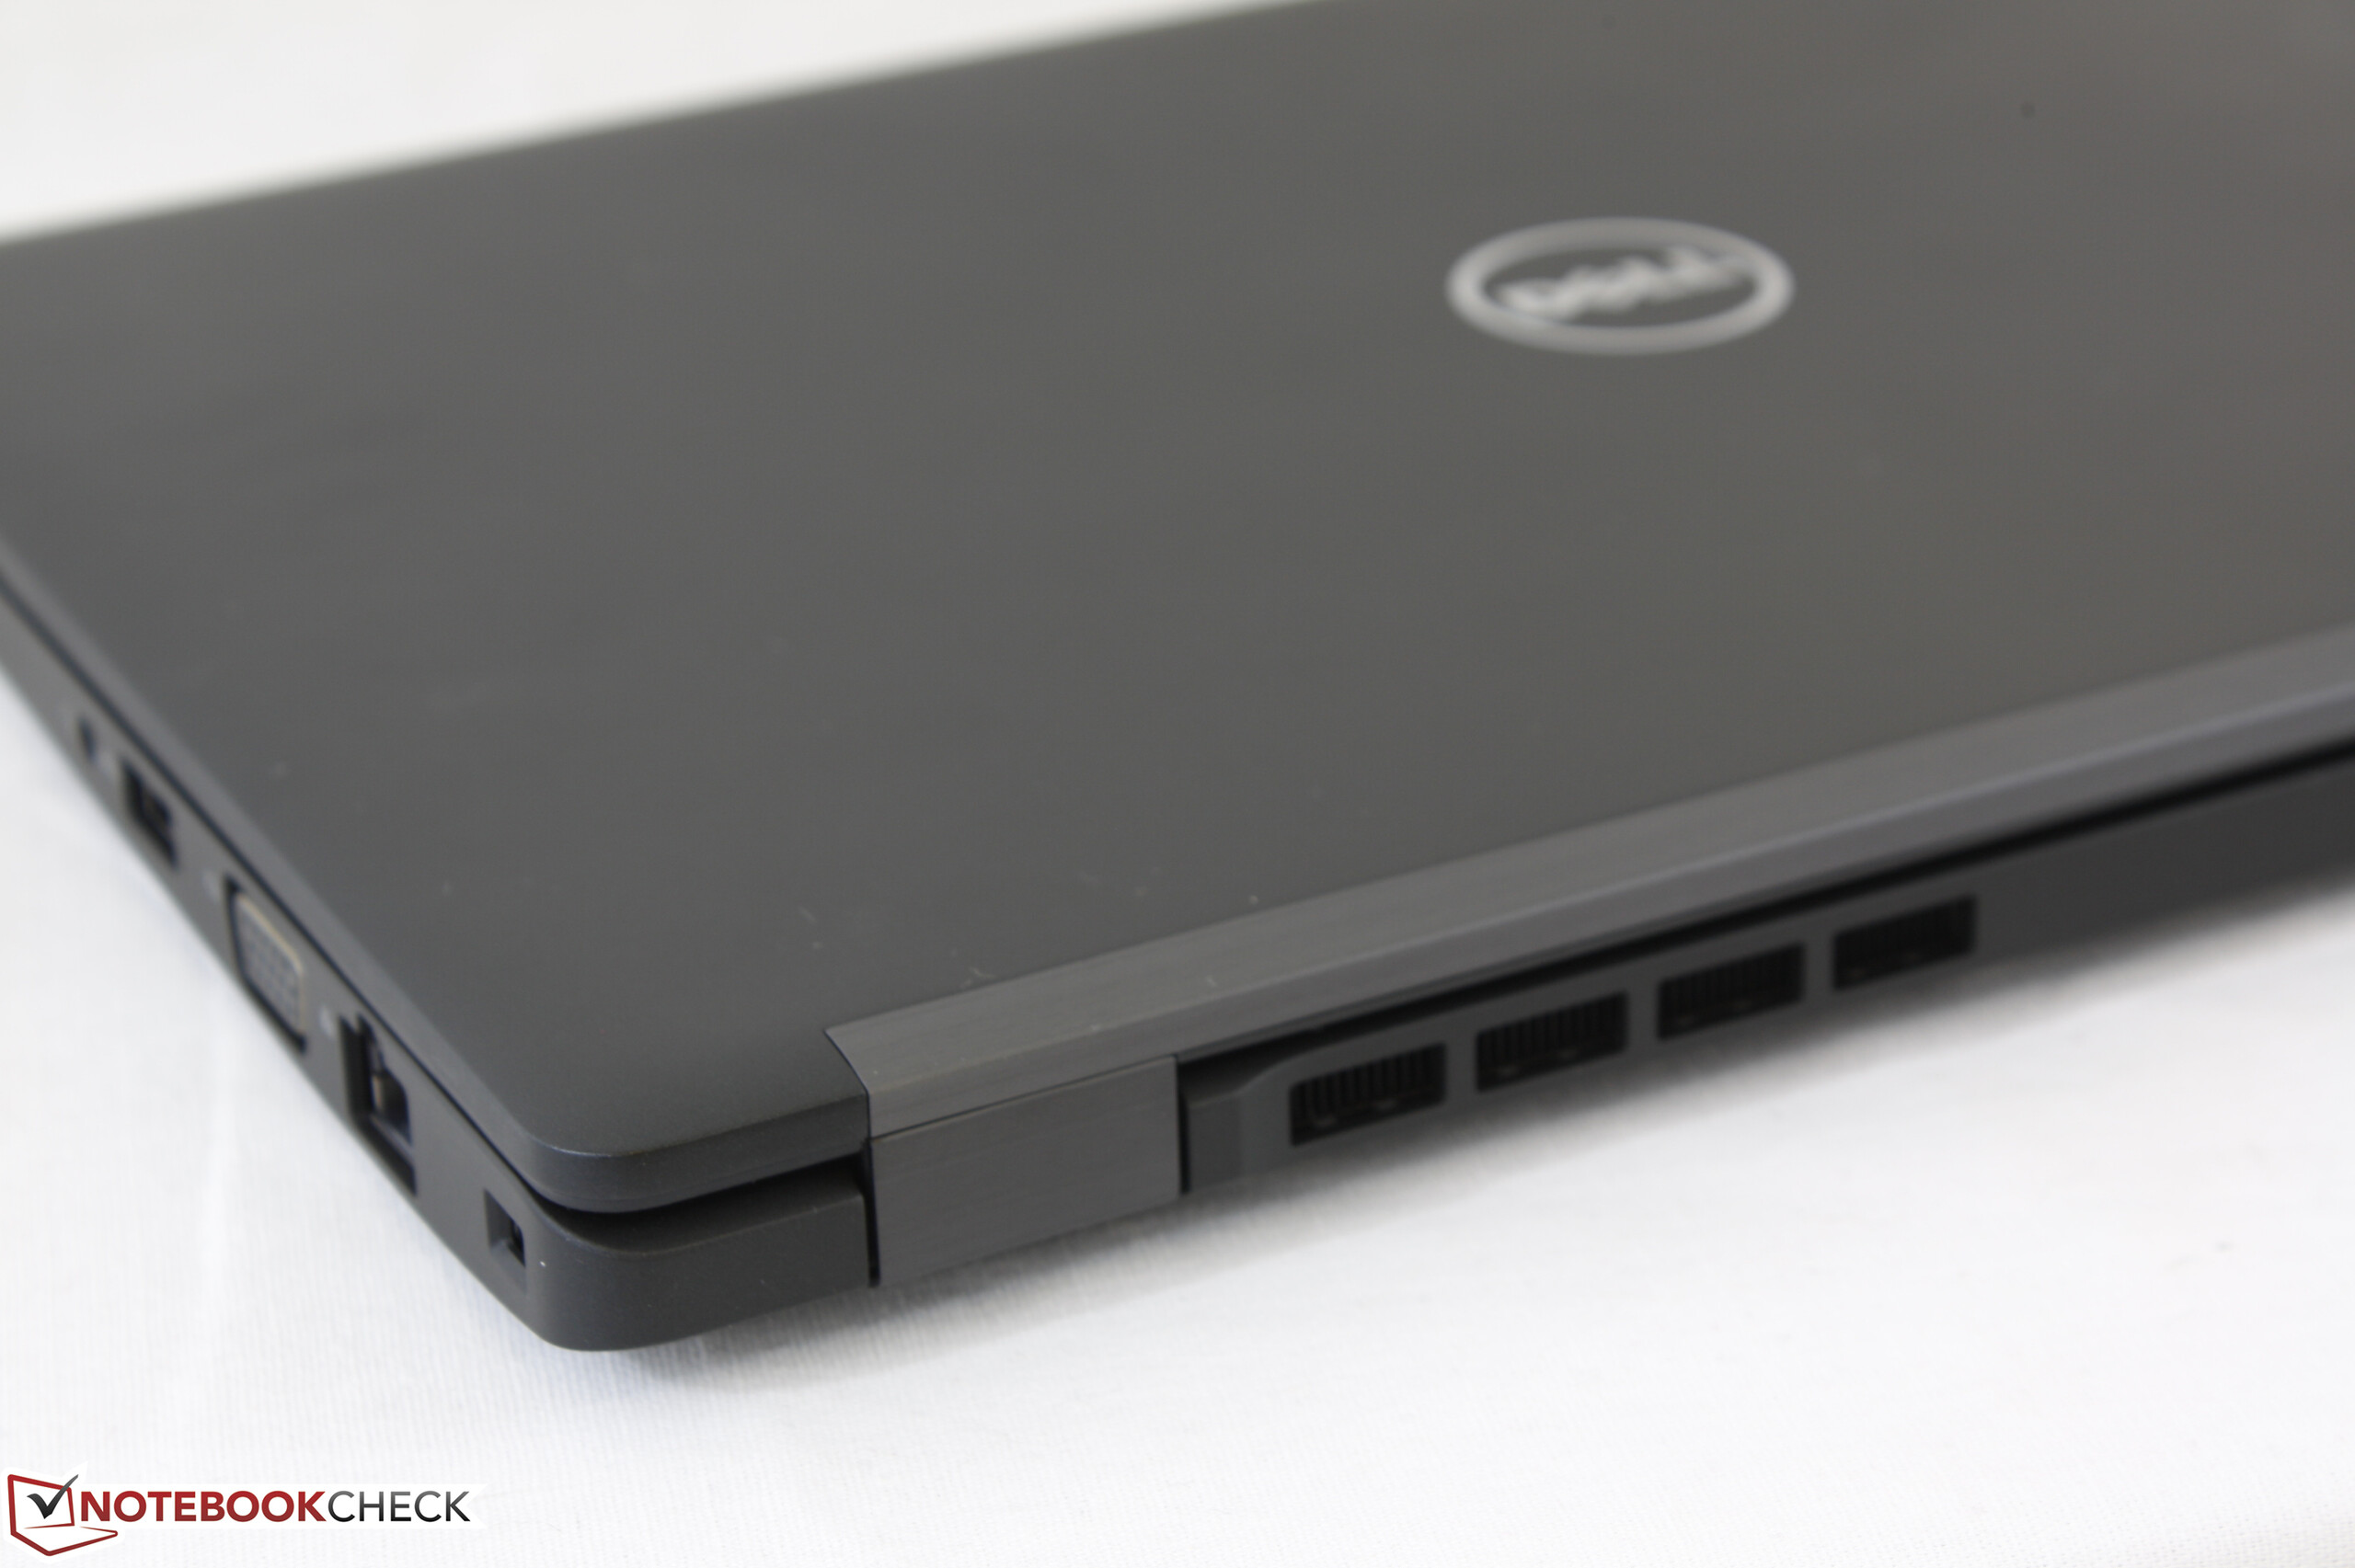
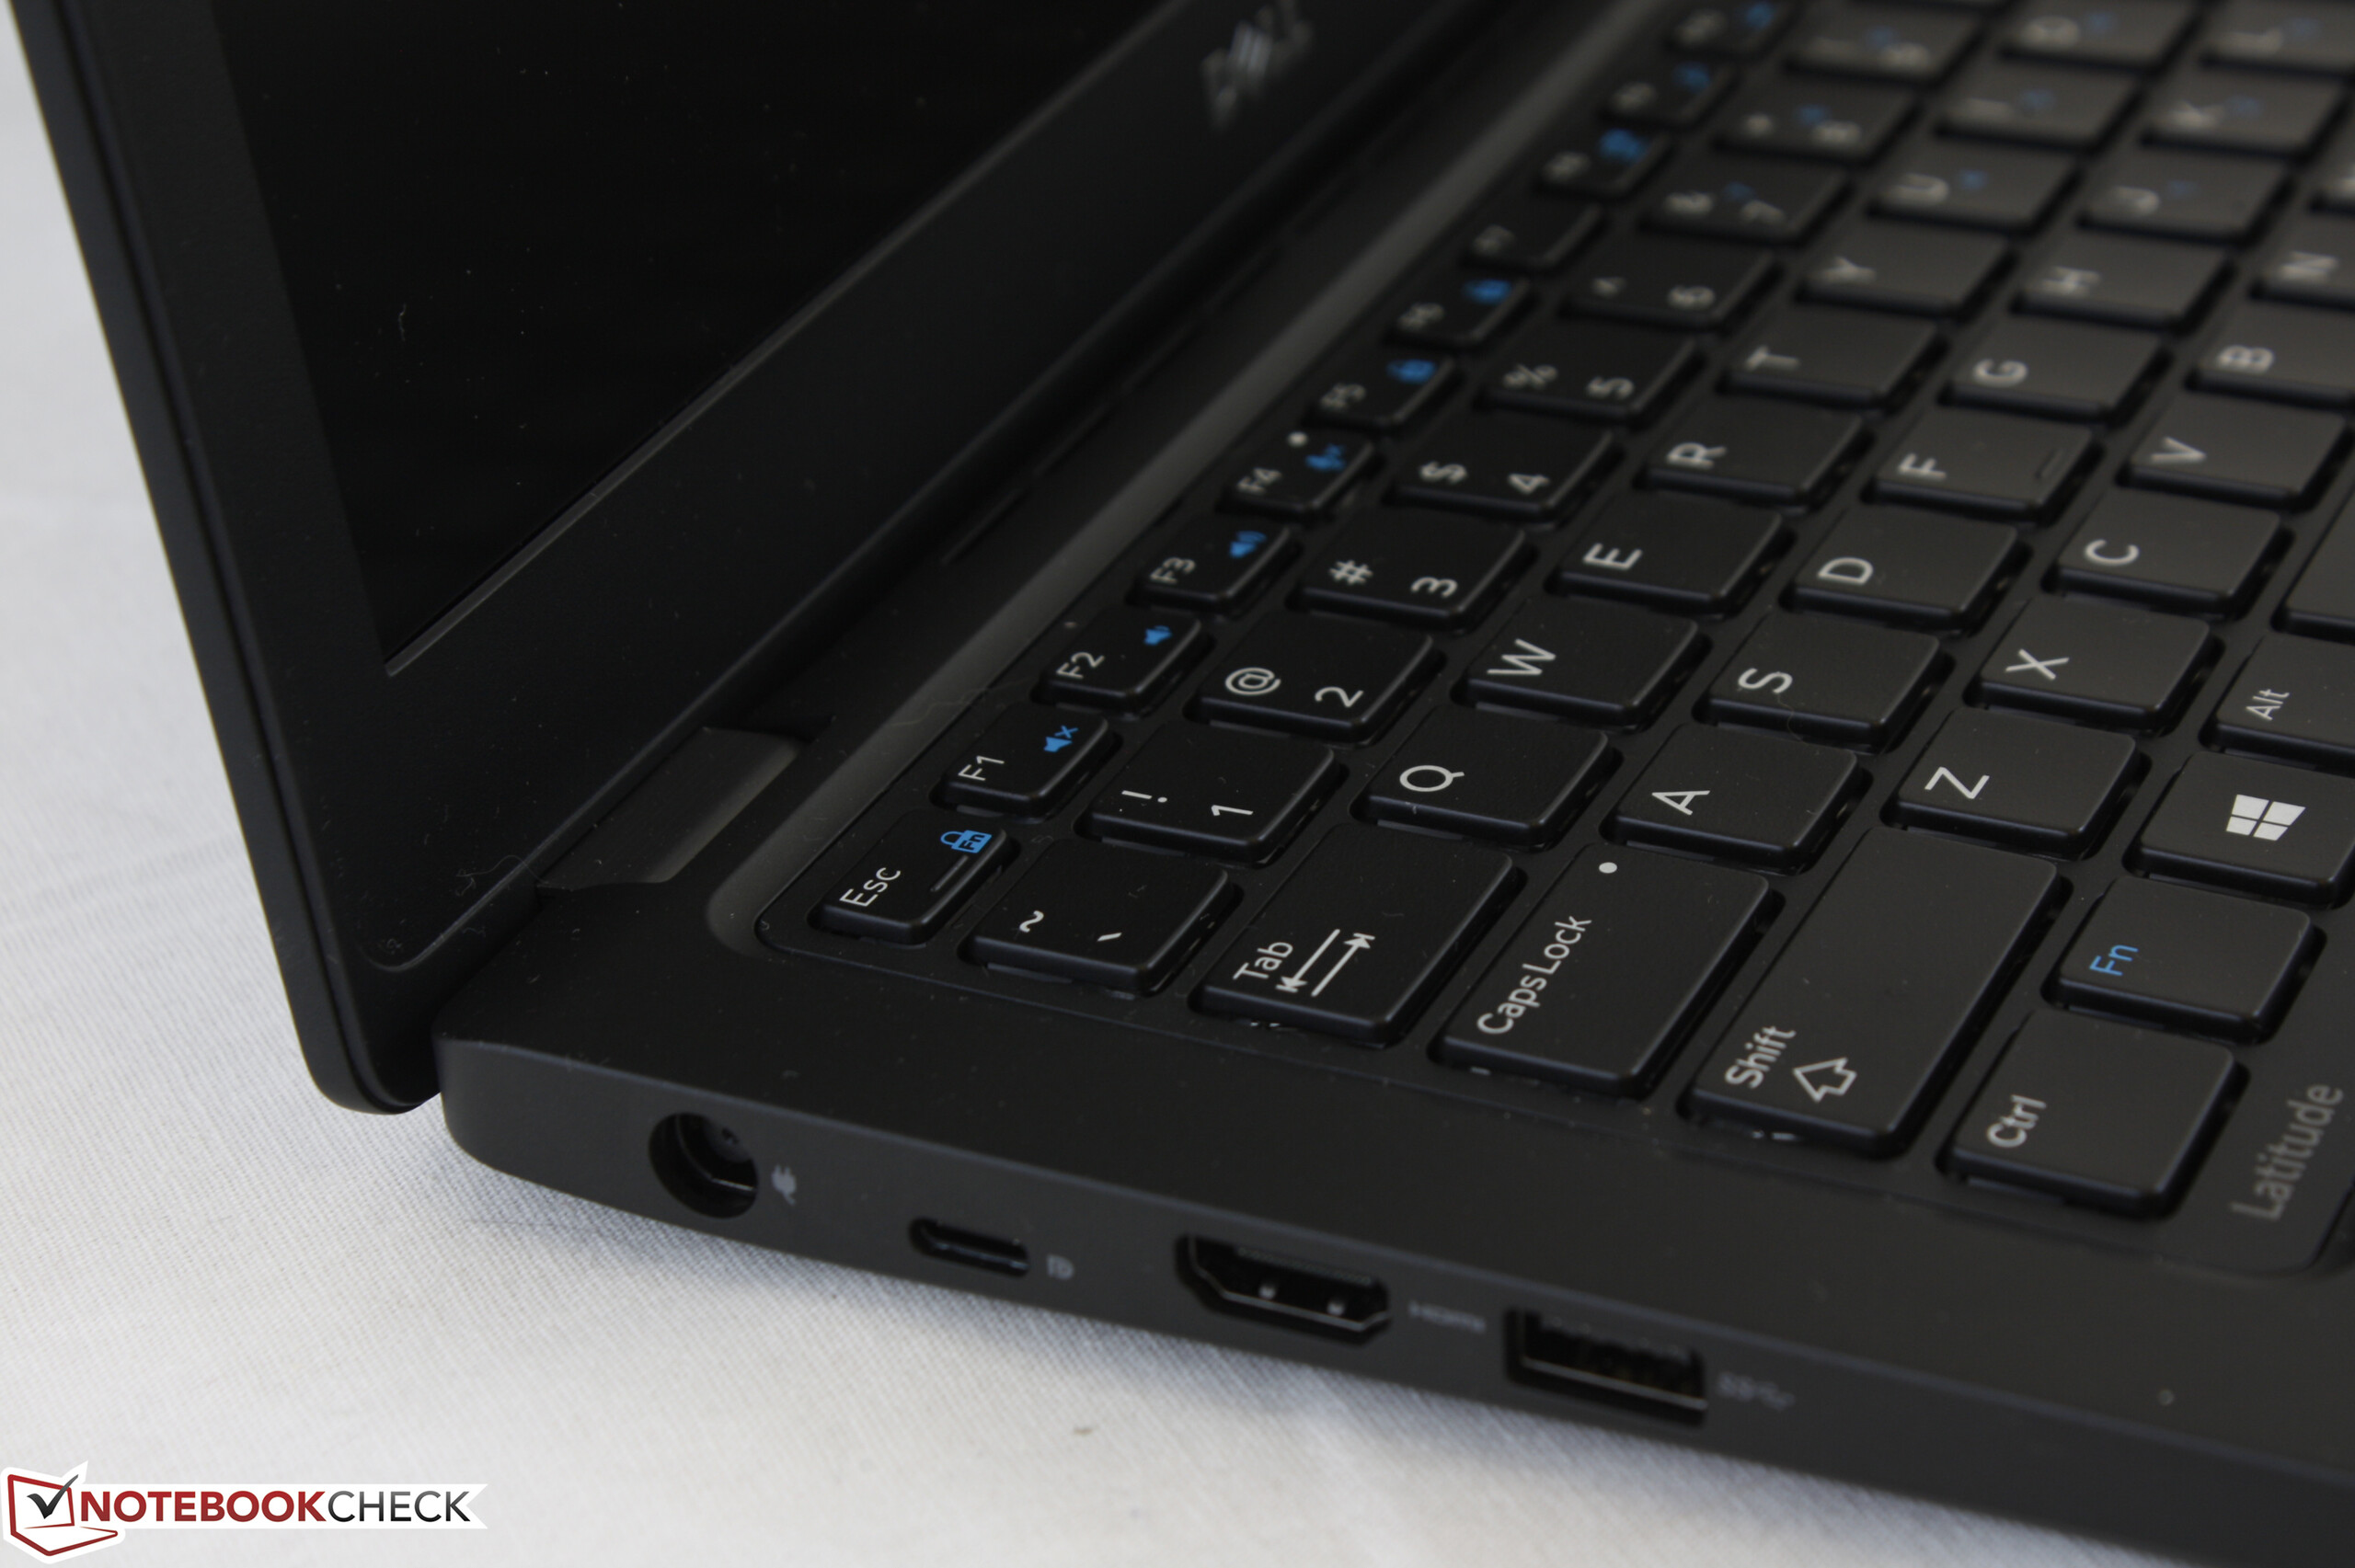
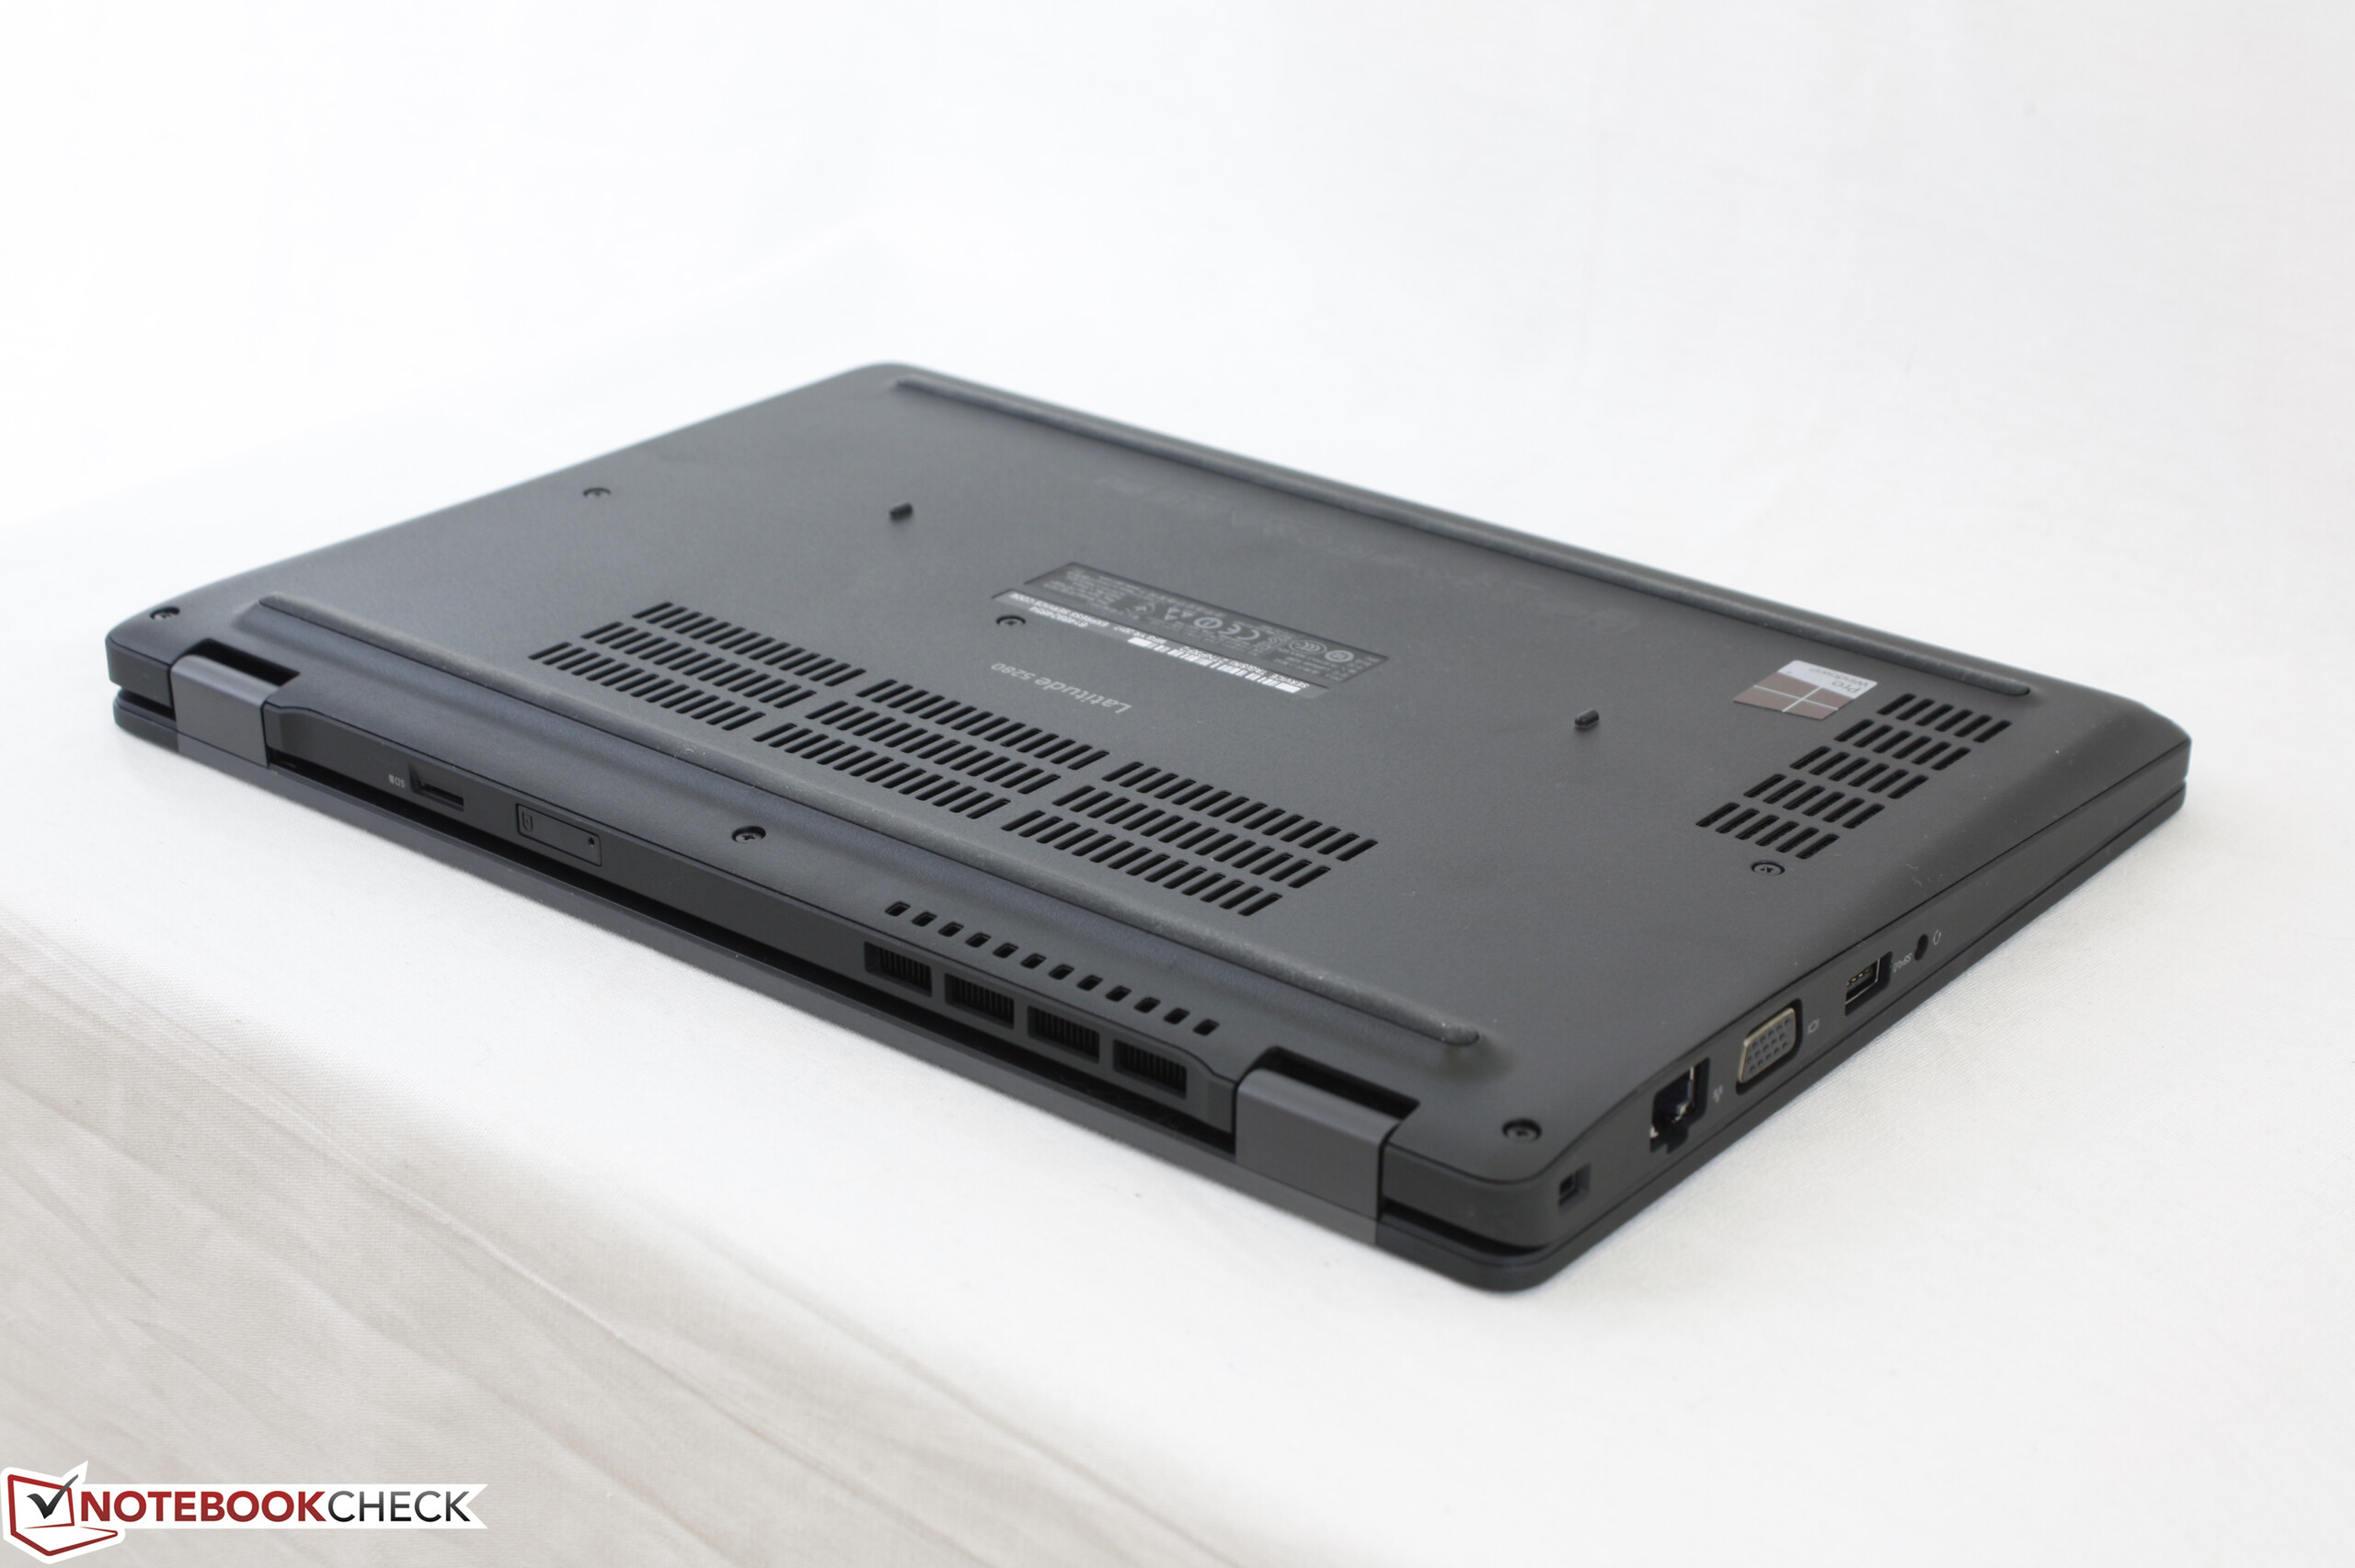
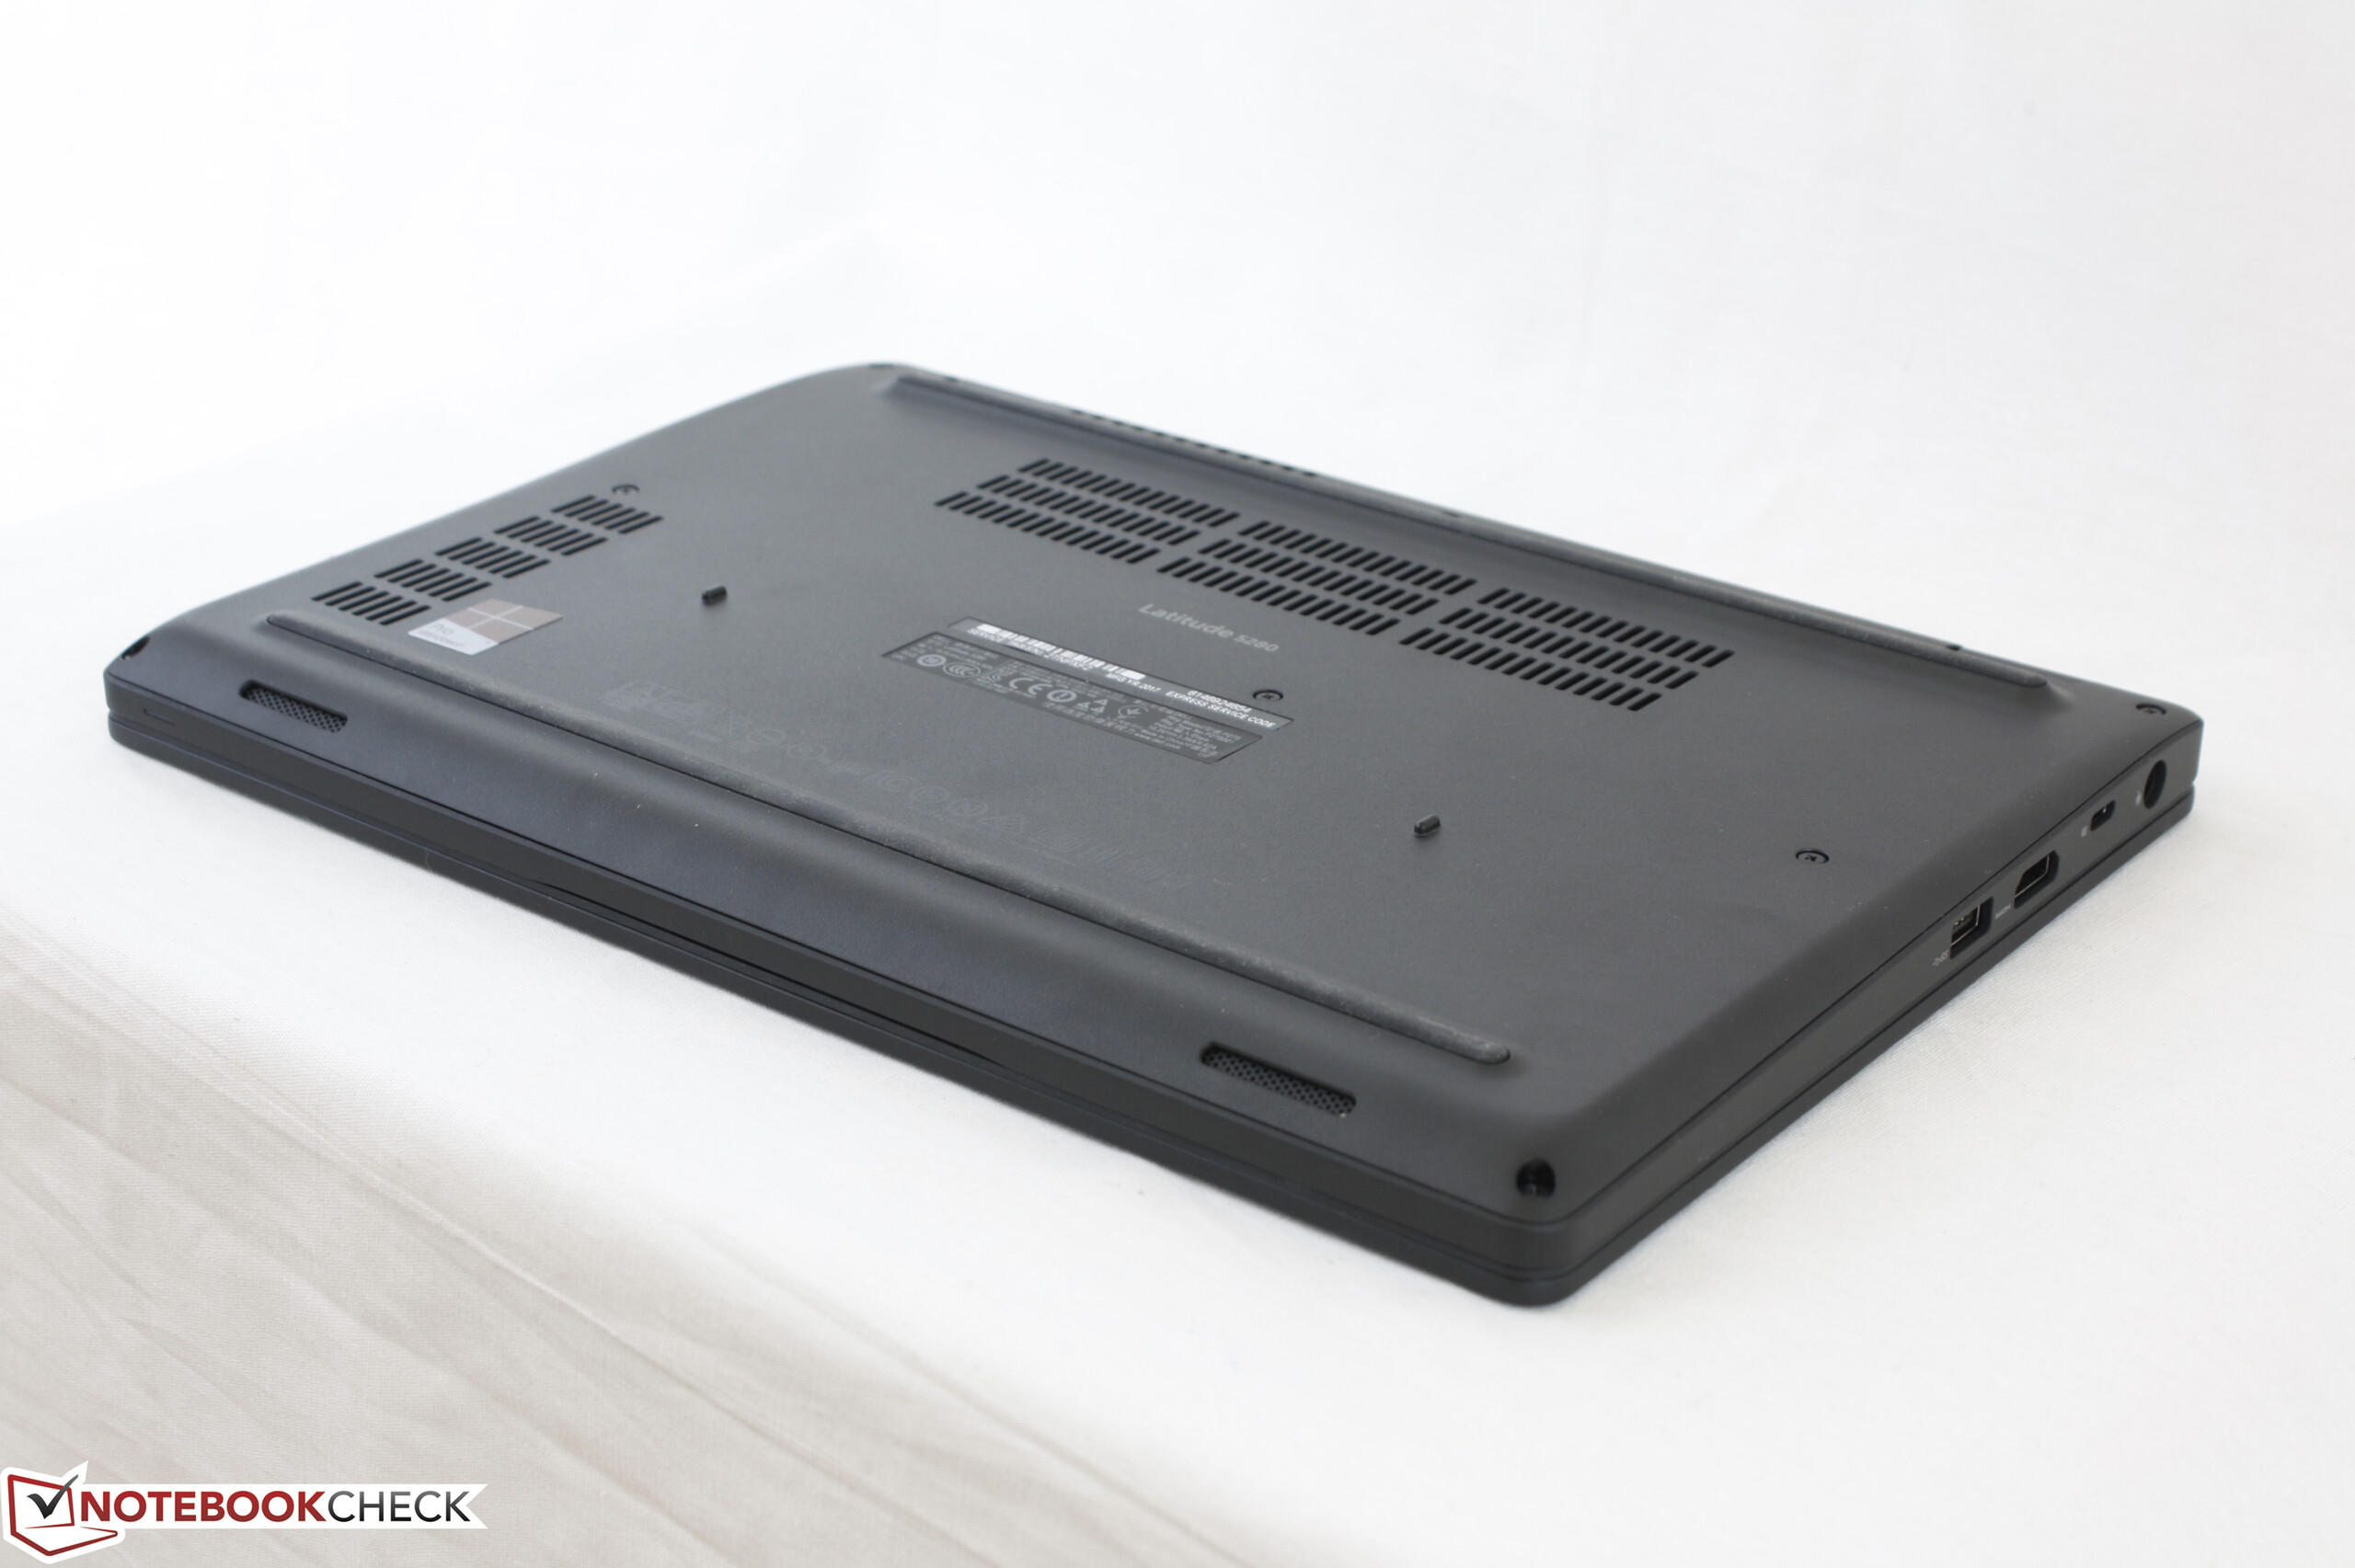
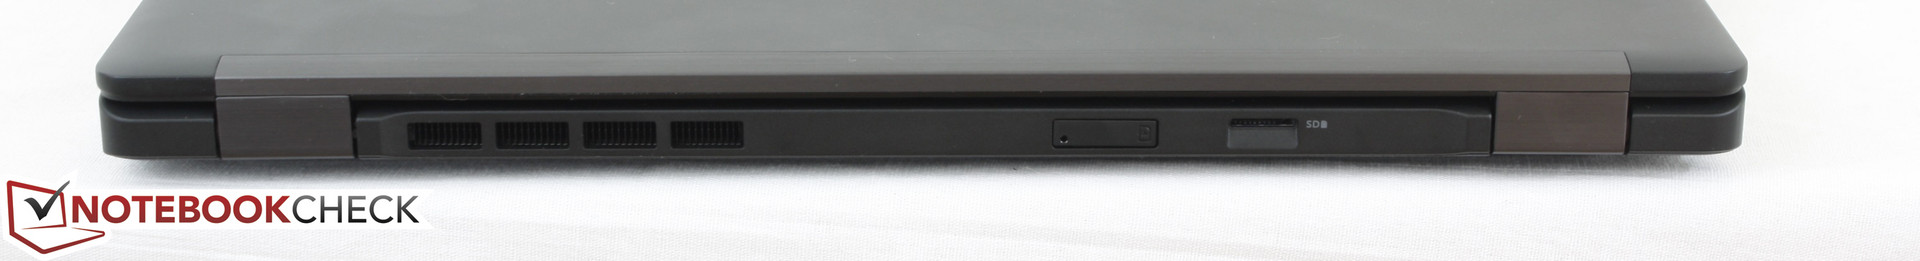
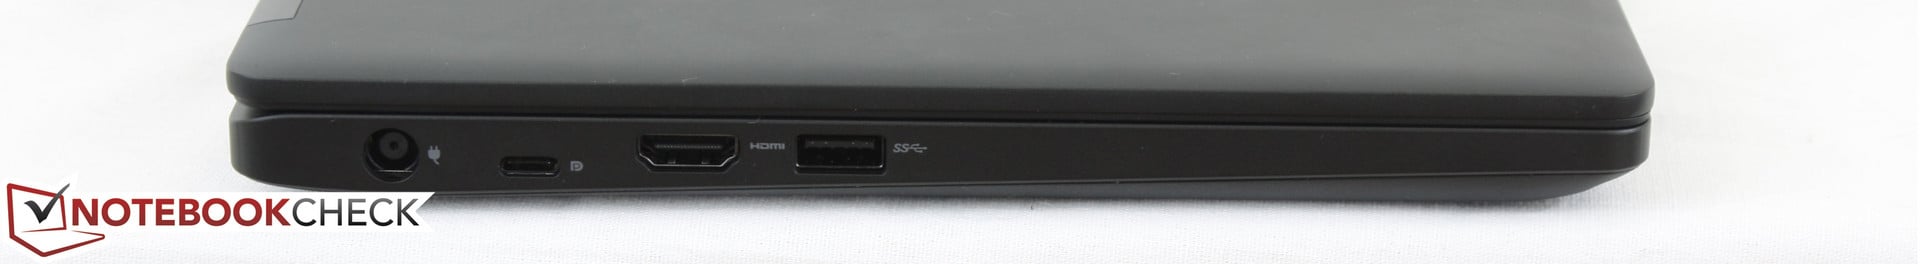
Um ponto de venda importante da maioria dos portáteis de negócios é a capacidade de conectar facilmente estações docking ou baterias externas. Agora que a série Latitude 5280/5480/5580 deixou de lado o E-Port, o Thunderbolt 3 está se tornando ainda mais crucial para suportar recursos adicionais. Infelizmente o Latitude 5280 carece de ambos e, consequentemente, é menos versátil do que o 5480 e o 5580, embora seja menor e mais portátil. Além disso, a ventoinha do sistema está sempre ativa, o qual achamos desnecessário para um portátil que ostenta apenas processadores classe U.
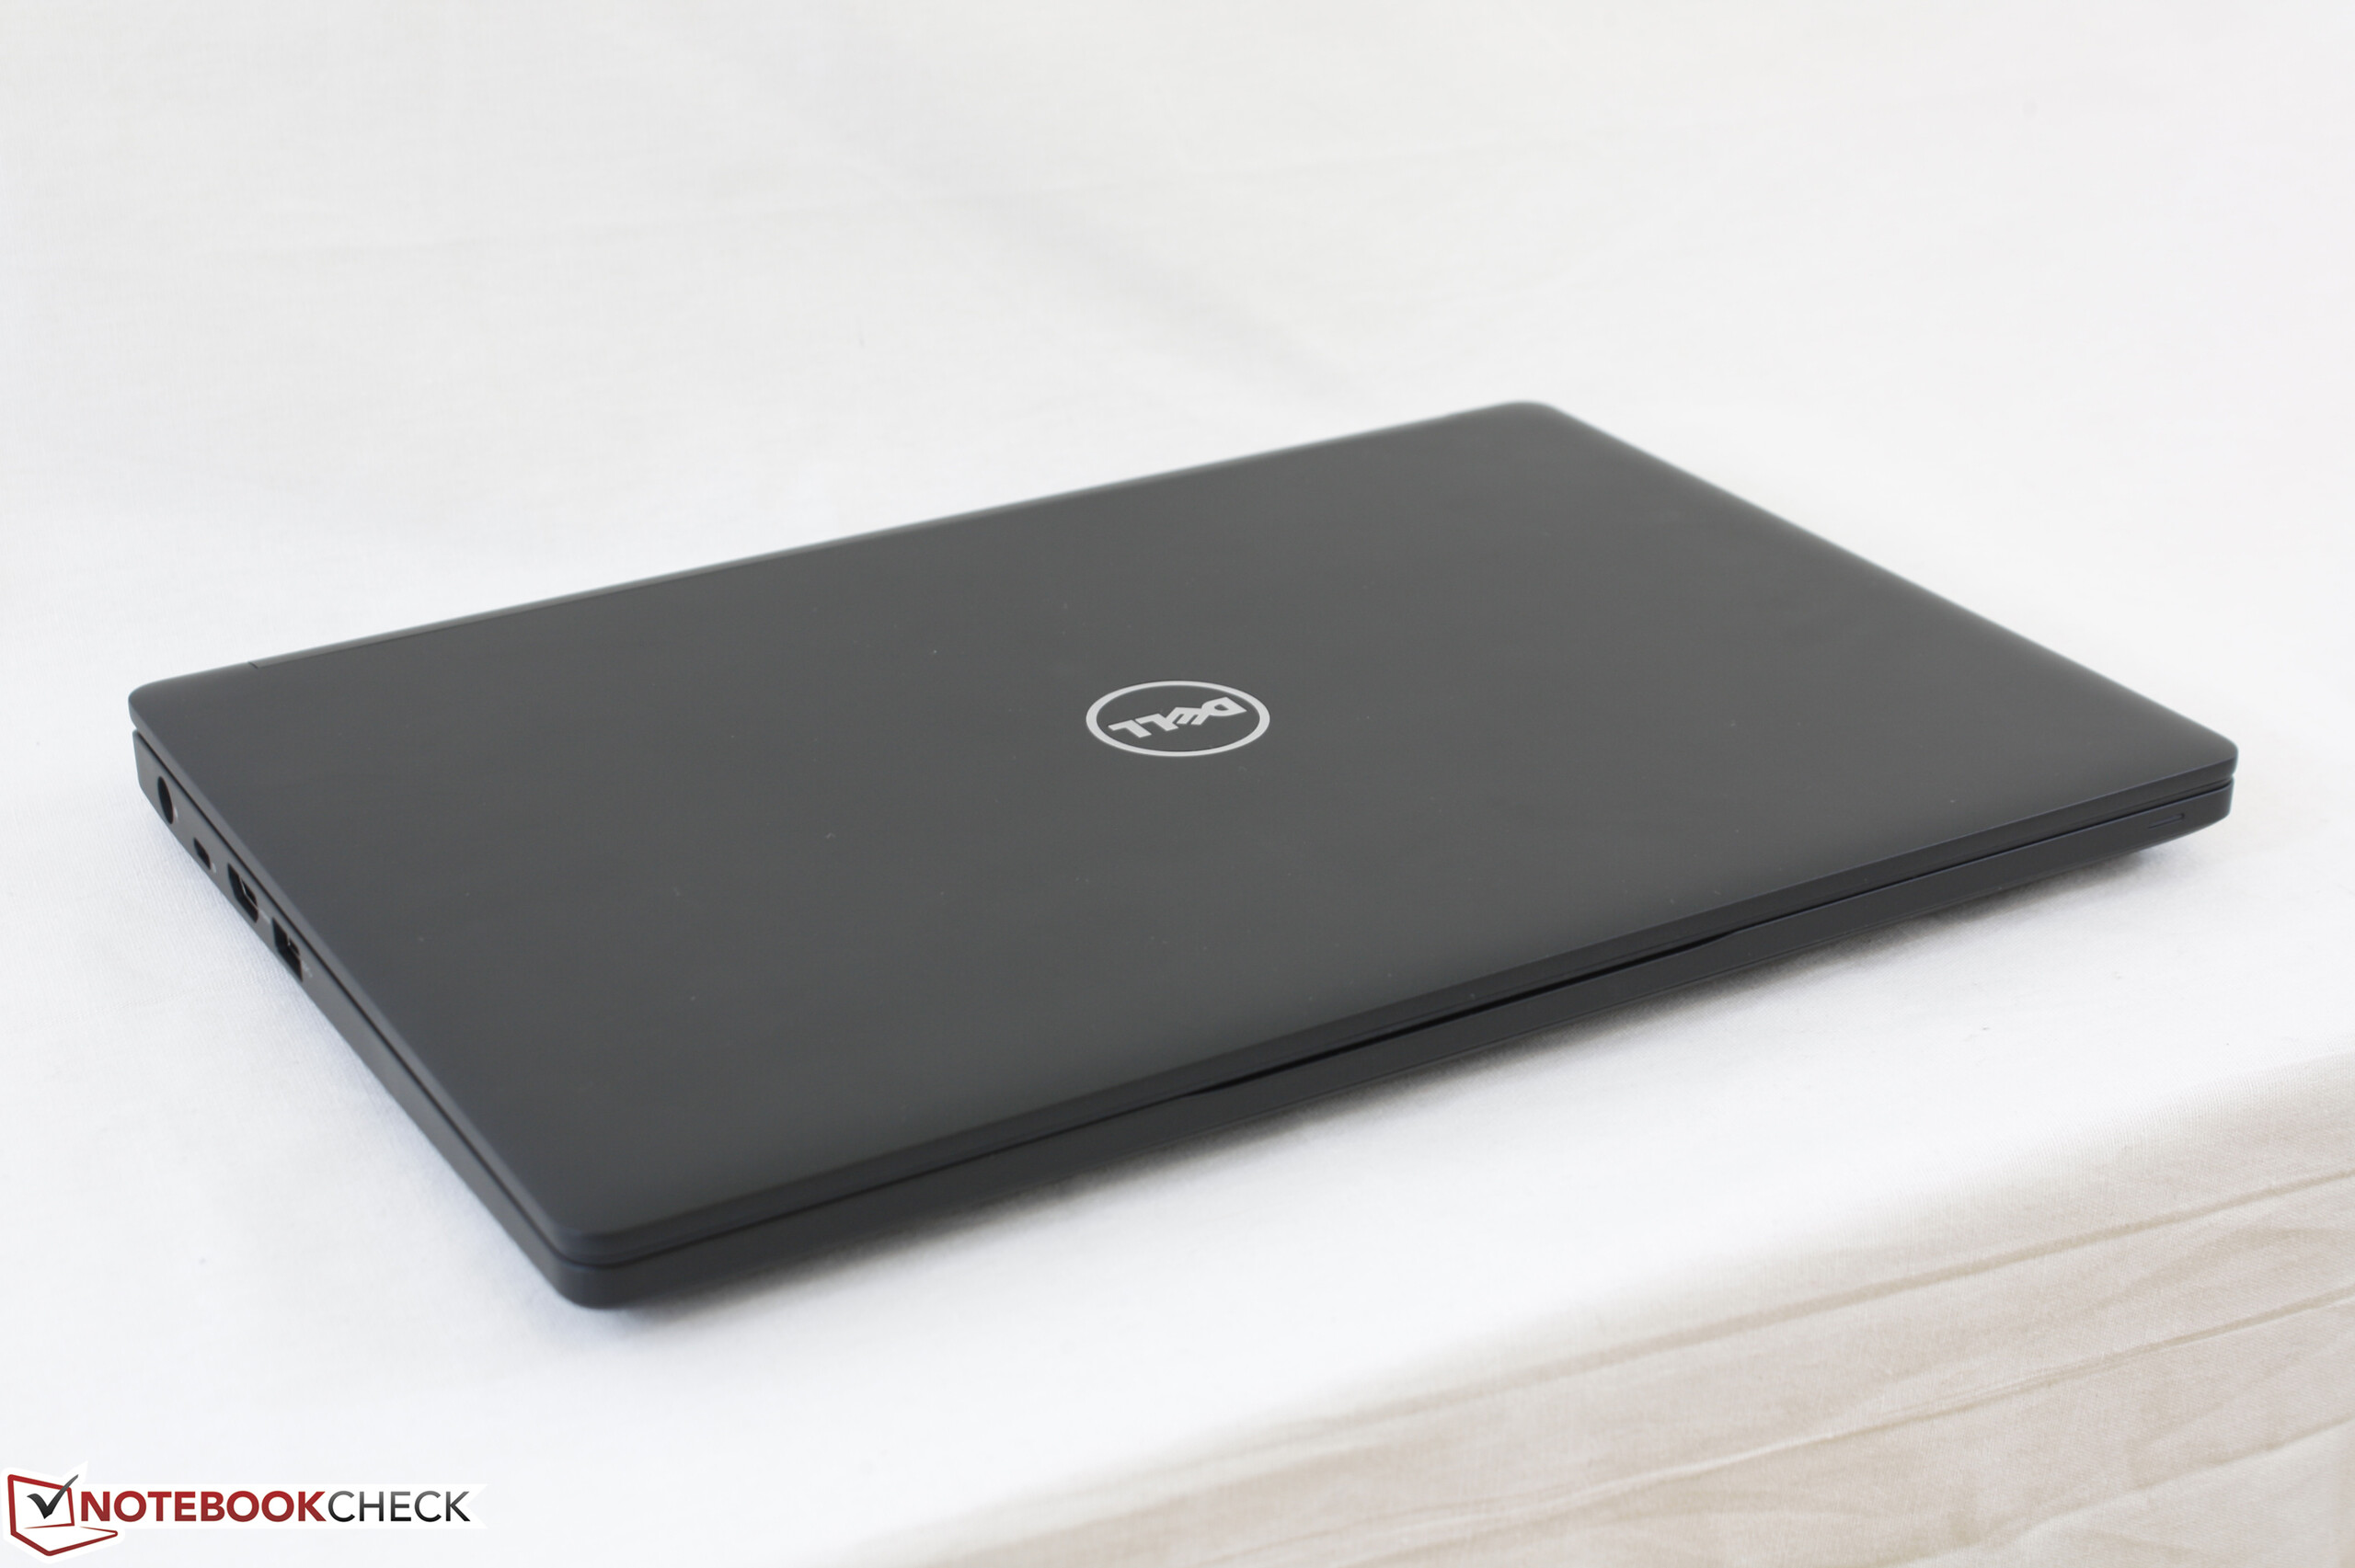
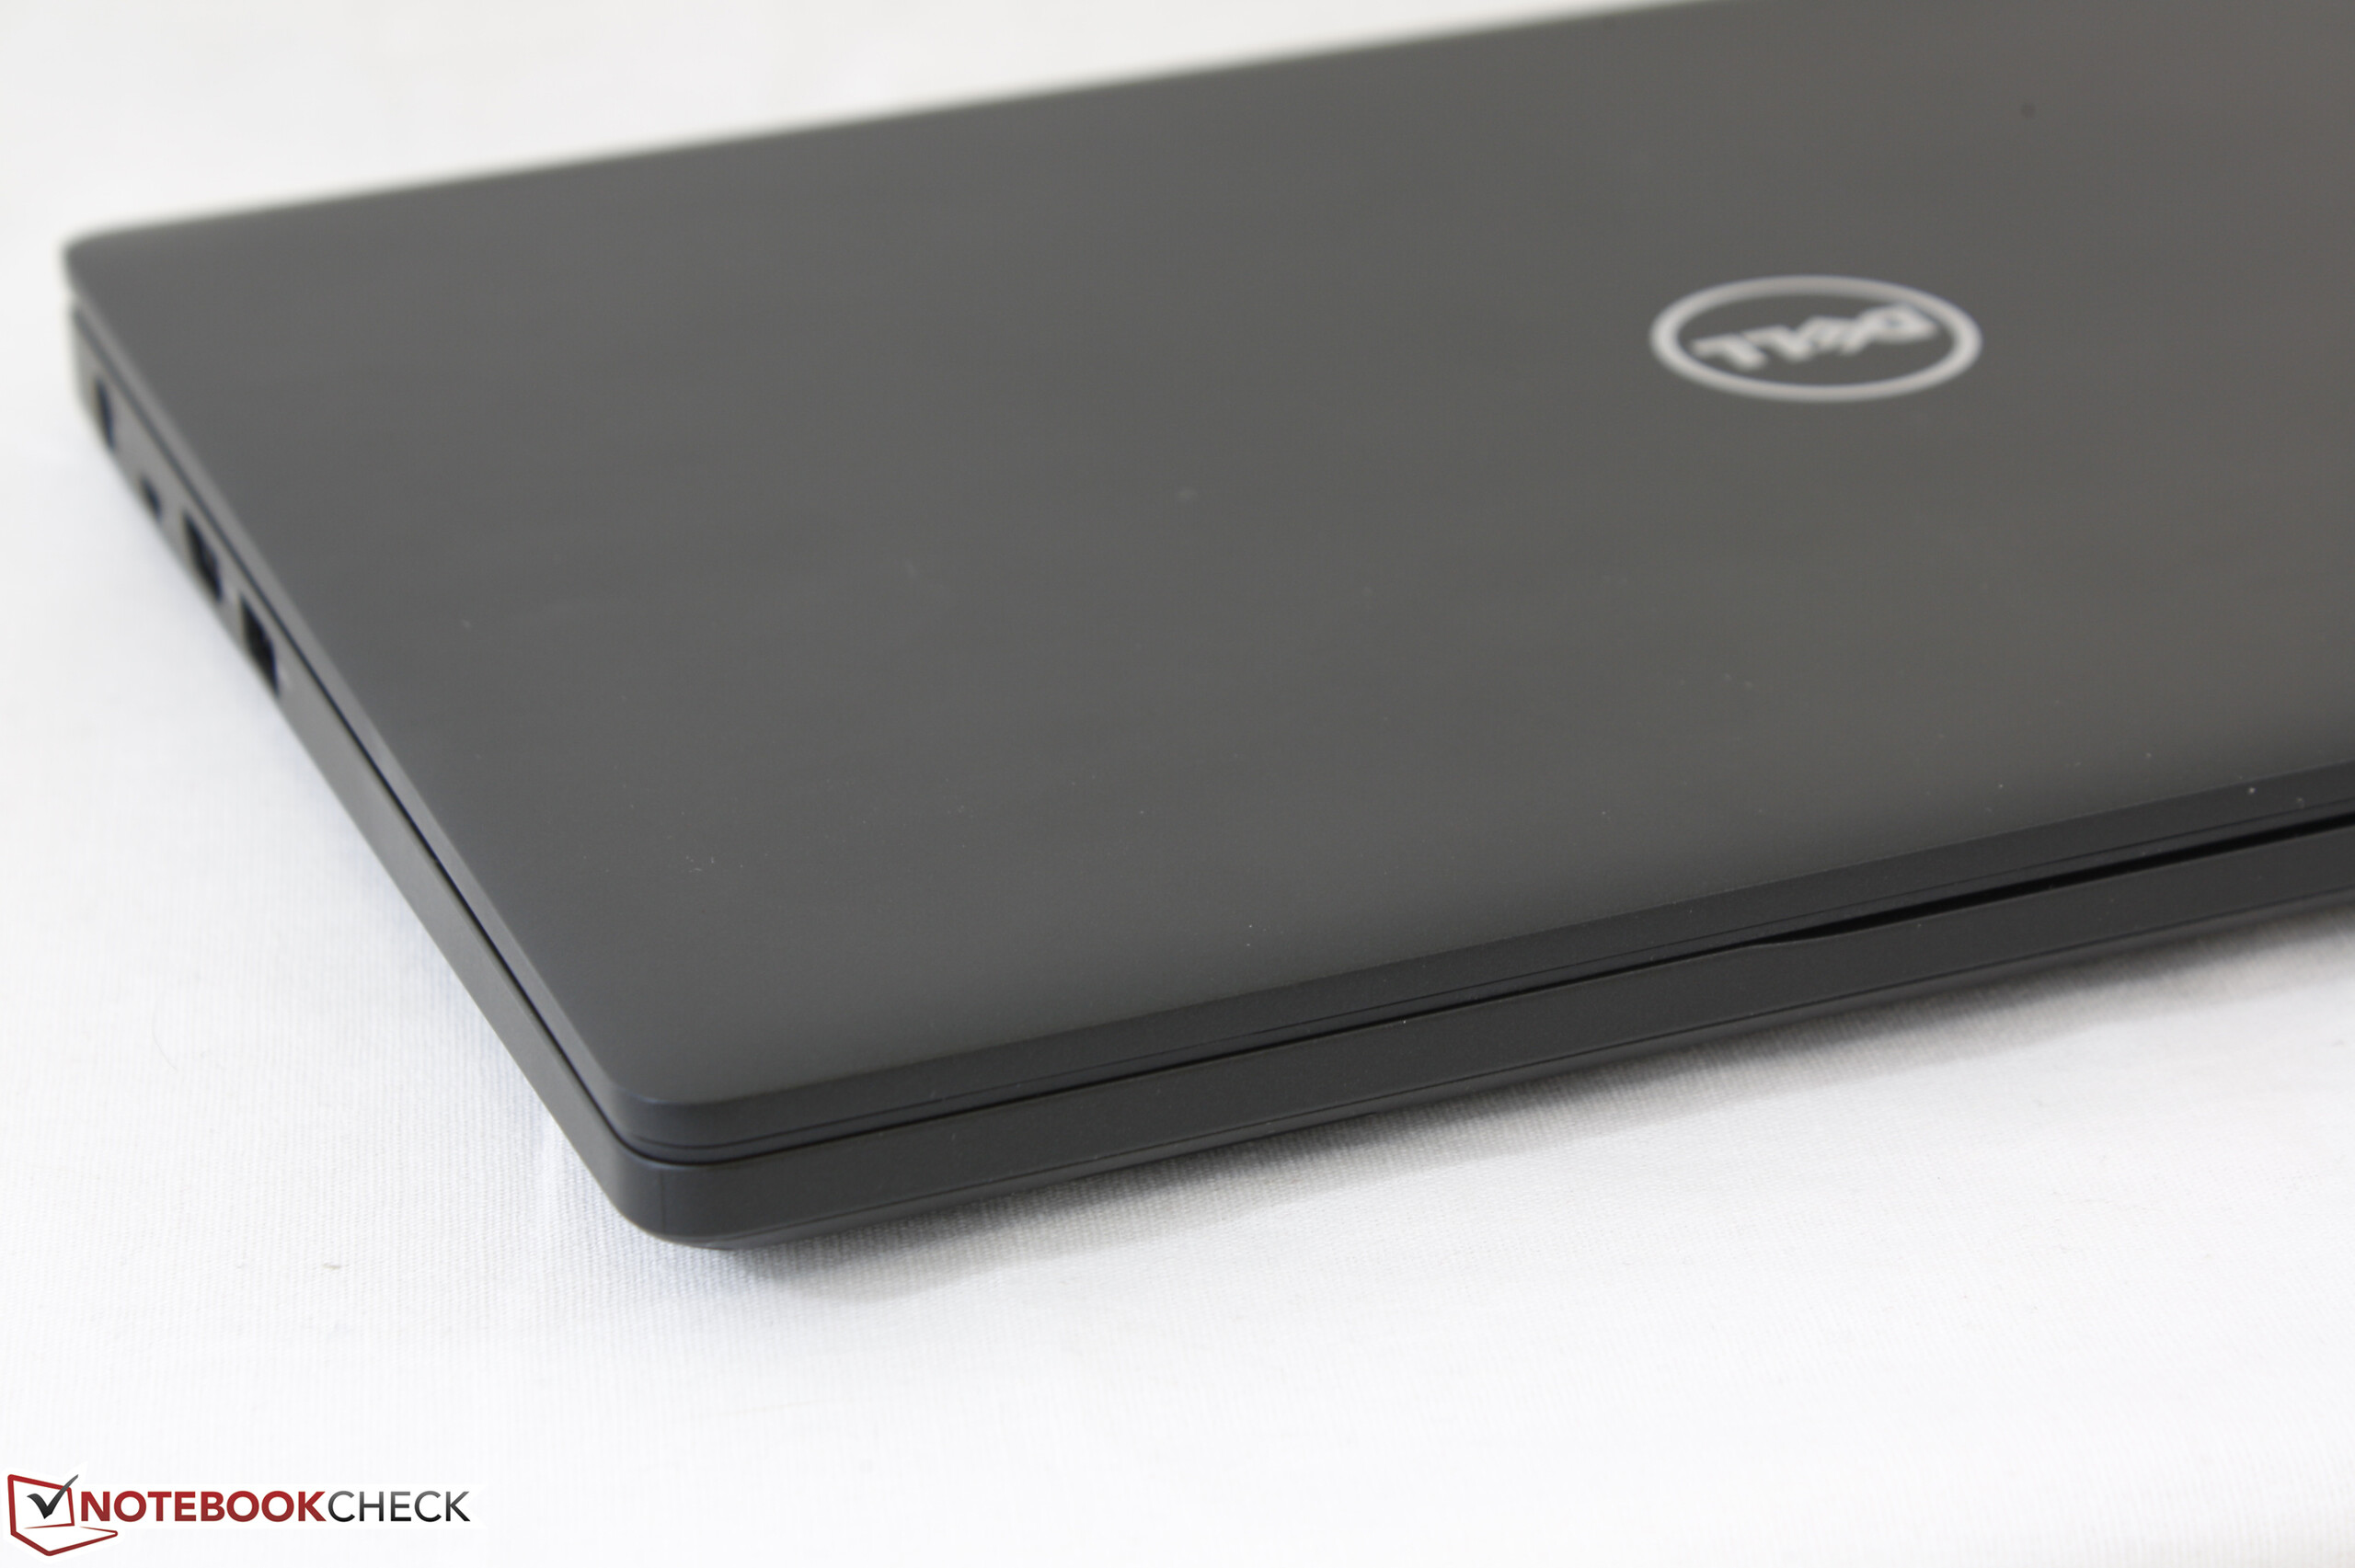
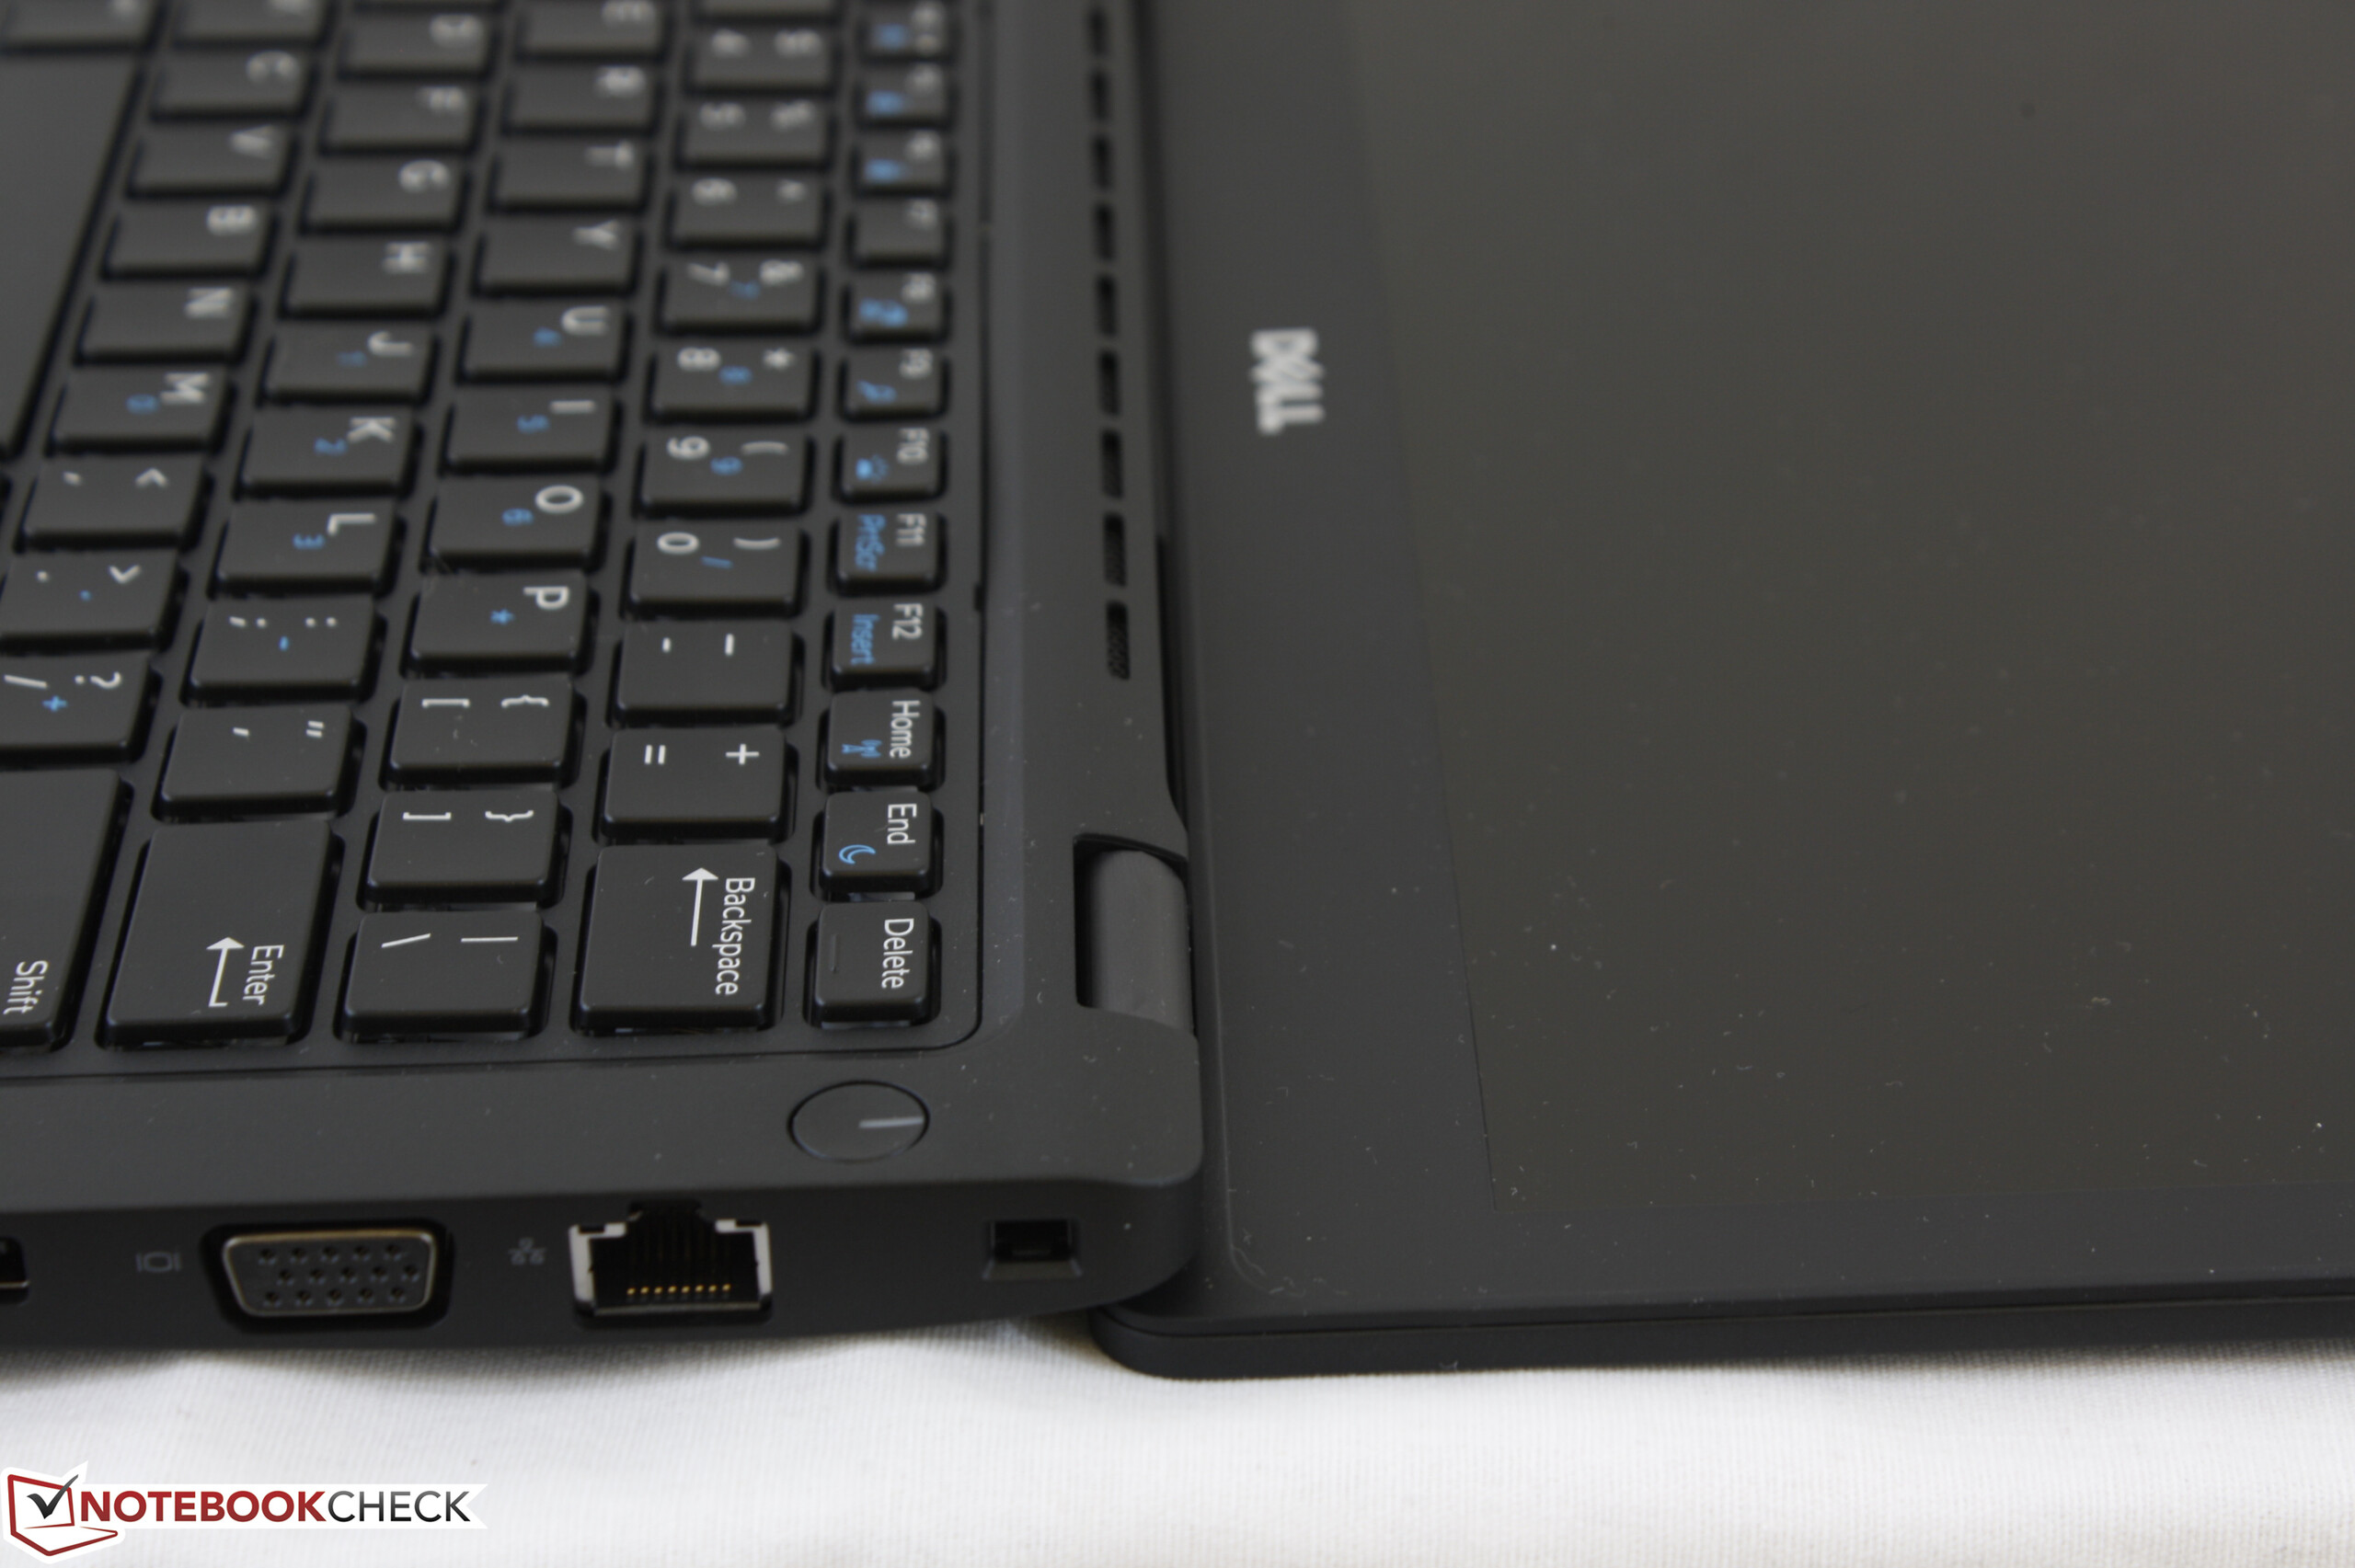
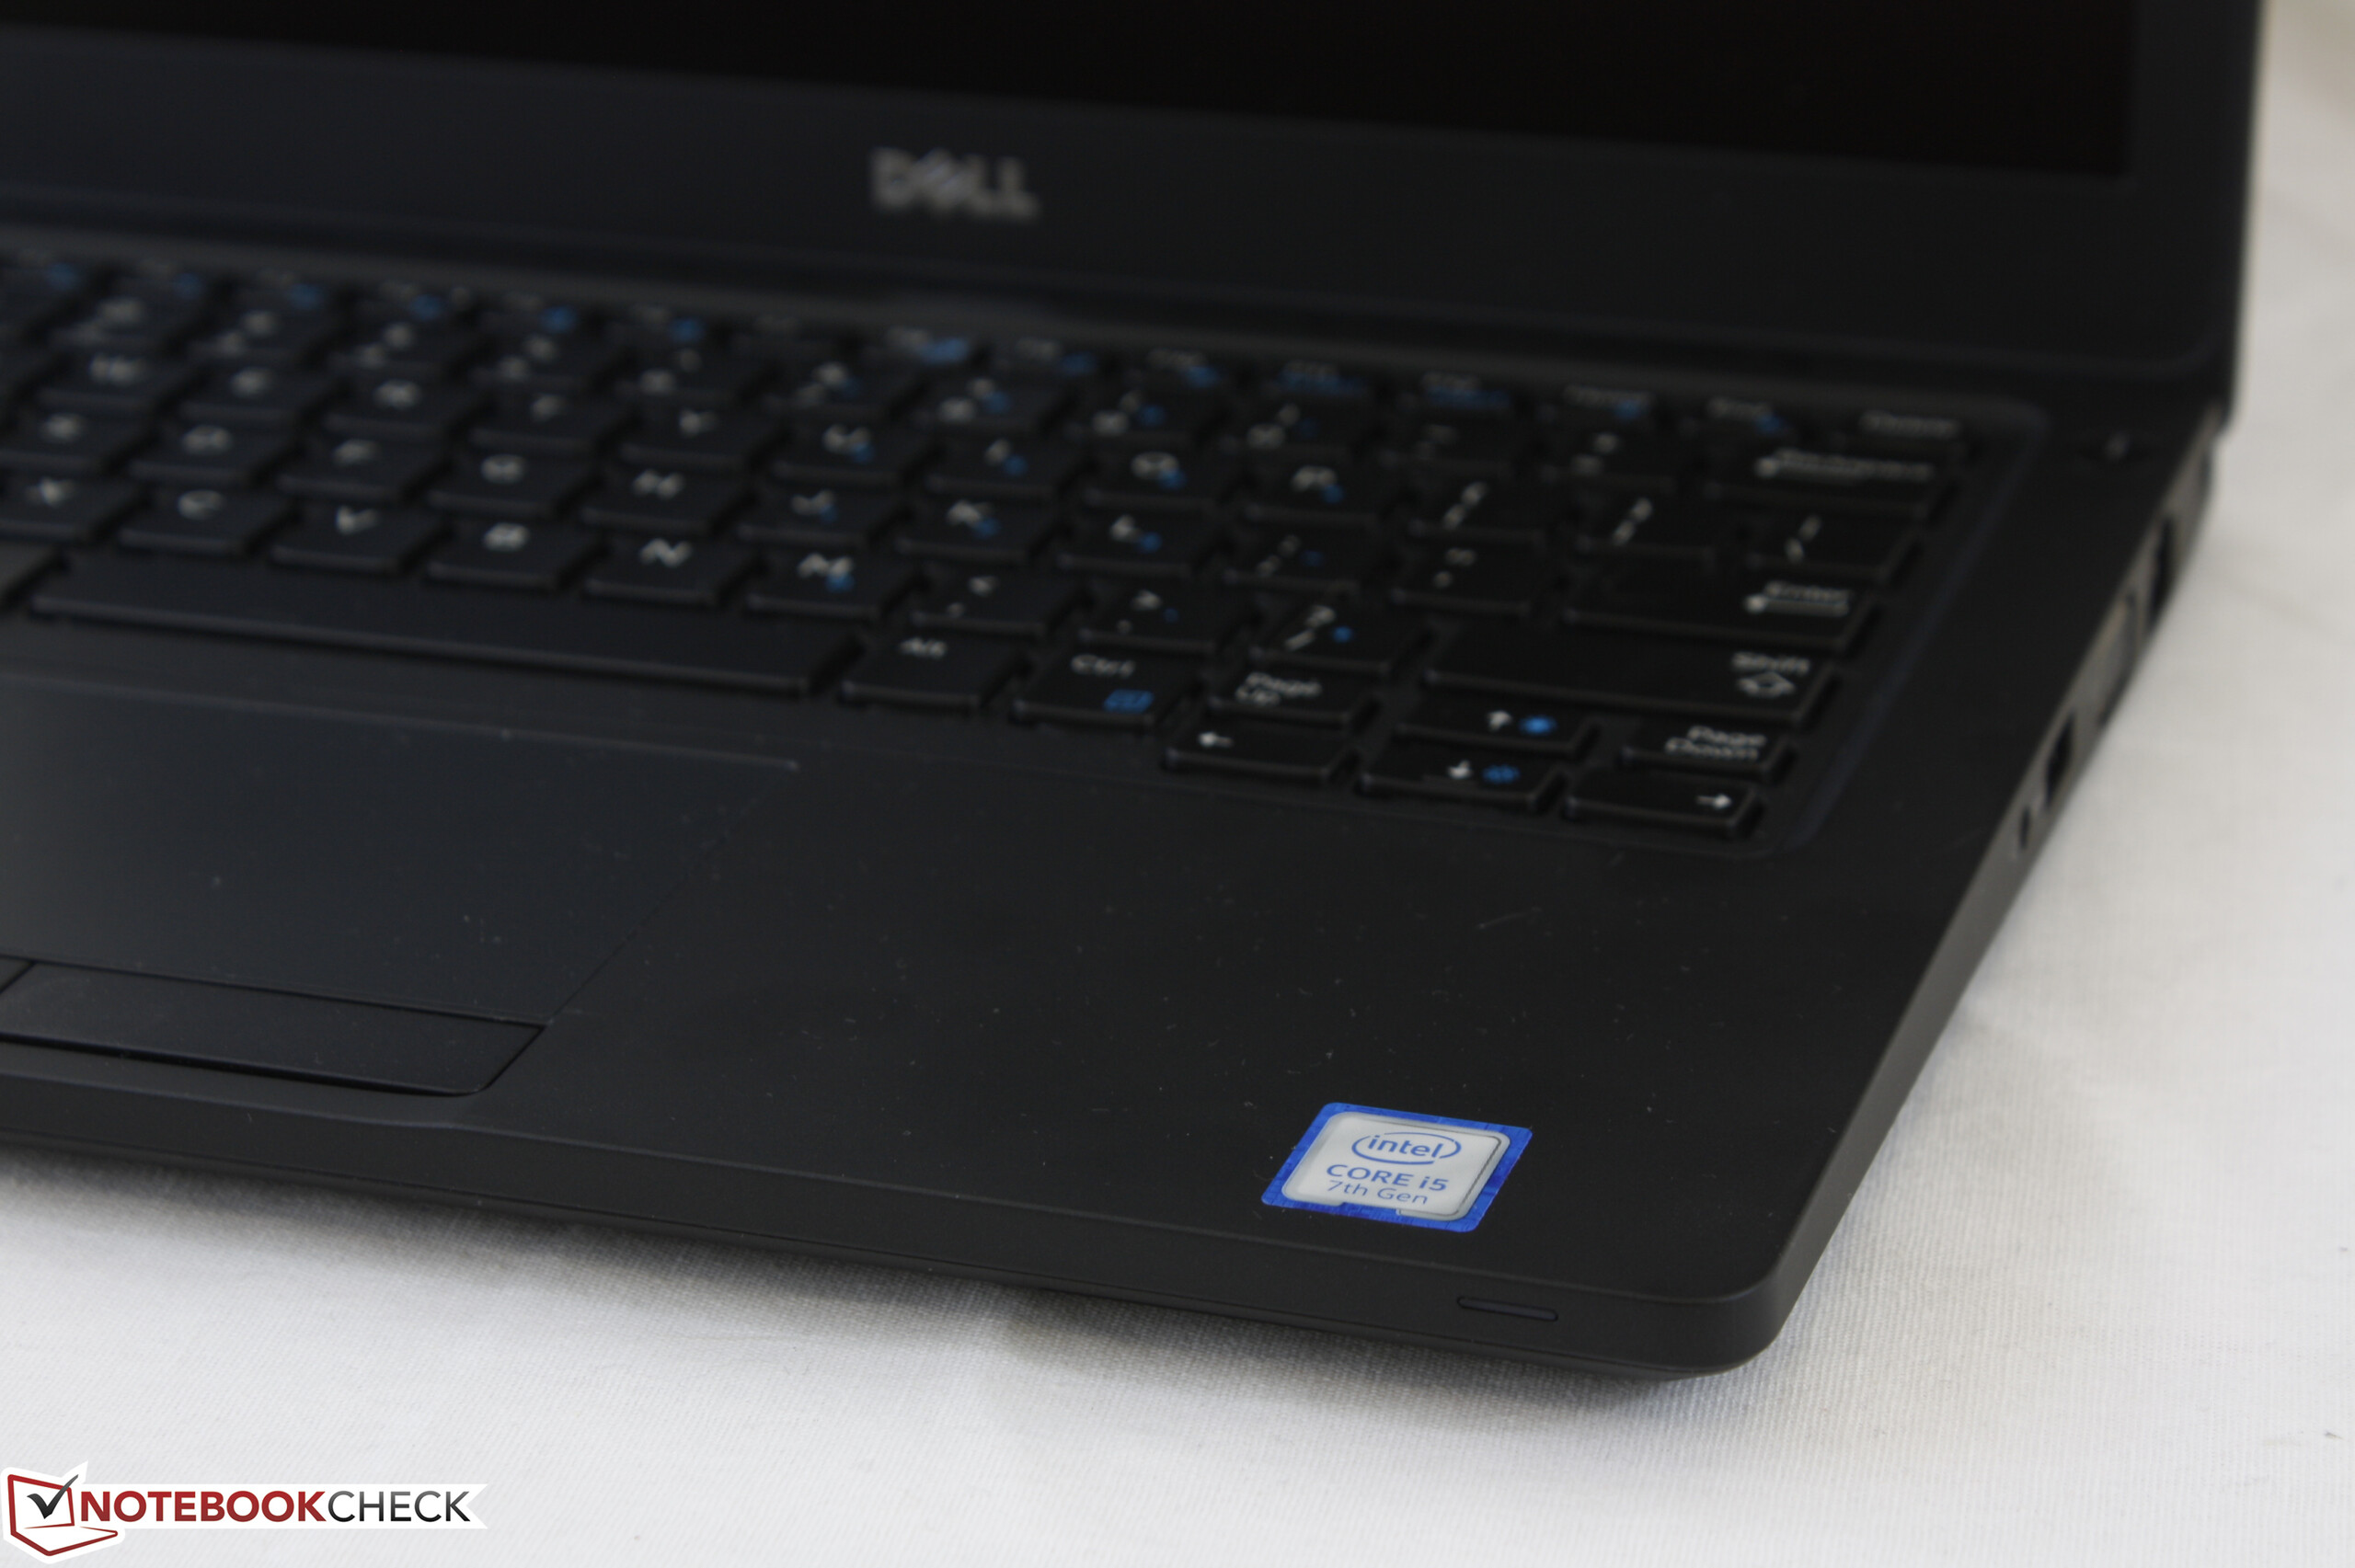
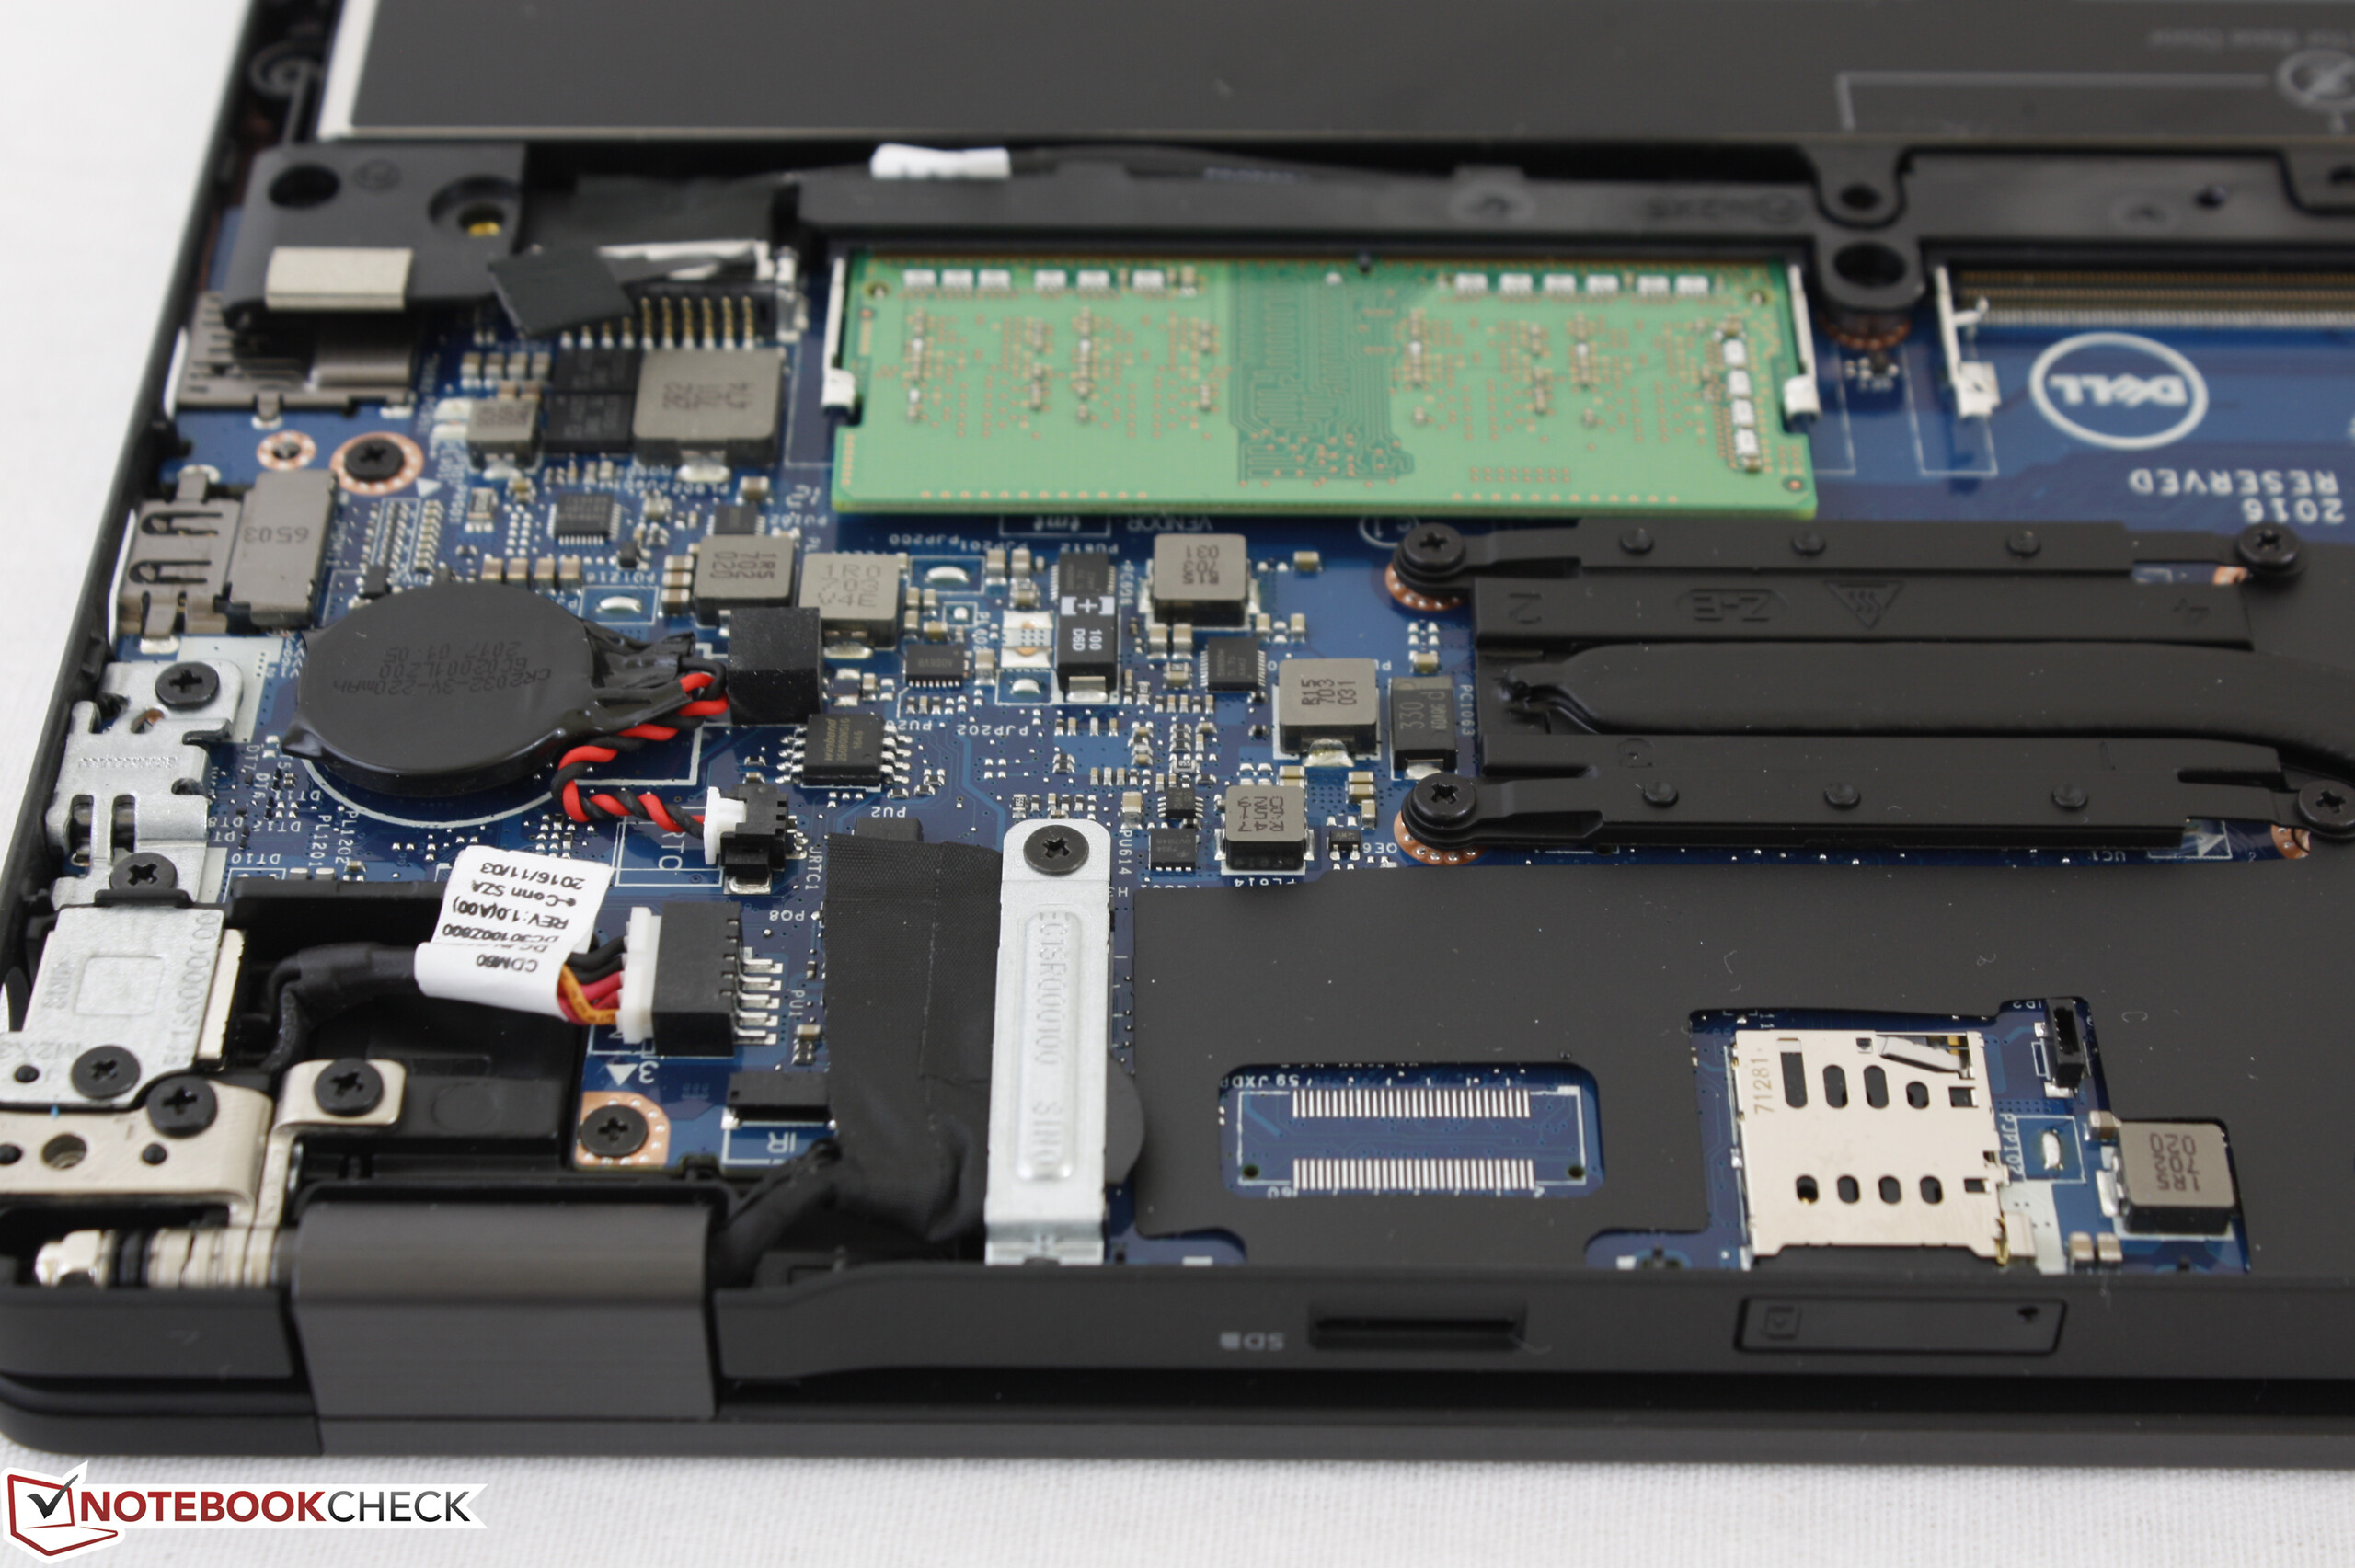
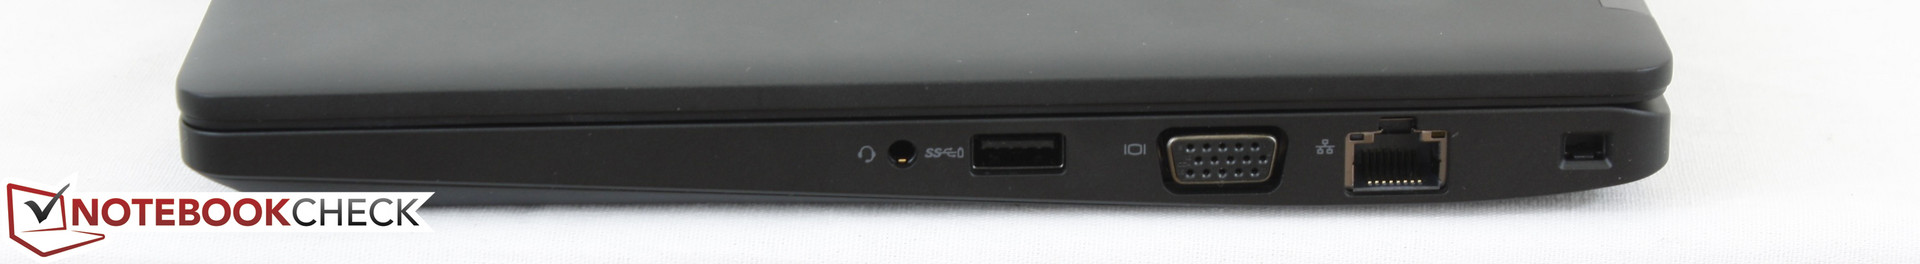
Se as desvantagens acima não forem um obstáculo, no entanto, então o 5280 se destaca na maioria das outras categorias. Sua porta USB Type-C ainda será uma saída para DisplayPort de monitores externos e o novo chassi é muito mais leve que o E5270 sem ser notavelmente mais frágil. As durações da bateria já são excelentes na opção de bateria de gama média e preservar as saídas VGA e HDMI deve ser útil em lugares como universidades e da salas de conferência. O desempenho da CPU em particular é impressionante, pois o processador é capaz de manter velocidades máximas do Turbo Boost, mesmo durante cargas de trabalho muito altas.
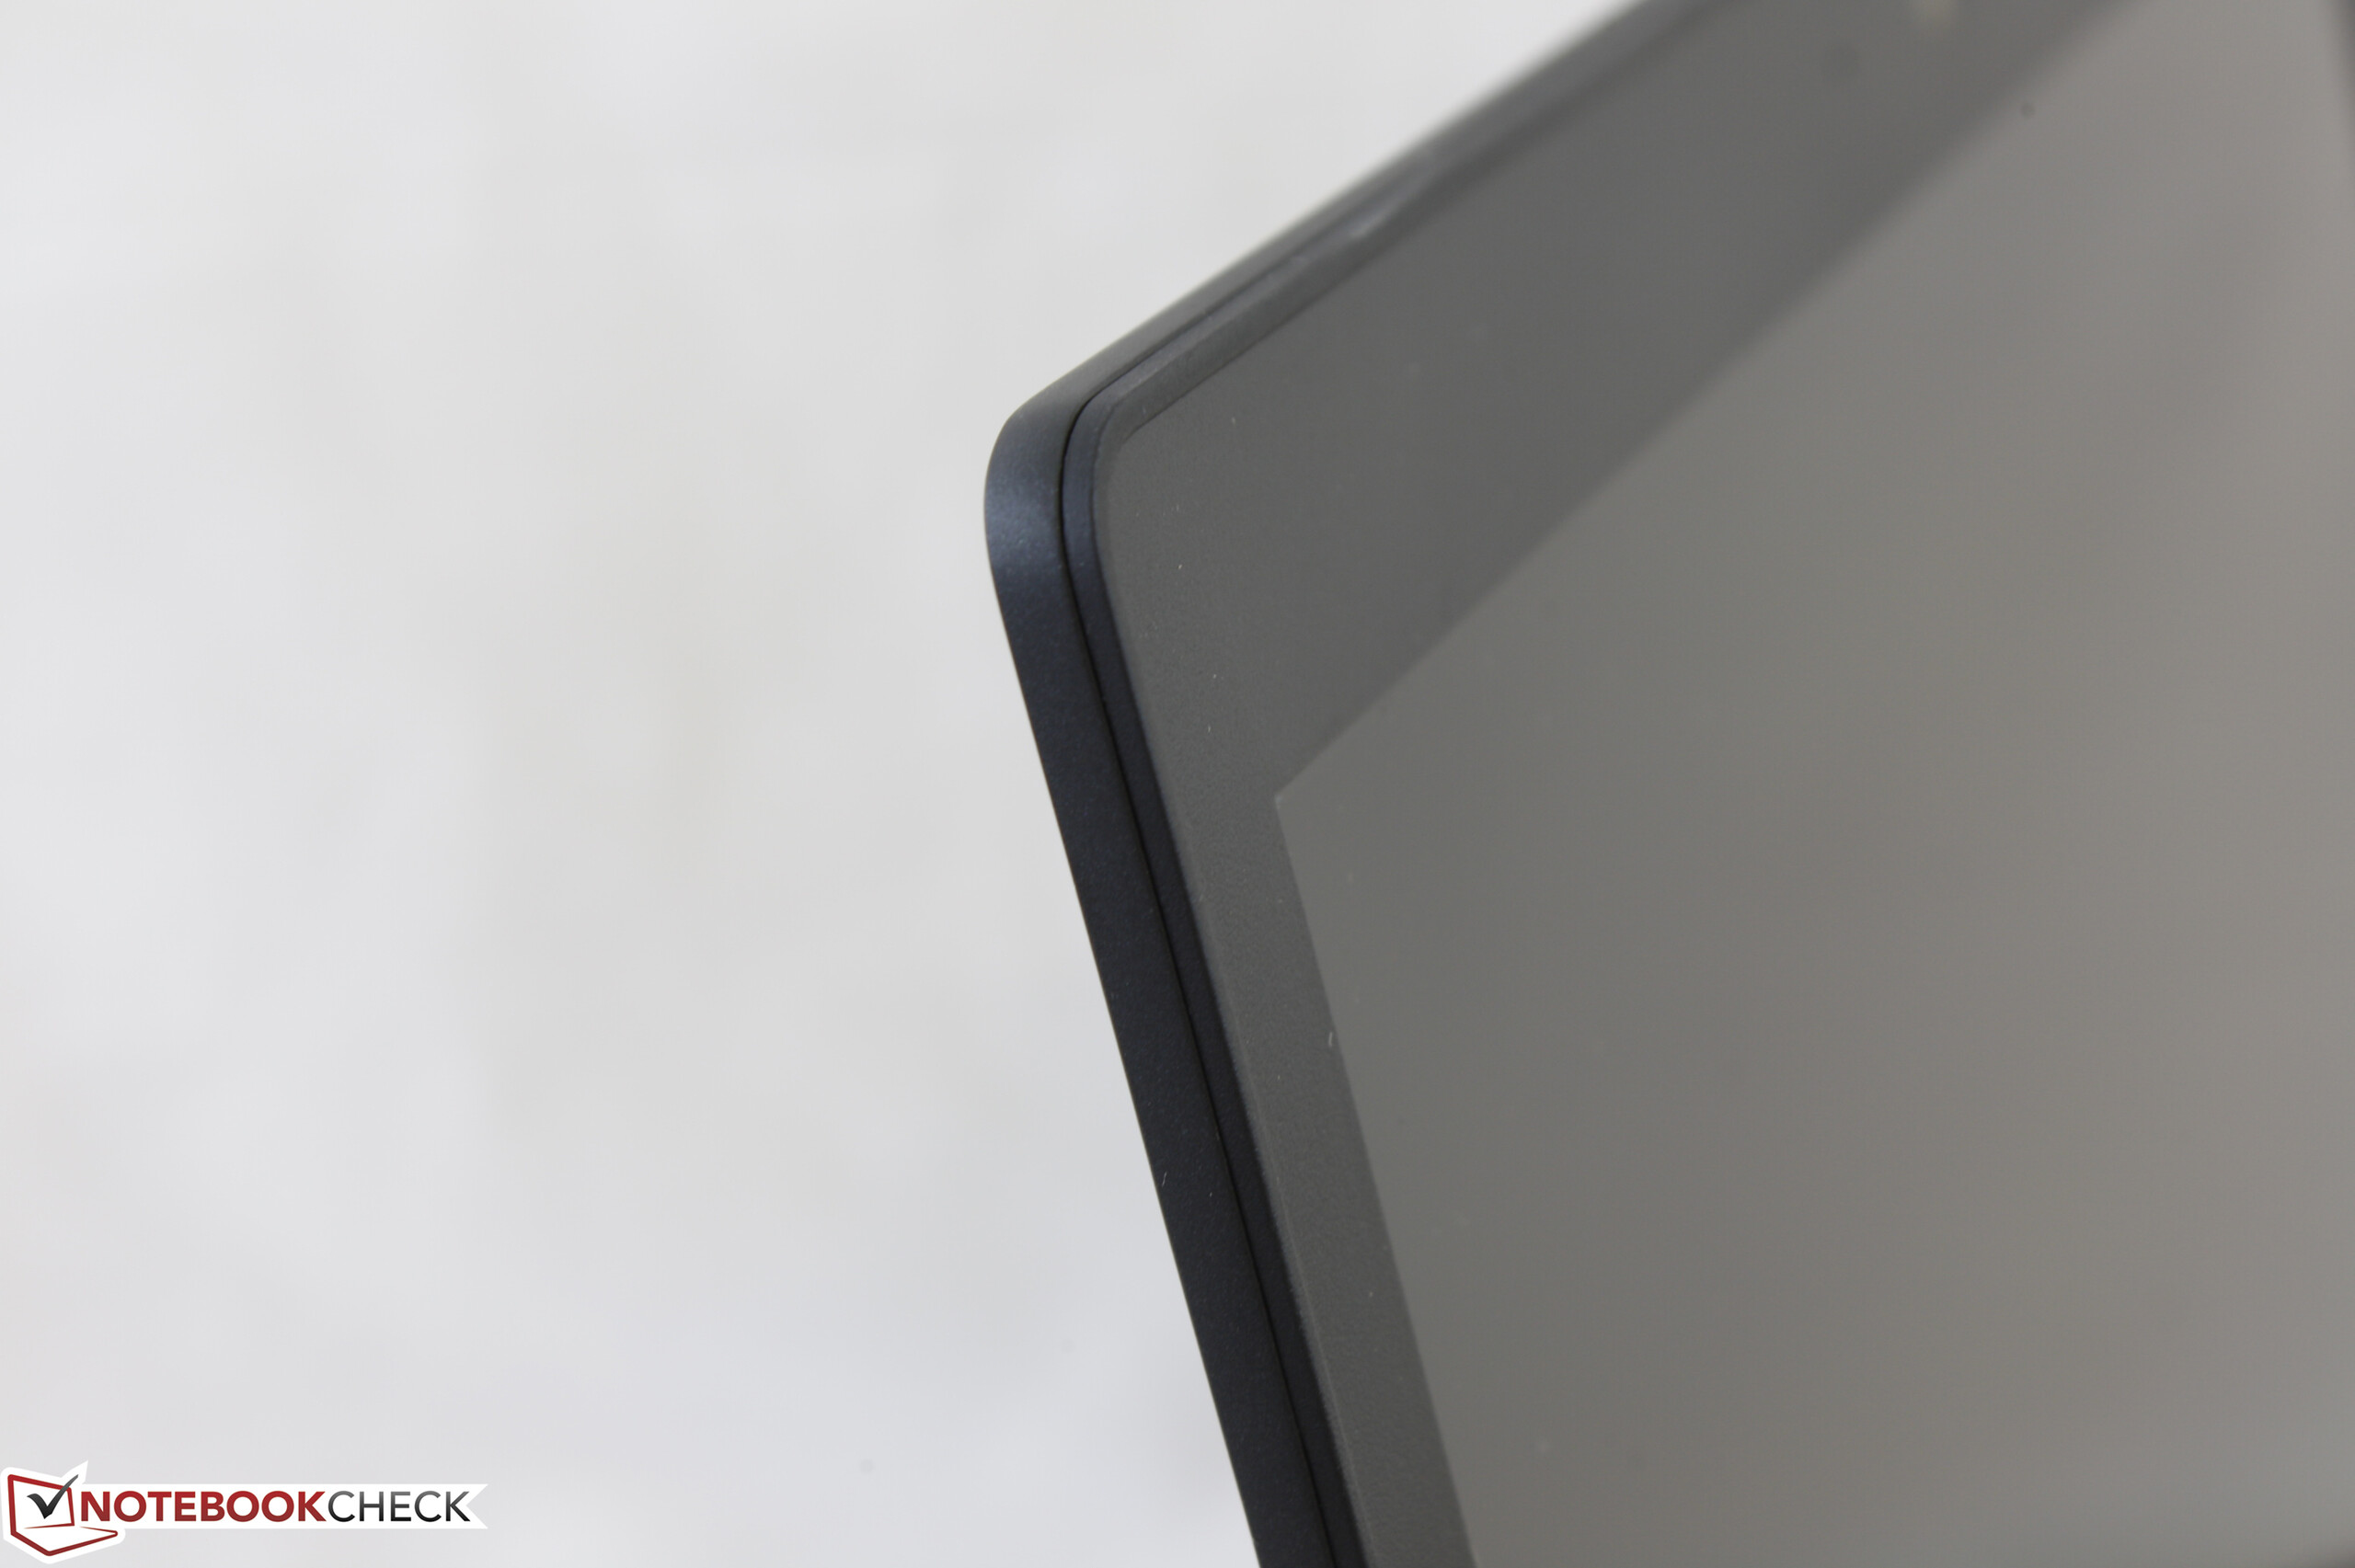
Recomendamos que evite a muito pobre tela 768p e opte pela opção 1080p mais brilhante, com SSD primários mais rápidos. A melhoria na resolução e no brilho tornará o portátil mais confortável de usar e o investimento vale totalmente se o sistema for usado com frequência sem monitores externos.
Pode levar algum tempo se acostumar ao teclado um pouco esponjoso, e os usuários com mãos maiores podem querer evitar essa categoria de tamanho especial para digitação pesada. O 5280 é mais para usuários em constante movimento do que algo para estar em um lugar fixo em casa ou no escritório.
Dell Latitude 5280
- 05/27/2017 v6 (old)
Allen Ngo
Price comparison
