Breve Análise do Conversível HP Spectre x360 15-bl002xx


| SD Card Reader | |
| average JPG Copy Test (av. of 3 runs) | |
| HP Spectre x360 15-bl002xx | |
| Lenovo Yoga 710-14IKB 80V4002HGE | |
| Dell XPS 15 2017 9560 (7300HQ, Full-HD) | |
| Dell Inspiron 15 5568 | |
| maximum AS SSD Seq Read Test (1GB) | |
| HP Spectre x360 15-bl002xx | |
| Dell XPS 15 2017 9560 (7300HQ, Full-HD) | |
| Lenovo Yoga 710-14IKB 80V4002HGE | |
| Dell Inspiron 15 5568 | |
| Networking | |
| iperf3 transmit AX12 | |
| HP Spectre x360 15-bl002xx | |
| iperf3 receive AX12 | |
| HP Spectre x360 15-bl002xx | |
| |||||||||||||||||||||||||
iluminação: 83 %
iluminação com acumulador: 351.5 cd/m²
Contraste: 1465:1 (Preto: 0.24 cd/m²)
ΔE ColorChecker Calman: 3.3 | ∀{0.5-29.43 Ø4.71}
ΔE Greyscale Calman: 1.9 | ∀{0.09-98 Ø4.96}
88.2% sRGB (Argyll 1.6.3 3D)
64.4% AdobeRGB 1998 (Argyll 1.6.3 3D)
64.4% AdobeRGB 1998 (Argyll 3D)
88.2% sRGB (Argyll 3D)
67.9% Display P3 (Argyll 3D)
Gamma: 2.09
CCT: 6784 K
| HP Spectre x360 15-bl002xx UHD UWVA eDP BrightView WLED-backlit , IPS, 15.6", 3840x2160 | HP Spectre x360 15-ap012dx IPS, 15.6", 3840x2160 | Dell XPS 15 2017 9560 (7300HQ, Full-HD) Sharp SHP1453 LQ156M1, LED IGZO IPS InfinityEdge, 15.6", 1920x1080 | Lenovo ThinkPad X1 Yoga-20FRS1VS00 Samsung ATNA40JU01-0, OLED, 14", 2560x1440 | Lenovo Yoga 710-14IKB 80V4002HGE AU Optronics B140HAN03.0, a-Si WLED TFT, IPS, 14", 1920x1080 | Dell Inspiron 15 5568 AU Optronics B156HW01 V0, IPS, 15.6", 1920x1080 | |
|---|---|---|---|---|---|---|
| Display | -3% | 8% | -3% | -39% | ||
| Display P3 Coverage (%) | 67.9 | 62.8 -8% | 68.9 1% | 62 -9% | 38.04 -44% | |
| sRGB Coverage (%) | 88.2 | 88.2 0% | 98.9 12% | 89.5 1% | 57.1 -35% | |
| AdobeRGB 1998 Coverage (%) | 64.4 | 63.9 -1% | 70.9 10% | 63.3 -2% | 39.3 -39% | |
| Response Times | 27% | -29% | 98% | -3% | 24% | |
| Response Time Grey 50% / Grey 80% * (ms) | 44 ? | 32.8 ? 25% | 54 ? -23% | 1 ? 98% | 53 ? -20% | 42 ? 5% |
| Response Time Black / White * (ms) | 38.8 ? | 28 ? 28% | 52.4 ? -35% | 1 ? 97% | 33 ? 15% | 22 ? 43% |
| PWM Frequency (Hz) | 1000 ? | 240 ? | 50 ? | |||
| Screen | -29% | -33% | -27% | -60% | -32% | |
| Brightness middle (cd/m²) | 351.5 | 298 -15% | 400 14% | 279 -21% | 340 -3% | 266 -24% |
| Brightness (cd/m²) | 336 | 295 -12% | 392 17% | 277 -18% | 302 -10% | 249 -26% |
| Brightness Distribution (%) | 83 | 88 6% | 89 7% | 91 10% | 77 -7% | 85 2% |
| Black Level * (cd/m²) | 0.24 | 0.57 -138% | 0.26 -8% | 0.31 -29% | 0.26 -8% | |
| Contrast (:1) | 1465 | 523 -64% | 1538 5% | 1097 -25% | 1023 -30% | |
| Colorchecker dE 2000 * | 3.3 | 4.43 -34% | 4.9 -48% | 5.15 -56% | 6.75 -105% | 4.98 -51% |
| Colorchecker dE 2000 max. * | 7.3 | 6.62 9% | 11 -51% | 8.28 -13% | 12.4 -70% | 11.82 -62% |
| Greyscale dE 2000 * | 1.9 | 2.45 -29% | 7.2 -279% | 5.44 -186% | 8.47 -346% | 2.68 -41% |
| Gamma | 2.09 105% | 2.45 90% | 2.11 104% | 2.28 96% | 2.22 99% | 2.27 97% |
| CCT | 6784 96% | 6326 103% | 6911 94% | 5686 114% | 6557 99% | 6583 99% |
| Color Space (Percent of AdobeRGB 1998) (%) | 64.4 | 57.2 -11% | 64.2 0% | 98 52% | 58 -10% | 36 -44% |
| Color Space (Percent of sRGB) (%) | 88.2 | 87.8 0% | 98.9 12% | 100 13% | 89 1% | 57 -35% |
| Média Total (Programa/Configurações) | -2% /
-16% | -18% /
-24% | 36% /
-2% | -22% /
-41% | -16% /
-26% |
* ... menor é melhor
Exibir tempos de resposta
| ↔ Tempo de resposta preto para branco | ||
|---|---|---|
| 38.8 ms ... ascensão ↗ e queda ↘ combinadas | ↗ 6.4 ms ascensão | 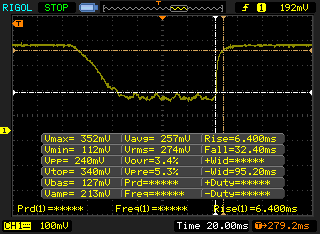 |
| ↘ 32.4 ms queda | ||
| A tela mostra taxas de resposta lentas em nossos testes e será insatisfatória para os jogadores. Em comparação, todos os dispositivos testados variam de 0.1 (mínimo) a 240 (máximo) ms. » 96 % de todos os dispositivos são melhores. Isso significa que o tempo de resposta medido é pior que a média de todos os dispositivos testados (19.8 ms). | ||
| ↔ Tempo de resposta 50% cinza a 80% cinza | ||
| 44 ms ... ascensão ↗ e queda ↘ combinadas | ↗ 20.4 ms ascensão | 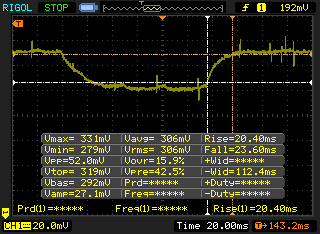 |
| ↘ 23.6 ms queda | ||
| A tela mostra taxas de resposta lentas em nossos testes e será insatisfatória para os jogadores. Em comparação, todos os dispositivos testados variam de 0.165 (mínimo) a 636 (máximo) ms. » 73 % de todos os dispositivos são melhores. Isso significa que o tempo de resposta medido é pior que a média de todos os dispositivos testados (31 ms). | ||
Cintilação da tela / PWM (modulação por largura de pulso)
| Tela tremeluzindo/PWM detectado | 1000 Hz | ≤ 99 % configuração de brilho | 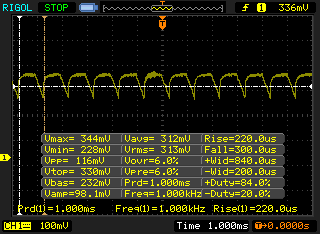 |
A luz de fundo da tela pisca em 1000 Hz (pior caso, por exemplo, utilizando PWM) Cintilação detectada em uma configuração de brilho de 99 % e abaixo. Não deve haver cintilação ou PWM acima desta configuração de brilho. A frequência de 1000 Hz é bastante alta, então a maioria dos usuários sensíveis ao PWM não deve notar nenhuma oscilação. [pwm_comparison] Em comparação: 52 % de todos os dispositivos testados não usam PWM para escurecer a tela. Se PWM foi detectado, uma média de 7754 (mínimo: 5 - máximo: 343500) Hz foi medida. | |||
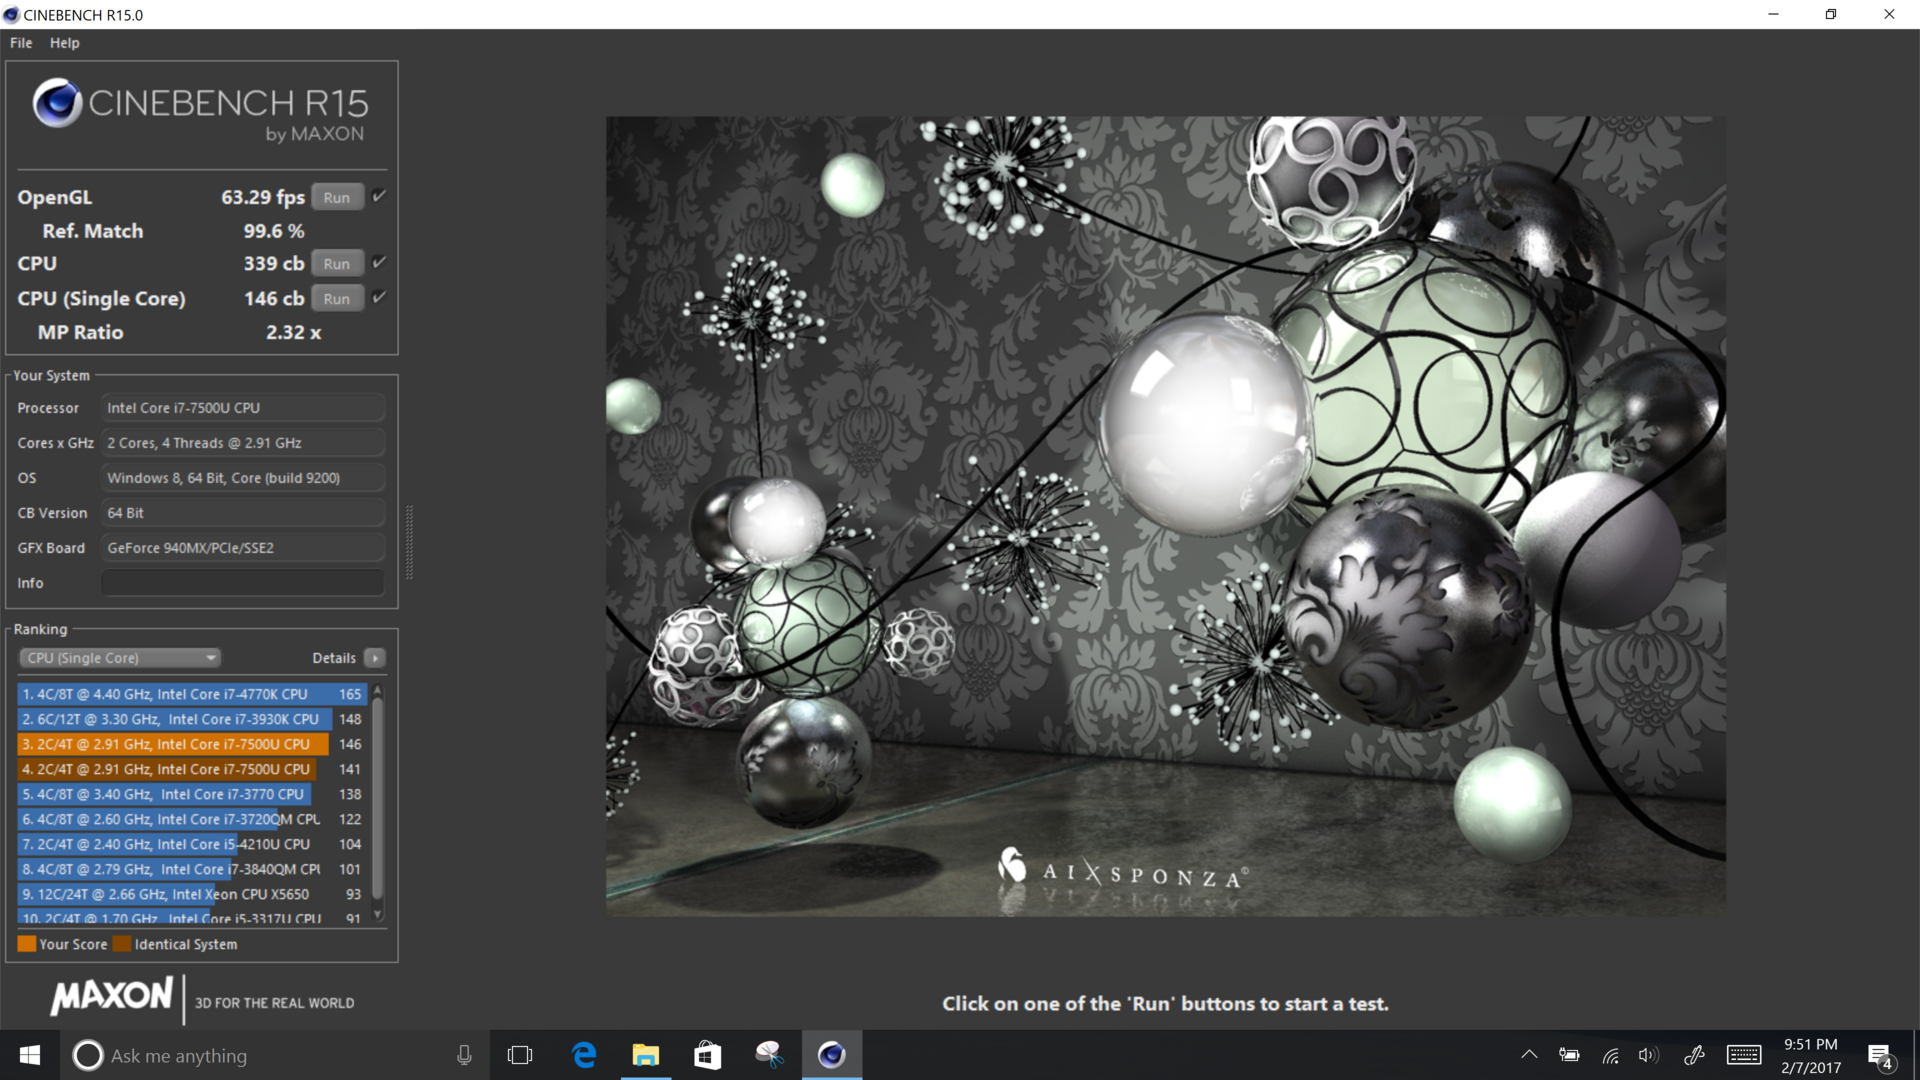
| Cinebench R15 | |
| CPU Single 64Bit | |
| Lenovo Yoga 910-13IKB-80VF004CGE | |
| Dell XPS 15 2017 9560 (7300HQ, Full-HD) | |
| HP Spectre x360 15-bl002xx | |
| Lenovo ThinkPad X1 Yoga-20FRS1VS00 | |
| Dell Inspiron 15 5568 | |
| HP Spectre x360 15-ap012dx | |
| CPU Multi 64Bit | |
| Dell XPS 15 2017 9560 (7300HQ, Full-HD) | |
| Lenovo Yoga 910-13IKB-80VF004CGE | |
| HP Spectre x360 15-bl002xx | |
| HP Spectre x360 15-ap012dx | |
| Dell Inspiron 15 5568 | |
| Lenovo ThinkPad X1 Yoga-20FRS1VS00 | |
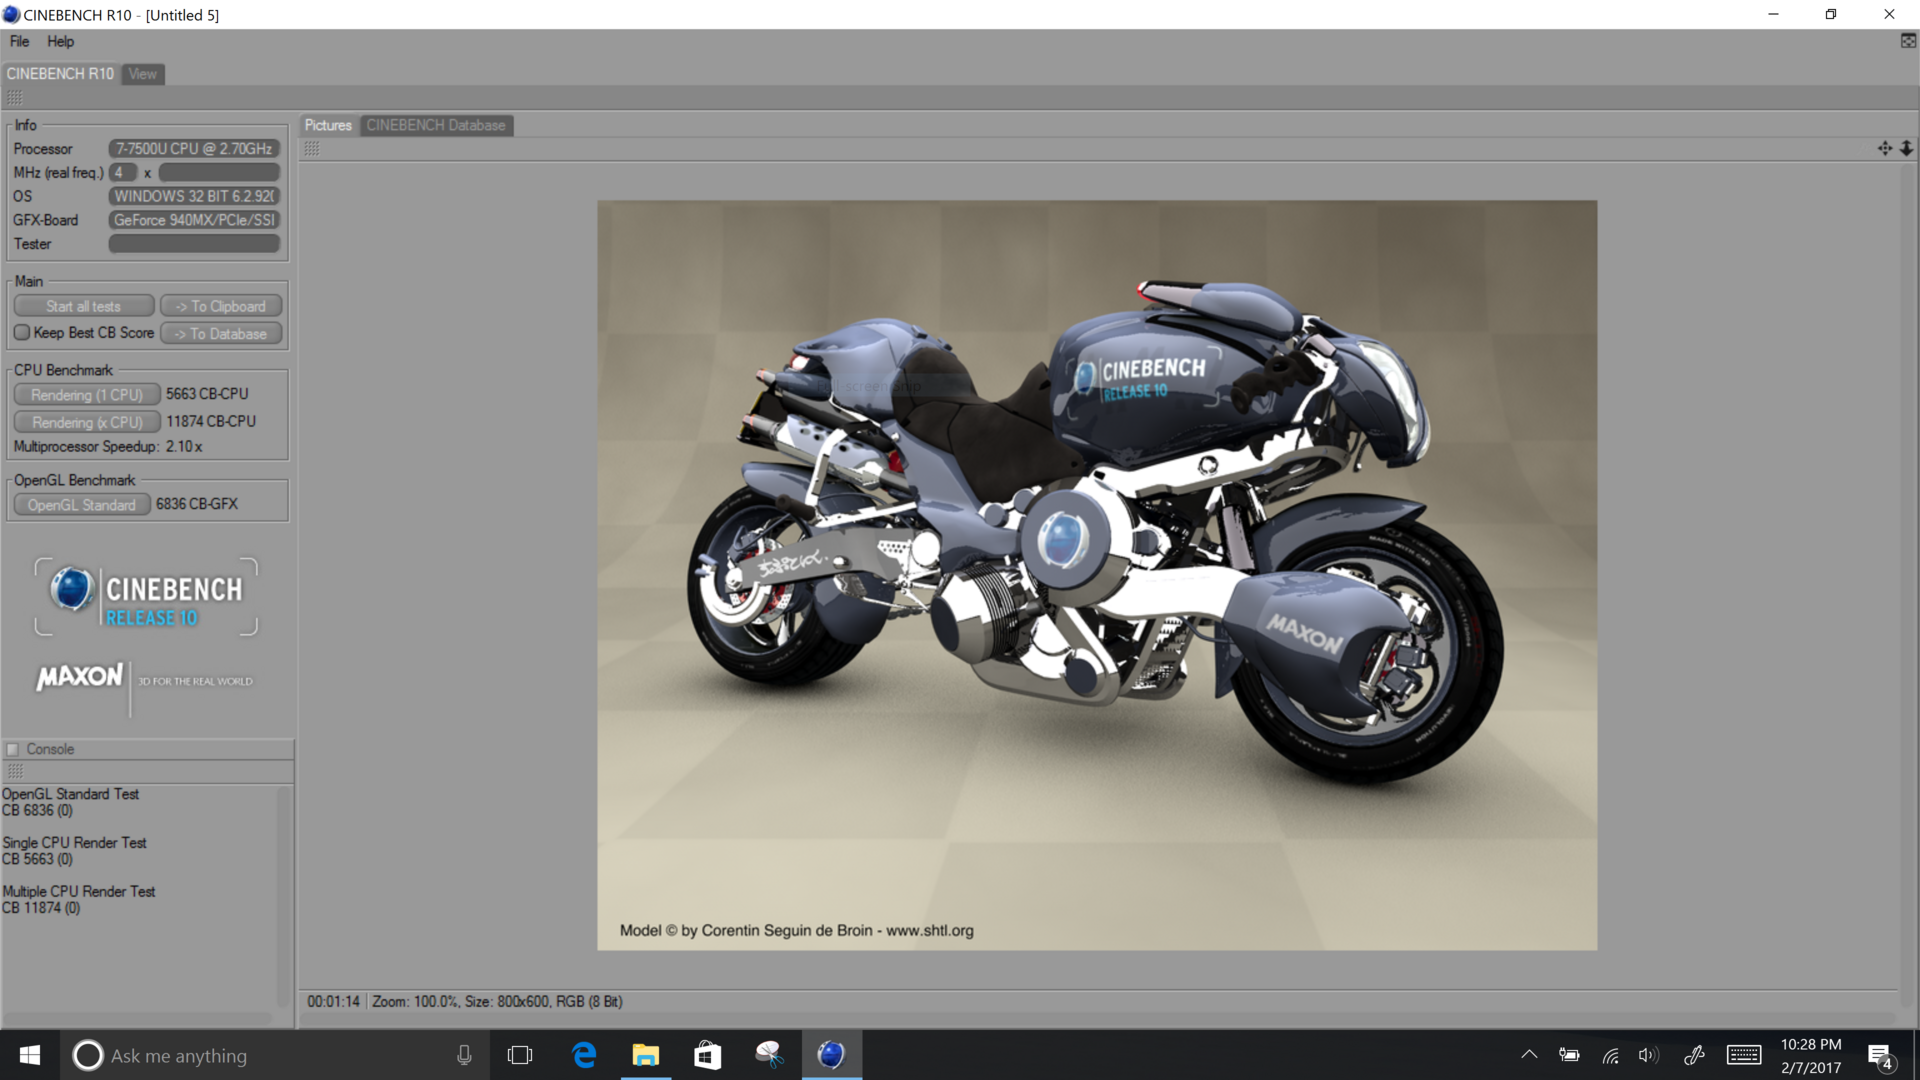
| Cinebench R10 | |
| Rendering Multiple CPUs 32Bit | |
| HP Spectre x360 15-bl002xx | |
| HP Spectre x360 15-ap012dx | |
| Rendering Single 32Bit | |
| HP Spectre x360 15-bl002xx | |
| HP Spectre x360 15-ap012dx | |
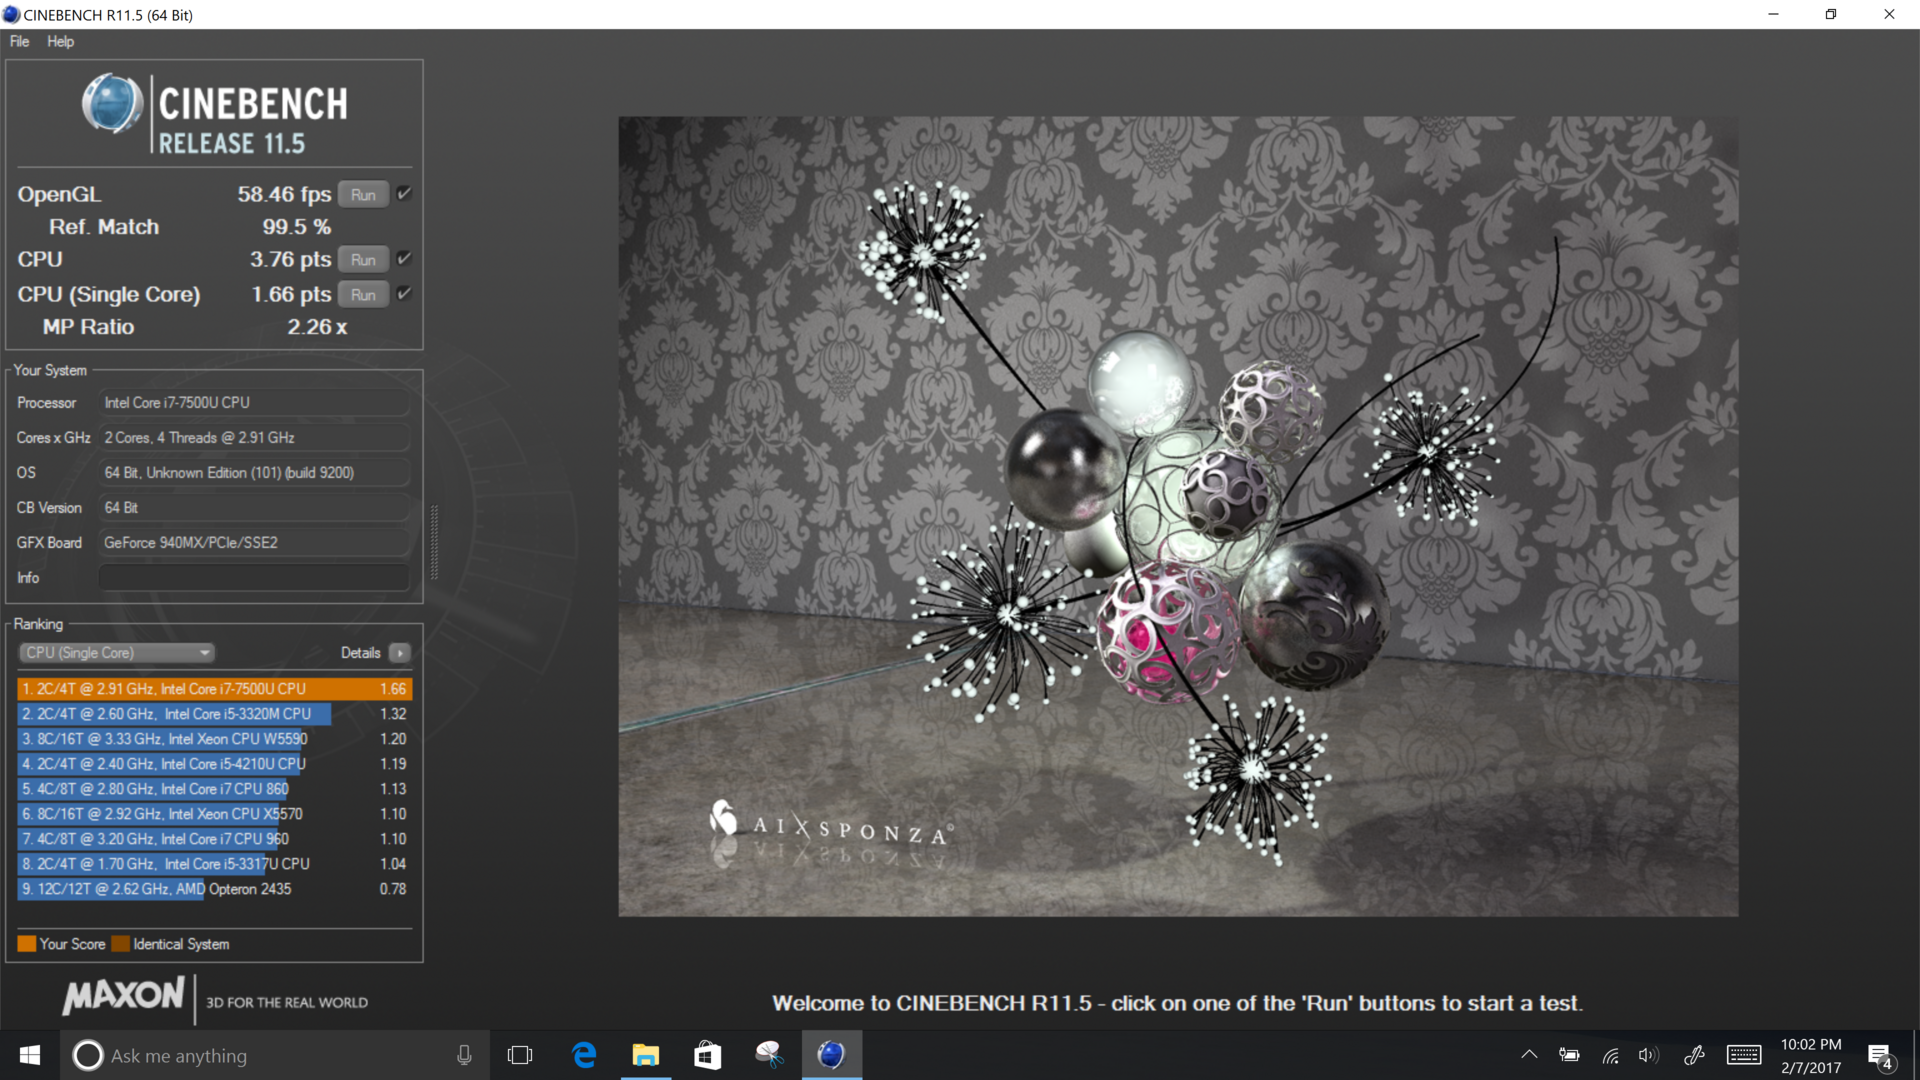
| Cinebench R11.5 | |
| CPU Single 64Bit | |
| HP Spectre x360 15-bl002xx | |
| Lenovo ThinkPad X1 Yoga-20FRS1VS00 | |
| HP Spectre x360 15-ap012dx | |
| CPU Multi 64Bit | |
| HP Spectre x360 15-bl002xx | |
| HP Spectre x360 15-ap012dx | |
| Lenovo ThinkPad X1 Yoga-20FRS1VS00 | |
| wPrime 2.10 - 1024m | |
| HP Spectre x360 15-ap012dx | |
| HP Spectre x360 15-bl002xx | |
* ... menor é melhor
| PCMark 8 | |
| Home Score Accelerated v2 | |
| Dell XPS 15 2017 9560 (7300HQ, Full-HD) | |
| Dell Inspiron 15 5568 | |
| Lenovo Yoga 910-13IKB-80VF004CGE | |
| Lenovo ThinkPad X1 Yoga-20FRS1VS00 | |
| HP Spectre x360 15-bl002xx | |
| HP Spectre x360 15-ap012dx | |
| Work Score Accelerated v2 | |
| Dell XPS 15 2017 9560 (7300HQ, Full-HD) | |
| Dell Inspiron 15 5568 | |
| Lenovo ThinkPad X1 Yoga-20FRS1VS00 | |
| HP Spectre x360 15-bl002xx | |
| HP Spectre x360 15-ap012dx | |
| Creative Score Accelerated v2 | |
| HP Spectre x360 15-bl002xx | |
| HP Spectre x360 15-ap012dx | |
| PCMark 8 Home Score Accelerated v2 | 3249 pontos | |
| PCMark 8 Creative Score Accelerated v2 | 4542 pontos | |
| PCMark 8 Work Score Accelerated v2 | 4016 pontos | |
Ajuda | ||
| HP Spectre x360 15-bl002xx Toshiba XG4 NVMe (THNSN5512GPUK) | Lenovo Yoga 910-13IKB-80VF004CGE Samsung PM951 NVMe MZVLV512 | HP Spectre x360 15-ap012dx Sandisk X300 SD7SN6S-256G-1006 | Dell XPS 15 2017 9560 (7300HQ, Full-HD) WDC WD10SPCX-75KHST0 + SanDisk Z400s M.2 2242 32 GB Cache | Lenovo ThinkPad X1 Yoga-20FRS1VS00 Samsung SSD PM961 1TB M.2 PCIe 3.0 x4 NVMe (MZSLW1T0) | Dell Inspiron 15 5568 Toshiba THNSNK256GCS8 | |
|---|---|---|---|---|---|---|
| CrystalDiskMark 3.0 | -1% | -50% | -90% | -4% | -55% | |
| Read Seq (MB/s) | 1266 | 1412 12% | 475.6 -62% | 123 -90% | 1510 19% | 458.6 -64% |
| Write Seq (MB/s) | 982 | 578 -41% | 425 -57% | 74.2 -92% | 1193 21% | 270 -73% |
| Read 512 (MB/s) | 834 | 701 -16% | 258.4 -69% | 101.7 -88% | 397.4 -52% | |
| Write 512 (MB/s) | 714 | 580 -19% | 318.9 -55% | 42.51 -94% | 242 -66% | |
| Read 4k (MB/s) | 40.72 | 43.5 7% | 35.48 -13% | 10.84 -73% | 37 -9% | 19.88 -51% |
| Write 4k (MB/s) | 139.4 | 159.7 15% | 93 -33% | 1.021 -99% | 126 -10% | 86.7 -38% |
| Read 4k QD32 (MB/s) | 527 | 570 8% | 281.2 -47% | 69.8 -87% | 404 -23% | 275.3 -48% |
| Write 4k QD32 (MB/s) | 395.2 | 488.7 24% | 138.7 -65% | 1.057 -100% | 319 -19% | 197.6 -50% |

| 3DMark 11 | |
| 1280x720 Performance GPU | |
| Dell XPS 15 2017 9560 (7300HQ, Full-HD) | |
| HP Spectre x360 15-bl002xx | |
| Lenovo Yoga 910-13IKB-80VF004CGE | |
| Dell Inspiron 15 5568 | |
| Lenovo ThinkPad X1 Yoga-20FRS1VS00 | |
| HP Spectre x360 15-ap012dx | |
| Lenovo Yoga 710-14IKB 80V4002HGE | |
| 1280x720 Performance Combined | |
| Dell XPS 15 2017 9560 (7300HQ, Full-HD) | |
| HP Spectre x360 15-bl002xx | |
| Lenovo Yoga 910-13IKB-80VF004CGE | |
| Dell Inspiron 15 5568 | |
| Lenovo ThinkPad X1 Yoga-20FRS1VS00 | |
| HP Spectre x360 15-ap012dx | |
| Lenovo Yoga 710-14IKB 80V4002HGE | |
| 3DMark | |
| 1280x720 Cloud Gate Standard Graphics | |
| Dell XPS 15 2017 9560 (7300HQ, Full-HD) | |
| HP Spectre x360 15-bl002xx | |
| Lenovo Yoga 910-13IKB-80VF004CGE | |
| Dell Inspiron 15 5568 | |
| Lenovo ThinkPad X1 Yoga-20FRS1VS00 | |
| Lenovo Yoga 710-14IKB 80V4002HGE | |
| HP Spectre x360 15-ap012dx | |
| 1920x1080 Fire Strike Graphics | |
| Dell XPS 15 2017 9560 (7300HQ, Full-HD) | |
| HP Spectre x360 15-bl002xx | |
| Lenovo Yoga 910-13IKB-80VF004CGE | |
| Lenovo ThinkPad X1 Yoga-20FRS1VS00 | |
| HP Spectre x360 15-ap012dx | |
| Lenovo Yoga 710-14IKB 80V4002HGE | |
| 1920x1080 Ice Storm Extreme Graphics | |
| Lenovo Yoga 710-14IKB 80V4002HGE | |
| HP Spectre x360 15-bl002xx | |
| HP Spectre x360 15-ap012dx | |
| 3DMark 11 Performance | 2772 pontos | |
| 3DMark Ice Storm Standard Score | 22543 pontos | |
| 3DMark Cloud Gate Standard Score | 7908 pontos | |
| 3DMark Fire Strike Score | 1926 pontos | |
| 3DMark Fire Strike Extreme Score | 969 pontos | |
Ajuda | ||
| baixo | média | alto | ultra | |
|---|---|---|---|---|
| Anno 2070 (2011) | 190.1 | 83.2 | 50.5 | 27.1 |
| Sleeping Dogs (2012) | 122.4 | 93.6 | 45.5 | 11.9 |
| Hitman: Absolution (2012) | 77.2 | 56.6 | 27.5 | 10.8 |
| Tomb Raider (2013) | 184.4 | 92.7 | 52.1 | 26.5 |
| BioShock Infinite (2013) | 127.5 | 69.8 | 59 | 21.6 |
| Company of Heroes 2 (2013) | 28.4 | 24.2 | 14.6 | 8.7 |
| Middle-earth: Shadow of Mordor (2014) | 55.3 | 32.5 | 19.3 | 15.1 |
| Rise of the Tomb Raider (2016) | 38.5 | 18.4 | 15.3 | 13.8 |
Barulho
| Ocioso |
| 28.5 / 28.5 / 36.3 dB |
| Carga |
| 42.7 / 42.7 dB |
 | ||
30 dB silencioso 40 dB(A) audível 50 dB(A) ruidosamente alto |
||
min: | ||
| HP Spectre x360 15-bl002xx GeForce 940MX, i7-7500U, Toshiba XG4 NVMe (THNSN5512GPUK) | Lenovo Yoga 910-13IKB-80VF004CGE HD Graphics 620, i7-7500U, Samsung PM951 NVMe MZVLV512 | HP Spectre x360 15-ap012dx HD Graphics 520, 6200U, Sandisk X300 SD7SN6S-256G-1006 | Dell XPS 15 2017 9560 (7300HQ, Full-HD) GeForce GTX 1050 Mobile, i5-7300HQ, WDC WD10SPCX-75KHST0 + SanDisk Z400s M.2 2242 32 GB Cache | Lenovo ThinkPad X1 Yoga-20FRS1VS00 HD Graphics 520, 6600U, Samsung SSD PM961 1TB M.2 PCIe 3.0 x4 NVMe (MZSLW1T0) | Dell Inspiron 15 5568 HD Graphics 520, 6500U, Toshiba THNSNK256GCS8 | Lenovo Yoga 710-14IKB 80V4002HGE HD Graphics 620, i5-7200U, Samsung MZYTY256HDHP | |
|---|---|---|---|---|---|---|---|
| Noise | 2% | 5% | -7% | 7% | -0% | 4% | |
| desligado / ambiente * (dB) | 28.5 | 31.7 -11% | 29.5 -4% | 30.3 -6% | 28.9 -1% | 31.2 -9% | 30.16 -6% |
| Idle Minimum * (dB) | 28.5 | 31.7 -11% | 29.5 -4% | 31.6 -11% | 28.9 -1% | 32.8 -15% | 30.16 -6% |
| Idle Average * (dB) | 28.5 | 31.7 -11% | 29.5 -4% | 31.6 -11% | 28.9 -1% | 32.8 -15% | 30.16 -6% |
| Idle Maximum * (dB) | 36.3 | 31.7 13% | 29.6 18% | 33.4 8% | 28.9 20% | 33.8 7% | 30.5 16% |
| Load Average * (dB) | 42.7 | 38.4 10% | 38.1 11% | 47.8 -12% | 35.3 17% | 36.3 15% | 37.2 13% |
| Load Maximum * (dB) | 42.7 | 34.7 19% | 38.2 11% | 47.8 -12% | 38.9 9% | 36.3 15% | 37 13% |
* ... menor é melhor
(-) A temperatura máxima no lado superior é 47 °C / 117 F, em comparação com a média de 36.8 °C / 98 F , variando de 21 a 71 °C para a classe Multimedia.
(-) A parte inferior aquece até um máximo de 50.2 °C / 122 F, em comparação com a média de 39.1 °C / 102 F
(+) Em uso inativo, a temperatura média para o lado superior é 28.6 °C / 83 F, em comparação com a média do dispositivo de 31.3 °C / ### class_avg_f### F.
(+) Os apoios para as mãos e o touchpad estão atingindo a temperatura máxima da pele (33.4 °C / 92.1 F) e, portanto, não estão quentes.
(-) A temperatura média da área do apoio para as mãos de dispositivos semelhantes foi 28.7 °C / 83.7 F (-4.7 °C / -8.4 F).
HP Spectre x360 15-bl002xx análise de áudio
(±) | o volume do alto-falante é médio, mas bom (###valor### dB)
Graves 100 - 315Hz
(±) | graves reduzidos - em média 14.8% menor que a mediana
(±) | a linearidade dos graves é média (14% delta para a frequência anterior)
Médios 400 - 2.000 Hz
(+) | médios equilibrados - apenas 4.4% longe da mediana
(±) | a linearidade dos médios é média (10.1% delta para frequência anterior)
Altos 2 - 16 kHz
(+) | agudos equilibrados - apenas 1.2% longe da mediana
(+) | os máximos são lineares (4.9% delta da frequência anterior)
Geral 100 - 16.000 Hz
(±) | a linearidade do som geral é média (20.3% diferença em relação à mediana)
Comparado com a mesma classe
» 68% de todos os dispositivos testados nesta classe foram melhores, 9% semelhantes, 24% piores
» O melhor teve um delta de 5%, a média foi 17%, o pior foi 45%
Comparado com todos os dispositivos testados
» 53% de todos os dispositivos testados foram melhores, 8% semelhantes, 39% piores
» O melhor teve um delta de 4%, a média foi 23%, o pior foi 134%
Apple MacBook 12 (Early 2016) 1.1 GHz análise de áudio
(+) | os alto-falantes podem tocar relativamente alto (###valor### dB)
Graves 100 - 315Hz
(±) | graves reduzidos - em média 11.3% menor que a mediana
(±) | a linearidade dos graves é média (14.2% delta para a frequência anterior)
Médios 400 - 2.000 Hz
(+) | médios equilibrados - apenas 2.4% longe da mediana
(+) | médios são lineares (5.5% delta para frequência anterior)
Altos 2 - 16 kHz
(+) | agudos equilibrados - apenas 2% longe da mediana
(+) | os máximos são lineares (4.5% delta da frequência anterior)
Geral 100 - 16.000 Hz
(+) | o som geral é linear (10.2% diferença em relação à mediana)
Comparado com a mesma classe
» 7% de todos os dispositivos testados nesta classe foram melhores, 2% semelhantes, 90% piores
» O melhor teve um delta de 5%, a média foi 18%, o pior foi 53%
Comparado com todos os dispositivos testados
» 5% de todos os dispositivos testados foram melhores, 1% semelhantes, 94% piores
» O melhor teve um delta de 4%, a média foi 23%, o pior foi 134%
| desligado | |
| Ocioso | |
| Carga |
|
Key:
min: | |
| HP Spectre x360 15-bl002xx i7-7500U, GeForce 940MX, Toshiba XG4 NVMe (THNSN5512GPUK), IPS, 3840x2160, 15.6" | Lenovo Yoga 910-13IKB-80VF004CGE i7-7500U, HD Graphics 620, Samsung PM951 NVMe MZVLV512, IPS, 3840x2160, 13.9" | HP Spectre x360 15-ap012dx 6200U, HD Graphics 520, Sandisk X300 SD7SN6S-256G-1006, IPS, 3840x2160, 15.6" | Dell XPS 15 2017 9560 (7300HQ, Full-HD) i5-7300HQ, GeForce GTX 1050 Mobile, WDC WD10SPCX-75KHST0 + SanDisk Z400s M.2 2242 32 GB Cache, LED IGZO IPS InfinityEdge, 1920x1080, 15.6" | Lenovo ThinkPad X1 Yoga-20FRS1VS00 6600U, HD Graphics 520, Samsung SSD PM961 1TB M.2 PCIe 3.0 x4 NVMe (MZSLW1T0), OLED, 2560x1440, 14" | Dell Inspiron 15 5568 6500U, HD Graphics 520, Toshiba THNSNK256GCS8, IPS, 1920x1080, 15.6" | |
|---|---|---|---|---|---|---|
| Power Consumption | 41% | 11% | -19% | 26% | 40% | |
| Idle Minimum * (Watt) | 8.14 | 4.3 47% | 6.5 20% | 6.6 19% | 4.7 42% | 4.34 47% |
| Idle Average * (Watt) | 10.91 | 6.3 42% | 13.3 -22% | 9 18% | 8.6 21% | 7.5 31% |
| Idle Maximum * (Watt) | 12.26 | 9 27% | 15.1 -23% | 10.7 13% | 12.2 -0% | 8.4 31% |
| Load Average * (Watt) | 45.67 | 32.7 28% | 30.8 33% | 77.5 -70% | 29.7 35% | 30.4 33% |
| Load Maximum * (Watt) | 74.94 | 28.8 62% | 38.5 49% | 130 -73% | 50.5 33% | 32.5 57% |
* ... menor é melhor
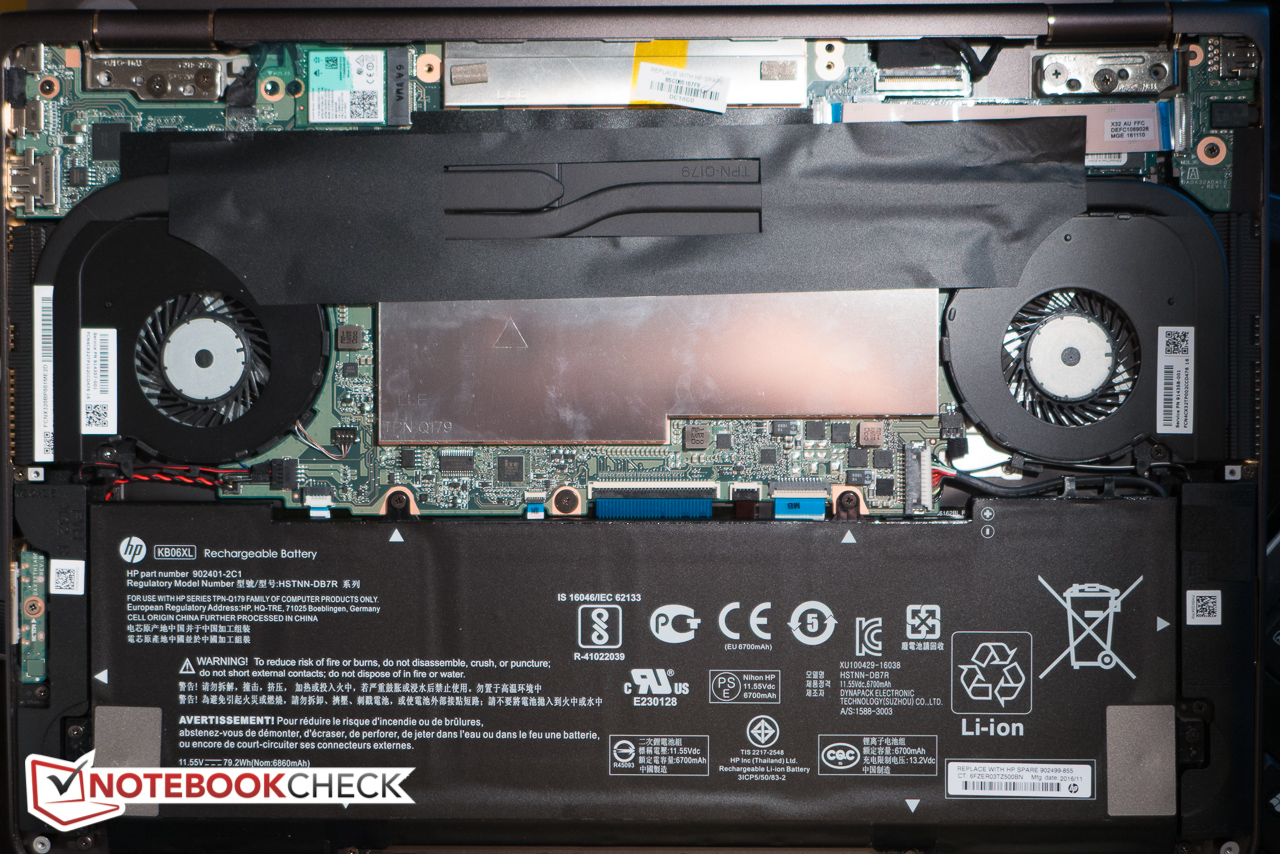
| HP Spectre x360 15-bl002xx i7-7500U, GeForce 940MX, 79.2 Wh | Lenovo Yoga 910-13IKB-80VF004CGE i7-7500U, HD Graphics 620, 78 Wh | HP Spectre x360 15-ap012dx 6200U, HD Graphics 520, 65 Wh | Dell XPS 15 2017 9560 (7300HQ, Full-HD) i5-7300HQ, GeForce GTX 1050 Mobile, 56 Wh | Lenovo ThinkPad X1 Yoga-20FRS1VS00 6600U, HD Graphics 520, 56 Wh | Dell Inspiron 15 5568 6500U, HD Graphics 520, 42 Wh | |
|---|---|---|---|---|---|---|
| Duração da bateria | 20% | -20% | -39% | -19% | -43% | |
| Reader / Idle (h) | 14.4 | 17.8 24% | 11.8 -18% | 9.4 -35% | 13.7 -5% | 7.5 -48% |
| WiFi v1.3 (h) | 8.9 | 10.7 20% | 7.2 -19% | 5.6 -37% | 5.3 -40% | 5 -44% |
| Load (h) | 2.5 | 2.9 16% | 1.9 -24% | 1.4 -44% | 2.2 -12% | 1.6 -36% |
Pro
Contra
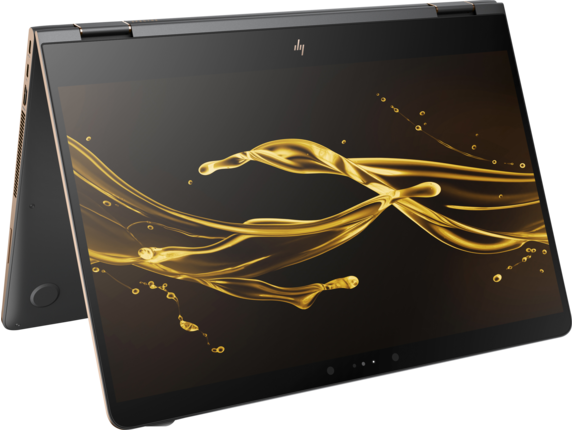
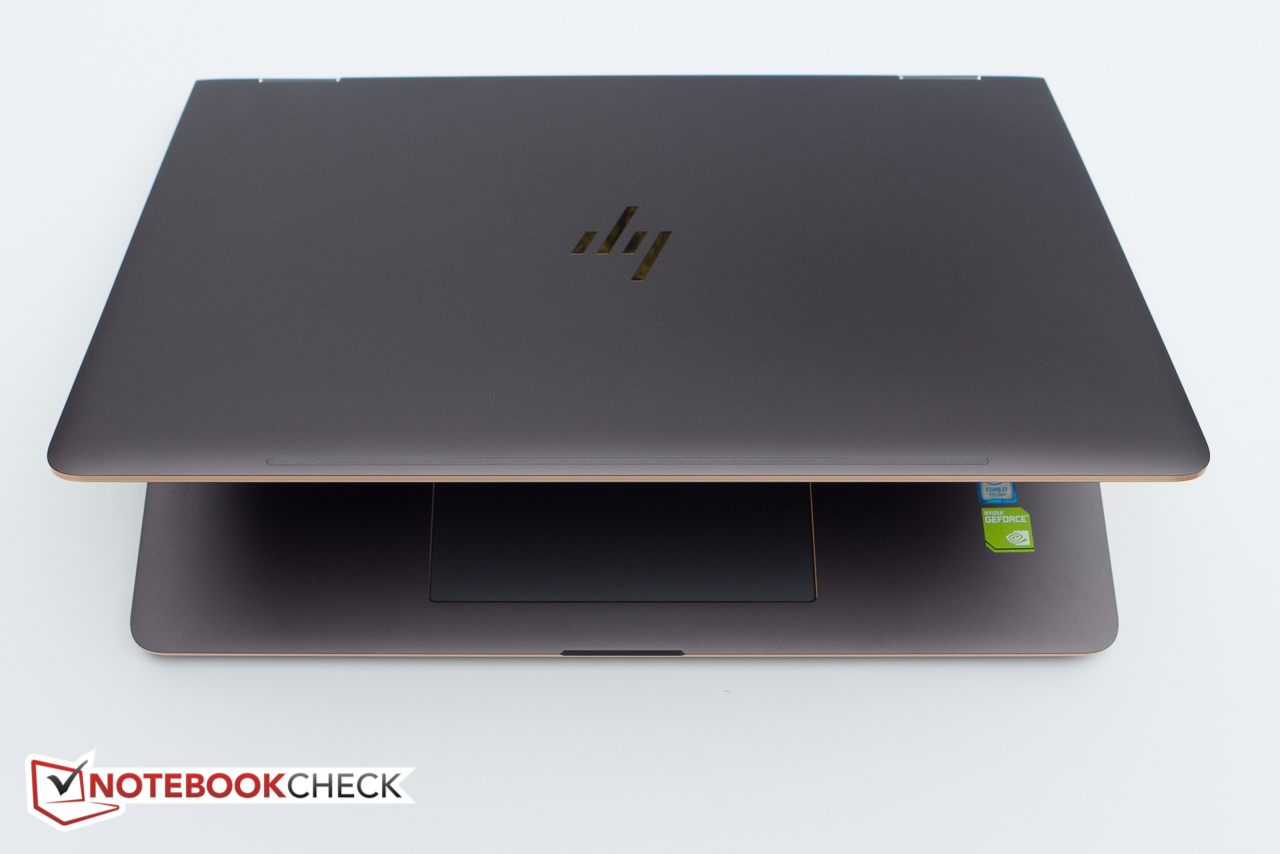
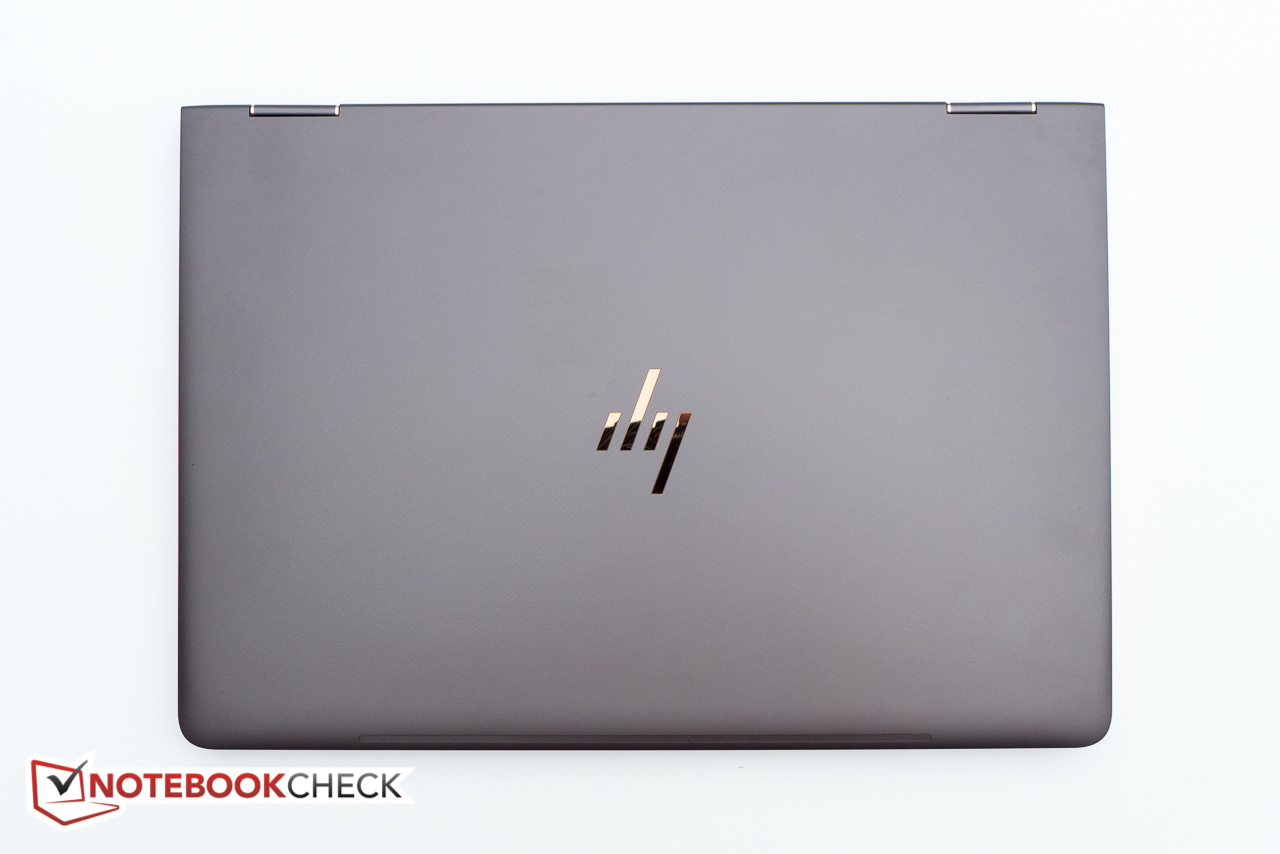
O HP Spectre x360 de 15,6 polegadas, recentemente redesenhado dá continuidade ao irmão menor de 13,3 polegadas. O chassi de alumínio CNC é sólido e se sente tão bem quanto aparenta, apesar do fato de que é um pouco mais grosso que antes. O hardware atualizado com processador Kaby Lake i7 e SSD M.2 de 512 GB é poderoso e também relativamente preparado para o futuro. A bateria de maior capacidade lida bem com os requerimentos de energia aumentados e a duração da bateria melhorou em comparação com o predecessor. O painel 4K - agora RGB padrão, em vez de PenTile - é brilhante e vívido, os dispositivos de entrada são bons e o Active Pen faz com que tomar notas seja uma experiência prazerosa. Uma das maiores novidades é a mudança para uma GPU dedicada, que deveria atrair usuários interessados em sessões de jogos ocasionais, além de tarefas produtivas.
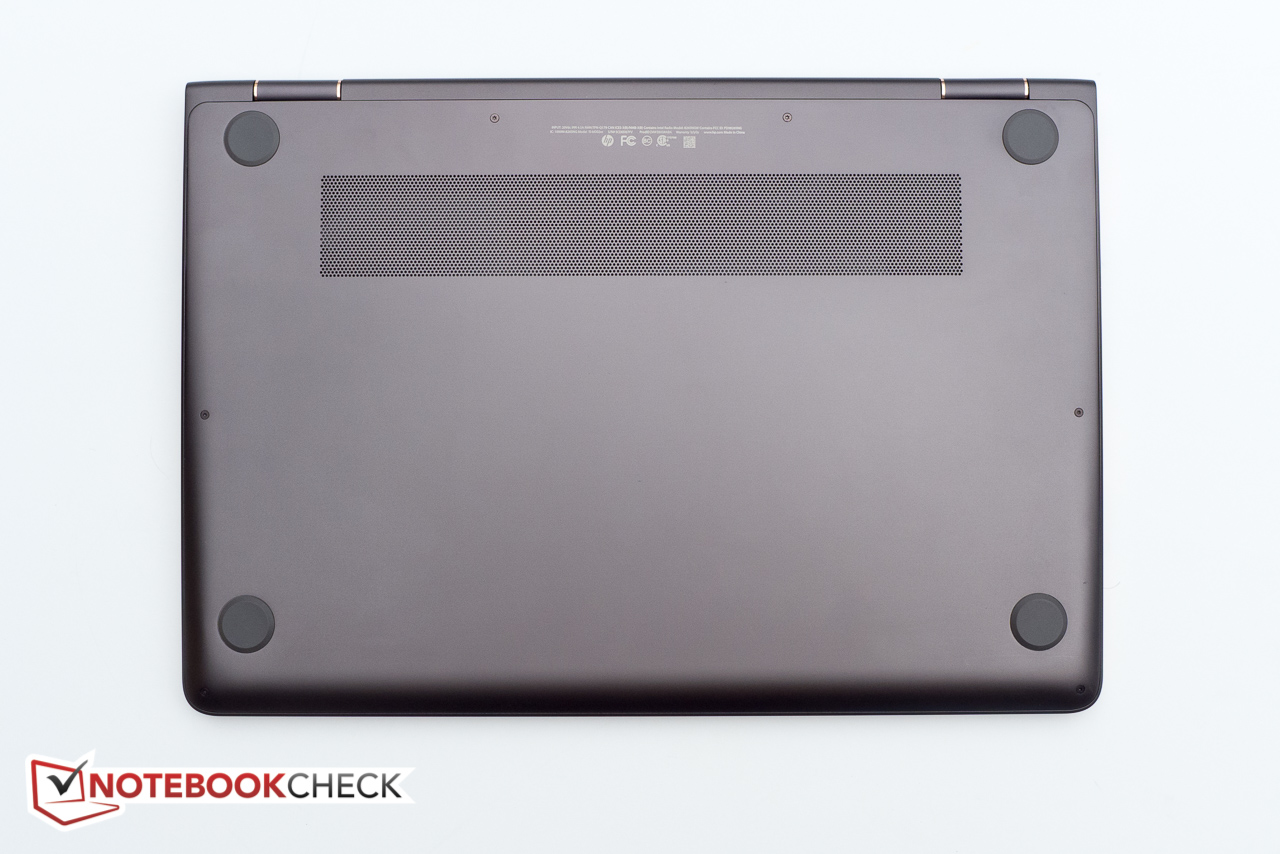
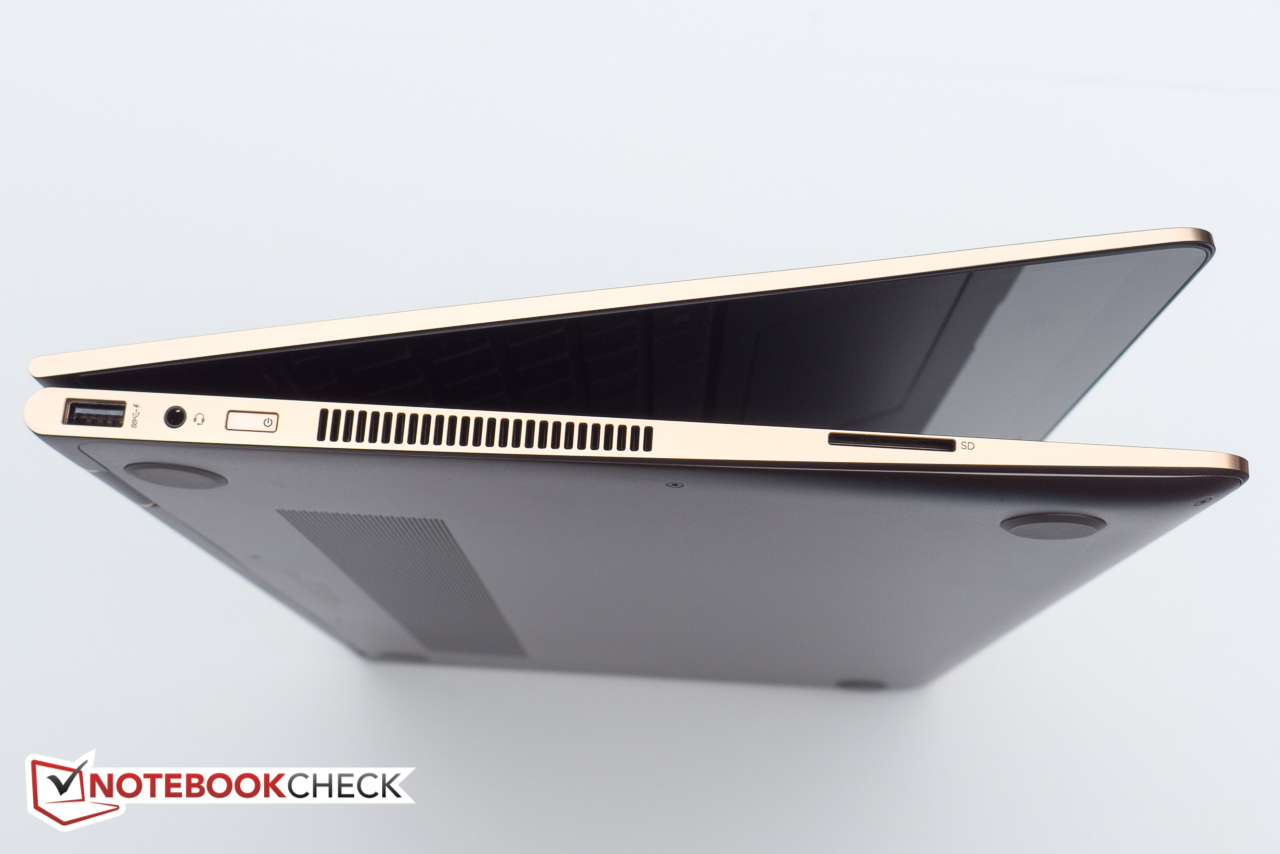
Temos pouco que reclamar sobre: A tampa da tela de vidro colado que é pesada, portanto, as dobradiças não a seguram tão firmemente como gostaríamos. Não existe nenhum tipo de "para-choques" protetores que rodeiem a unidade de base ou a tela, por isso o conversível se desliza sobre superfícies lisas e as bordas de alumínio provavelmente se raspem ou arranhem se o conversível for usado no modo tenda em superfícies menos do que ideais. As telas 4K ainda sofrem com problemas de dimensionamento, às vezes e nem todos os usuários precisam ou querem uma resolução tão alta, portanto, teria sido bom para a HP oferecer um painel Full-HD ou WQHD, pelo menos como uma opção. Finalmente, um conversível de 15,6 polegadas é grande e pesado mesmo tendo marcos ultrafinos, portanto, sua utilidade como um tablet pode ser um pouco limitada.
Não conseguimos encontrar muitas falhas no HP Spectre x360 15. É um 2-em-1 sólido e de bom desempenho e como tal, uma das melhores opções ao considerar um conversível grande.
HP Spectre x360 15-bl002xx
- 03/07/2017 v6 (old)
Bernhard Pechlaner
Price comparison
