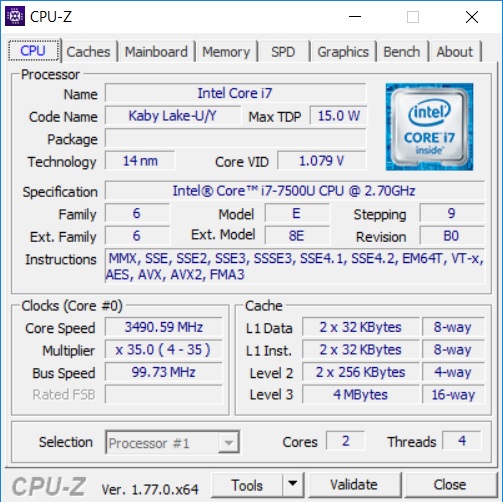
Breve Análise do Portátil Asus ZenBook UX530UX (i7-7500U, GTX 950M)
| SD Card Reader | |
| average JPG Copy Test (av. of 3 runs) | |
| Asus ZenBook Pro UX550VD (Toshiba Exceria Pro M501) | |
| Lenovo ThinkPad E570-20H6S00000 (Toshiba Exceria Pro SDXC 64 GB UHS-II) | |
| Acer Aspire E5-575G-549D (Toshiba Exceria Pro SDXC 64 GB UHS-II) | |
| Asus ZenBook UX530UX-FY070T (Toshiba Exceria Pro SDXC 64 GB UHS-II) | |
| maximum AS SSD Seq Read Test (1GB) | |
| Lenovo ThinkPad E570-20H6S00000 (Toshiba Exceria Pro SDXC 64 GB UHS-II) | |
| Acer Aspire E5-575G-549D (Toshiba Exceria Pro SDXC 64 GB UHS-II) | |
| Asus ZenBook UX530UX-FY070T (Toshiba Exceria Pro SDXC 64 GB UHS-II) | |
| Networking | |
| iperf3 transmit AX12 | |
| Asus ZenBook UX530UX-FY070T | |
| Lenovo ThinkPad E570-20H6S00000 | |
| Asus ZenBook Pro UX550VD | |
| iperf3 receive AX12 | |
| Asus ZenBook Pro UX550VD | |
| Asus ZenBook UX530UX-FY070T | |
| Lenovo ThinkPad E570-20H6S00000 | |
| |||||||||||||||||||||||||
iluminação: 80 %
Contraste: 1288:1 (Preto: 0.24 cd/m²)
ΔE ColorChecker Calman: 4.09 | ∀{0.5-29.43 Ø4.71}
ΔE Greyscale Calman: 4.75 | ∀{0.09-98 Ø4.96}
90% sRGB (Argyll 1.6.3 3D)
58% AdobeRGB 1998 (Argyll 1.6.3 3D)
65.2% AdobeRGB 1998 (Argyll 3D)
90.6% sRGB (Argyll 3D)
64.3% Display P3 (Argyll 3D)
Gamma: 2.39
CCT: 7034 K
| Asus ZenBook UX530UX-FY070T Chi Mei CMN15E8, , 1920x1080, 15.6" | Lenovo ThinkPad E570-20H6S00000 AUO B156HAN04.4, , 1920x1080, 15.6" | Acer Aspire E5-575G-549D Chi Mei CMN15C4, , 1920x1080, 15.6" | Asus ZenBook Pro UX550VD CMN15E8 (N156HCE-EN1), , 1920x1080, 15.6" | |
|---|---|---|---|---|
| Display | -38% | -39% | 1% | |
| Display P3 Coverage (%) | 64.3 | 38.65 -40% | 38.57 -40% | 65.7 2% |
| sRGB Coverage (%) | 90.6 | 58 -36% | 57.4 -37% | 90.3 0% |
| AdobeRGB 1998 Coverage (%) | 65.2 | 39.94 -39% | 39.89 -39% | 65.9 1% |
| Response Times | -2% | 8% | 3% | |
| Response Time Grey 50% / Grey 80% * (ms) | 40 ? | 44.8 ? -12% | 39 ? 2% | 38.8 ? 3% |
| Response Time Black / White * (ms) | 28 ? | 25.6 ? 9% | 24 ? 14% | 27.2 ? 3% |
| PWM Frequency (Hz) | 25000 ? | 25910 ? | ||
| Screen | -16% | -61% | -4% | |
| Brightness middle (cd/m²) | 309 | 242 -22% | 176 -43% | 335 8% |
| Brightness (cd/m²) | 296 | 243 -18% | 169 -43% | 313 6% |
| Brightness Distribution (%) | 80 | 75 -6% | 91 14% | 83 4% |
| Black Level * (cd/m²) | 0.24 | 0.24 -0% | 0.47 -96% | 0.27 -13% |
| Contrast (:1) | 1288 | 1008 -22% | 374 -71% | 1241 -4% |
| Colorchecker dE 2000 * | 4.09 | 4.65 -14% | 8.83 -116% | 4.7 -15% |
| Colorchecker dE 2000 max. * | 7.44 | 9.64 -30% | 14.01 -88% | 8.1 -9% |
| Greyscale dE 2000 * | 4.75 | 3.39 29% | 8.97 -89% | 5.8 -22% |
| Gamma | 2.39 92% | 2.7 81% | 2.43 91% | 2.06 107% |
| CCT | 7034 92% | 6246 104% | 10234 64% | 6518 100% |
| Color Space (Percent of AdobeRGB 1998) (%) | 58 | 36.69 -37% | 36.8 -37% | 58.7 1% |
| Color Space (Percent of sRGB) (%) | 90 | 57.66 -36% | 57.3 -36% | 90.1 0% |
| Média Total (Programa/Configurações) | -19% /
-18% | -31% /
-47% | 0% /
-2% |
* ... menor é melhor
Exibir tempos de resposta
| ↔ Tempo de resposta preto para branco | ||
|---|---|---|
| 28 ms ... ascensão ↗ e queda ↘ combinadas | ↗ 16 ms ascensão | 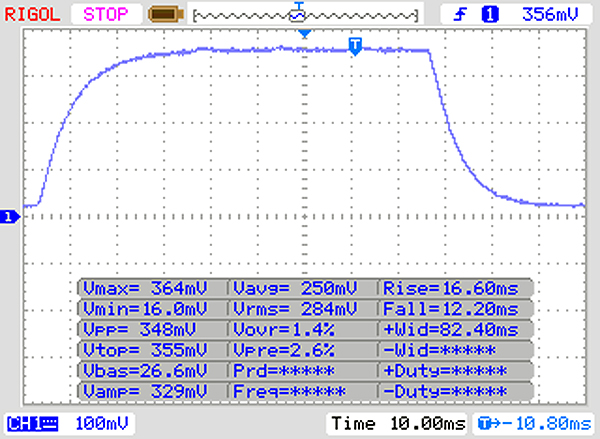 |
| ↘ 12 ms queda | ||
| A tela mostra taxas de resposta relativamente lentas em nossos testes e pode ser muito lenta para os jogadores. Em comparação, todos os dispositivos testados variam de 0.1 (mínimo) a 240 (máximo) ms. » 71 % de todos os dispositivos são melhores. Isso significa que o tempo de resposta medido é pior que a média de todos os dispositivos testados (19.8 ms). | ||
| ↔ Tempo de resposta 50% cinza a 80% cinza | ||
| 40 ms ... ascensão ↗ e queda ↘ combinadas | ↗ 22 ms ascensão | 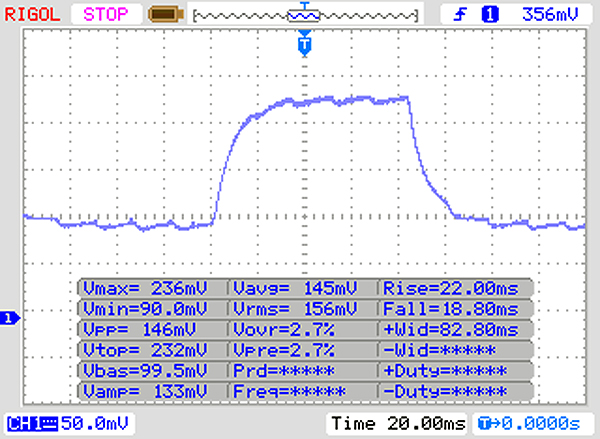 |
| ↘ 18 ms queda | ||
| A tela mostra taxas de resposta lentas em nossos testes e será insatisfatória para os jogadores. Em comparação, todos os dispositivos testados variam de 0.165 (mínimo) a 636 (máximo) ms. » 61 % de todos os dispositivos são melhores. Isso significa que o tempo de resposta medido é pior que a média de todos os dispositivos testados (31 ms). | ||
Cintilação da tela / PWM (modulação por largura de pulso)
| Tela tremeluzindo/PWM detectado | 25000 Hz | ≤ 20 % configuração de brilho | 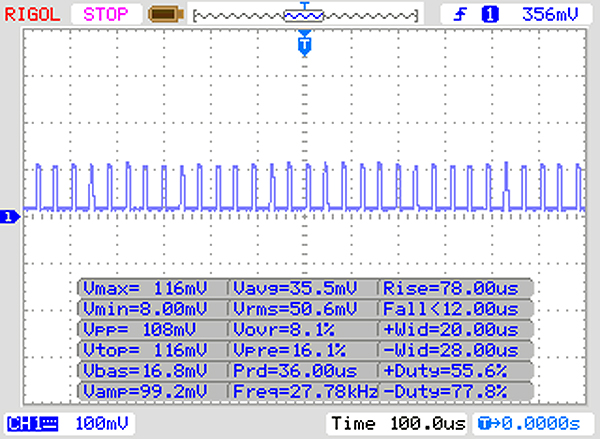 |
A luz de fundo da tela pisca em 25000 Hz (pior caso, por exemplo, utilizando PWM) Cintilação detectada em uma configuração de brilho de 20 % e abaixo. Não deve haver cintilação ou PWM acima desta configuração de brilho. A frequência de 25000 Hz é bastante alta, então a maioria dos usuários sensíveis ao PWM não deve notar nenhuma oscilação. [pwm_comparison] Em comparação: 52 % de todos os dispositivos testados não usam PWM para escurecer a tela. Se PWM foi detectado, uma média de 7754 (mínimo: 5 - máximo: 343500) Hz foi medida. | |||
| PCMark 8 Home Score Accelerated v2 | 3515 pontos | |
| PCMark 8 Work Score Accelerated v2 | 4661 pontos | |
Ajuda | ||
| Asus ZenBook UX530UX-FY070T SK Hynix HFS256G39TND-N210A | Lenovo ThinkPad E570-20H6S00000 Toshiba THNSF5256GPUK | Acer Aspire E5-575G-549D Toshiba MQ01ABD100 | Asus ZenBook Pro UX550VD Samsung PM961 NVMe MZVLW512HMJP | |
|---|---|---|---|---|
| CrystalDiskMark 3.0 | 188% | -86% | 334% | |
| Read Seq (MB/s) | 282.2 | 1140 304% | 95.3 -66% | 1434 408% |
| Write Seq (MB/s) | 184.5 | 468.1 154% | 85.6 -54% | 1365 640% |
| Read 512 (MB/s) | 233.5 | 759 225% | 29.32 -87% | 614 163% |
| Write 512 (MB/s) | 140.1 | 414 196% | 25.93 -81% | 688 391% |
| Read 4k (MB/s) | 24.42 | 34.3 40% | 0.366 -99% | 60.6 148% |
| Write 4k (MB/s) | 48.98 | 123.4 152% | 0.726 -99% | 158 223% |
| Read 4k QD32 (MB/s) | 170 | 530 212% | 0.647 -100% | 617 263% |
| Write 4k QD32 (MB/s) | 98.5 | 319.2 224% | 0.722 -99% | 525 433% |

| 3DMark 11 - 1280x720 Performance GPU | |
| Asus ZenBook Pro UX550VD | |
| Média NVIDIA GeForce GTX 950M (4046 - 4678, n=28) | |
| Acer Aspire E5-575G-549D | |
| Lenovo ThinkPad E570-20H6S00000 | |
| Asus ZenBook UX530UX-FY070T | |
| 3DMark | |
| 1280x720 Cloud Gate Standard Graphics | |
| Asus ZenBook Pro UX550VD | |
| Acer Aspire E5-575G-549D | |
| Lenovo ThinkPad E570-20H6S00000 | |
| Média NVIDIA GeForce GTX 950M (18547 - 25900, n=28) | |
| Asus ZenBook UX530UX-FY070T | |
| 1920x1080 Fire Strike Graphics | |
| Asus ZenBook Pro UX550VD | |
| Acer Aspire E5-575G-549D | |
| Lenovo ThinkPad E570-20H6S00000 | |
| Asus ZenBook UX530UX-FY070T | |
| Média NVIDIA GeForce GTX 950M (2931 - 3638, n=28) | |
| 3DMark 11 Performance | 4006 pontos | |
| 3DMark Cloud Gate Standard Score | 1262 pontos | |
| 3DMark Fire Strike Score | 2638 pontos | |
Ajuda | ||
| baixo | média | alto | ultra | |
|---|---|---|---|---|
| The Witcher 3 (2015) | 42.5 | 36.04 | 20.02 | 10.71 |
| Rise of the Tomb Raider (2016) | 67.1 | 37.32 | 21.49 | 17.89 |
| Rocket League (2017) | 143.2 | 54.8 | 40.33 |
| The Witcher 3 | |
| 1024x768 Low Graphics & Postprocessing | |
| Média NVIDIA GeForce GTX 950M (42.5 - 67, n=7) | |
| Asus ZenBook UX530UX-FY070T | |
| 1366x768 Medium Graphics & Postprocessing | |
| Asus ZenBook Pro UX550VD | |
| Média NVIDIA GeForce GTX 950M (33 - 40.7, n=8) | |
| Asus ZenBook UX530UX-FY070T | |
| 1920x1080 High Graphics & Postprocessing (Nvidia HairWorks Off) | |
| Asus ZenBook Pro UX550VD | |
| Asus ZenBook UX530UX-FY070T | |
| Média NVIDIA GeForce GTX 950M (16.2 - 22.3, n=7) | |
| Rocket League | |
| 1280x720 Performance | |
| Asus ZenBook UX530UX-FY070T | |
| Média NVIDIA GeForce GTX 950M (n=1) | |
| 1920x1080 Quality AA:Medium FX | |
| Asus ZenBook UX530UX-FY070T | |
| Média NVIDIA GeForce GTX 950M (n=1) | |
| 1920x1080 High Quality AA:High FX | |
| Média NVIDIA GeForce GTX 950M (40.3 - 68.4, n=2) | |
| Asus ZenBook UX530UX-FY070T | |
| Rise of the Tomb Raider | |
| 1024x768 Lowest Preset | |
| Lenovo ThinkPad E570-20H6S00000 | |
| Asus ZenBook UX530UX-FY070T | |
| Média NVIDIA GeForce GTX 950M (42.6 - 71.4, n=9) | |
| Acer Aspire E5-575G-549D | |
| 1366x768 Medium Preset AF:2x | |
| Asus ZenBook Pro UX550VD | |
| Lenovo ThinkPad E570-20H6S00000 | |
| Asus ZenBook UX530UX-FY070T | |
| Média NVIDIA GeForce GTX 950M (28.8 - 41, n=10) | |
| Acer Aspire E5-575G-549D | |
| 1920x1080 High Preset AA:FX AF:4x | |
| Asus ZenBook Pro UX550VD | |
| Asus ZenBook UX530UX-FY070T | |
| Lenovo ThinkPad E570-20H6S00000 | |
| Média NVIDIA GeForce GTX 950M (16.9 - 23.1, n=10) | |
| Acer Aspire E5-575G-549D | |
| Asus ZenBook UX530UX-FY070T GeForce GTX 950M, i7-7500U, SK Hynix HFS256G39TND-N210A | Lenovo ThinkPad E570-20H6S00000 GeForce GTX 950M, i5-7200U, Toshiba THNSF5256GPUK | Acer Aspire E5-575G-549D GeForce GTX 950M, i5-7200U, Toshiba MQ01ABD100 | Asus ZenBook Pro UX550VD GeForce GTX 1050 Mobile, i7-7700HQ, Samsung PM961 NVMe MZVLW512HMJP | |
|---|---|---|---|---|
| Noise | 3% | 0% | -0% | |
| desligado / ambiente * (dB) | 30.2 | 29 4% | 28.9 4% | 29.4 3% |
| Idle Minimum * (dB) | 30.2 | 29 4% | 30.8 -2% | 29.4 3% |
| Idle Average * (dB) | 30.2 | 29 4% | 30.8 -2% | 29.9 1% |
| Idle Maximum * (dB) | 31.6 | 29 8% | 30.8 3% | 29.9 5% |
| Load Average * (dB) | 36 | 34.3 5% | 33.4 7% | 38.3 -6% |
| Load Maximum * (dB) | 36.6 | 40.1 -10% | 40.1 -10% | 39.6 -8% |
| Witcher 3 ultra * (dB) | 39.8 |
* ... menor é melhor
Barulho
| Ocioso |
| 30.2 / 30.2 / 31.6 dB |
| Carga |
| 36 / 36.6 dB |
 | ||
30 dB silencioso 40 dB(A) audível 50 dB(A) ruidosamente alto |
||
min: | ||
(-) A temperatura máxima no lado superior é 48.2 °C / 119 F, em comparação com a média de 36.8 °C / 98 F , variando de 21 a 71 °C para a classe Multimedia.
(-) A parte inferior aquece até um máximo de 45.8 °C / 114 F, em comparação com a média de 39.1 °C / 102 F
(+) Em uso inativo, a temperatura média para o lado superior é 24.3 °C / 76 F, em comparação com a média do dispositivo de 31.3 °C / ### class_avg_f### F.
(+) Os apoios para as mãos e o touchpad são mais frios que a temperatura da pele, com um máximo de 29.8 °C / 85.6 F e, portanto, são frios ao toque.
(±) A temperatura média da área do apoio para as mãos de dispositivos semelhantes foi 28.7 °C / 83.7 F (-1.1 °C / -1.9 F).
| Asus ZenBook UX530UX-FY070T GeForce GTX 950M, i7-7500U, SK Hynix HFS256G39TND-N210A | Lenovo ThinkPad E570-20H6S00000 GeForce GTX 950M, i5-7200U, Toshiba THNSF5256GPUK | Acer Aspire E5-575G-549D GeForce GTX 950M, i5-7200U, Toshiba MQ01ABD100 | Asus ZenBook Pro UX550VD GeForce GTX 1050 Mobile, i7-7700HQ, Samsung PM961 NVMe MZVLW512HMJP | |
|---|---|---|---|---|
| Heat | -1% | -21% | -2% | |
| Maximum Upper Side * (°C) | 48.2 | 46.6 3% | 48.1 -0% | 43.6 10% |
| Maximum Bottom * (°C) | 45.8 | 49.1 -7% | 60.8 -33% | 44.5 3% |
| Idle Upper Side * (°C) | 25 | 24.6 2% | 30.8 -23% | 28 -12% |
| Idle Bottom * (°C) | 24.9 | 25.1 -1% | 31.9 -28% | 26.7 -7% |
* ... menor é melhor
Asus ZenBook UX530UX-FY070T análise de áudio
(-) | alto-falantes não muito altos (###valor### dB)
Graves 100 - 315Hz
(-) | quase nenhum baixo - em média 15.8% menor que a mediana
(±) | a linearidade dos graves é média (7.6% delta para a frequência anterior)
Médios 400 - 2.000 Hz
(+) | médios equilibrados - apenas 3.9% longe da mediana
(+) | médios são lineares (5.4% delta para frequência anterior)
Altos 2 - 16 kHz
(±) | máximos mais altos - em média 5.9% maior que a mediana
(±) | a linearidade dos máximos é média (9.7% delta para frequência anterior)
Geral 100 - 16.000 Hz
(±) | a linearidade do som geral é média (23.8% diferença em relação à mediana)
Comparado com a mesma classe
» 84% de todos os dispositivos testados nesta classe foram melhores, 6% semelhantes, 10% piores
» O melhor teve um delta de 5%, a média foi 17%, o pior foi 45%
Comparado com todos os dispositivos testados
» 71% de todos os dispositivos testados foram melhores, 6% semelhantes, 22% piores
» O melhor teve um delta de 4%, a média foi 23%, o pior foi 134%
Lenovo ThinkPad E570-20H6S00000 análise de áudio
(±) | o volume do alto-falante é médio, mas bom (###valor### dB)
Graves 100 - 315Hz
(-) | quase nenhum baixo - em média 16.8% menor que a mediana
(-) | graves não são lineares (16.4% delta para frequência anterior)
Médios 400 - 2.000 Hz
(±) | médios mais altos - em média 5.1% maior que a mediana
(±) | a linearidade dos médios é média (9.5% delta para frequência anterior)
Altos 2 - 16 kHz
(+) | agudos equilibrados - apenas 2.7% longe da mediana
(+) | os máximos são lineares (6.5% delta da frequência anterior)
Geral 100 - 16.000 Hz
(±) | a linearidade do som geral é média (19.6% diferença em relação à mediana)
Comparado com a mesma classe
» 64% de todos os dispositivos testados nesta classe foram melhores, 7% semelhantes, 29% piores
» O melhor teve um delta de 5%, a média foi 17%, o pior foi 45%
Comparado com todos os dispositivos testados
» 49% de todos os dispositivos testados foram melhores, 7% semelhantes, 44% piores
» O melhor teve um delta de 4%, a média foi 23%, o pior foi 134%
| desligado | |
| Ocioso | |
| Carga |
|
Key:
min: | |
| Asus ZenBook UX530UX-FY070T i7-7500U, GeForce GTX 950M, SK Hynix HFS256G39TND-N210A, IPS, 1920x1080, 15.6" | Lenovo ThinkPad E570-20H6S00000 i5-7200U, GeForce GTX 950M, Toshiba THNSF5256GPUK, IPS LED, 1920x1080, 15.6" | Acer Aspire E5-575G-549D i5-7200U, GeForce GTX 950M, Toshiba MQ01ABD100, TN, 1920x1080, 15.6" | Asus ZenBook Pro UX550VD i7-7700HQ, GeForce GTX 1050 Mobile, Samsung PM961 NVMe MZVLW512HMJP, IPS, 1920x1080, 15.6" | |
|---|---|---|---|---|
| Power Consumption | 6% | -29% | -51% | |
| Idle Minimum * (Watt) | 3.5 | 2.8 20% | 6 -71% | 5.05 -44% |
| Idle Average * (Watt) | 5.3 | 6.3 -19% | 8.1 -53% | 8.2 -55% |
| Idle Maximum * (Watt) | 9.1 | 6.9 24% | 9.8 -8% | 12.2 -34% |
| Load Average * (Watt) | 60 | 51.6 14% | 52.5 12% | 82 -37% |
| Load Maximum * (Watt) | 65 | 69.7 -7% | 81.6 -26% | 120 -85% |
| Witcher 3 ultra * (Watt) | 93.1 |
* ... menor é melhor
| Asus ZenBook UX530UX-FY070T i7-7500U, GeForce GTX 950M, 50 Wh | Lenovo ThinkPad E570-20H6S00000 i5-7200U, GeForce GTX 950M, 41 Wh | Acer Aspire E5-575G-549D i5-7200U, GeForce GTX 950M, 62 Wh | Asus ZenBook Pro UX550VD i7-7700HQ, GeForce GTX 1050 Mobile, 73 Wh | |
|---|---|---|---|---|
| Duração da bateria | 38% | 12% | 31% | |
| Reader / Idle (h) | 8.8 | 14.7 67% | 12.8 45% | 17.7 101% |
| H.264 (h) | 7 | 7.7 10% | 7.8 11% | |
| WiFi v1.3 (h) | 6.2 | 7.7 24% | 7.5 21% | 8.9 44% |
| Load (h) | 1.8 | 2.2 22% | 1.3 -28% | 1.2 -33% |
| Witcher 3 ultra (h) | 1.1 |
Pro
Contra
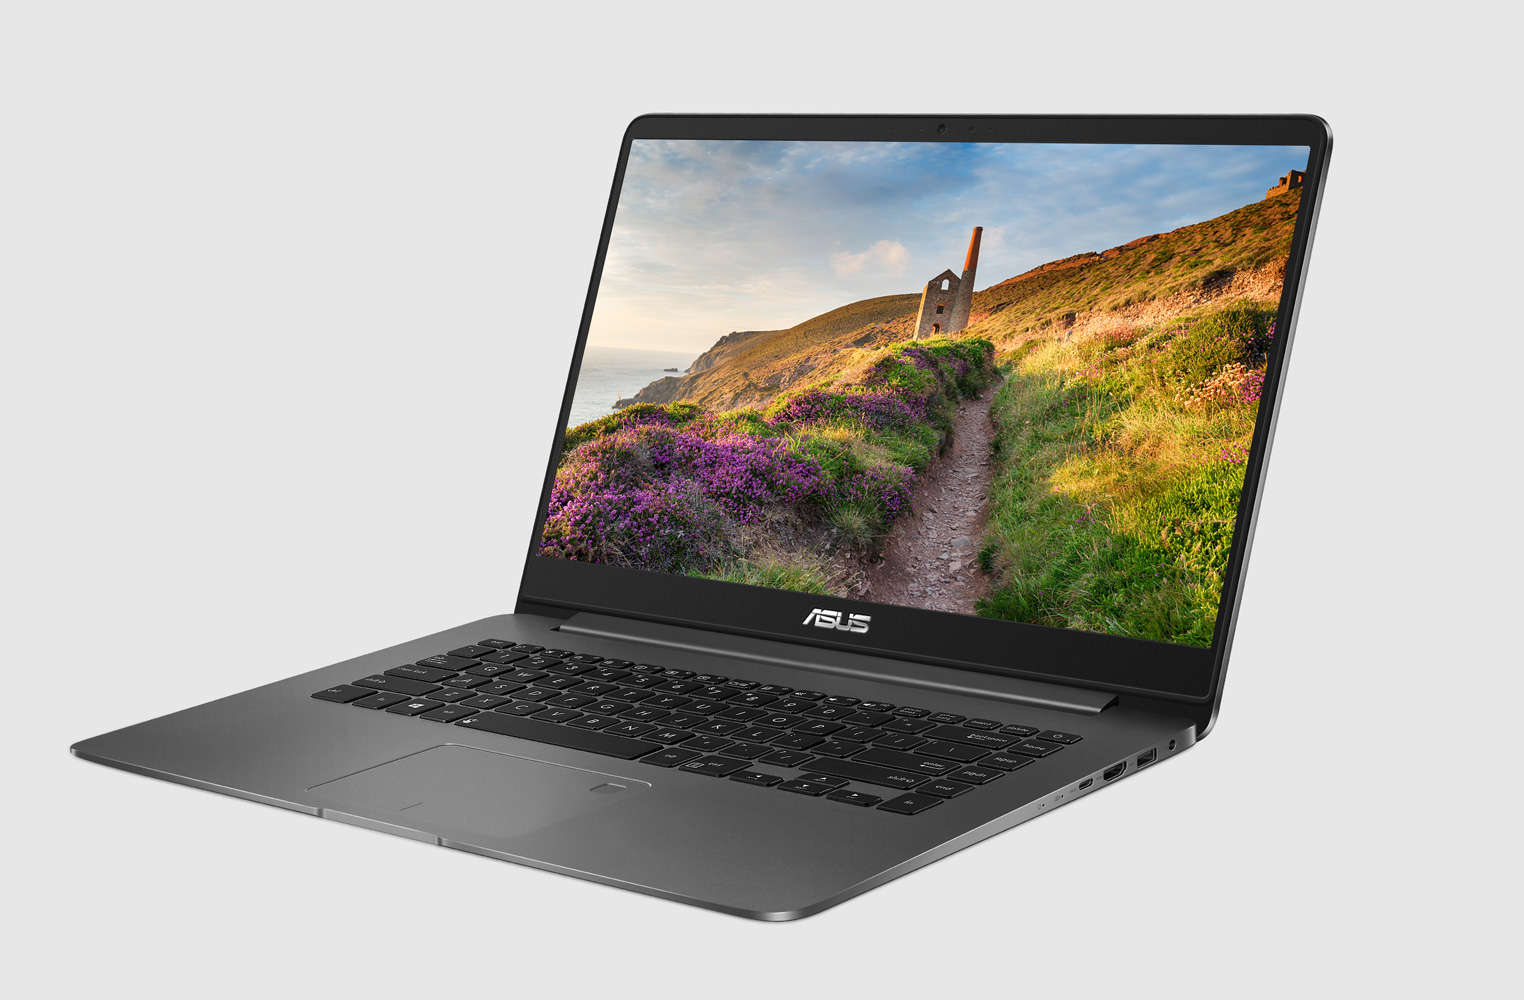
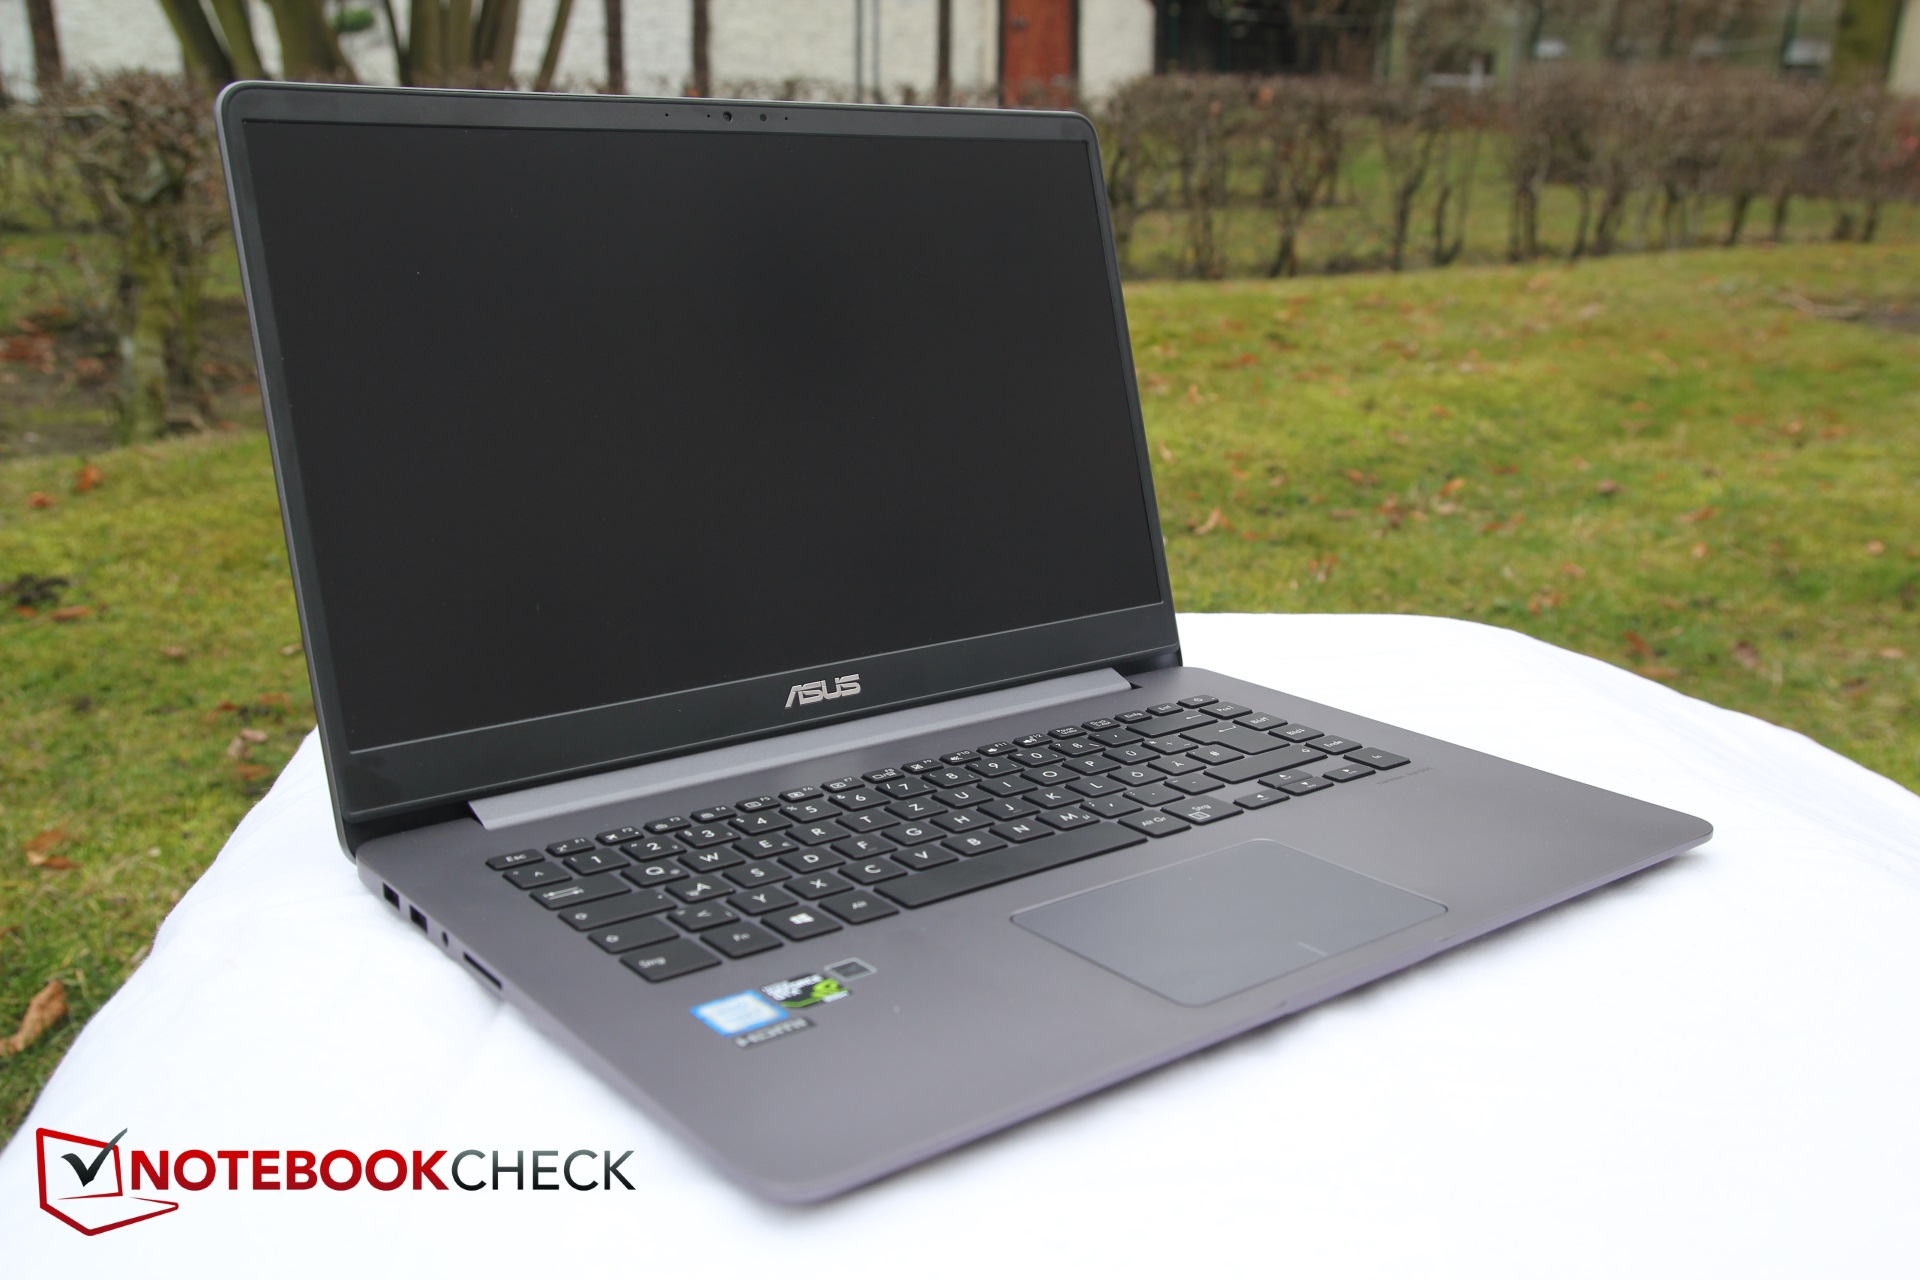
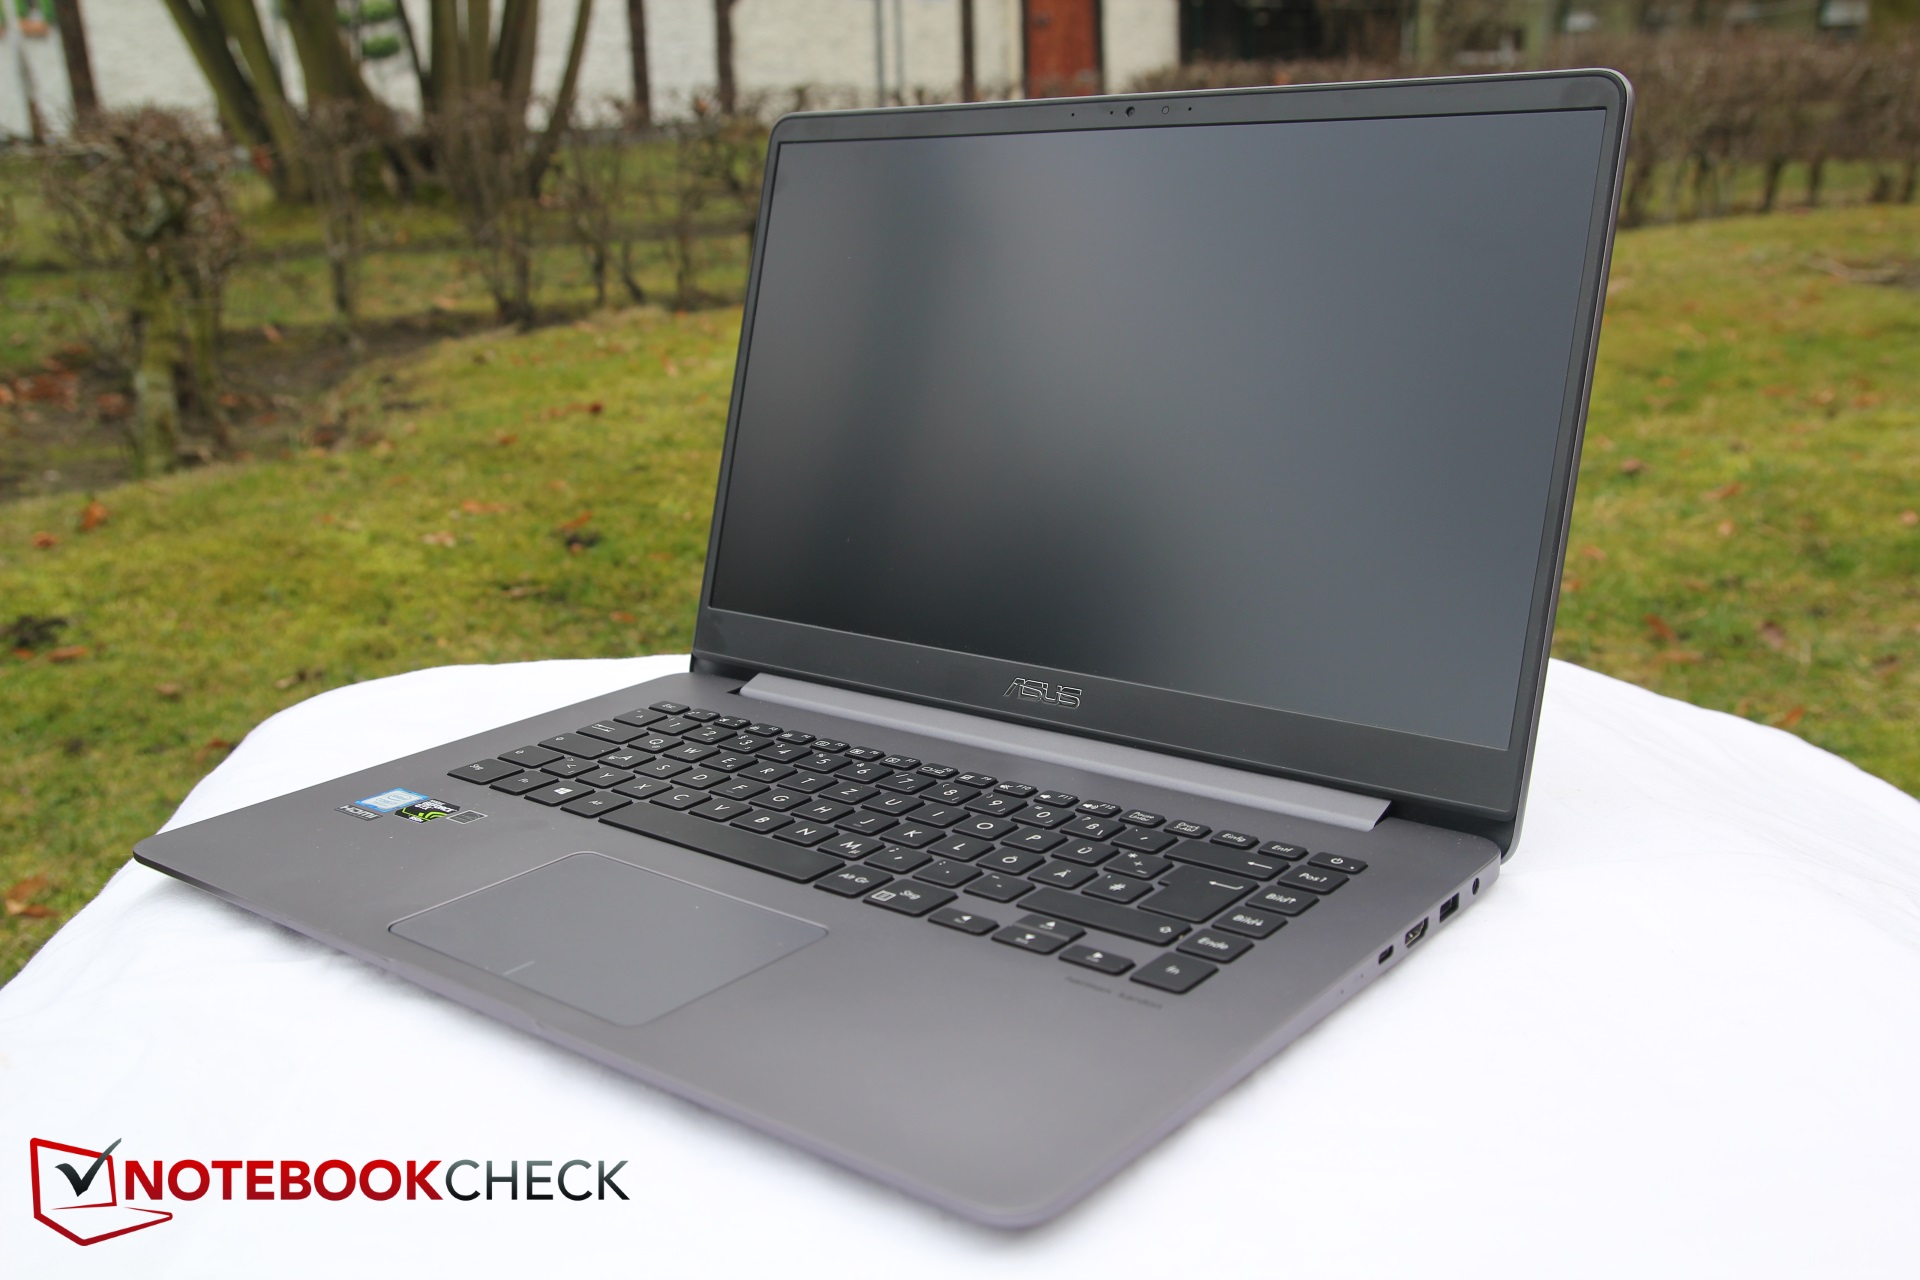
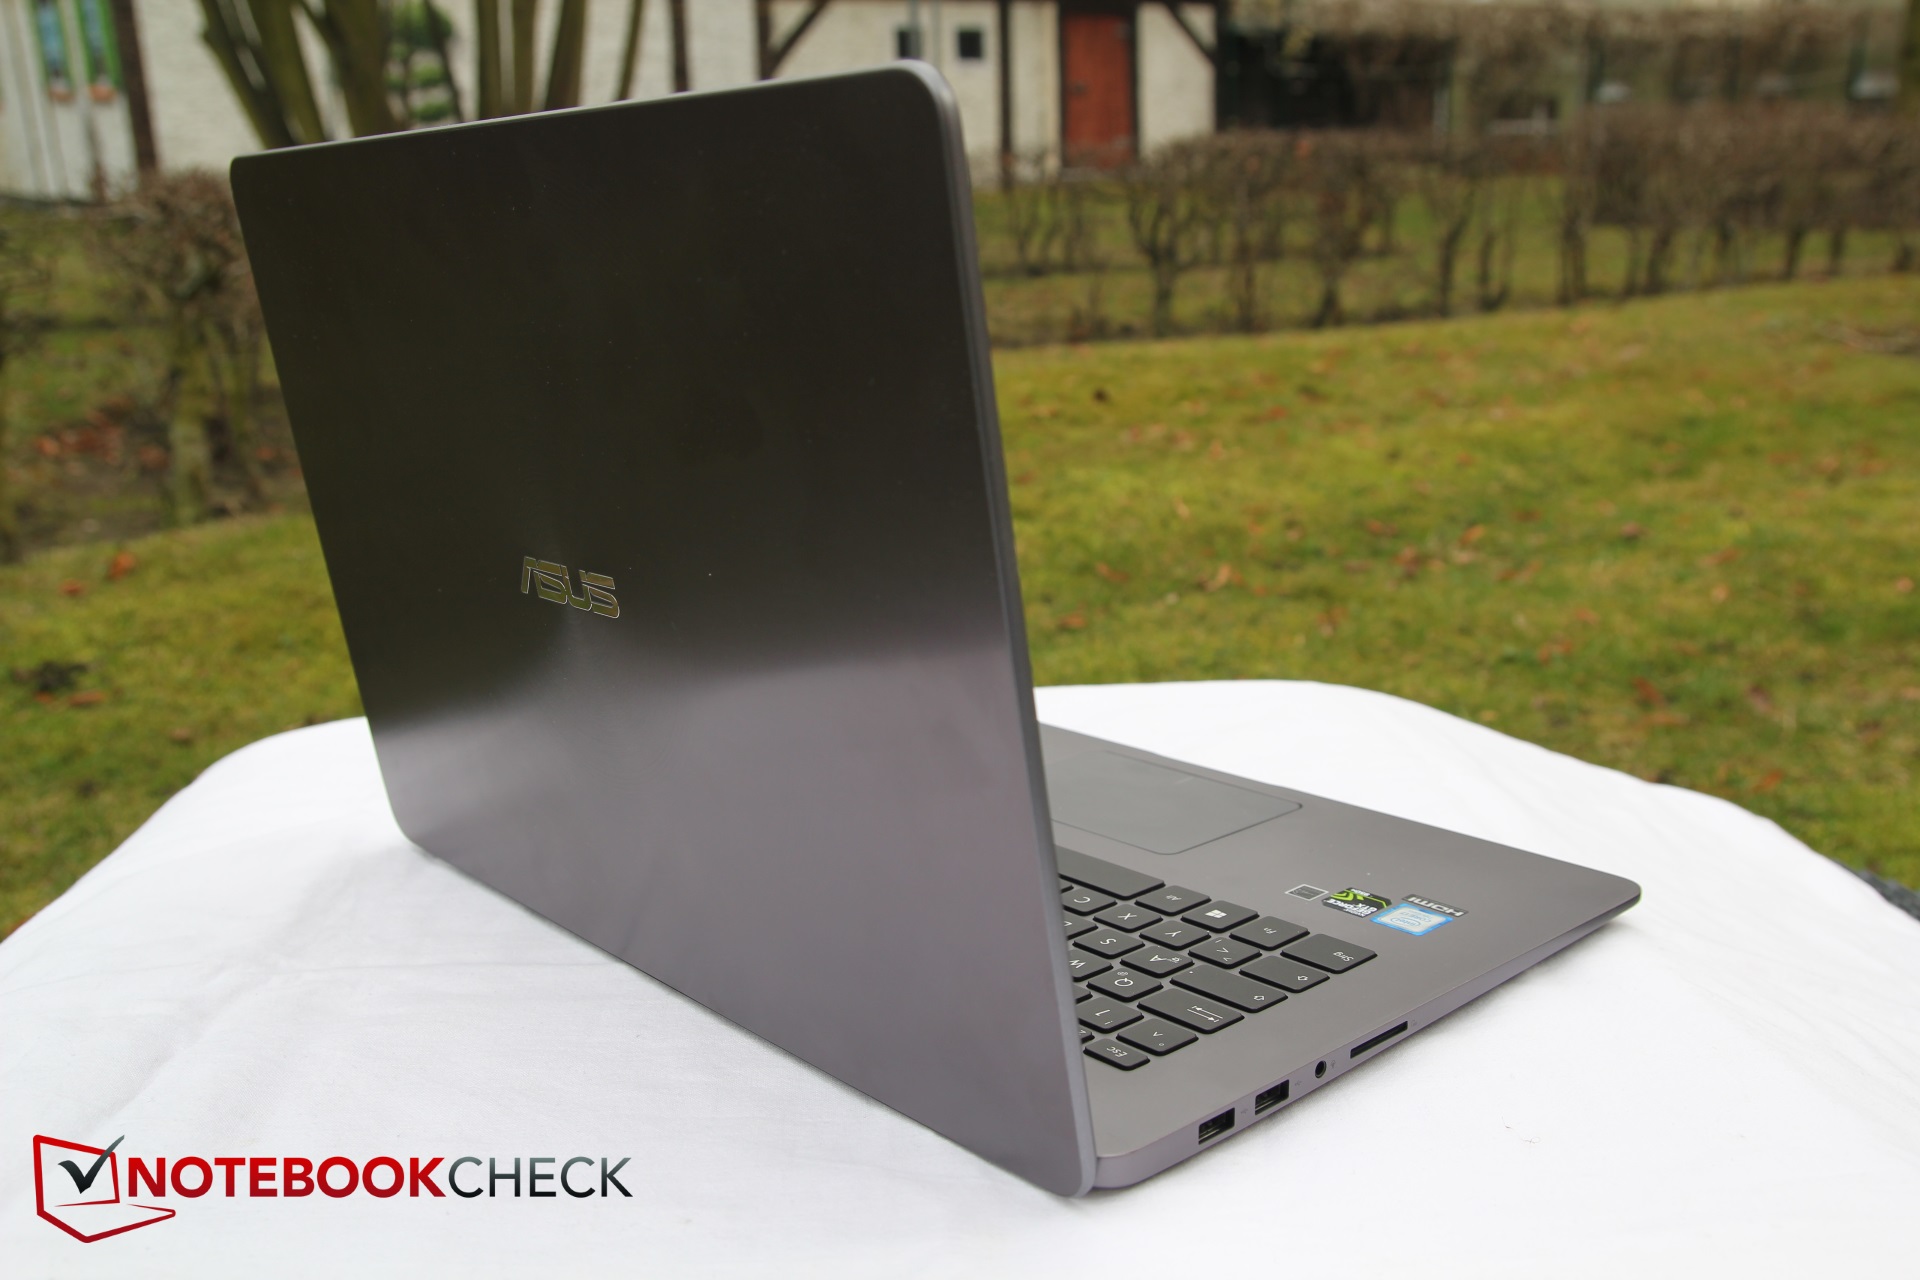
É bastante óbvio que público o Asus ZenBook UX530UX atende: Pessoas que desejam mobilidade, mas que não querem abrir mão de uma tela de 15 polegadas, e podem poupar o dinheiro. O novo ZenBook é pequeno, leve, elegante e de alta qualidade. Tem uma boa tela, e geralmente permanece agradavelmente frio e relativamente silencioso.
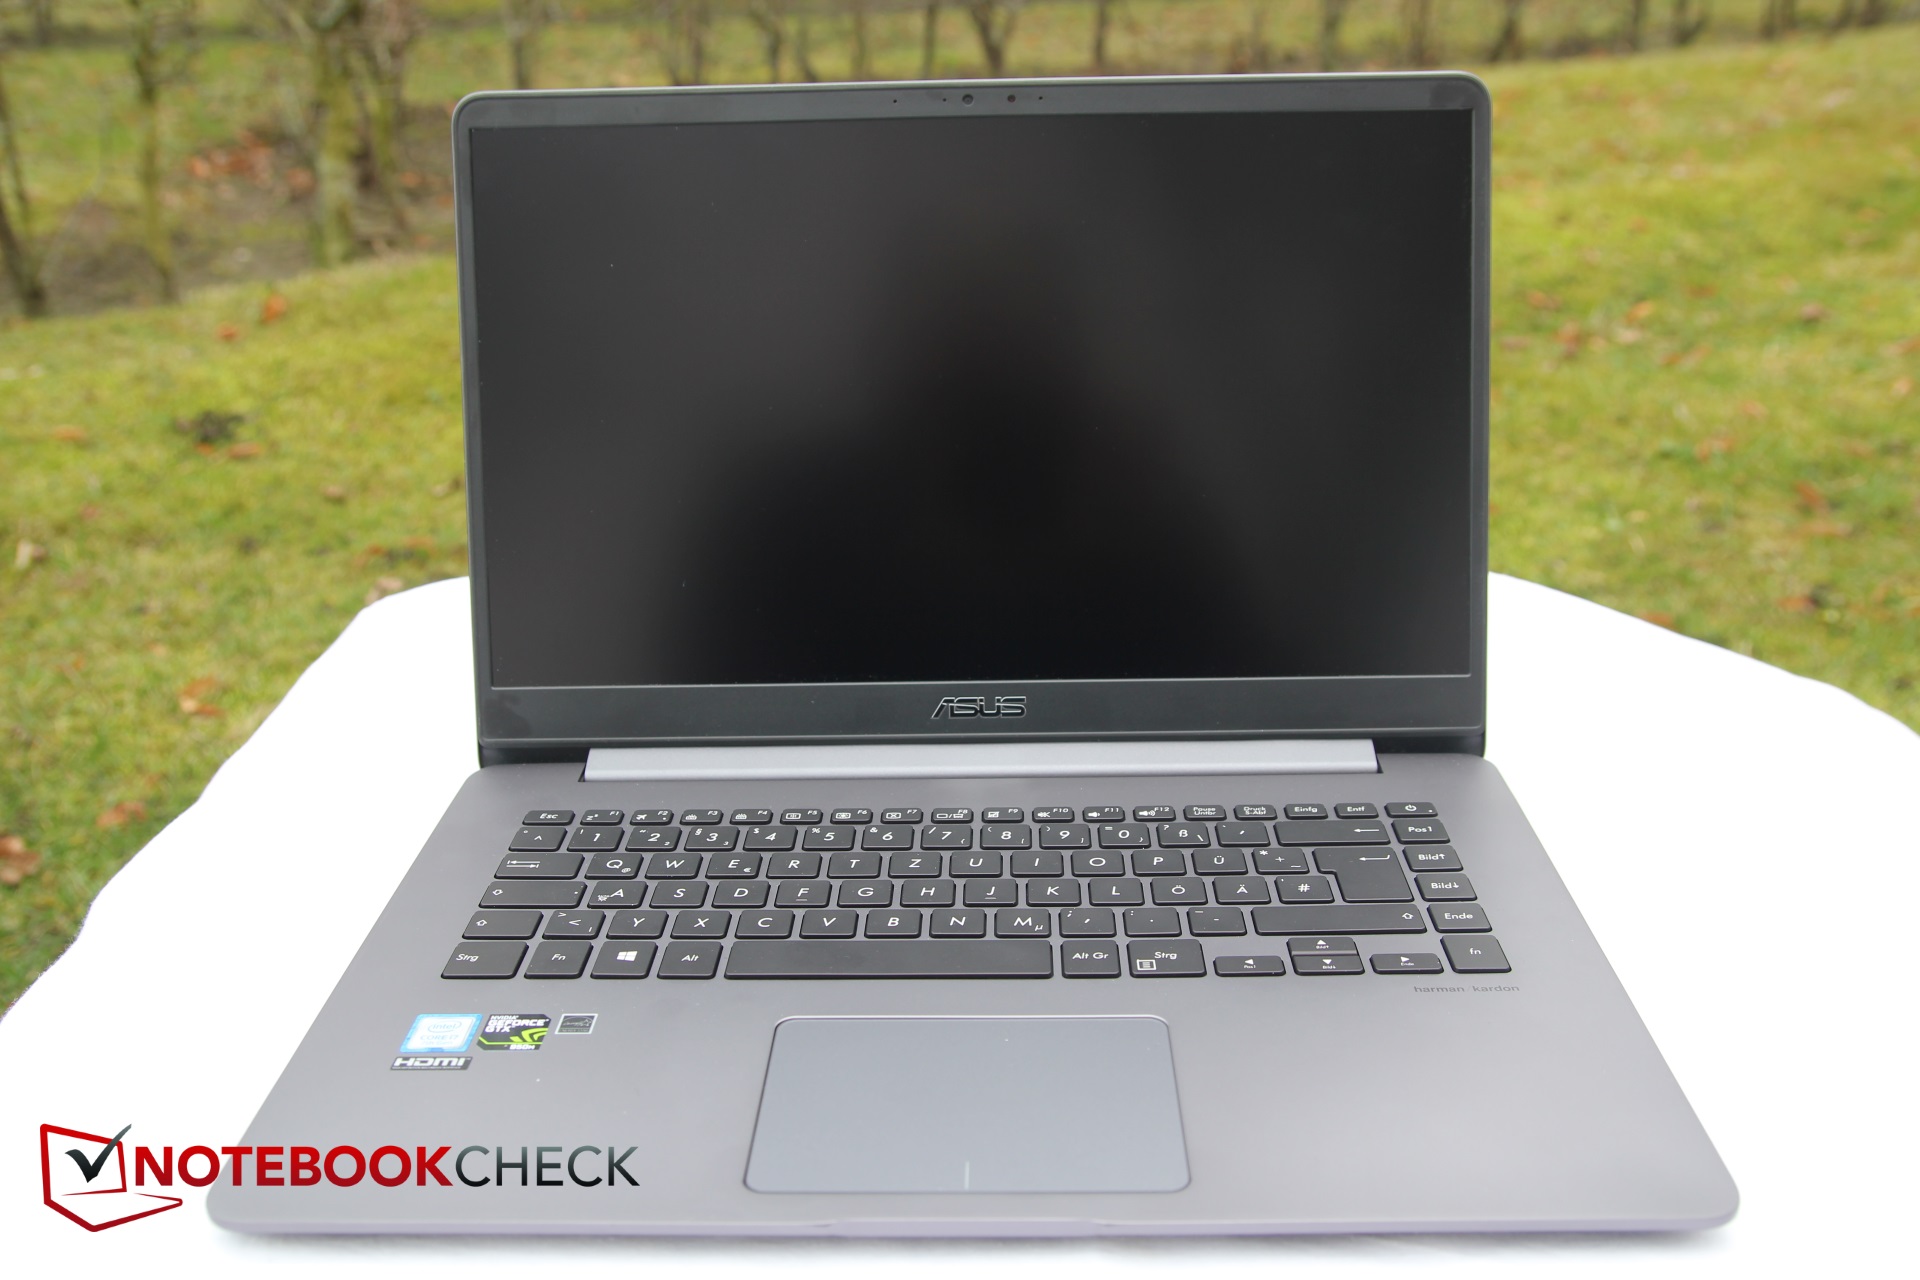
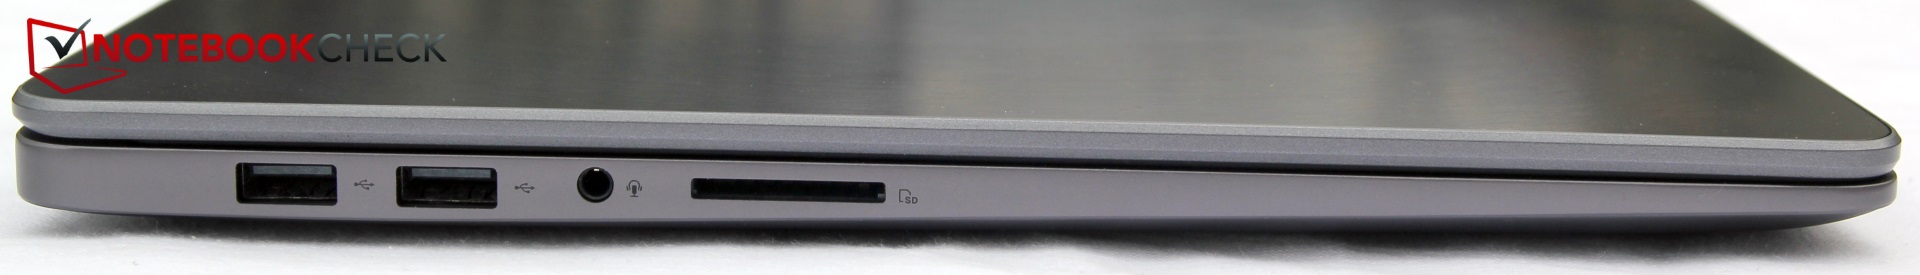
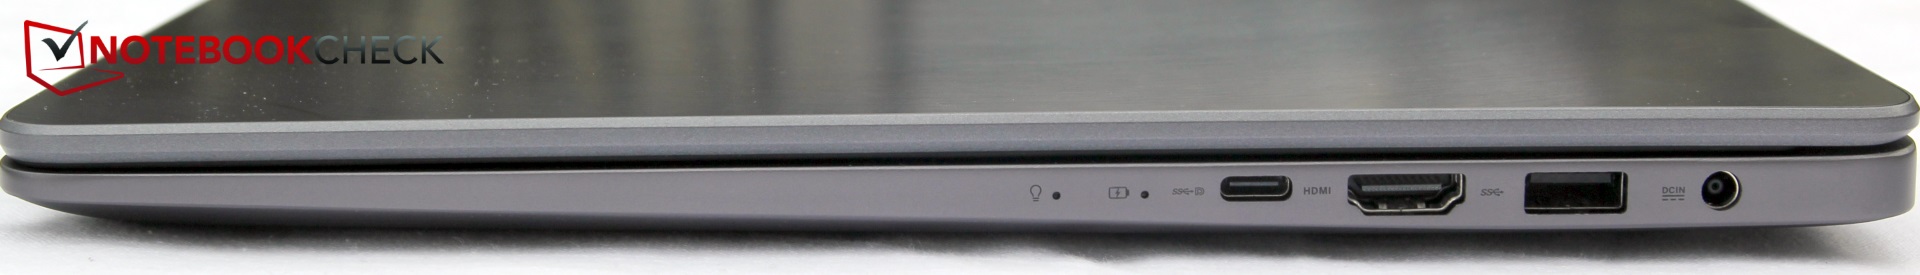
Qualquer pessoa que não se preocupa muito com o peso e a mobilidade provavelmente deve procurar um novo dispositivo em outro lugar. Do ponto de vista do desempenho, o ZenBook não vai inspirar muito entusiasmo, porque ele se afoga muito. O SSD instalado é de gama média e a inclusão de apenas o USB 2.0 não é mais adequado hoje em dia. Os concorrentes com um desempenho similar ou até mesmo melhor estão disponíveis por muito menos dinheiro. Por exemplo, o LenovoThinkPad E570, que é maior e mais pesado, mas com o mesmo desempenho, custa quase 500 euros (~$622) menos!
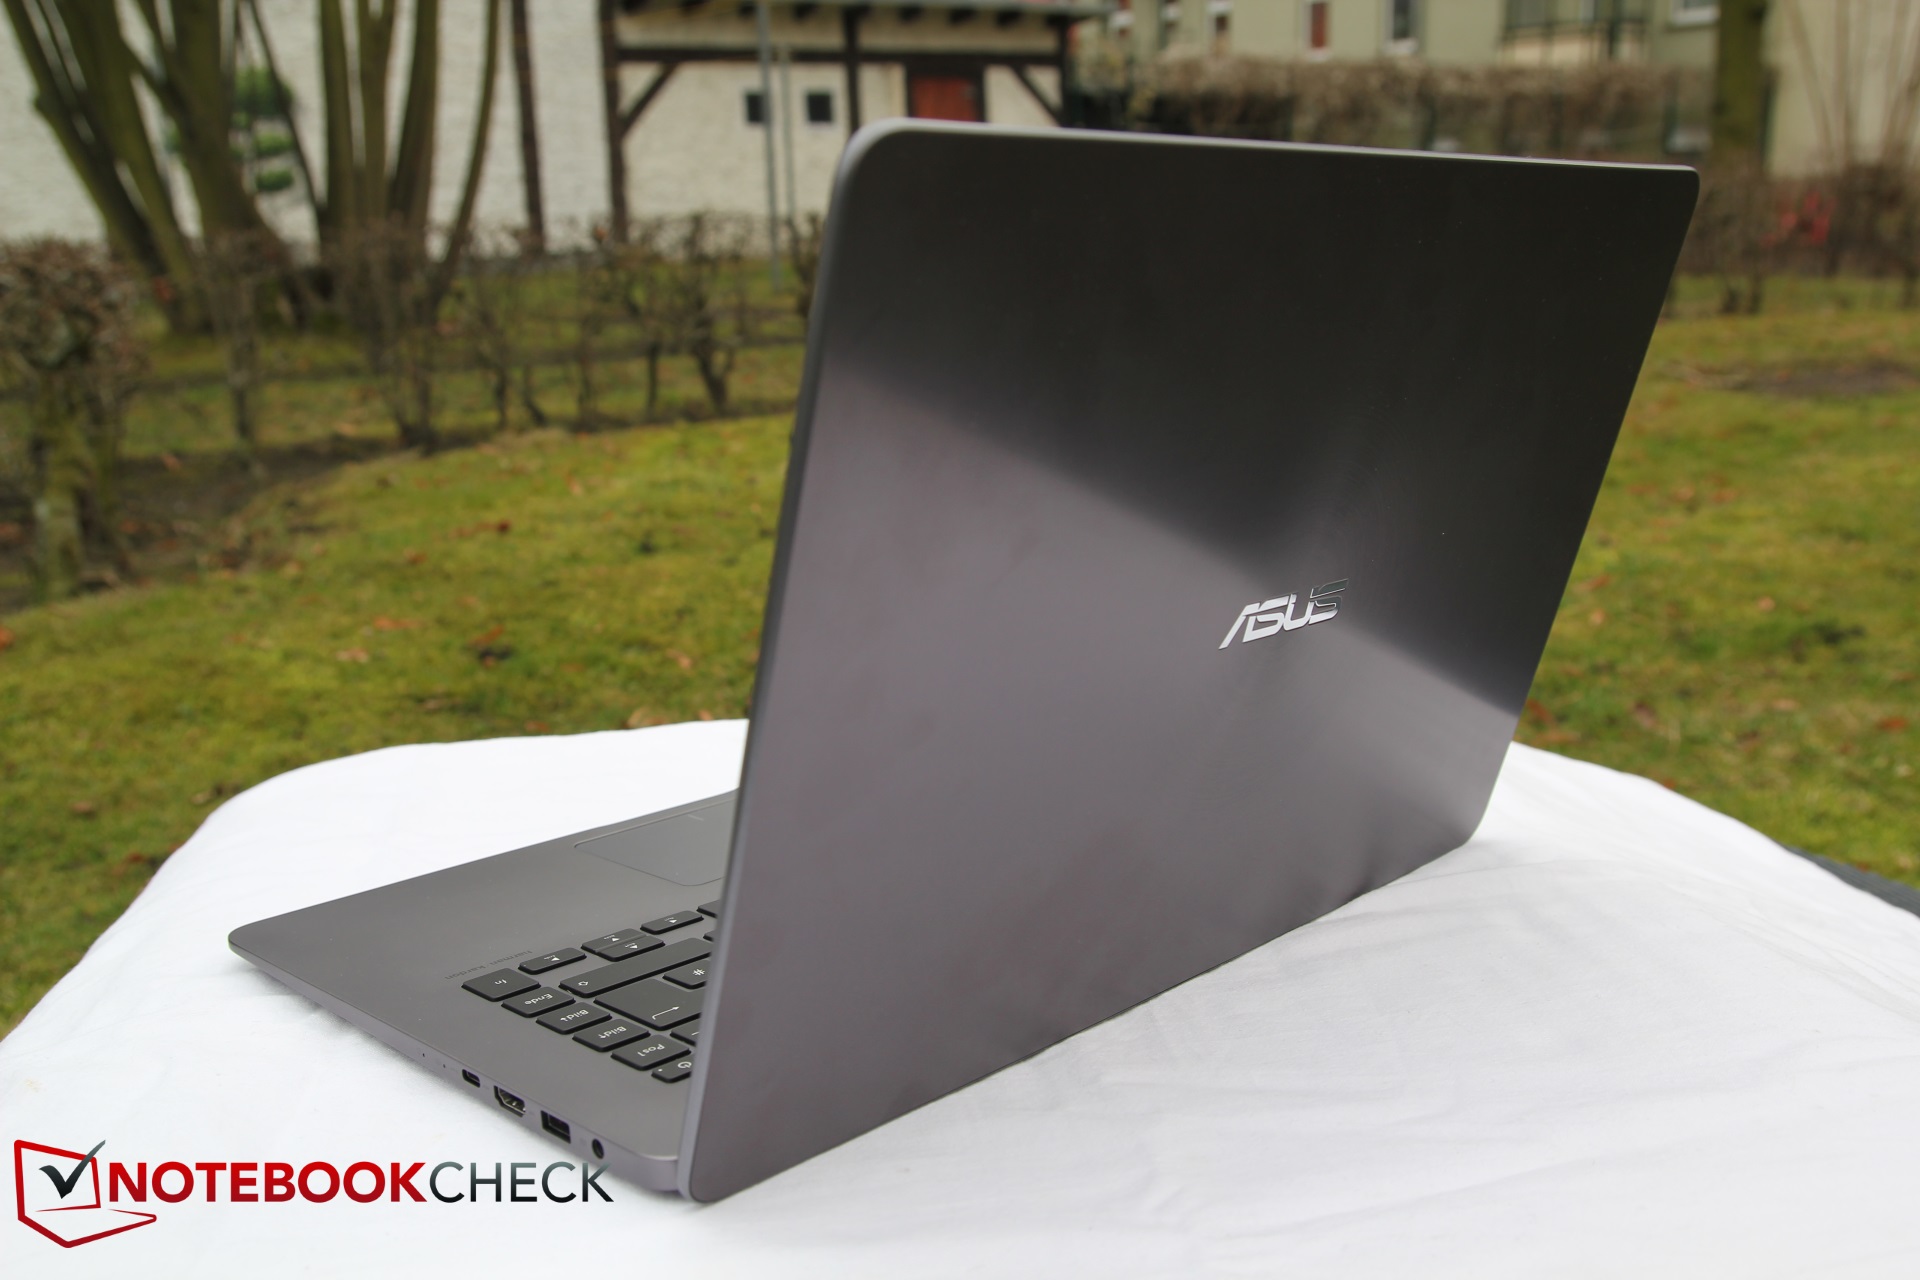
O preço do Asus ZenBook UX530 é definitivamente muito alto para o desempenho oferecido. Por isso, um paga menos por seu desempenho e mais por adquirir um dos dispositivos de 15 polegadas mais leve e pequeno existente. Se esse aspecto for de menor importância para um usuário, eles serão mais felizes com outras opções. No entanto, o novo ZenBook oferece uma grande mobilidade junto com um desempenho aceitável, apenas o tempo de duração da bateria poderia ser melhor.
Asus ZenBook UX530UX-FY070T
- 01/31/2018 v6 (old)
Christian Hintze