Breve Análise do Portátil Asus Zenbook UX3430UQ (7500U, 940MX, 512 GB)

| SD Card Reader | |
| average JPG Copy Test (av. of 3 runs) | |
| Lenovo IdeaPad 710S Plus-13IKB | |
| Dell XPS 15 2017 9560 (7300HQ, Full-HD) | |
| Asus Zenbook UX3430UQ-GV012T | |
| Asus Zenbook UX3410UQ-GV077T | |
| maximum AS SSD Seq Read Test (1GB) | |
| Dell XPS 15 2017 9560 (7300HQ, Full-HD) | |
| Lenovo IdeaPad 710S Plus-13IKB | |
| Asus Zenbook UX3430UQ-GV012T | |
| Asus Zenbook UX3410UQ-GV077T | |
| |||||||||||||||||||||||||
iluminação: 88 %
iluminação com acumulador: 377 cd/m²
Contraste: 1038:1 (Preto: 0.34 cd/m²)
ΔE ColorChecker Calman: 2.88 | ∀{0.5-29.43 Ø4.73}
ΔE Greyscale Calman: 4.24 | ∀{0.09-98 Ø4.97}
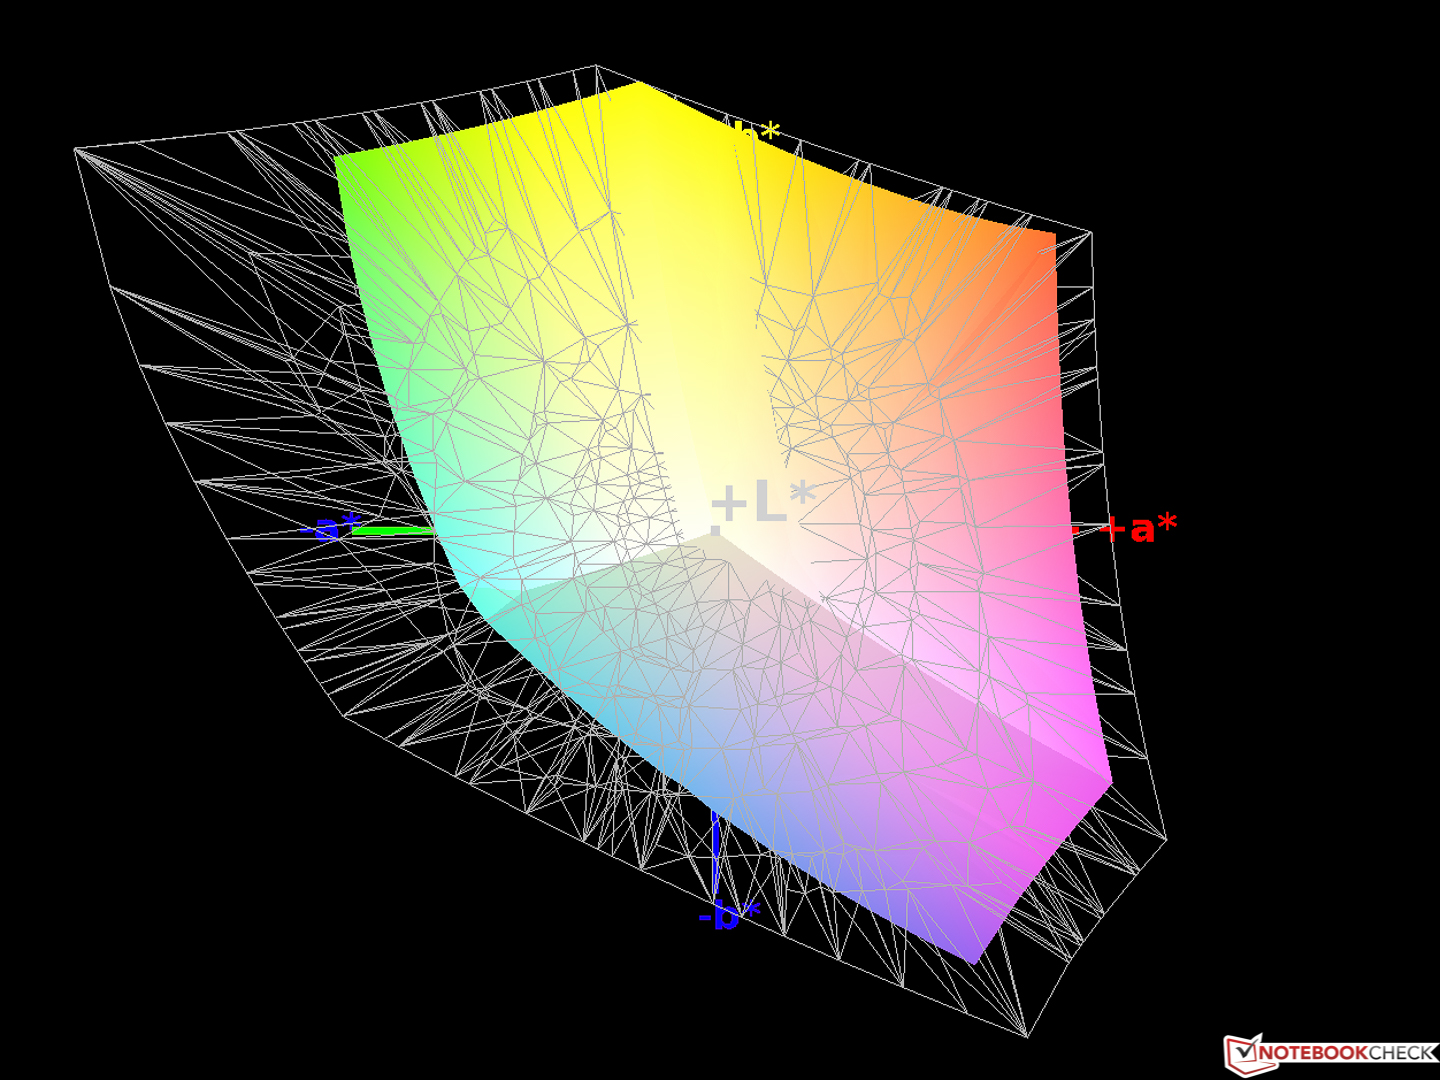
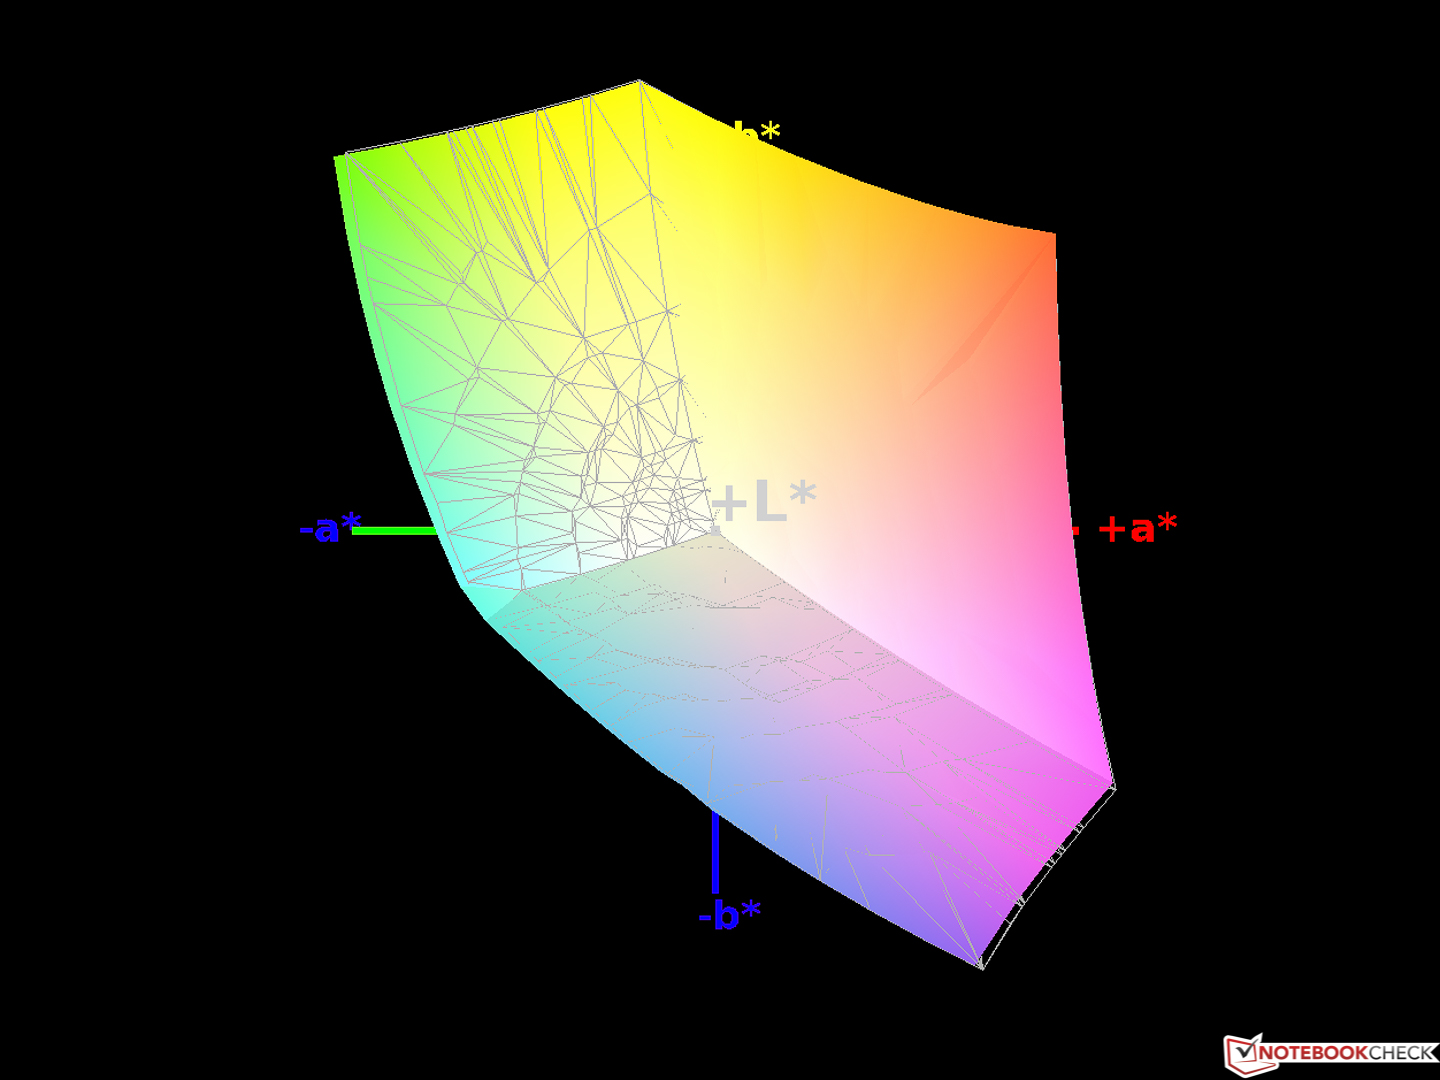
99% sRGB (Argyll 1.6.3 3D)
64% AdobeRGB 1998 (Argyll 1.6.3 3D)
69.3% AdobeRGB 1998 (Argyll 3D)
98.7% sRGB (Argyll 3D)
67.1% Display P3 (Argyll 3D)
Gamma: 2.38
CCT: 7380 K
| Asus Zenbook UX3430UQ-GV012T Chi Mei CMN14D2 / N140HCE-EN1, , 1920x1080, 14" | Lenovo IdeaPad 710S Plus-13IKB LG Philips LP133WF4-SPB1 (LGD04EF), , 1920x1080, 13.3" | Asus Zenbook UX3410UQ-GV077T Chi Mei N140HCE-EN1, , 1920x1080, 14" | Dell XPS 15 2017 9560 (7300HQ, Full-HD) Sharp SHP1453 LQ156M1, , 1920x1080, 15.6" | |
|---|---|---|---|---|
| Display | -11% | 0% | 2% | |
| Display P3 Coverage (%) | 67.1 | 65.3 -3% | 67.2 0% | 68.9 3% |
| sRGB Coverage (%) | 98.7 | 82.9 -16% | 99.2 1% | 98.9 0% |
| AdobeRGB 1998 Coverage (%) | 69.3 | 60.6 -13% | 69.3 0% | 70.9 2% |
| Response Times | -9% | -7% | -61% | |
| Response Time Grey 50% / Grey 80% * (ms) | 40 ? | 45 ? -13% | 44 ? -10% | 54 ? -35% |
| Response Time Black / White * (ms) | 28 ? | 29 ? -4% | 29 ? -4% | 52.4 ? -87% |
| PWM Frequency (Hz) | 60 ? | |||
| Screen | -12% | 2% | -11% | |
| Brightness middle (cd/m²) | 353 | 343 -3% | 381 8% | 400 13% |
| Brightness (cd/m²) | 366 | 306 -16% | 368 1% | 392 7% |
| Brightness Distribution (%) | 88 | 81 -8% | 84 -5% | 89 1% |
| Black Level * (cd/m²) | 0.34 | 0.3 12% | 0.3 12% | 0.26 24% |
| Contrast (:1) | 1038 | 1143 10% | 1270 22% | 1538 48% |
| Colorchecker dE 2000 * | 2.88 | 4.73 -64% | 2.84 1% | 4.9 -70% |
| Colorchecker dE 2000 max. * | 6.61 | 9.05 -37% | 6.5 2% | 11 -66% |
| Greyscale dE 2000 * | 4.24 | 3.29 22% | 4.02 5% | 7.2 -70% |
| Gamma | 2.38 92% | 2.36 93% | 2.42 91% | 2.11 104% |
| CCT | 7380 88% | 6437 101% | 7430 87% | 6911 94% |
| Color Space (Percent of AdobeRGB 1998) (%) | 64 | 54 -16% | 56 -12% | 64.2 0% |
| Color Space (Percent of sRGB) (%) | 99 | 83 -16% | 86 -13% | 98.9 0% |
| Média Total (Programa/Configurações) | -11% /
-11% | -2% /
1% | -23% /
-15% |
* ... menor é melhor
Exibir tempos de resposta
| ↔ Tempo de resposta preto para branco | ||
|---|---|---|
| 28 ms ... ascensão ↗ e queda ↘ combinadas | ↗ 17 ms ascensão | 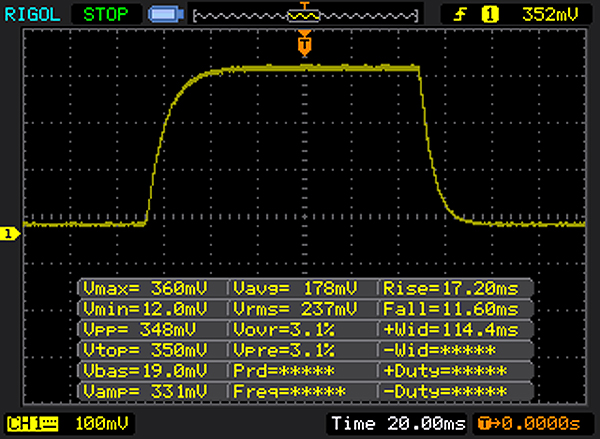 |
| ↘ 11 ms queda | ||
| A tela mostra taxas de resposta relativamente lentas em nossos testes e pode ser muito lenta para os jogadores. Em comparação, todos os dispositivos testados variam de 0.1 (mínimo) a 240 (máximo) ms. » 71 % de todos os dispositivos são melhores. Isso significa que o tempo de resposta medido é pior que a média de todos os dispositivos testados (19.9 ms). | ||
| ↔ Tempo de resposta 50% cinza a 80% cinza | ||
| 40 ms ... ascensão ↗ e queda ↘ combinadas | ↗ 20 ms ascensão | 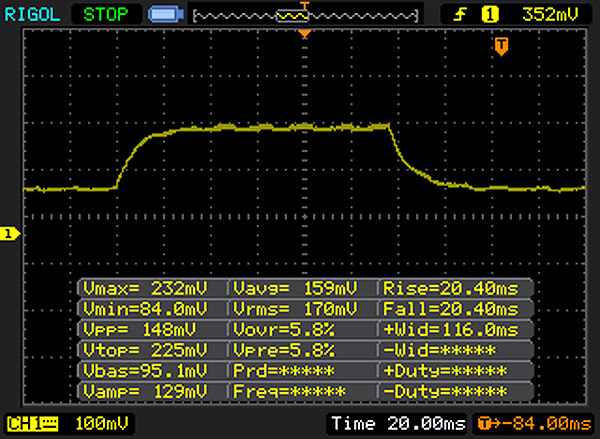 |
| ↘ 20 ms queda | ||
| A tela mostra taxas de resposta lentas em nossos testes e será insatisfatória para os jogadores. Em comparação, todos os dispositivos testados variam de 0.165 (mínimo) a 636 (máximo) ms. » 61 % de todos os dispositivos são melhores. Isso significa que o tempo de resposta medido é pior que a média de todos os dispositivos testados (31.1 ms). | ||
Cintilação da tela / PWM (modulação por largura de pulso)
| Tela tremeluzindo / PWM não detectado | ||
[pwm_comparison] Em comparação: 52 % de todos os dispositivos testados não usam PWM para escurecer a tela. Se PWM foi detectado, uma média de 7788 (mínimo: 5 - máximo: 343500) Hz foi medida. | ||
| PCMark 8 | |
| Home Score Accelerated v2 | |
| Asus Zenbook UX3410UQ-GV077T | |
| Asus Zenbook UX3430UQ-GV012T | |
| Dell XPS 15 2017 9560 (7300HQ, Full-HD) | |
| Lenovo IdeaPad 710S Plus-13IKB | |
| Work Score Accelerated v2 | |
| Dell XPS 15 2017 9560 (7300HQ, Full-HD) | |
| Asus Zenbook UX3430UQ-GV012T | |
| Lenovo IdeaPad 710S Plus-13IKB | |
| PCMark 8 Home Score Accelerated v2 | 3913 pontos | |
| PCMark 8 Work Score Accelerated v2 | 4812 pontos | |
Ajuda | ||
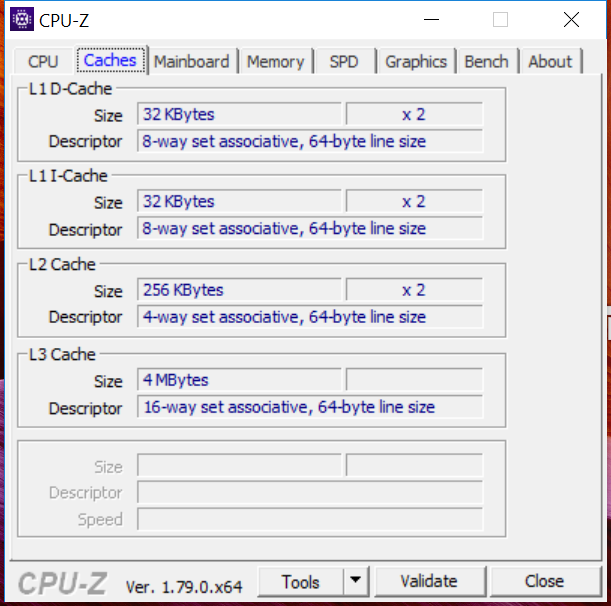
| Asus Zenbook UX3430UQ-GV012T SanDisk SD8SN8U512G1002 | Lenovo IdeaPad 710S Plus-13IKB Samsung PM961 NVMe MZVLW512HMJP | Asus Zenbook UX3410UQ-GV077T SanDisk SD8SNAT256G1002 | Dell XPS 15 2017 9560 (7300HQ, Full-HD) WDC WD10SPCX-75KHST0 + SanDisk Z400s M.2 2242 32 GB Cache | |
|---|---|---|---|---|
| CrystalDiskMark 3.0 | 143% | -14% | -82% | |
| Read Seq (MB/s) | 500 | 1577 215% | 497 -1% | 123 -75% |
| Write Seq (MB/s) | 457.4 | 1472 222% | 323.7 -29% | 74.2 -84% |
| Read 512 (MB/s) | 345.6 | 1165 237% | 289 -16% | 101.7 -71% |
| Write 512 (MB/s) | 415 | 1244 200% | 288 -31% | 42.51 -90% |
| Read 4k (MB/s) | 28.34 | 54.8 93% | 22.78 -20% | 10.84 -62% |
| Write 4k (MB/s) | 56.8 | 121.5 114% | 79.5 40% | 1.021 -98% |
| Read 4k QD32 (MB/s) | 311.3 | 407.5 31% | 147 -53% | 69.8 -78% |
| Write 4k QD32 (MB/s) | 251.1 | 321.4 28% | 257.2 2% | 1.057 -100% |

| 3DMark 11 - 1280x720 Performance GPU | |
| Dell XPS 15 2017 9560 (7300HQ, Full-HD) | |
| Lenovo IdeaPad 710S Plus-13IKB | |
| Asus Zenbook UX3430UQ-GV012T | |
| Asus Zenbook UX3410UQ-GV077T | |
| Asus Zenbook UX3410UA | |
| 3DMark - 1920x1080 Fire Strike Graphics | |
| Dell XPS 15 2017 9560 (7300HQ, Full-HD) | |
| Lenovo IdeaPad 710S Plus-13IKB | |
| Asus Zenbook UX3430UQ-GV012T | |
| Asus Zenbook UX3410UA | |
| 3DMark 11 Performance | 2335 pontos | |
| 3DMark Cloud Gate Standard Score | 6852 pontos | |
| 3DMark Fire Strike Score | 1373 pontos | |
Ajuda | ||
| baixo | média | alto | ultra | |
|---|---|---|---|---|
| Diablo III (2012) | 70.2 | 66.8 | 41.7 | |
| The Witcher 3 (2015) | 27.8 | 17.3 | ||
| Farming Simulator 17 (2016) | 79.7 | 34.1 | 23.3 |
Barulho
| Ocioso |
| 30.8 / 30.8 / 32.4 dB |
| Carga |
| 35.1 / 38.4 dB |
 | ||
30 dB silencioso 40 dB(A) audível 50 dB(A) ruidosamente alto |
||
min: | ||
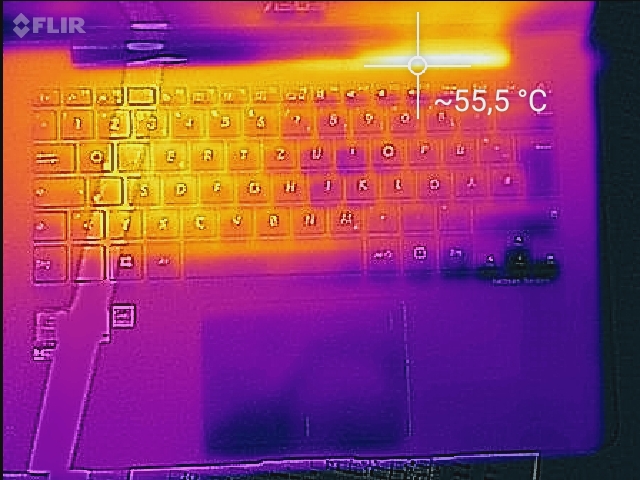
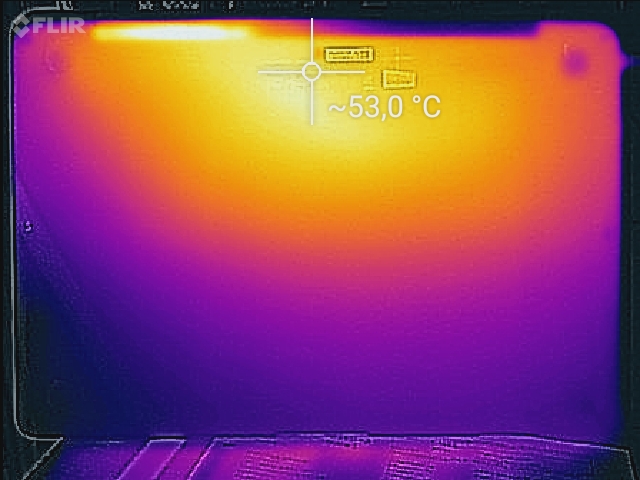
(±) A temperatura máxima no lado superior é 44 °C / 111 F, em comparação com a média de 35.9 °C / 97 F , variando de 21.4 a 59 °C para a classe Subnotebook.
(-) A parte inferior aquece até um máximo de 50.2 °C / 122 F, em comparação com a média de 39.2 °C / 103 F
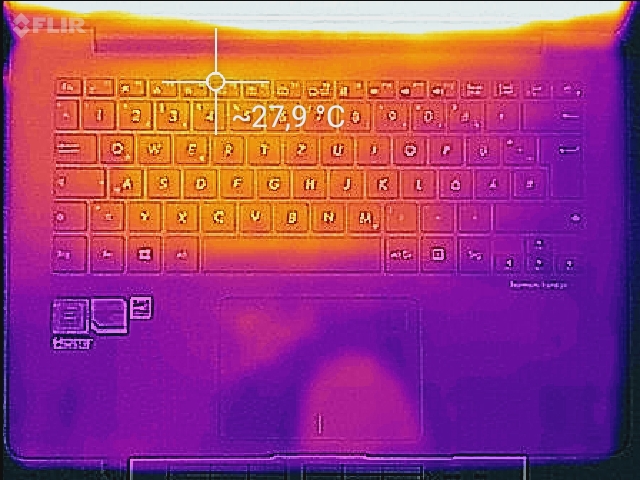
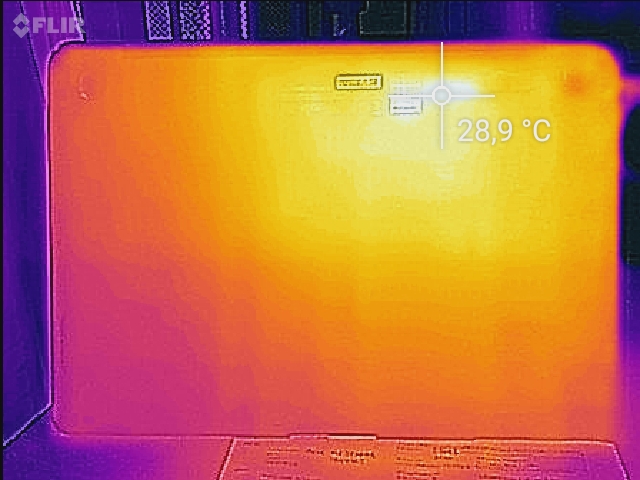
(+) Em uso inativo, a temperatura média para o lado superior é 25.5 °C / 78 F, em comparação com a média do dispositivo de 30.8 °C / ### class_avg_f### F.
(+) Os apoios para as mãos e o touchpad estão atingindo a temperatura máxima da pele (33.4 °C / 92.1 F) e, portanto, não estão quentes.
(-) A temperatura média da área do apoio para as mãos de dispositivos semelhantes foi 28.2 °C / 82.8 F (-5.2 °C / -9.3 F).
Asus Zenbook UX3430UQ-GV012T análise de áudio
(±) | o volume do alto-falante é médio, mas bom (###valor### dB)
Graves 100 - 315Hz
(-) | quase nenhum baixo - em média 18.9% menor que a mediana
(±) | a linearidade dos graves é média (12.2% delta para a frequência anterior)
Médios 400 - 2.000 Hz
(+) | médios equilibrados - apenas 3.4% longe da mediana
(+) | médios são lineares (6.9% delta para frequência anterior)
Altos 2 - 16 kHz
(+) | agudos equilibrados - apenas 2.7% longe da mediana
(+) | os máximos são lineares (5% delta da frequência anterior)
Geral 100 - 16.000 Hz
(±) | a linearidade do som geral é média (20.4% diferença em relação à mediana)
Comparado com a mesma classe
» 65% de todos os dispositivos testados nesta classe foram melhores, 8% semelhantes, 27% piores
» O melhor teve um delta de 5%, a média foi 18%, o pior foi 53%
Comparado com todos os dispositivos testados
» 53% de todos os dispositivos testados foram melhores, 8% semelhantes, 39% piores
» O melhor teve um delta de 4%, a média foi 24%, o pior foi 134%
Lenovo IdeaPad 710S Plus-13IKB análise de áudio
(±) | o volume do alto-falante é médio, mas bom (###valor### dB)
Graves 100 - 315Hz
(-) | quase nenhum baixo - em média 21.4% menor que a mediana
(±) | a linearidade dos graves é média (12.2% delta para a frequência anterior)
Médios 400 - 2.000 Hz
(±) | médios mais altos - em média 6.7% maior que a mediana
(±) | a linearidade dos médios é média (10.6% delta para frequência anterior)
Altos 2 - 16 kHz
(+) | agudos equilibrados - apenas 2.2% longe da mediana
(+) | os máximos são lineares (6.9% delta da frequência anterior)
Geral 100 - 16.000 Hz
(±) | a linearidade do som geral é média (24.4% diferença em relação à mediana)
Comparado com a mesma classe
» 82% de todos os dispositivos testados nesta classe foram melhores, 4% semelhantes, 13% piores
» O melhor teve um delta de 5%, a média foi 18%, o pior foi 53%
Comparado com todos os dispositivos testados
» 74% de todos os dispositivos testados foram melhores, 6% semelhantes, 20% piores
» O melhor teve um delta de 4%, a média foi 24%, o pior foi 134%
Asus Zenbook UX3410UQ-GV077T análise de áudio
(±) | o volume do alto-falante é médio, mas bom (###valor### dB)
Graves 100 - 315Hz
(±) | graves reduzidos - em média 12% menor que a mediana
(+) | o baixo é linear (4.5% delta para a frequência anterior)
Médios 400 - 2.000 Hz
(±) | médios mais altos - em média 6.5% maior que a mediana
(+) | médios são lineares (6.7% delta para frequência anterior)
Altos 2 - 16 kHz
(+) | agudos equilibrados - apenas 3.9% longe da mediana
(+) | os máximos são lineares (4.8% delta da frequência anterior)
Geral 100 - 16.000 Hz
(±) | a linearidade do som geral é média (17% diferença em relação à mediana)
Comparado com a mesma classe
» 43% de todos os dispositivos testados nesta classe foram melhores, 8% semelhantes, 49% piores
» O melhor teve um delta de 5%, a média foi 18%, o pior foi 53%
Comparado com todos os dispositivos testados
» 30% de todos os dispositivos testados foram melhores, 8% semelhantes, 62% piores
» O melhor teve um delta de 4%, a média foi 24%, o pior foi 134%
Dell XPS 15 2017 9560 (7300HQ, Full-HD) análise de áudio
(+) | os alto-falantes podem tocar relativamente alto (###valor### dB)
Graves 100 - 315Hz
(-) | quase nenhum baixo - em média 15.8% menor que a mediana
(±) | a linearidade dos graves é média (13.9% delta para a frequência anterior)
Médios 400 - 2.000 Hz
(+) | médios equilibrados - apenas 4.3% longe da mediana
(±) | a linearidade dos médios é média (7.1% delta para frequência anterior)
Altos 2 - 16 kHz
(+) | agudos equilibrados - apenas 3.1% longe da mediana
(±) | a linearidade dos máximos é média (7.9% delta para frequência anterior)
Geral 100 - 16.000 Hz
(+) | o som geral é linear (13.5% diferença em relação à mediana)
Comparado com a mesma classe
» 29% de todos os dispositivos testados nesta classe foram melhores, 4% semelhantes, 67% piores
» O melhor teve um delta de 5%, a média foi 17%, o pior foi 45%
Comparado com todos os dispositivos testados
» 14% de todos os dispositivos testados foram melhores, 4% semelhantes, 82% piores
» O melhor teve um delta de 4%, a média foi 24%, o pior foi 134%
| desligado | |
| Ocioso | |
| Carga |
|
Key:
min: | |
| Asus Zenbook UX3430UQ-GV012T i7-7500U, GeForce 940MX, SanDisk SD8SN8U512G1002, IPS, 1920x1080, 14" | Lenovo IdeaPad 710S Plus-13IKB i7-7500U, GeForce 940MX, Samsung PM961 NVMe MZVLW512HMJP, IPS, 1920x1080, 13.3" | Asus Zenbook UX3410UQ-GV077T i7-7500U, GeForce 940MX, SanDisk SD8SNAT256G1002, IPS, 1920x1080, 14" | Dell XPS 15 2017 9560 (7300HQ, Full-HD) i5-7300HQ, GeForce GTX 1050 Mobile, WDC WD10SPCX-75KHST0 + SanDisk Z400s M.2 2242 32 GB Cache, LED IGZO IPS InfinityEdge, 1920x1080, 15.6" | |
|---|---|---|---|---|
| Power Consumption | -19% | -15% | -109% | |
| Idle Minimum * (Watt) | 2.6 | 3.6 -38% | 3.5 -35% | 6.6 -154% |
| Idle Average * (Watt) | 5.9 | 7.4 -25% | 6.6 -12% | 9 -53% |
| Idle Maximum * (Watt) | 6.25 | 8.7 -39% | 7.1 -14% | 10.7 -71% |
| Load Average * (Watt) | 42 | 43 -2% | 30 29% | 77.5 -85% |
| Load Maximum * (Watt) | 46 | 42 9% | 65 -41% | 130 -183% |
* ... menor é melhor
| Asus Zenbook UX3430UQ-GV012T i7-7500U, GeForce 940MX, 50 Wh | Lenovo IdeaPad 710S Plus-13IKB i7-7500U, GeForce 940MX, 46 Wh | Asus Zenbook UX3410UQ-GV077T i7-7500U, GeForce 940MX, 48 Wh | Dell XPS 15 2017 9560 (7300HQ, Full-HD) i5-7300HQ, GeForce GTX 1050 Mobile, 56 Wh | |
|---|---|---|---|---|
| Duração da bateria | -35% | -3% | -35% | |
| Reader / Idle (h) | 21.5 | 7.8 -64% | 9.4 -56% | |
| WiFi v1.3 (h) | 8.8 | 5.6 -36% | 8.5 -3% | 5.6 -36% |
| Load (h) | 1.6 | 1.5 -6% | 1.4 -13% |
Pro
Contra
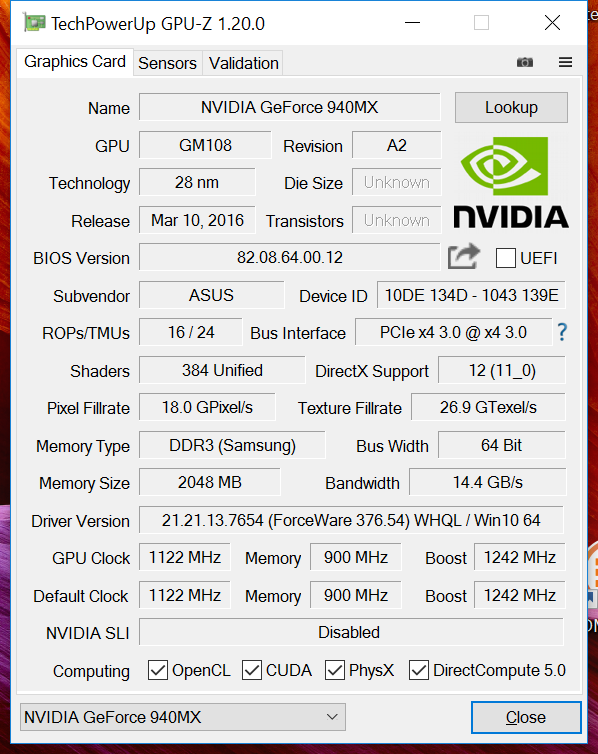
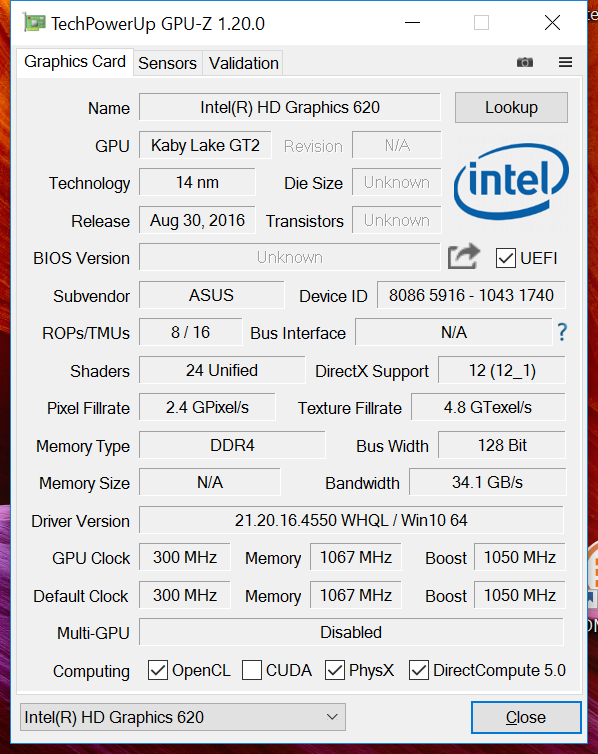
Por que, mas por que a Asus optou pela quase antiga e certamente ultrapassada GeForce 940MX? E por que ala não gerenciou uma implementação decente deste conhecido chip, para começar? Lembre-se que o 940MX do Zenbook é apenas cerca de 30% mais rápido que o Intel HD Graphics 620 integrado. A única pretensão restante de "multimídia" pode ser encontrada na excelente tela do portátil. Multimídia? Certamente não.
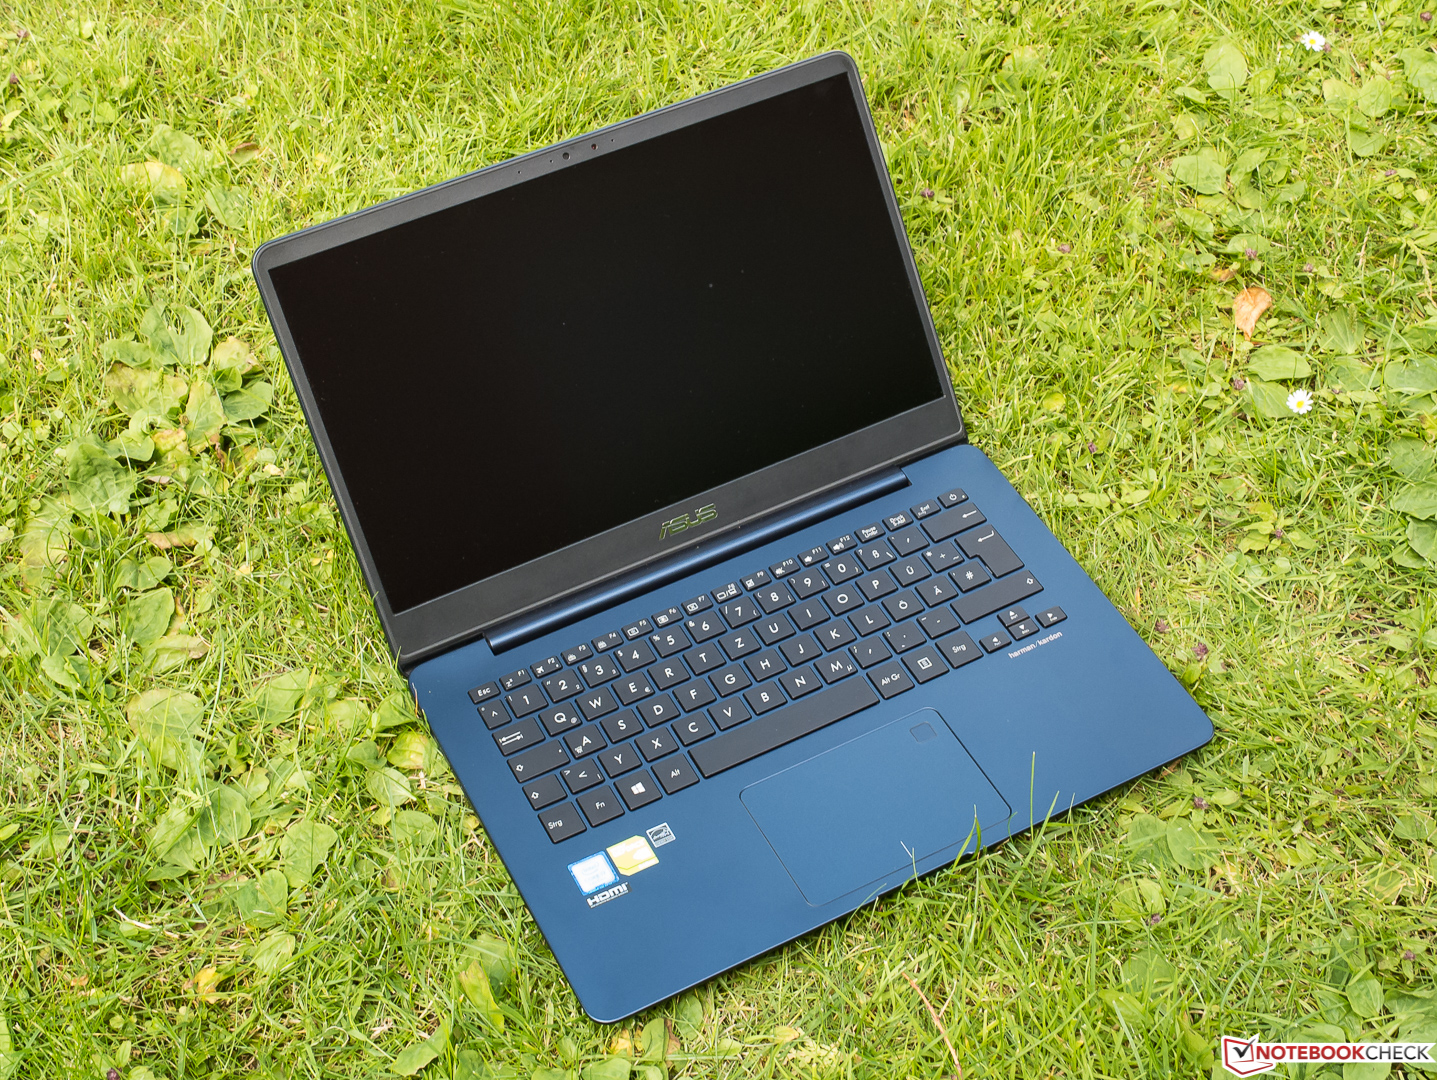
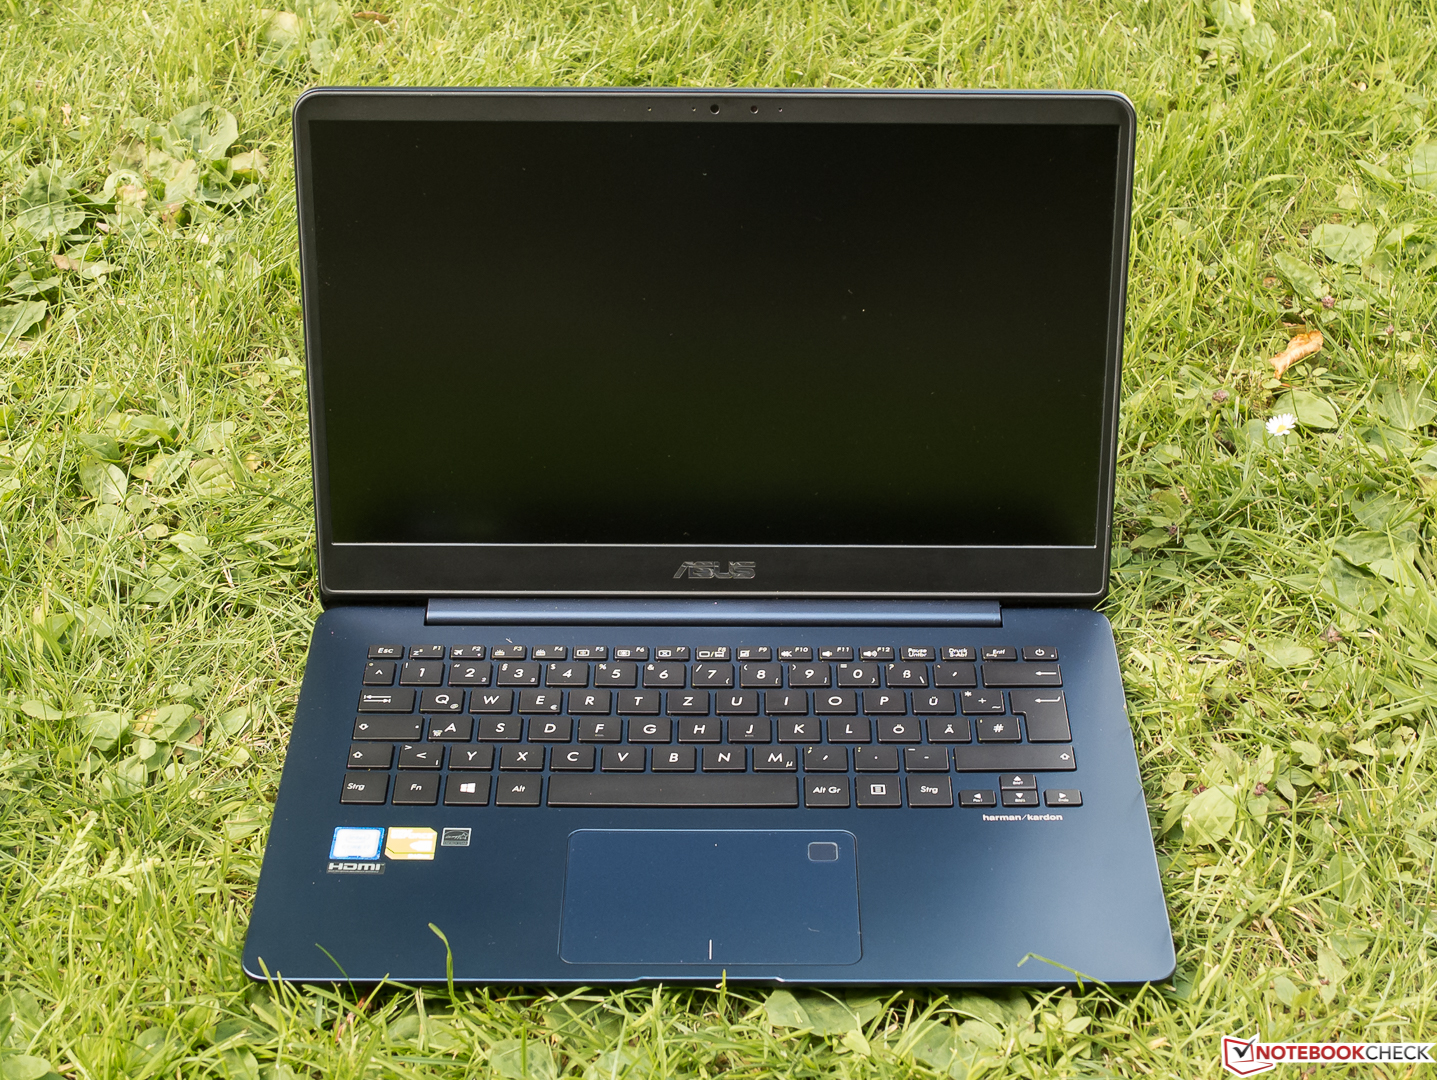
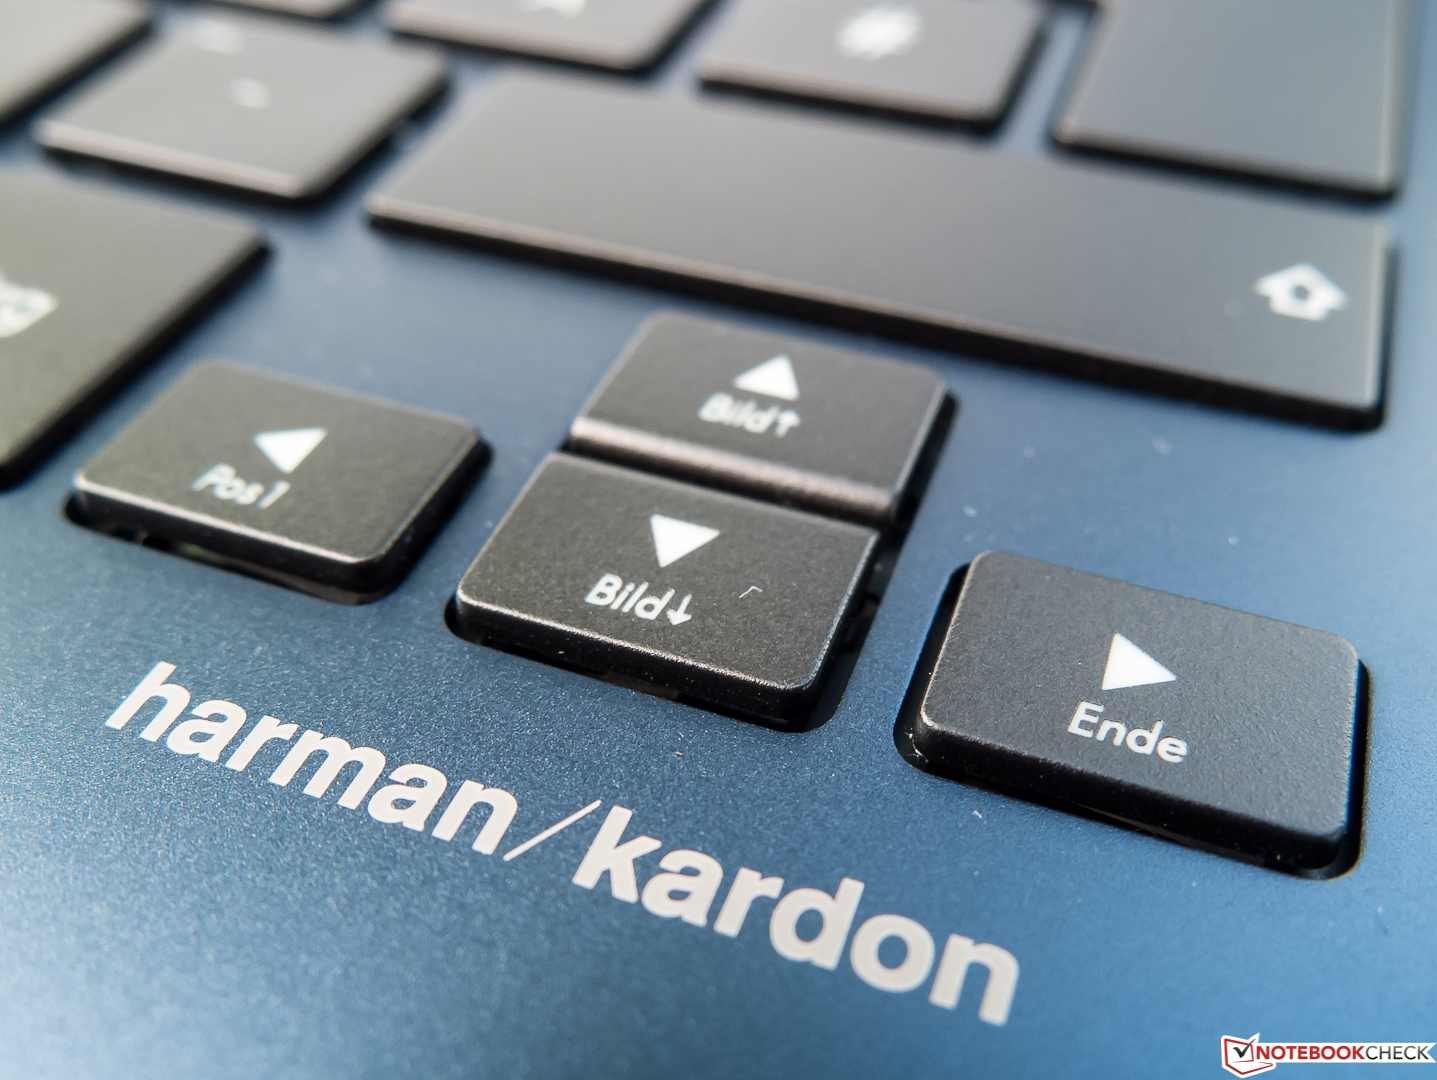
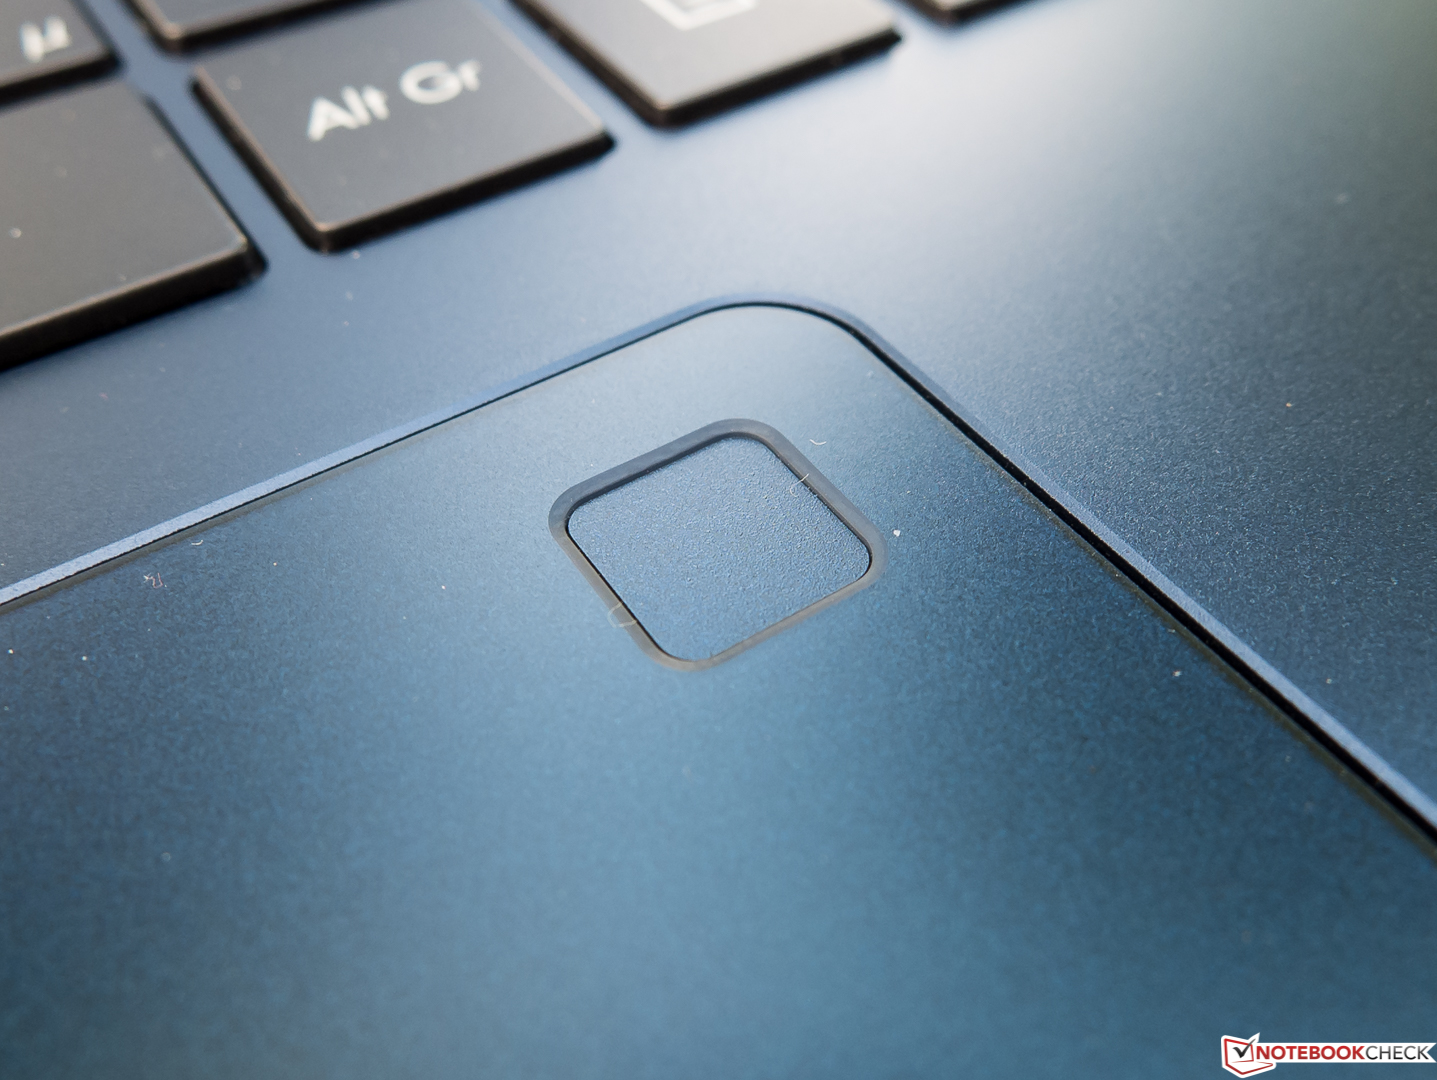
Negócios? Certamente sim. O Asus Zenbook UX3430UQ é muito mais um parceiro de negócios e de escritório, e não irá prejudicar as aspirações de edição de fotos não profissionais. Graças a seus finos marcos, a carcaça bem feita de 14 polegadas é bastante compacto. A muito longa duração da bateria e os recursos de segurança incluídos no portátil o tornam muito portátil. Se não fosse pelas teclas grandes bastante altas no teclado, o aparelho teria sido muito silencioso em geral. Em resumo, os dispositivos de entrada devem agradar os escritores mais prolíficos.
Os usuários de escritório e de negócios que procuram um portátil apresentável de alta qualidade são o público-alvo principal do aparelho. Os gamers, por outro lado, devem ficar longe.
Em seus níveis de preços atuais de $1.500 (GV010T) e $1.600 (GV012T), ambos os modelos UX3430UQ são muito caros. Esperar por um tempo poderia acabar recompensando potenciais compradores, com uma relação preço-desempenho mais adequada.
Asus Zenbook UX3430UQ-GV012T
- 07/05/2017 v6 (old)
Sven Kloevekorn
Price comparison
