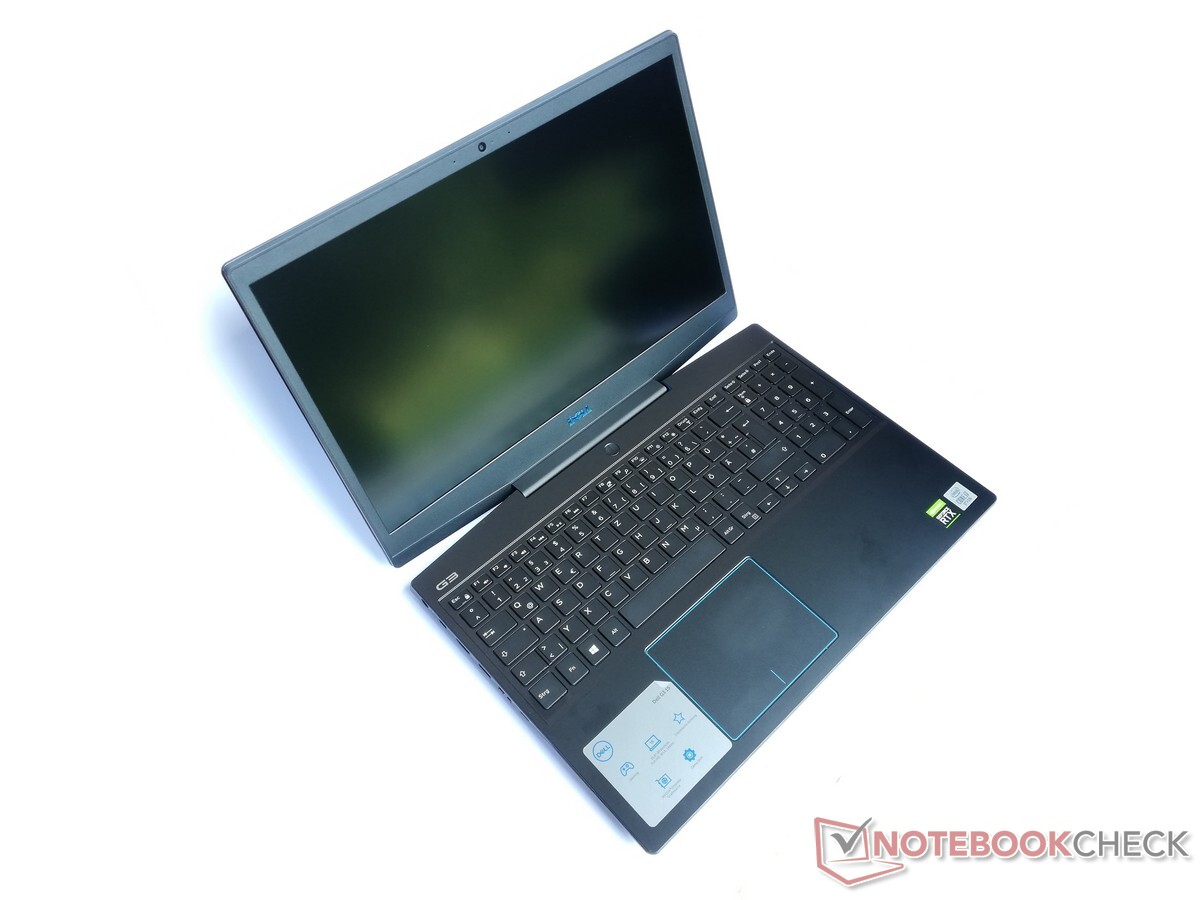
Breve Análise do Portátil Dell G3 15 3500: Portátil robusto para jogos com tela de 144 Hz
Avaliação | Data | Modelo | Peso | Altura | Size | Resolução | Preço |
|---|---|---|---|---|---|---|---|
| 81.6 % v7 (old) | 09/2020 | Dell G3 15 3500-G4DG2 i7-10750H, GeForce RTX 2060 Mobile | 2.3 kg | 22 mm | 15.60" | 1920x1080 | |
| 81.2 % v7 (old) | 08/2020 | Nexoc GH5 515IG i5-10300H, GeForce GTX 1650 Mobile | 2.1 kg | 24.9 mm | 15.60" | 1920x1080 | |
| 79.5 % v7 (old) | 07/2020 | MSI Bravo 15 A4DCR R7 4800H, Radeon RX 5300M | 2 kg | 22 mm | 15.60" | 1920x1080 | |
| 80.6 % v7 (old) | 06/2020 | Acer Nitro 5 AN517-52-77DS i7-10750H, GeForce RTX 2060 Mobile | 2.2 kg | 24.9 mm | 17.30" | 1920x1080 |
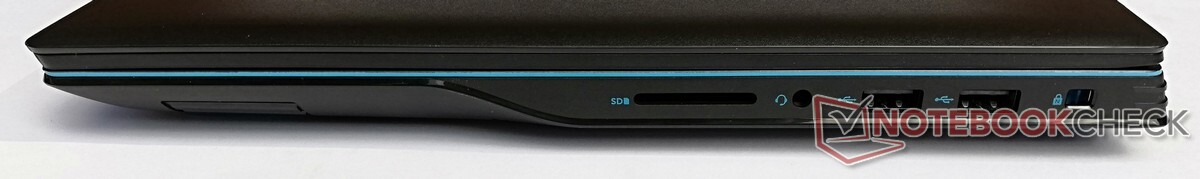
| SD Card Reader | |
| average JPG Copy Test (av. of 3 runs) | |
| Média da turma Gaming (20.9 - 210, n=54, últimos 2 anos) | |
| Nexoc GH5 515IG (Toshiba Exceria Pro SDXC 64 GB UHS-II) | |
| Dell G3 15 3500-G4DG2 (Toshiba Exceria Pro SDXC 64 GB UHS-II) | |
| maximum AS SSD Seq Read Test (1GB) | |
| Média da turma Gaming (25.5 - 261, n=51, últimos 2 anos) | |
| Nexoc GH5 515IG (Toshiba Exceria Pro SDXC 64 GB UHS-II) | |
| Dell G3 15 3500-G4DG2 (Toshiba Exceria Pro SDXC 64 GB UHS-II) | |


| |||||||||||||||||||||||||
iluminação: 81 %
iluminação com acumulador: 305 cd/m²
Contraste: 1309:1 (Preto: 0.23 cd/m²)
ΔE ColorChecker Calman: 4.68 | ∀{0.5-29.43 Ø4.73}
calibrated: 1.87
ΔE Greyscale Calman: 5.79 | ∀{0.09-98 Ø4.97}
94% sRGB (Argyll 1.6.3 3D)
61% AdobeRGB 1998 (Argyll 1.6.3 3D)
66.4% AdobeRGB 1998 (Argyll 3D)
93.9% sRGB (Argyll 3D)
64.6% Display P3 (Argyll 3D)
Gamma: 2.46
CCT: 7706 K
| Dell G3 15 3500-G4DG2 AU Optronics AUO80ED, IPS, 1920x1080, 15.6" | Nexoc GH5 515IG LG Philips LP156WFC-SPD1, IPS, 1920x1080, 15.6" | MSI Bravo 15 A4DCR AU Optronics B156HAN08.0 (AUO80ED), IPS-Level, 1920x1080, 15.6" | Acer Nitro 5 AN517-52-77DS AU Optronics B173HAN04.7, IPS, 1920x1080, 17.3" | |
|---|---|---|---|---|
| Display | -40% | -6% | -38% | |
| Display P3 Coverage (%) | 64.6 | 37.91 -41% | 62 -4% | 39.47 -39% |
| sRGB Coverage (%) | 93.9 | 57 -39% | 86.8 -8% | 58.9 -37% |
| AdobeRGB 1998 Coverage (%) | 66.4 | 39.19 -41% | 62.7 -6% | 40.77 -39% |
| Response Times | -182% | -22% | -188% | |
| Response Time Grey 50% / Grey 80% * (ms) | 14 ? | 34.8 ? -149% | 16 ? -14% | 35 ? -150% |
| Response Time Black / White * (ms) | 8 ? | 25.2 ? -215% | 10.4 ? -30% | 26 ? -225% |
| PWM Frequency (Hz) | ||||
| Screen | -15% | -12% | -38% | |
| Brightness middle (cd/m²) | 301 | 261 -13% | 311 3% | 263 -13% |
| Brightness (cd/m²) | 298 | 254 -15% | 313 5% | 246 -17% |
| Brightness Distribution (%) | 81 | 93 15% | 88 9% | 85 5% |
| Black Level * (cd/m²) | 0.23 | 0.23 -0% | 0.43 -87% | 0.47 -104% |
| Contrast (:1) | 1309 | 1135 -13% | 723 -45% | 560 -57% |
| Colorchecker dE 2000 * | 4.68 | 4.71 -1% | 4.5 4% | 5.07 -8% |
| Colorchecker dE 2000 calibrated * | 1.87 | 3.67 -96% | 2.65 -42% | 4.9 -162% |
| Greyscale dE 2000 * | 5.79 | 2.76 52% | 3.3 43% | 2.55 56% |
| Gamma | 2.46 89% | 2.42 91% | 2.129 103% | 2.37 93% |
| CCT | 7706 84% | 7090 92% | 7227 90% | 6446 101% |
| Color Space (Percent of AdobeRGB 1998) (%) | 61 | 36 -41% | 63 3% | 37 -39% |
| Color Space (Percent of sRGB) (%) | 94 | 56 -40% | 86 -9% | 59 -37% |
| Colorchecker dE 2000 max. * | 7.6 | 7.97 | 20.5 | |
| Média Total (Programa/Configurações) | -79% /
-42% | -13% /
-12% | -88% /
-58% |
* ... menor é melhor
Exibir tempos de resposta
| ↔ Tempo de resposta preto para branco | ||
|---|---|---|
| 8 ms ... ascensão ↗ e queda ↘ combinadas | ↗ 4 ms ascensão | 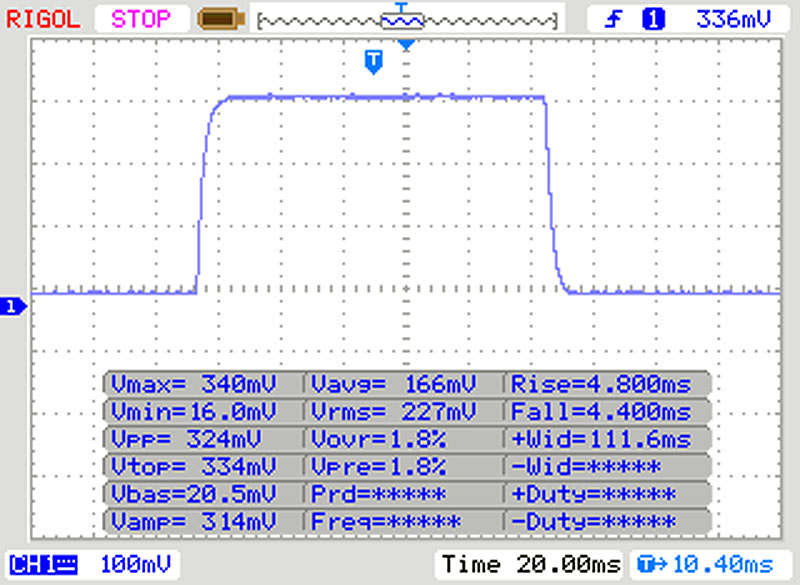 |
| ↘ 4 ms queda | ||
| A tela mostra taxas de resposta rápidas em nossos testes e deve ser adequada para jogos. Em comparação, todos os dispositivos testados variam de 0.1 (mínimo) a 240 (máximo) ms. » 22 % de todos os dispositivos são melhores. Isso significa que o tempo de resposta medido é melhor que a média de todos os dispositivos testados (19.9 ms). | ||
| ↔ Tempo de resposta 50% cinza a 80% cinza | ||
| 14 ms ... ascensão ↗ e queda ↘ combinadas | ↗ 7 ms ascensão | 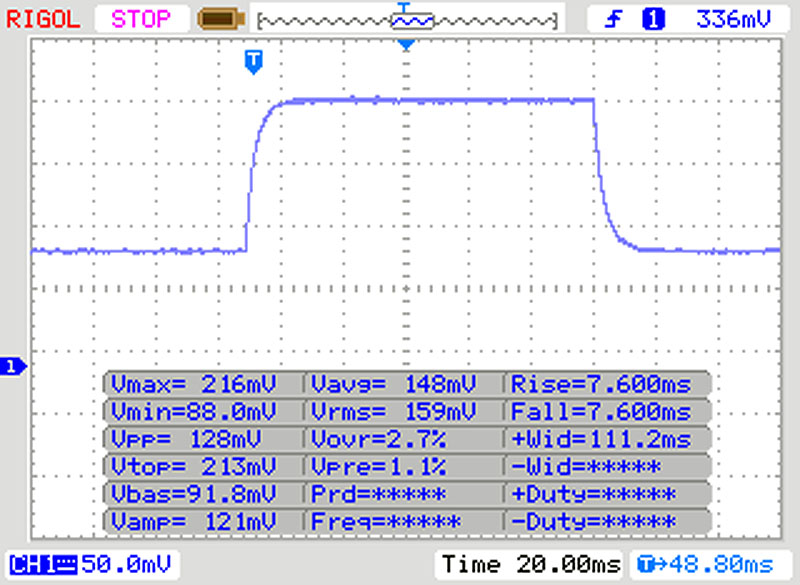 |
| ↘ 7 ms queda | ||
| A tela mostra boas taxas de resposta em nossos testes, mas pode ser muito lenta para jogadores competitivos. Em comparação, todos os dispositivos testados variam de 0.165 (mínimo) a 636 (máximo) ms. » 28 % de todos os dispositivos são melhores. Isso significa que o tempo de resposta medido é melhor que a média de todos os dispositivos testados (31.1 ms). | ||
Cintilação da tela / PWM (modulação por largura de pulso)
| Tela tremeluzindo / PWM não detectado | 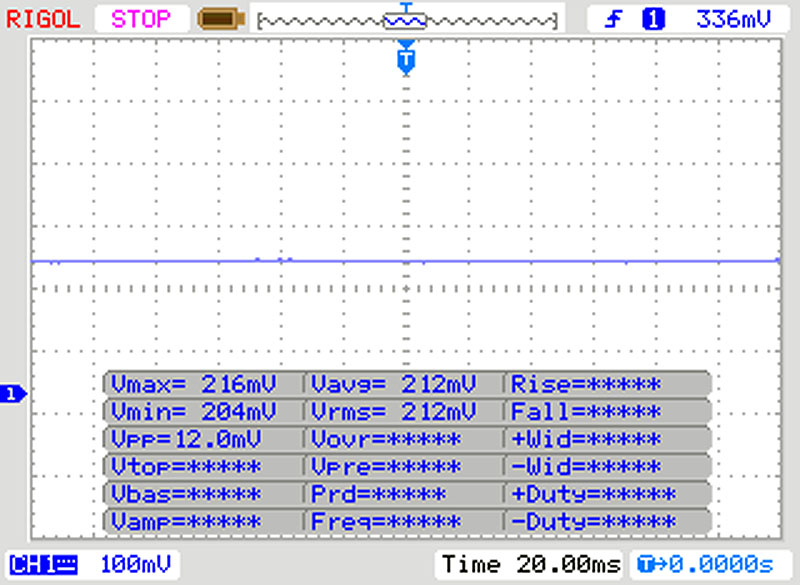 | ||
[pwm_comparison] Em comparação: 52 % de todos os dispositivos testados não usam PWM para escurecer a tela. Se PWM foi detectado, uma média de 7798 (mínimo: 5 - máximo: 343500) Hz foi medida. | |||


Cinebench R15: CPU Single 64Bit | CPU Multi 64Bit
Blender: v2.79 BMW27 CPU
7-Zip 18.03: 7z b 4 -mmt1 | 7z b 4
Geekbench 5.5: Single-Core | Multi-Core
HWBOT x265 Benchmark v2.2: 4k Preset
LibreOffice : 20 Documents To PDF
R Benchmark 2.5: Overall mean
| Cinebench R20 / CPU (Single Core) | |
| Média da turma Gaming (442 - 895, n=111, últimos 2 anos) | |
| Acer Nitro 5 AN517-52-77DS | |
| MSI Bravo 15 A4DCR | |
| Média Intel Core i7-10750H (431 - 504, n=43) | |
| Dell G3 15 3500-G4DG2 | |
| Nexoc GH5 515IG | |
| Cinebench R20 / CPU (Multi Core) | |
| Média da turma Gaming (4029 - 16108, n=111, últimos 2 anos) | |
| MSI Bravo 15 A4DCR | |
| Acer Nitro 5 AN517-52-77DS | |
| Média Intel Core i7-10750H (1749 - 3325, n=43) | |
| Dell G3 15 3500-G4DG2 | |
| Nexoc GH5 515IG | |
| Cinebench R15 / CPU Single 64Bit | |
| Média da turma Gaming (188.8 - 343, n=111, últimos 2 anos) | |
| Média Intel Core i7-10750H (184 - 213, n=45) | |
| Acer Nitro 5 AN517-52-77DS | |
| Dell G3 15 3500-G4DG2 | |
| MSI Bravo 15 A4DCR | |
| Nexoc GH5 515IG | |
| Cinebench R15 / CPU Multi 64Bit | |
| Média da turma Gaming (1578 - 6271, n=111, últimos 2 anos) | |
| MSI Bravo 15 A4DCR | |
| Acer Nitro 5 AN517-52-77DS | |
| Média Intel Core i7-10750H (804 - 1418, n=50) | |
| Dell G3 15 3500-G4DG2 | |
| Nexoc GH5 515IG | |
| Blender / v2.79 BMW27 CPU | |
| Nexoc GH5 515IG | |
| Dell G3 15 3500-G4DG2 | |
| Média Intel Core i7-10750H (322 - 587, n=43) | |
| Acer Nitro 5 AN517-52-77DS | |
| MSI Bravo 15 A4DCR | |
| Média da turma Gaming (80 - 330, n=109, últimos 2 anos) | |
| 7-Zip 18.03 / 7z b 4 -mmt1 | |
| Média da turma Gaming (4199 - 7436, n=110, últimos 2 anos) | |
| Média Intel Core i7-10750H (4504 - 5470, n=43) | |
| Acer Nitro 5 AN517-52-77DS | |
| Nexoc GH5 515IG | |
| Dell G3 15 3500-G4DG2 | |
| MSI Bravo 15 A4DCR | |
| 7-Zip 18.03 / 7z b 4 | |
| Média da turma Gaming (33491 - 148086, n=110, últimos 2 anos) | |
| MSI Bravo 15 A4DCR | |
| Média Intel Core i7-10750H (26040 - 37345, n=43) | |
| Acer Nitro 5 AN517-52-77DS | |
| Dell G3 15 3500-G4DG2 | |
| Nexoc GH5 515IG | |
| Geekbench 5.5 / Single-Core | |
| Média da turma Gaming (986 - 2474, n=110, últimos 2 anos) | |
| Média Intel Core i7-10750H (1114 - 1333, n=43) | |
| Acer Nitro 5 AN517-52-77DS | |
| Dell G3 15 3500-G4DG2 | |
| Nexoc GH5 515IG | |
| MSI Bravo 15 A4DCR | |
| Geekbench 5.5 / Multi-Core | |
| Média da turma Gaming (6460 - 27010, n=110, últimos 2 anos) | |
| MSI Bravo 15 A4DCR | |
| Acer Nitro 5 AN517-52-77DS | |
| Dell G3 15 3500-G4DG2 | |
| Média Intel Core i7-10750H (4443 - 6674, n=43) | |
| Nexoc GH5 515IG | |
| HWBOT x265 Benchmark v2.2 / 4k Preset | |
| Média da turma Gaming (11.5 - 44.3, n=110, últimos 2 anos) | |
| MSI Bravo 15 A4DCR | |
| Média Intel Core i7-10750H (5.54 - 11.6, n=43) | |
| Acer Nitro 5 AN517-52-77DS | |
| Dell G3 15 3500-G4DG2 | |
| Nexoc GH5 515IG | |
| LibreOffice / 20 Documents To PDF | |
| MSI Bravo 15 A4DCR | |
| Nexoc GH5 515IG | |
| Dell G3 15 3500-G4DG2 | |
| Média Intel Core i7-10750H (43.1 - 99.2, n=43) | |
| Acer Nitro 5 AN517-52-77DS | |
| Média da turma Gaming (19 - 88.8, n=110, últimos 2 anos) | |
| R Benchmark 2.5 / Overall mean | |
| Dell G3 15 3500-G4DG2 | |
| Acer Nitro 5 AN517-52-77DS | |
| Nexoc GH5 515IG | |
| Média Intel Core i7-10750H (0.578 - 0.708, n=42) | |
| MSI Bravo 15 A4DCR | |
| Média da turma Gaming (0.3439 - 0.759, n=111, últimos 2 anos) | |
* ... menor é melhor
| DPC Latencies / LatencyMon - interrupt to process latency (max), Web, Youtube, Prime95 | |
| Dell G3 15 3500-G4DG2 | |
| MSI Bravo 15 A4DCR | |
| Acer Nitro 5 AN517-52-77DS | |
| Nexoc GH5 515IG | |
* ... menor é melhor
| Dell G3 15 3500-G4DG2 SK Hynix BC511 HFM512GDJTNI | Nexoc GH5 515IG Samsung SSD 860 Evo 512GB | MSI Bravo 15 A4DCR Samsung PM981a MZVLB1T0HBLR | Acer Nitro 5 AN517-52-77DS WDC PC SN530 SDBPNPZ-1T00 | Média SK Hynix BC511 HFM512GDJTNI | |
|---|---|---|---|---|---|
| CrystalDiskMark 5.2 / 6 | -33% | 74% | 35% | 6% | |
| Write 4K (MB/s) | 99.6 | 89.6 -10% | 118.3 19% | 140 41% | 111 ? 11% |
| Read 4K (MB/s) | 38.8 | 40.88 5% | 43.73 13% | 49.04 26% | 42.6 ? 10% |
| Write Seq (MB/s) | 1117 | 518 -54% | 2854 156% | 1963 76% | 1037 ? -7% |
| Read Seq (MB/s) | 1030 | 539 -48% | 2302 123% | 1455 41% | 1100 ? 7% |
| Write 4K Q32T1 (MB/s) | 445.2 | 304 -32% | 418.5 -6% | 398.2 -11% | 410 ? -8% |
| Read 4K Q32T1 (MB/s) | 331.8 | 329 -1% | 517 56% | 461.9 39% | 444 ? 34% |
| Write Seq Q32T1 (MB/s) | 1102 | 529 -52% | 3008 173% | 1969 79% | 1072 ? -3% |
| Read Seq Q32T1 (MB/s) | 2227 | 561 -75% | 3568 60% | 1927 -13% | 2269 ? 2% |
| AS SSD | -30% | 114% | 45% | 13% | |
| Seq Read (MB/s) | 1305 | 524 -60% | 2730 109% | 1804 38% | 1458 ? 12% |
| Seq Write (MB/s) | 767 | 495 -35% | 2513 228% | 1922 151% | 900 ? 17% |
| 4K Read (MB/s) | 41.84 | 38.93 -7% | 61.4 47% | 38.21 -9% | 49 ? 17% |
| 4K Write (MB/s) | 90.1 | 87.3 -3% | 156.1 73% | 105 17% | 114.9 ? 28% |
| 4K-64 Read (MB/s) | 773 | 380 -51% | 1780 130% | 976 26% | 776 ? 0% |
| 4K-64 Write (MB/s) | 711 | 335.7 -53% | 1920 170% | 1150 62% | 744 ? 5% |
| Access Time Read * (ms) | 0.09 | 0.073 19% | 0.063 30% | 0.061 ? 32% | |
| Access Time Write * (ms) | 0.04 | 0.039 2% | 0.025 37% | 0.045 -13% | 0.03329 ? 17% |
| Score Read (Points) | 945 | 471 -50% | 2114 124% | 1194 26% | 970 ? 3% |
| Score Write (Points) | 878 | 472 -46% | 2327 165% | 1747 99% | 949 ? 8% |
| Score Total (Points) | 2290 | 1198 -48% | 5518 141% | 3563 56% | 2401 ? 5% |
| Média Total (Programa/Configurações) | -32% /
-32% | 94% /
97% | 40% /
41% | 10% /
10% |
* ... menor é melhor

Continuous read: DiskSpd Read Loop, Queue Depth 8
| 3DMark 11 Performance | 16634 pontos | |
| 3DMark Cloud Gate Standard Score | 31580 pontos | |
| 3DMark Fire Strike Score | 13566 pontos | |
Ajuda | ||
| The Witcher 3 - 1920x1080 Ultra Graphics & Postprocessing (HBAO+) | |
| Média da turma Gaming (95 - 240, n=8, últimos 2 anos) | |
| Acer Nitro 5 AN517-52-77DS | |
| Média NVIDIA GeForce RTX 2060 Mobile (50.6 - 74, n=40) | |
| Dell G3 15 3500-G4DG2 | |
| Nexoc GH5 515IG | |
| MSI Bravo 15 A4DCR | |
| Far Cry 5 - 1920x1080 Ultra Preset AA:T | |
| Média da turma Gaming (70 - 151, n=10, últimos 2 anos) | |
| Média NVIDIA GeForce RTX 2060 Mobile (76 - 90, n=9) | |
| Dell G3 15 3500-G4DG2 | |
| Dota 2 Reborn - 1920x1080 high (2/3) | |
| Média da turma Gaming (82.8 - 275, n=111, últimos 2 anos) | |
| Acer Nitro 5 AN517-52-77DS | |
| Dell G3 15 3500-G4DG2 | |
| Média NVIDIA GeForce RTX 2060 Mobile (85.4 - 128, n=18) | |
| MSI Bravo 15 A4DCR | |
| Doom Eternal - 1920x1080 Ultra Preset | |
| Média NVIDIA GeForce RTX 2060 Mobile (98.7 - 138, n=10) | |
| Acer Nitro 5 AN517-52-77DS | |
| Dell G3 15 3500-G4DG2 | |
| MSI Bravo 15 A4DCR | |
| baixo | média | alto | ultra | |
|---|---|---|---|---|
| The Witcher 3 (2015) | 50.6 | |||
| Dota 2 Reborn (2015) | 139 | 125 | 117 | 111 |
| X-Plane 11.11 (2018) | 104 | 85.2 | 72.4 | |
| Far Cry 5 (2018) | 80 | |||
| Doom Eternal (2020) | 98.7 |
Barulho
| Ocioso |
| 27.1 / 27.1 / 30.8 dB |
| Carga |
| 45.3 / 48.7 dB |
 | ||
30 dB silencioso 40 dB(A) audível 50 dB(A) ruidosamente alto |
||
min: | ||
(-) A temperatura máxima no lado superior é 50.3 °C / 123 F, em comparação com a média de 40.4 °C / 105 F , variando de 21.2 a 68.8 °C para a classe Gaming.
(-) A parte inferior aquece até um máximo de 58.6 °C / 137 F, em comparação com a média de 43.2 °C / 110 F
(+) Em uso inativo, a temperatura média para o lado superior é 31 °C / 88 F, em comparação com a média do dispositivo de 33.9 °C / ### class_avg_f### F.
(-) Jogando The Witcher 3, a temperatura média para o lado superior é 44.1 °C / 111 F, em comparação com a média do dispositivo de 33.9 °C / ## #class_avg_f### F.
(+) Os apoios para as mãos e o touchpad estão atingindo a temperatura máxima da pele (35.8 °C / 96.4 F) e, portanto, não estão quentes.
(-) A temperatura média da área do apoio para as mãos de dispositivos semelhantes foi 28.8 °C / 83.8 F (-7 °C / -12.6 F).
Dell G3 15 3500-G4DG2 análise de áudio
(±) | o volume do alto-falante é médio, mas bom (###valor### dB)
Graves 100 - 315Hz
(-) | quase nenhum baixo - em média 30.4% menor que a mediana
(±) | a linearidade dos graves é média (11.6% delta para a frequência anterior)
Médios 400 - 2.000 Hz
(+) | médios equilibrados - apenas 3.8% longe da mediana
(+) | médios são lineares (6.6% delta para frequência anterior)
Altos 2 - 16 kHz
(+) | agudos equilibrados - apenas 1.8% longe da mediana
(+) | os máximos são lineares (6.2% delta da frequência anterior)
Geral 100 - 16.000 Hz
(±) | a linearidade do som geral é média (21.9% diferença em relação à mediana)
Comparado com a mesma classe
» 79% de todos os dispositivos testados nesta classe foram melhores, 6% semelhantes, 16% piores
» O melhor teve um delta de 6%, a média foi 18%, o pior foi 132%
Comparado com todos os dispositivos testados
» 63% de todos os dispositivos testados foram melhores, 7% semelhantes, 31% piores
» O melhor teve um delta de 4%, a média foi 24%, o pior foi 134%
MSI Bravo 15 A4DCR análise de áudio
(+) | os alto-falantes podem tocar relativamente alto (###valor### dB)
Graves 100 - 315Hz
(-) | quase nenhum baixo - em média 19.8% menor que a mediana
(±) | a linearidade dos graves é média (12.7% delta para a frequência anterior)
Médios 400 - 2.000 Hz
(+) | médios equilibrados - apenas 2.7% longe da mediana
(+) | médios são lineares (4.7% delta para frequência anterior)
Altos 2 - 16 kHz
(+) | agudos equilibrados - apenas 2.6% longe da mediana
(+) | os máximos são lineares (5.9% delta da frequência anterior)
Geral 100 - 16.000 Hz
(+) | o som geral é linear (14.6% diferença em relação à mediana)
Comparado com a mesma classe
» 28% de todos os dispositivos testados nesta classe foram melhores, 7% semelhantes, 65% piores
» O melhor teve um delta de 6%, a média foi 18%, o pior foi 132%
Comparado com todos os dispositivos testados
» 19% de todos os dispositivos testados foram melhores, 4% semelhantes, 77% piores
» O melhor teve um delta de 4%, a média foi 24%, o pior foi 134%
| desligado | |
| Ocioso | |
| Carga |
|
Key:
min: | |
| Dell G3 15 3500-G4DG2 i7-10750H, GeForce RTX 2060 Mobile, SK Hynix BC511 HFM512GDJTNI, IPS, 1920x1080, 15.6" | Nexoc GH5 515IG i5-10300H, GeForce GTX 1650 Mobile, Samsung SSD 860 Evo 512GB, IPS, 1920x1080, 15.6" | MSI Bravo 15 A4DCR R7 4800H, Radeon RX 5300M, Samsung PM981a MZVLB1T0HBLR, IPS-Level, 1920x1080, 15.6" | Acer Nitro 5 AN517-52-77DS i7-10750H, GeForce RTX 2060 Mobile, WDC PC SN530 SDBPNPZ-1T00, IPS, 1920x1080, 17.3" | Média NVIDIA GeForce RTX 2060 Mobile | Média da turma Gaming | |
|---|---|---|---|---|---|---|
| Power Consumption | 32% | -12% | 14% | -32% | -48% | |
| Idle Minimum * (Watt) | 7 | 3 57% | 11 -57% | 5.4 23% | 11.5 ? -64% | 13.2 ? -89% |
| Idle Average * (Watt) | 10.2 | 7 31% | 14 -37% | 9.8 4% | 16.5 ? -62% | 18.9 ? -85% |
| Idle Maximum * (Watt) | 15 | 16 -7% | 25 -67% | 10.9 27% | 23.7 ? -58% | 24.3 ? -62% |
| Load Average * (Watt) | 147 | 85 42% | 72 51% | 104 29% | 107.5 ? 27% | 108 ? 27% |
| Witcher 3 ultra * (Watt) | 131 | 86 34% | 100 24% | 134.3 -3% | ||
| Load Maximum * (Watt) | 197 | 134 32% | 163 17% | 193 2% | 199.7 ? -1% | 254 ? -29% |
* ... menor é melhor
| Dell G3 15 3500-G4DG2 i7-10750H, GeForce RTX 2060 Mobile, 68 Wh | Nexoc GH5 515IG i5-10300H, GeForce GTX 1650 Mobile, 48.96 Wh | MSI Bravo 15 A4DCR R7 4800H, Radeon RX 5300M, 51 Wh | Acer Nitro 5 AN517-52-77DS i7-10750H, GeForce RTX 2060 Mobile, 57.48 Wh | Média da turma Gaming | |
|---|---|---|---|---|---|
| Duração da bateria | 32% | -21% | 33% | 14% | |
| Reader / Idle (h) | 7.5 | 14.9 99% | 7 -7% | 11 47% | 8.71 ? 16% |
| WiFi v1.3 (h) | 5.2 | 6.4 23% | 4.5 -13% | 6.6 27% | 7.02 ? 35% |
| Load (h) | 1.6 | 1.2 -25% | 0.9 -44% | 2 25% | 1.47 ? -8% |
Pro
Contra
Veredicto - O portátil para jogos da Dell é adequado para o uso diário

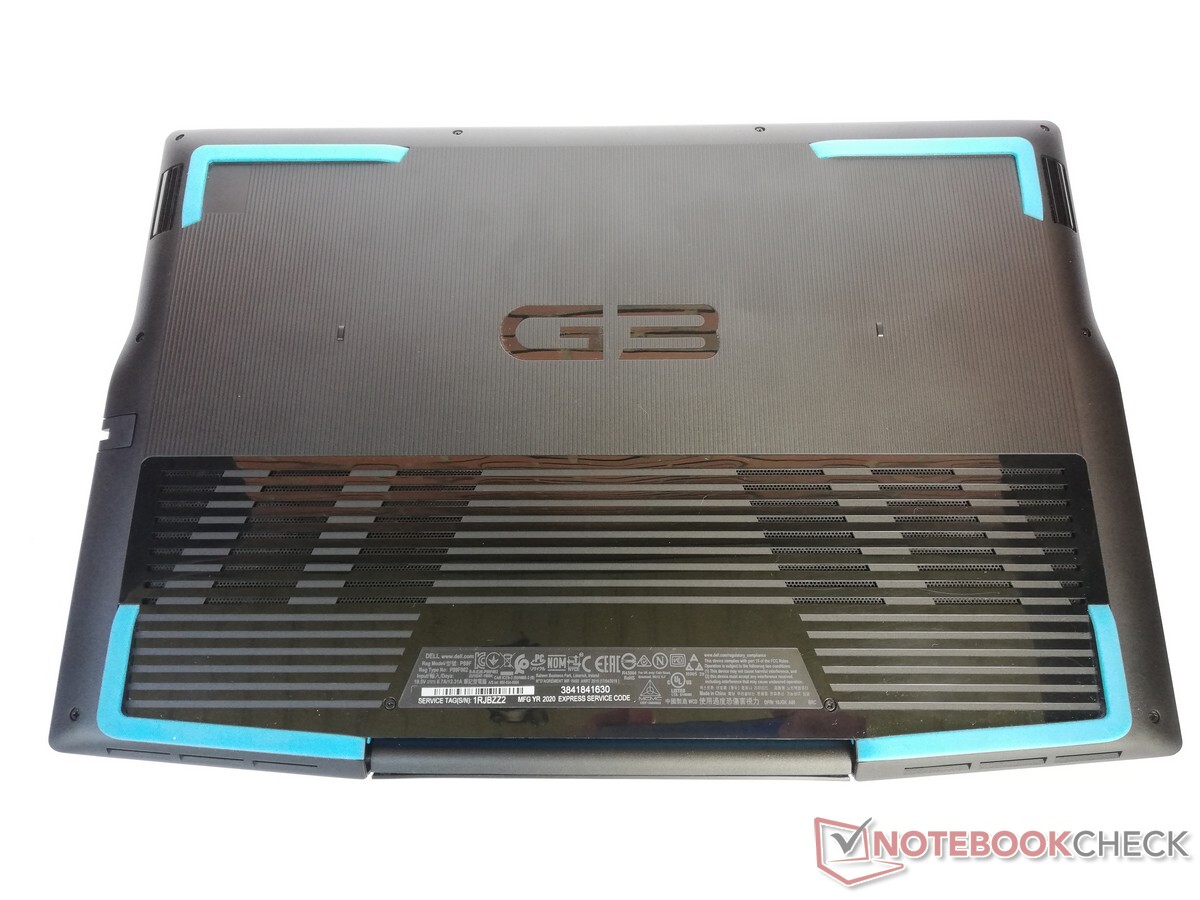
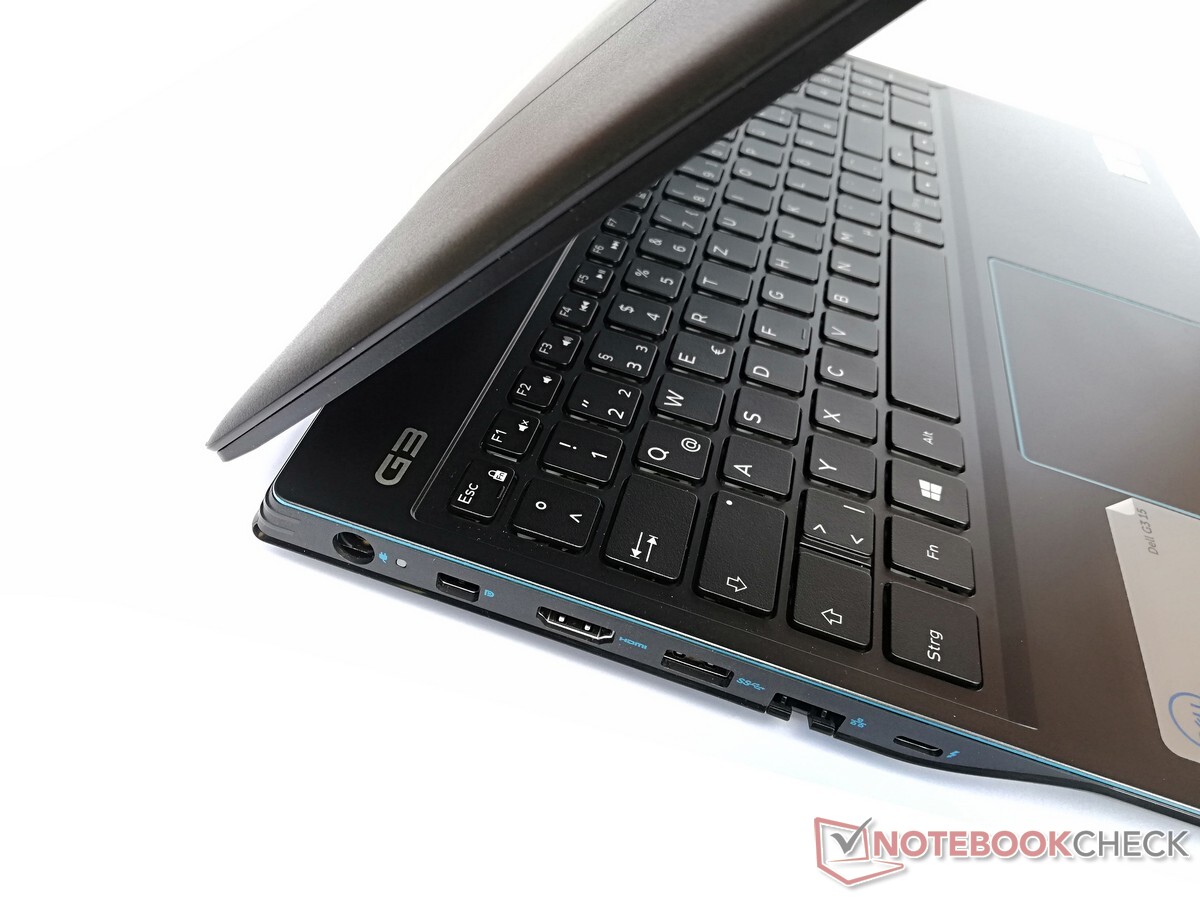
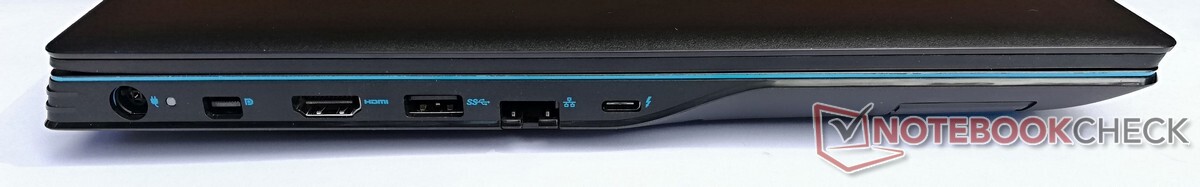
Em nosso teste, o Dell G3 15 3500 provou ser um portátil para jogos muito sólido. Isso não se aplica apenas ao desempenho, mas também à carcaça. O plástico robusto oferece muita estabilidade, então certamente transportaríamos o G3 15 sem hesitação. Quando comparado com a concorrência, o design não estabelece novos padrões, mas não precisa. Com suas boas opções de manutenção e um conector Thunderbolt 3, também há potencial para atualizações futuras.
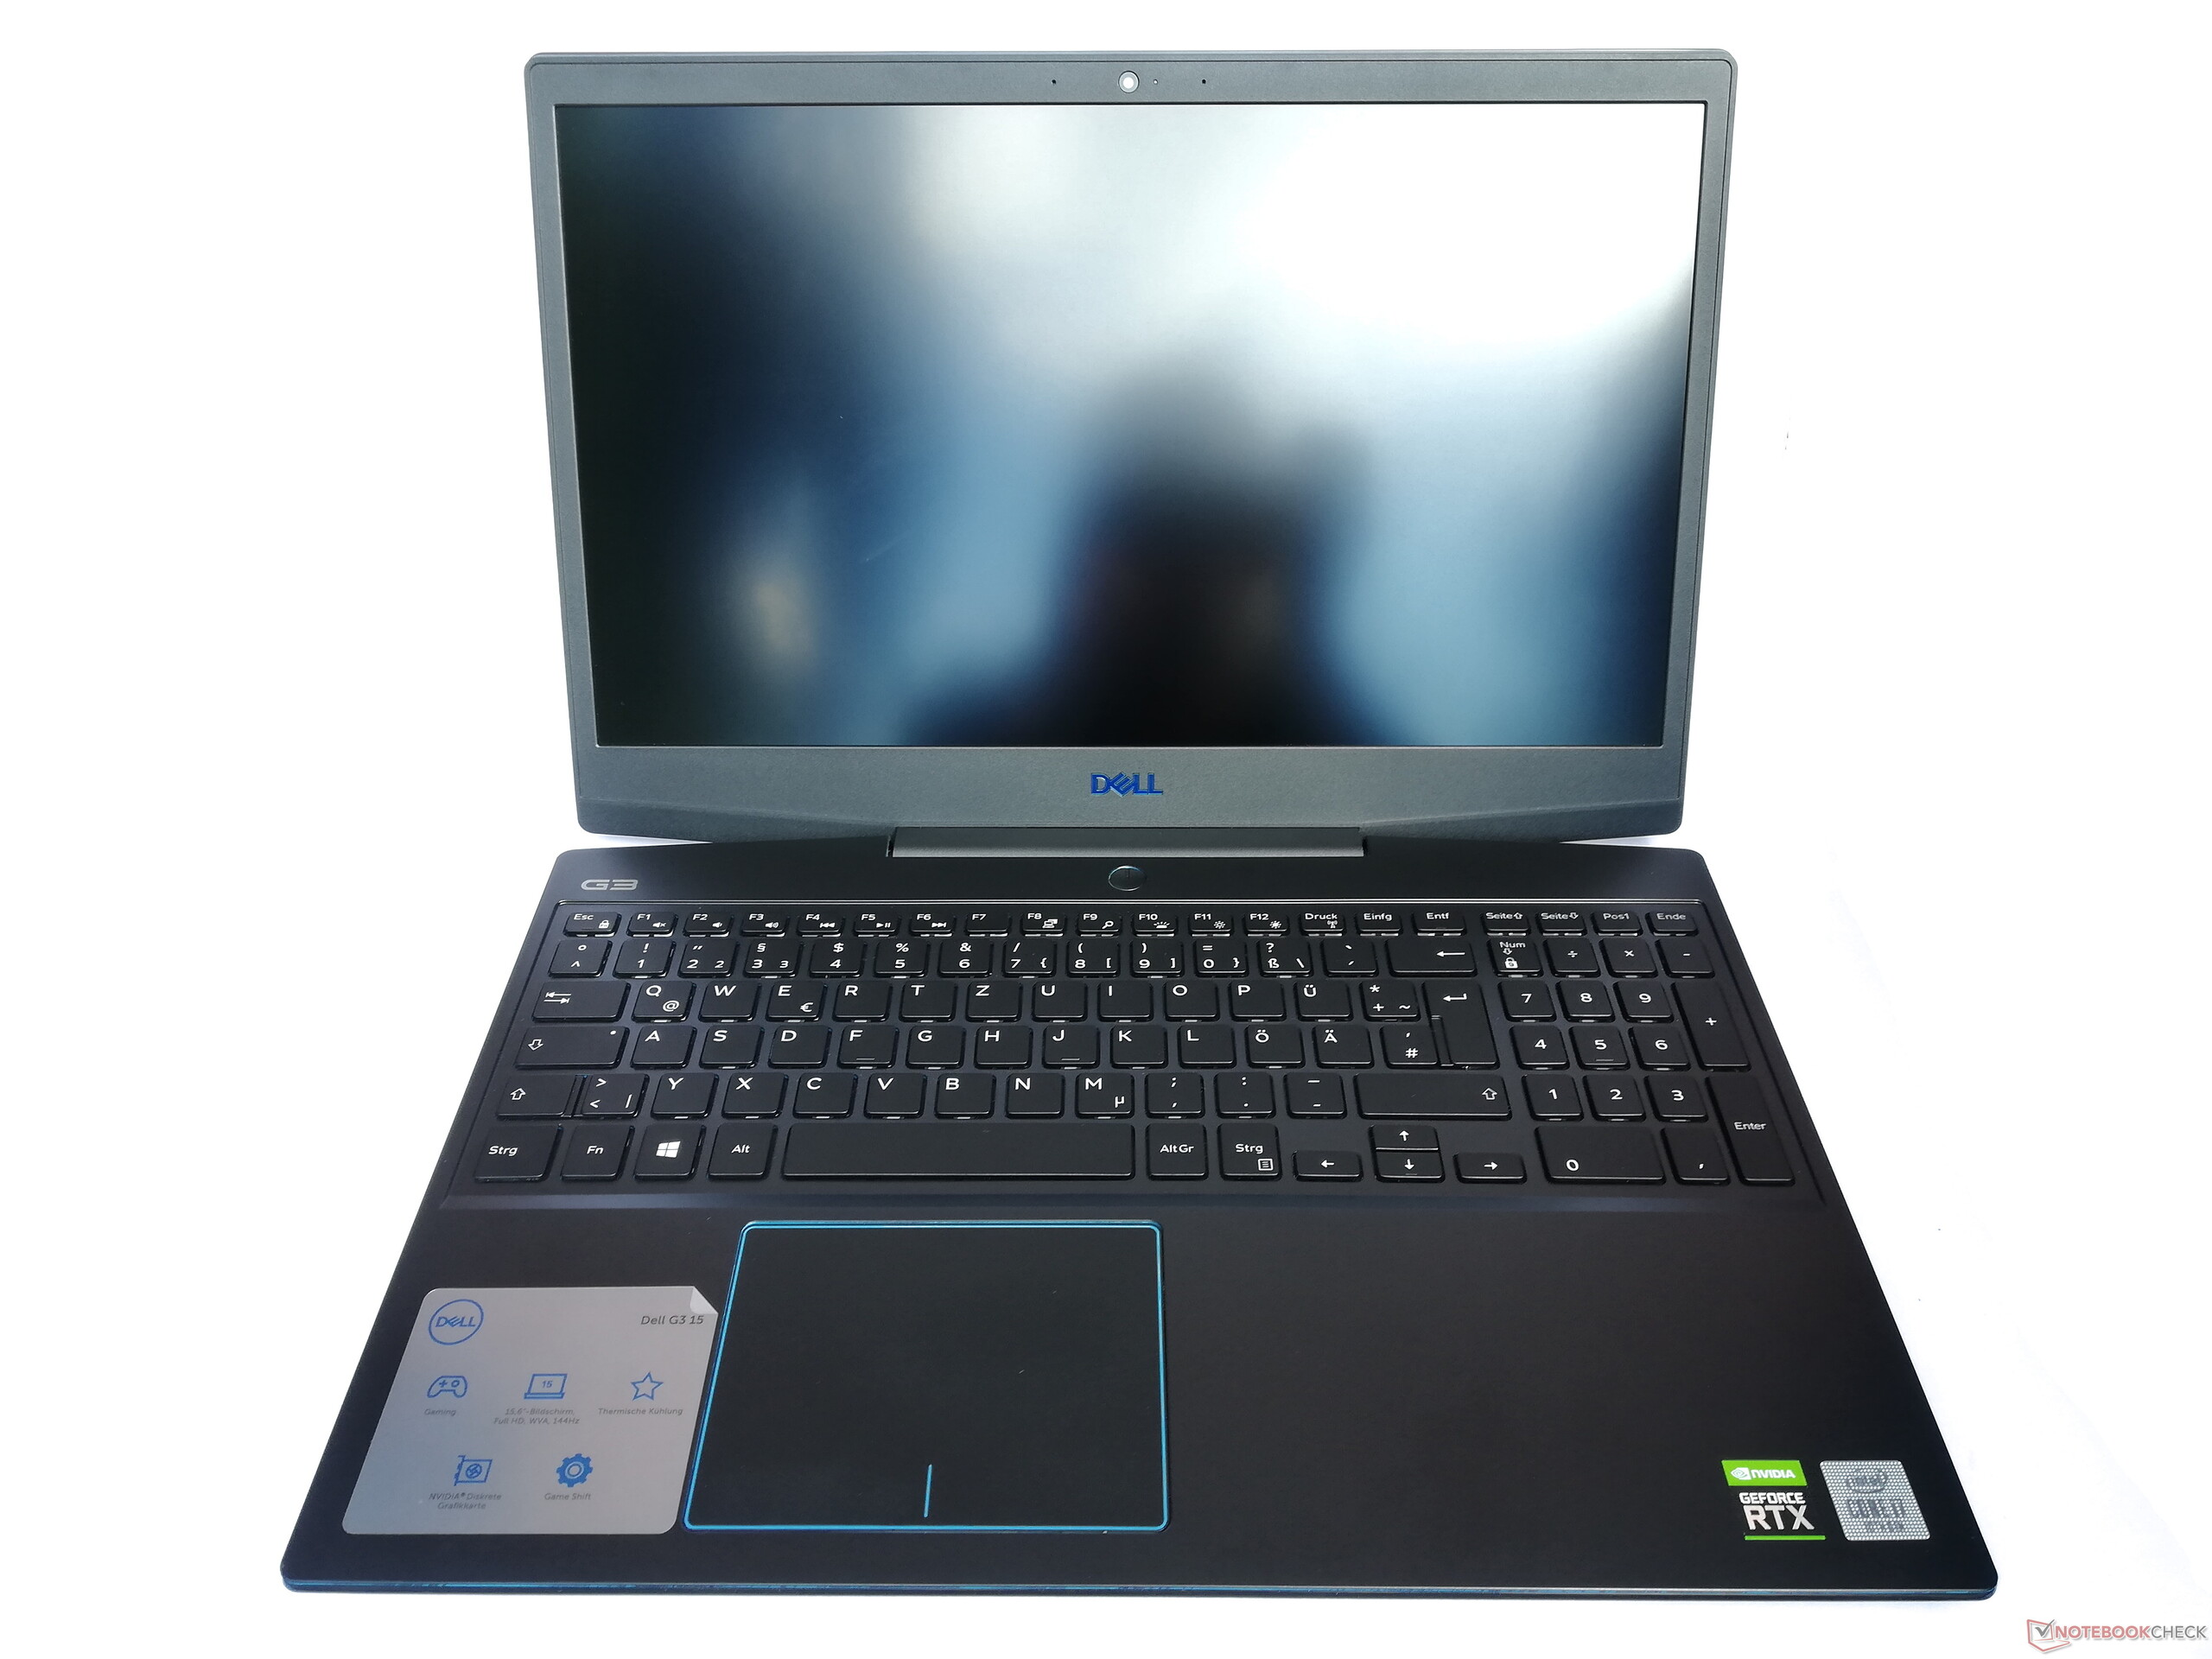
O Dell G3 15 é um portátil robusto para jogos com potência suficiente para altos níveis de gráficos em resolução Full HD.
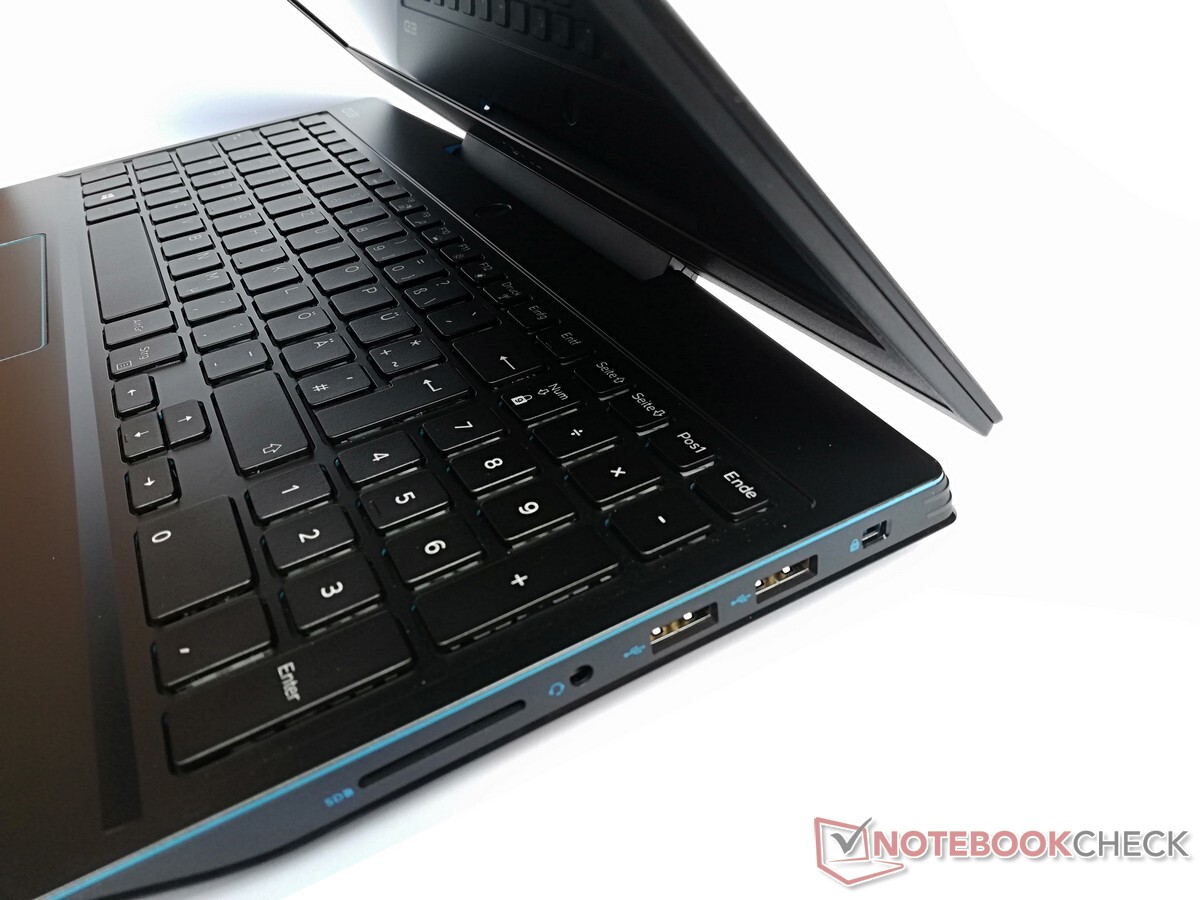
No entanto, também existem pequenos pontos fracos a serem encontrados com o Dell G3 15 3500. Isso inclui, por exemplo, o lento leitor de cartão de memória, que permite que os cartões SD se projetem bem além da borda da carcaça. A duração da bateria também deve ser um pouco melhor em vista dos 68 Wh disponíveis, e a tela também não é de primeira classe com sua tendência ao bleeding da tela. Mas, pelo preço razoável, tudo isso é bastante suportável.
Dell G3 15 3500-G4DG2
- 09/07/2020 v7 (old)
Mike Wobker