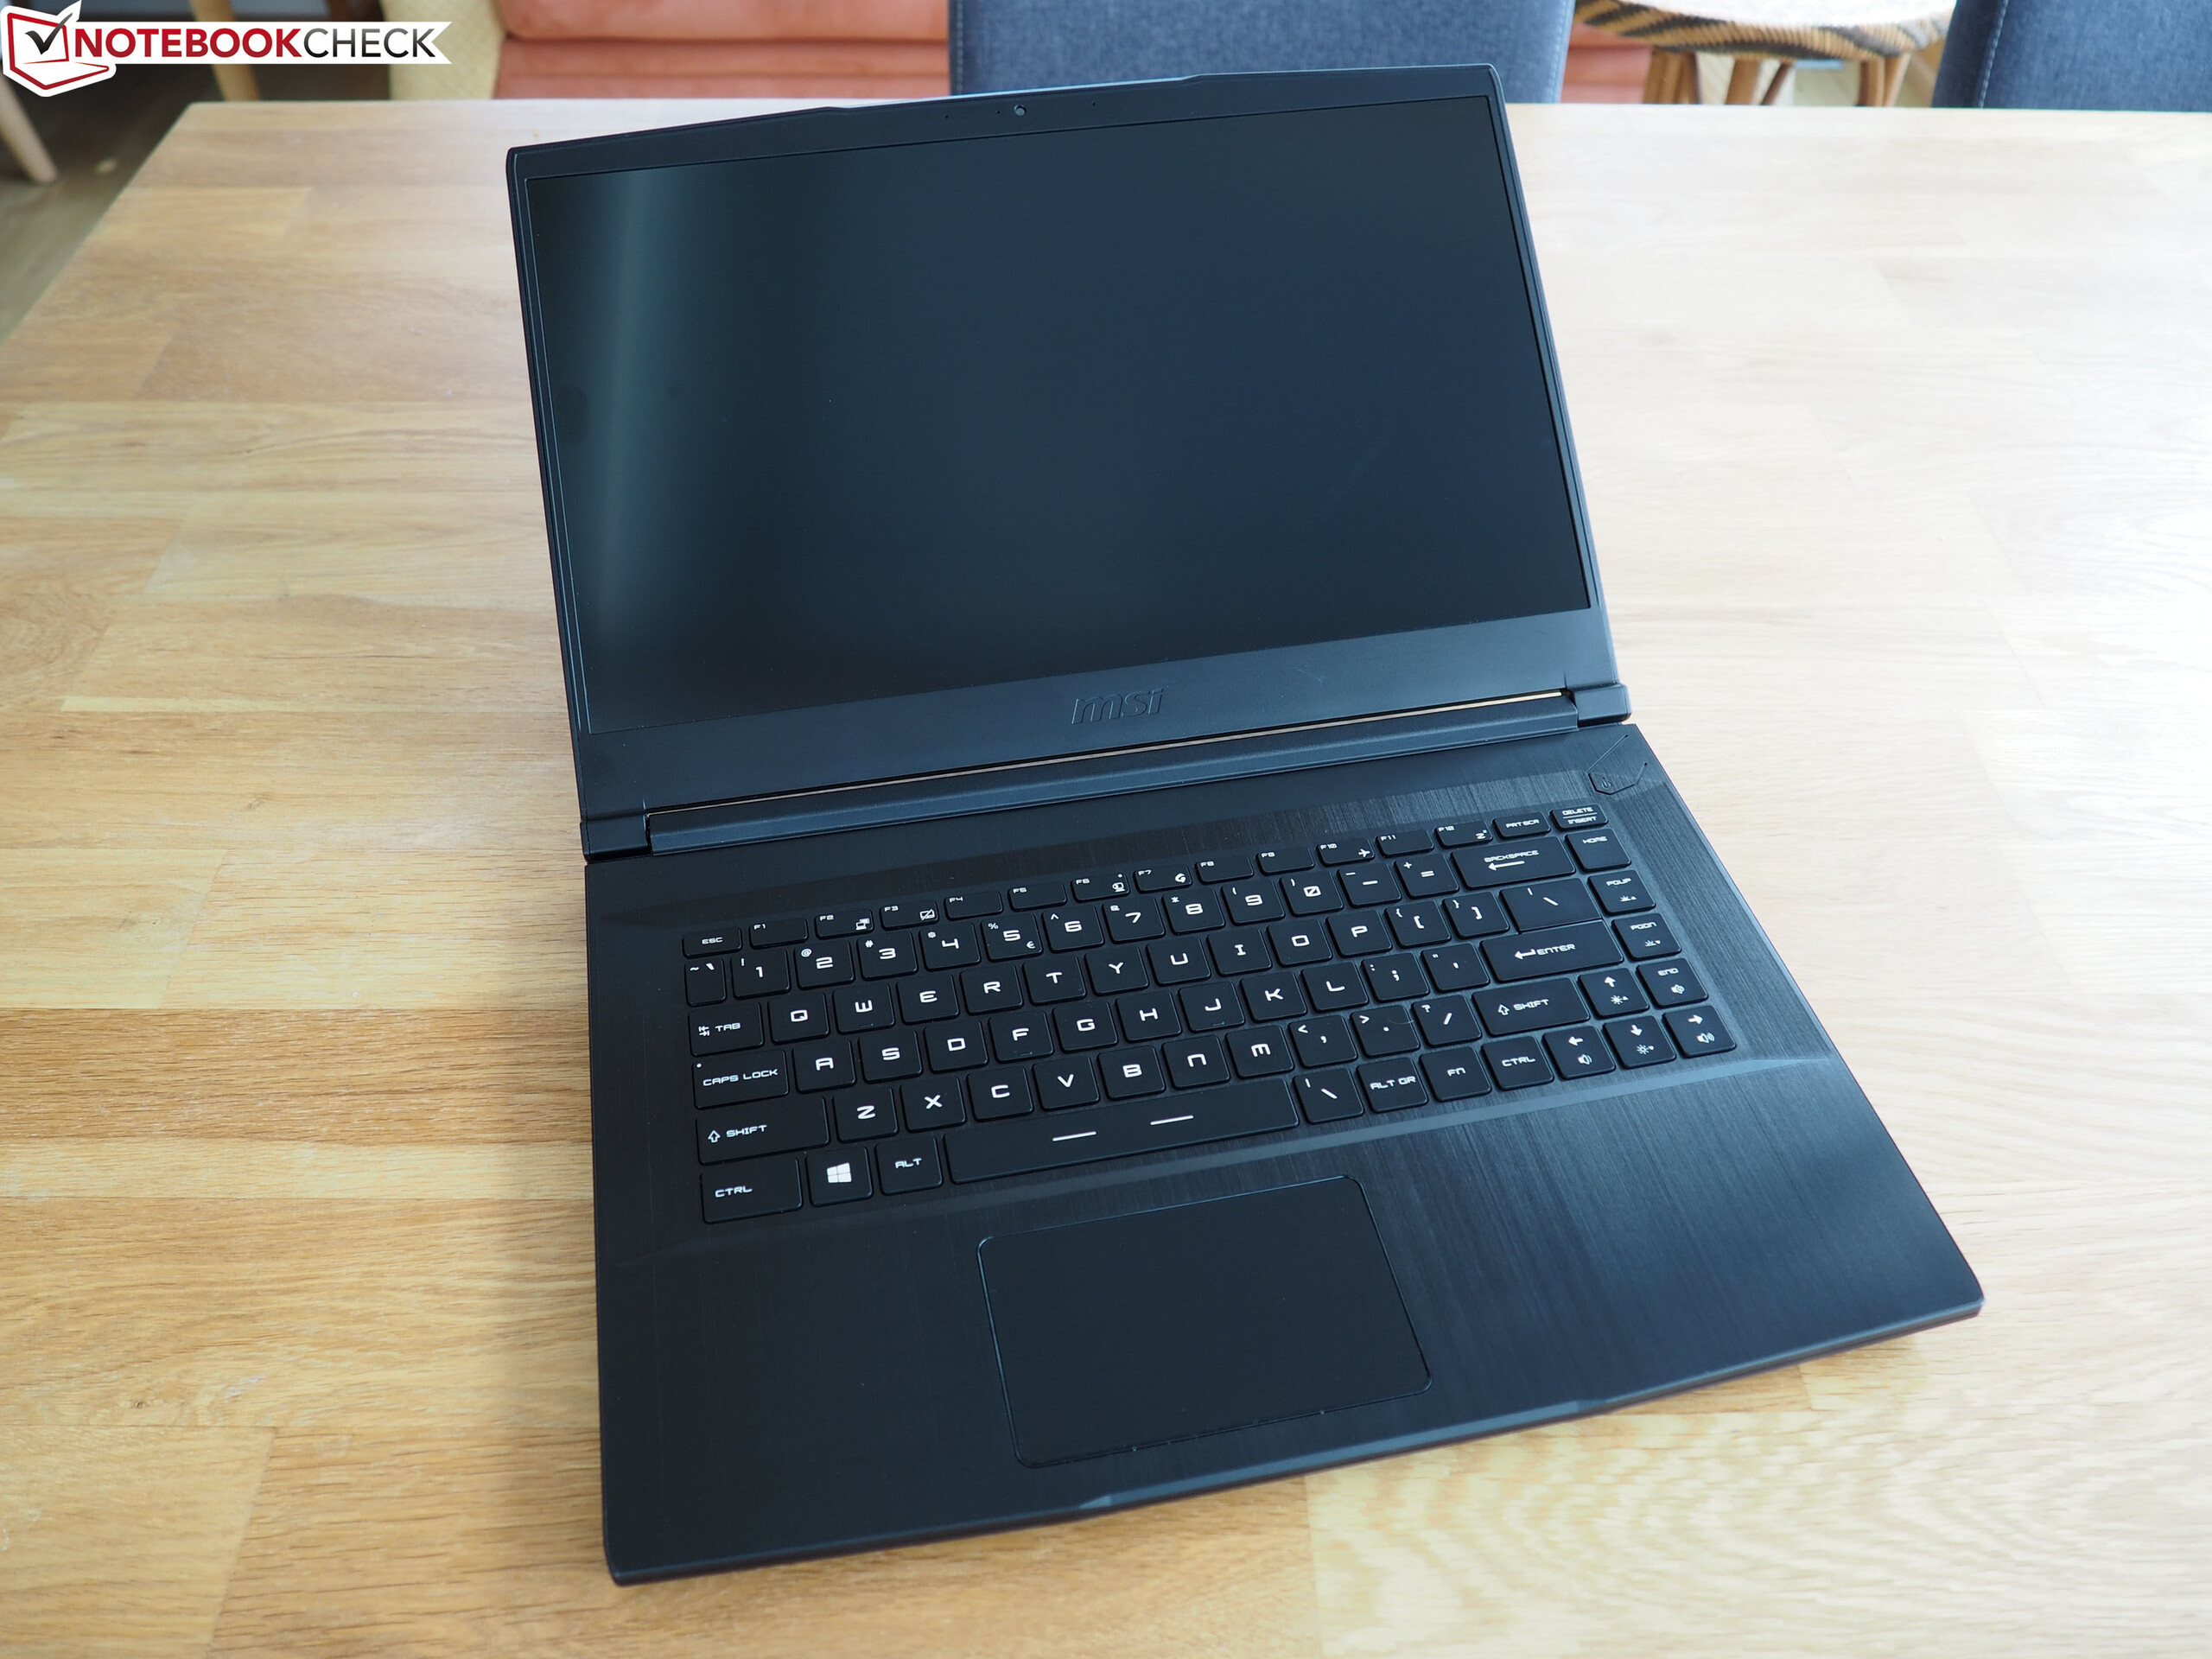
Breve Análise do Portátil MSI Bravo 15 A4DCR: Para caçadores de barganhas
Avaliação | Data | Modelo | Peso | Altura | Size | Resolução | Preço |
|---|---|---|---|---|---|---|---|
| 79.5 % v7 (old) | 07/2020 | MSI Bravo 15 A4DCR R7 4800H, Radeon RX 5300M | 2 kg | 22 mm | 15.60" | 1920x1080 | |
| 79.8 % v7 (old) | 07/2020 | Acer Nitro 5 AN515-44-R5FT R5 4600H, GeForce GTX 1650 Ti Mobile | 2.2 kg | 24 mm | 15.60" | 1920x1080 | |
| 80.4 % v6 (old) | 07/2019 | Asus TUF FX505DT-EB73 R7 3750H, GeForce GTX 1650 Mobile | 2.2 kg | 26.8 mm | 15.60" | 1920x1080 | |
| 79.6 % v7 (old) | 10/2019 | Dell G5 15 5590-PCNJJ i5-9300H, GeForce GTX 1650 Mobile | 2.7 kg | 23.7 mm | 15.60" | 1920x1080 | |
| 81.5 % v7 (old) | 07/2019 | HP Omen 15-dc1020ng i5-9300H, GeForce GTX 1650 Mobile | 2.3 kg | 25 mm | 15.60" | 1920x1080 |


| |||||||||||||||||||||||||
iluminação: 88 %
iluminação com acumulador: 311 cd/m²
Contraste: 723:1 (Preto: 0.43 cd/m²)
ΔE ColorChecker Calman: 4.5 | ∀{0.5-29.43 Ø4.73}
calibrated: 2.65
ΔE Greyscale Calman: 3.3 | ∀{0.09-98 Ø4.97}
86% sRGB (Argyll 1.6.3 3D)
63% AdobeRGB 1998 (Argyll 1.6.3 3D)
62.7% AdobeRGB 1998 (Argyll 3D)
86.8% sRGB (Argyll 3D)
62% Display P3 (Argyll 3D)
Gamma: 2.129
CCT: 7227 K
| MSI Bravo 15 A4DCR AU Optronics B156HAN08.0 (AUO80ED), IPS-Level, 1920x1080 | Acer Nitro 5 AN515-44-R5FT Panda LM156LF-2F01 (NCP004D), IPS, 1920x1080 | Asus TUF FX505DT-EB73 Panda LM156LF-GL, IPS, 1920x1080 | Dell G5 15 5590-PCNJJ AU Optronics B156HAN (AUO23ED), IPS, 1920x1080 | HP Omen 15-dc1020ng LGD05CE, IPS, 1920x1080 | |
|---|---|---|---|---|---|
| Display | -32% | -34% | 34% | -36% | |
| Display P3 Coverage (%) | 62 | 41.16 -34% | 39.56 -36% | 83.1 34% | 38.37 -38% |
| sRGB Coverage (%) | 86.8 | 61.8 -29% | 59.5 -31% | 99.9 15% | 57.6 -34% |
| AdobeRGB 1998 Coverage (%) | 62.7 | 42.56 -32% | 40.91 -35% | 96.8 54% | 39.69 -37% |
| Response Times | -172% | -128% | -194% | -168% | |
| Response Time Grey 50% / Grey 80% * (ms) | 16 ? | 40.8 ? -155% | 30.4 ? -90% | 48 ? -200% | 40 ? -150% |
| Response Time Black / White * (ms) | 10.4 ? | 30 ? -188% | 27.6 ? -165% | 30 ? -188% | 29.6 ? -185% |
| PWM Frequency (Hz) | |||||
| Screen | -11% | -30% | -19% | -23% | |
| Brightness middle (cd/m²) | 311 | 287 -8% | 286.2 -8% | 234 -25% | 251 -19% |
| Brightness (cd/m²) | 313 | 271 -13% | 267 -15% | 216 -31% | 232 -26% |
| Brightness Distribution (%) | 88 | 88 0% | 84 -5% | 87 -1% | 76 -14% |
| Black Level * (cd/m²) | 0.43 | 0.25 42% | 0.33 23% | 0.22 49% | 0.17 60% |
| Contrast (:1) | 723 | 1148 59% | 867 20% | 1064 47% | 1476 104% |
| Colorchecker dE 2000 * | 4.5 | 4.77 -6% | 5.45 -21% | 6.52 -45% | 6.2 -38% |
| Colorchecker dE 2000 max. * | 7.97 | 17.15 -115% | 18.08 -127% | 10.58 -33% | 18.6 -133% |
| Colorchecker dE 2000 calibrated * | 2.65 | 3.73 -41% | 4.47 -69% | 3.56 -34% | 4.8 -81% |
| Greyscale dE 2000 * | 3.3 | 2.7 18% | 5.3 -61% | 5.33 -62% | 4.2 -27% |
| Gamma | 2.129 103% | 2.115 104% | 2.1 105% | 2.86 77% | 2.32 95% |
| CCT | 7227 90% | 7187 90% | 7679 85% | 5983 109% | 7454 87% |
| Color Space (Percent of AdobeRGB 1998) (%) | 63 | 43 -32% | 37.6 -40% | 36 -43% | 36.5 -42% |
| Color Space (Percent of sRGB) (%) | 86 | 61 -29% | 59.1 -31% | 57 -34% | 57.4 -33% |
| Média Total (Programa/Configurações) | -72% /
-35% | -64% /
-43% | -60% /
-31% | -76% /
-43% |
* ... menor é melhor
Exibir tempos de resposta
| ↔ Tempo de resposta preto para branco | ||
|---|---|---|
| 10.4 ms ... ascensão ↗ e queda ↘ combinadas | ↗ 6 ms ascensão | 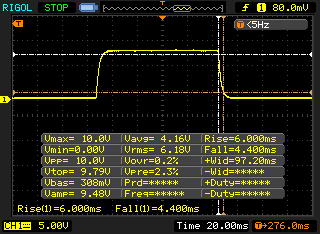 |
| ↘ 4.4 ms queda | ||
| A tela mostra boas taxas de resposta em nossos testes, mas pode ser muito lenta para jogadores competitivos. Em comparação, todos os dispositivos testados variam de 0.1 (mínimo) a 240 (máximo) ms. » 28 % de todos os dispositivos são melhores. Isso significa que o tempo de resposta medido é melhor que a média de todos os dispositivos testados (19.9 ms). | ||
| ↔ Tempo de resposta 50% cinza a 80% cinza | ||
| 16 ms ... ascensão ↗ e queda ↘ combinadas | ↗ 7.6 ms ascensão | 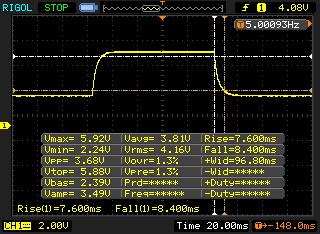 |
| ↘ 8.4 ms queda | ||
| A tela mostra boas taxas de resposta em nossos testes, mas pode ser muito lenta para jogadores competitivos. Em comparação, todos os dispositivos testados variam de 0.165 (mínimo) a 636 (máximo) ms. » 30 % de todos os dispositivos são melhores. Isso significa que o tempo de resposta medido é melhor que a média de todos os dispositivos testados (31.1 ms). | ||
Cintilação da tela / PWM (modulação por largura de pulso)
| Tela tremeluzindo / PWM não detectado | 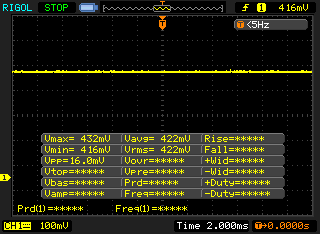 | ||
[pwm_comparison] Em comparação: 52 % de todos os dispositivos testados não usam PWM para escurecer a tela. Se PWM foi detectado, uma média de 7791 (mínimo: 5 - máximo: 343500) Hz foi medida. | |||
| Blender - v2.79 BMW27 CPU | |
| HP Omen 15-dc1020ng | |
| Acer Nitro 5 AN515-44-R5FT | |
| MSI Bravo 15 A4DCR | |
| Média da turma Gaming (80 - 330, n=107, últimos 2 anos) | |
| HWBOT x265 Benchmark v2.2 - 4k Preset | |
| Média da turma Gaming (11.5 - 44.3, n=108, últimos 2 anos) | |
| MSI Bravo 15 A4DCR | |
| Acer Nitro 5 AN515-44-R5FT | |
| HP Omen 15-dc1020ng | |
| LibreOffice - 20 Documents To PDF | |
| MSI Bravo 15 A4DCR | |
| Acer Nitro 5 AN515-44-R5FT | |
| Média da turma Gaming (19 - 88.8, n=108, últimos 2 anos) | |
| R Benchmark 2.5 - Overall mean | |
| Acer Nitro 5 AN515-44-R5FT | |
| MSI Bravo 15 A4DCR | |
| Média da turma Gaming (0.3439 - 0.759, n=109, últimos 2 anos) | |
* ... menor é melhor
| DPC Latencies / LatencyMon - interrupt to process latency (max), Web, Youtube, Prime95 | |
| MSI Bravo 15 A4DCR | |
| Acer Nitro 5 AN515-44-R5FT | |
* ... menor é melhor
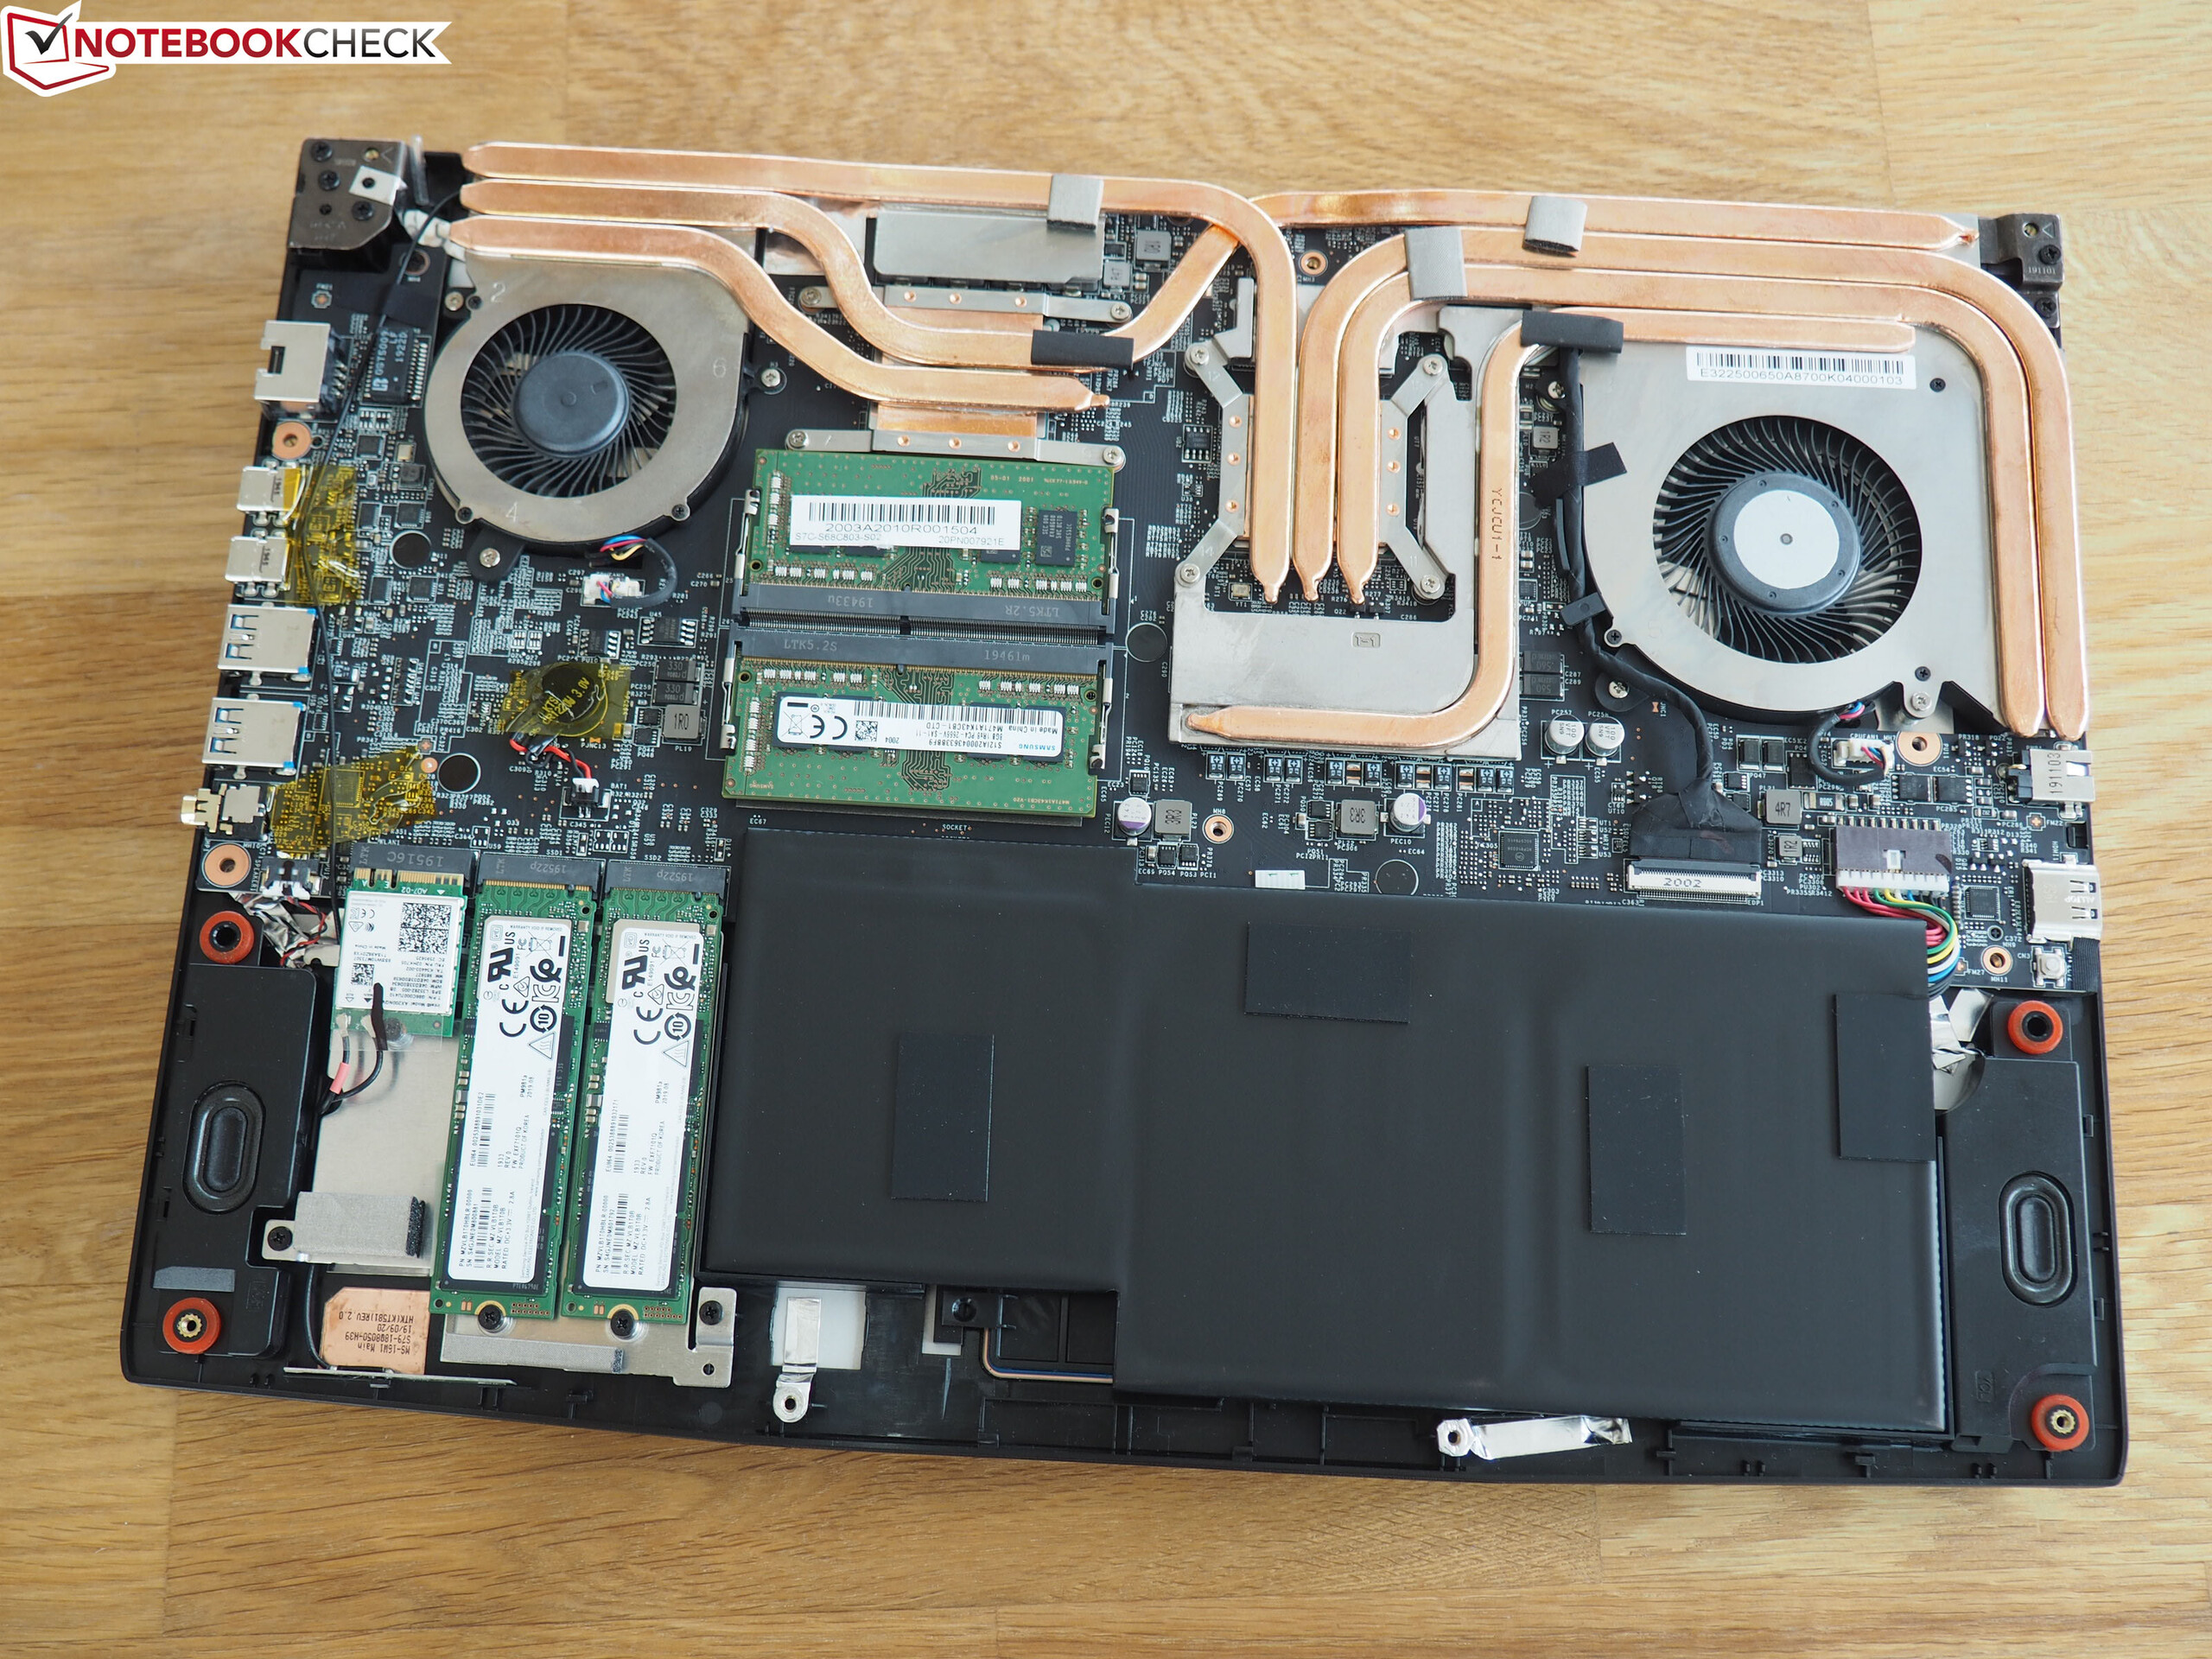
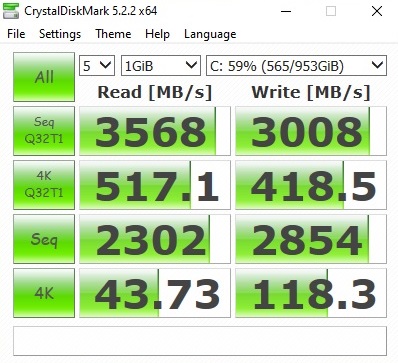
| MSI Bravo 15 A4DCR Samsung PM981a MZVLB1T0HBLR | Acer Nitro 5 AN515-44-R5FT SK Hynix BC511 HFM512GDJTNI | Asus TUF FX505DT-EB73 Intel SSD 660p SSDPEKNW512G8 | Dell G5 15 5590-PCNJJ KBG30ZMS128G | HP Omen 15-dc1020ng WDC PC SN720 SDAQNTW-512G | |
|---|---|---|---|---|---|
| CrystalDiskMark 5.2 / 6 | -31% | -31% | -67% | -14% | |
| Write 4K (MB/s) | 118.3 | 94.7 -20% | 137.5 16% | 65.3 -45% | 112.1 -5% |
| Read 4K (MB/s) | 43.73 | 38.91 -11% | 57 30% | 29.71 -32% | 42.01 -4% |
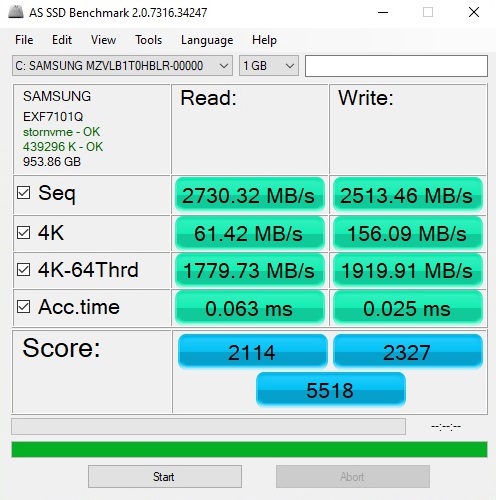
| Write Seq (MB/s) | 2854 | 1056 -63% | 984 -66% | 128.8 -95% | 1964 -31% |
| Read Seq (MB/s) | 2302 | 1183 -49% | 1564 -32% | 859 -63% | 2065 -10% |
| Write 4K Q32T1 (MB/s) | 418.5 | 445.3 6% | 237.4 -43% | 95.8 -77% | 318.2 -24% |
| Read 4K Q32T1 (MB/s) | 517 | 477.7 -8% | 340.7 -34% | 197.6 -62% | 406.7 -21% |
| Write Seq Q32T1 (MB/s) | 3008 | 1063 -65% | 959 -68% | 132.5 -96% | 2534 -16% |
| Read Seq Q32T1 (MB/s) | 3568 | 2154 -40% | 1732 -51% | 1208 -66% | 3438 -4% |

| 3DMark 06 Standard Score | 36032 pontos | |
| 3DMark Vantage P Result | 39264 pontos | |
| 3DMark 11 Performance | 14048 pontos | |
| 3DMark Cloud Gate Standard Score | 32417 pontos | |
| 3DMark Fire Strike Score | 9404 pontos | |
| 3DMark Time Spy Score | 3872 pontos | |
Ajuda | ||
| The Witcher 3 | |
| 1920x1080 High Graphics & Postprocessing (Nvidia HairWorks Off) | |
| Média da turma Gaming (181 - 341, n=3, últimos 2 anos) | |
| Acer Nitro 5 AN515-44-R5FT | |
| Asus TUF FX505DT-EB73 | |
| HP Omen 15-dc1020ng | |
| MSI Bravo 15 A4DCR | |
| Dell G5 15 5590-PCNJJ | |
| 1920x1080 Ultra Graphics & Postprocessing (HBAO+) | |
| Média da turma Gaming (95 - 240, n=8, últimos 2 anos) | |
| Acer Nitro 5 AN515-44-R5FT | |
| MSI Bravo 15 A4DCR | |
| HP Omen 15-dc1020ng | |
| Asus TUF FX505DT-EB73 | |
| Dell G5 15 5590-PCNJJ | |
| baixo | média | alto | ultra | |
|---|---|---|---|---|
| GTA V (2015) | 163 | 86.1 | 42.6 | |
| The Witcher 3 (2015) | 178 | 122 | 60 | 38.3 |
| Dota 2 Reborn (2015) | 113 | 108 | 97.9 | 94.7 |
| Fortnite (2018) | 131 | 114 | 81.8 | 58.2 |
| Final Fantasy XV Benchmark (2018) | 98.4 | 51.6 | 29.3 | |
| Kingdom Come: Deliverance (2018) | 118 | 70.4 | 60.8 | 38.3 |
| X-Plane 11.11 (2018) | 51.5 | 39.5 | 34.9 | |
| Monster Hunter World (2018) | 80.6 | 60.1 | 52.2 | 42.6 |
| Shadow of the Tomb Raider (2018) | 114 | 60 | 48 | 36 |
| Assassin´s Creed Odyssey (2018) | 72 | 59 | 42 | 25 |
| Hitman 2 (2018) | 74.5 | 65.7 | 55.8 | 48.8 |
| Battlefield V (2018) | 140 | 91.8 | 79.4 | 70.8 |
| Darksiders III (2018) | 155 | 76.8 | 62.2 | 54.9 |
| Just Cause 4 (2018) | 108 | 79.1 | 56 | 52.5 |
| Apex Legends (2019) | 143 | 87.2 | 68.6 | 67.6 |
| Far Cry New Dawn (2019) | 88 | 69 | 64 | 58 |
| Metro Exodus (2019) | 105 | 51.2 | 36.1 | 28.6 |
| Dirt Rally 2.0 (2019) | 190 | 110 | 89.9 | 49.5 |
| The Division 2 (2019) | 120 | 75 | 63 | 42 |
| Anno 1800 (2019) | 83.4 | 60.3 | 39.7 | 20.6 |
| Rage 2 (2019) | 121 | 54.8 | 30.4 | 29.8 |
| F1 2019 (2019) | 176 | 106 | 94 | 81 |
| Control (2019) | 132 | 41.8 | 29.4 | |
| Borderlands 3 (2019) | 97.3 | 63.6 | 40.9 | 36 |
| FIFA 20 (2019) | 190 | 172 | 160 | 153 |
| Ghost Recon Breakpoint (2019) | 82 | 51 | 41 | 22 |
| GRID 2019 (2019) | 164 | 76.8 | 54.8 | 25.5 |
| Call of Duty Modern Warfare 2019 (2019) | 127 | 72.2 | 57.9 | 47 |
| Need for Speed Heat (2019) | 78.6 | 67.9 | 58.6 | 52.9 |
| Star Wars Jedi Fallen Order (2019) | 71.2 | 61.1 | 53.1 | |
| Red Dead Redemption 2 (2019) | 95.4 | 41.2 | 32.1 | |
| Escape from Tarkov (2020) | 121 | 80.5 | 70.1 | 56.7 |
| Hunt Showdown (2020) | 137 | 53 | 43.2 | |
| Doom Eternal (2020) | 0 o jogo não começa | 0 o jogo não começa | 0 o jogo não começa | 0 o jogo não começa |
| Gears Tactics (2020) | 231 | 100 | 66.4 | 47.5 |
Barulho
| Ocioso |
| 31 / 32 / 40 dB |
| Carga |
| 48 / 54 dB |
 | ||
30 dB silencioso 40 dB(A) audível 50 dB(A) ruidosamente alto |
||
min: | ||
| MSI Bravo 15 A4DCR R7 4800H, Radeon RX 5300M | Acer Nitro 5 AN515-44-R5FT R5 4600H, GeForce GTX 1650 Ti Mobile | Asus TUF FX505DT-EB73 R7 3750H, GeForce GTX 1650 Mobile | Dell G5 15 5590-PCNJJ i5-9300H, GeForce GTX 1650 Mobile | HP Omen 15-dc1020ng i5-9300H, GeForce GTX 1650 Mobile | Média da turma Gaming | |
|---|---|---|---|---|---|---|
| Noise | 5% | 11% | 2% | 17% | 14% | |
| desligado / ambiente * (dB) | 30 | 30 -0% | 28.2 6% | 30 -0% | 28.8 4% | 24.1 ? 20% |
| Idle Minimum * (dB) | 31 | 30 3% | 28.2 9% | 31 -0% | 28.8 7% | 25.8 ? 17% |
| Idle Average * (dB) | 32 | 32 -0% | 28.2 12% | 32 -0% | 29.5 8% | 27.4 ? 14% |
| Idle Maximum * (dB) | 40 | 34 15% | 31.4 22% | 35 12% | 31.1 22% | 29.9 ? 25% |
| Load Average * (dB) | 48 | 46 4% | 39.8 17% | 49 -2% | 35.2 27% | 43 ? 10% |
| Witcher 3 ultra * (dB) | 48 | 47 2% | 47 2% | 47 2% | 35.2 27% | |
| Load Maximum * (dB) | 54 | 49 9% | 50.2 7% | 53 2% | 41 24% | 54 ? -0% |
* ... menor é melhor
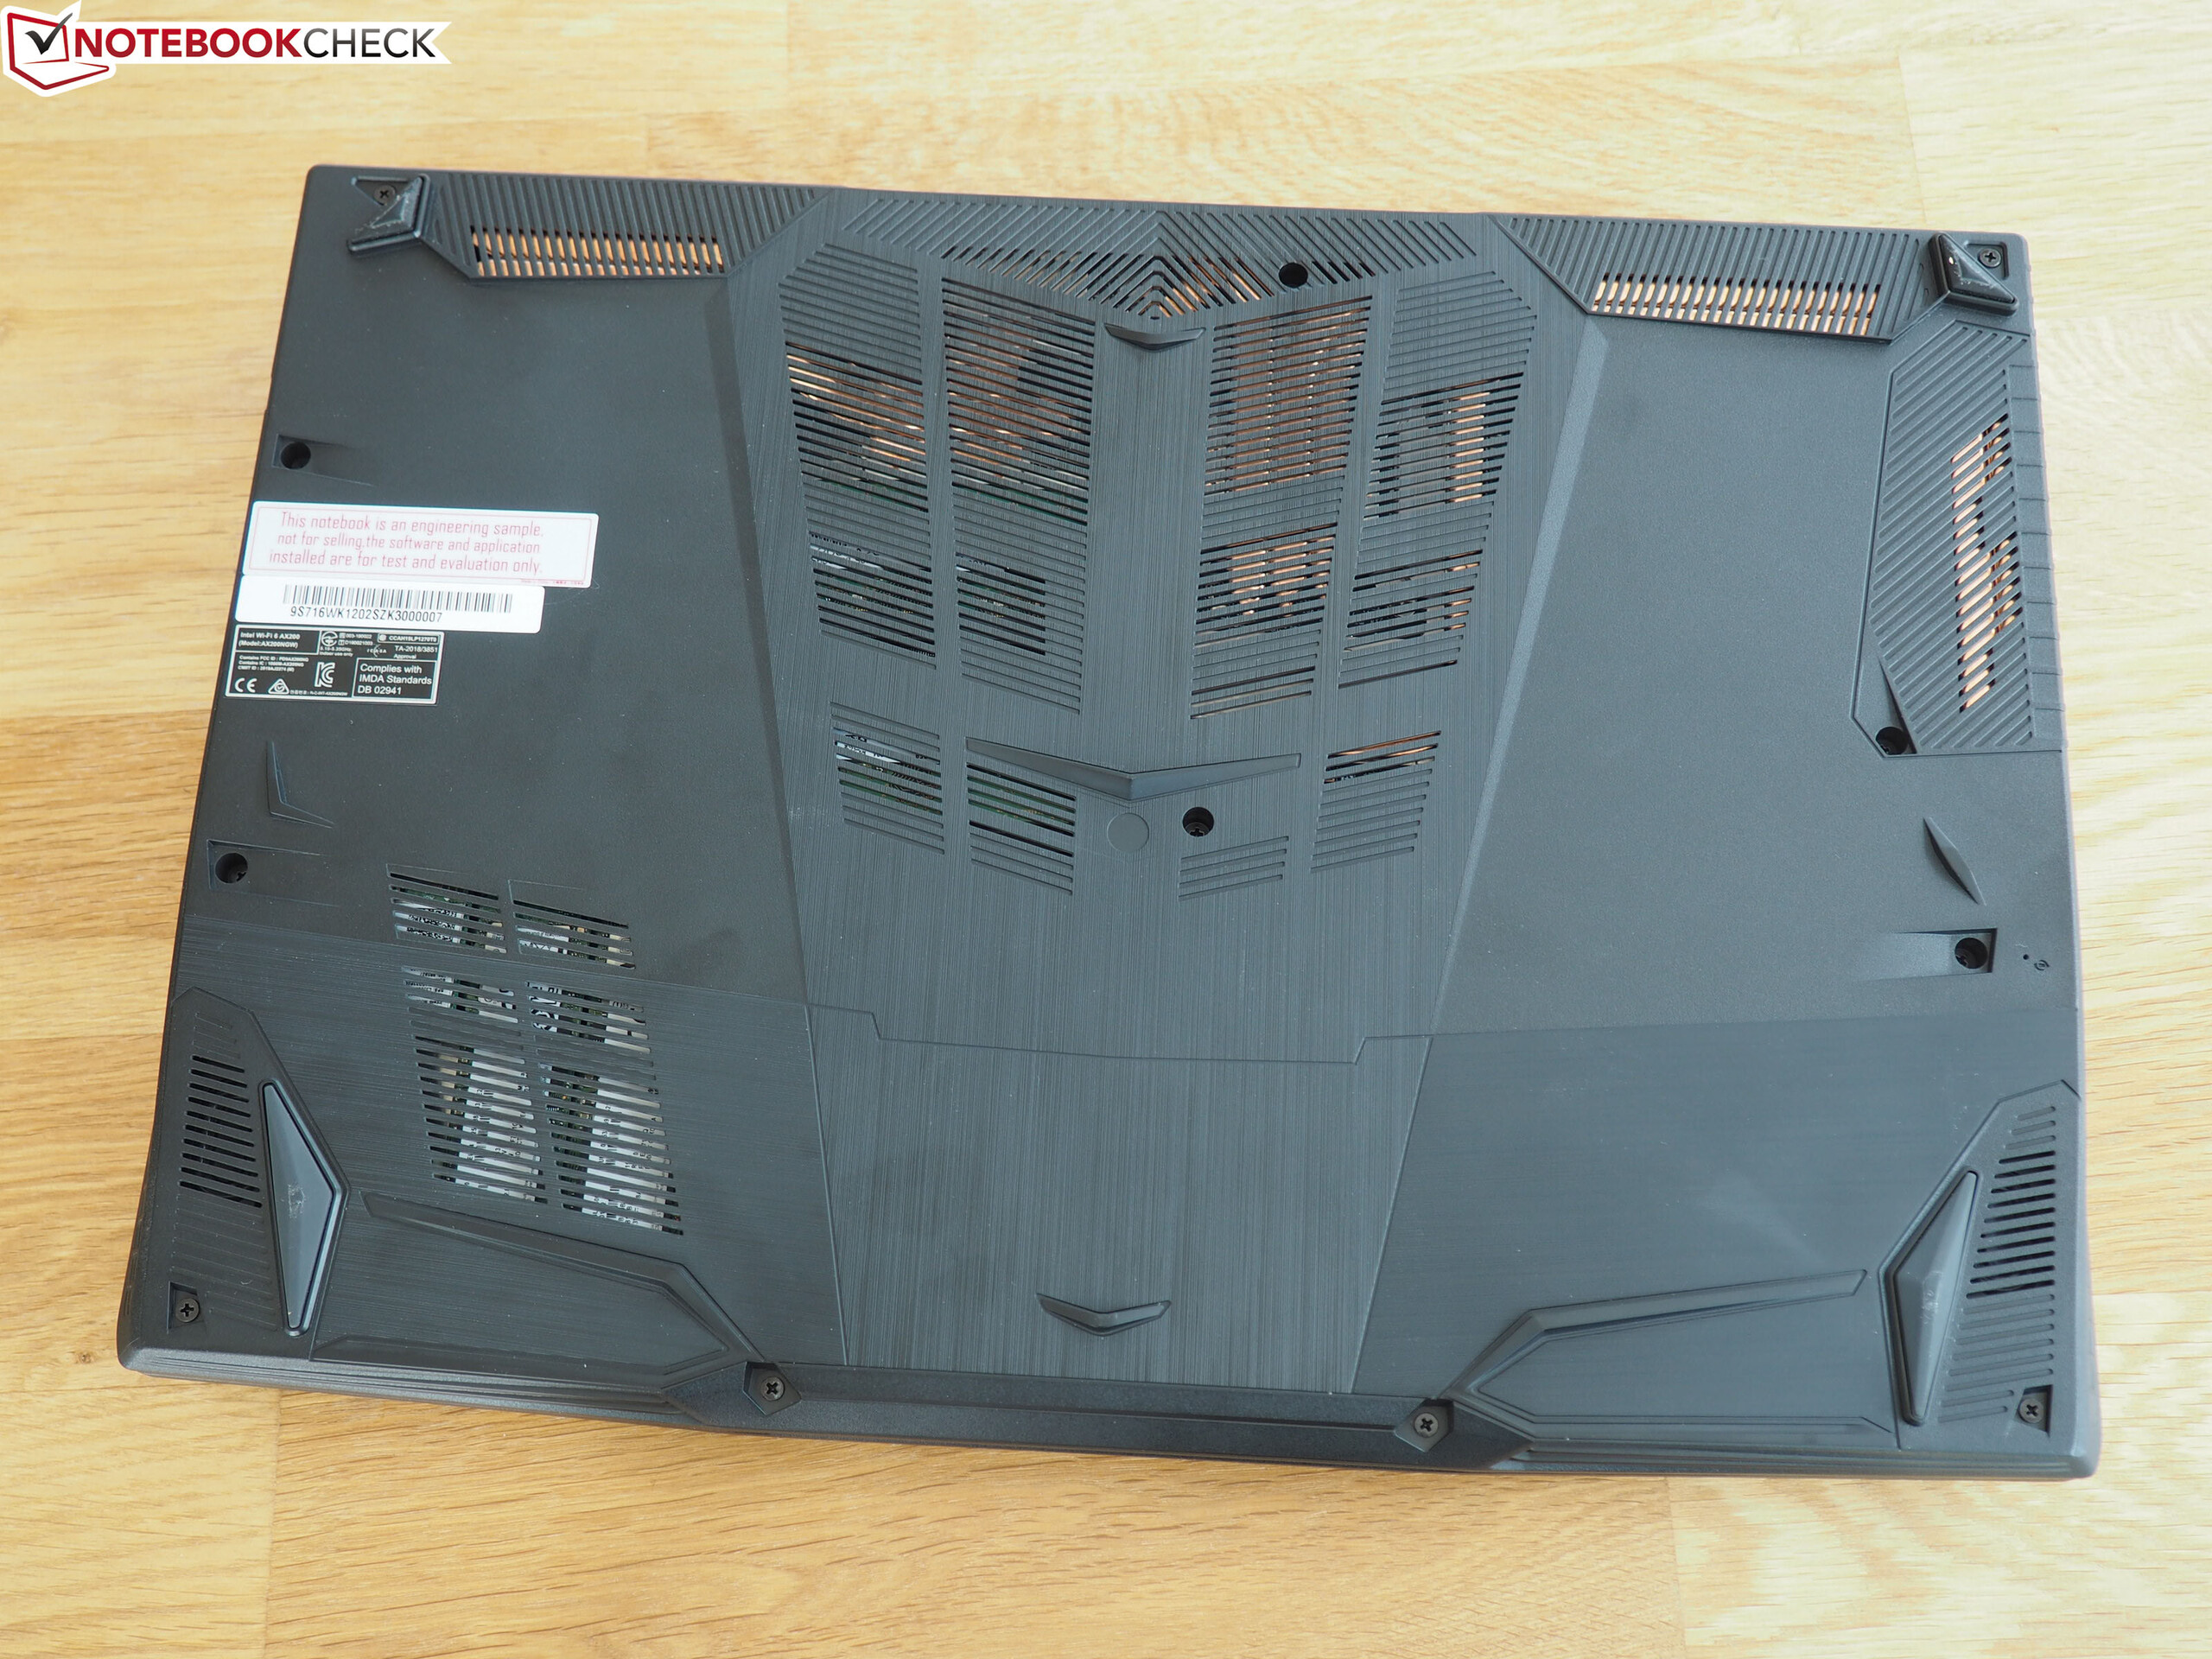
(-) A temperatura máxima no lado superior é 51 °C / 124 F, em comparação com a média de 40.4 °C / 105 F , variando de 21.2 a 68.8 °C para a classe Gaming.
(-) A parte inferior aquece até um máximo de 50 °C / 122 F, em comparação com a média de 43.2 °C / 110 F
(+) Em uso inativo, a temperatura média para o lado superior é 29.3 °C / 85 F, em comparação com a média do dispositivo de 33.9 °C / ### class_avg_f### F.
(-) Jogando The Witcher 3, a temperatura média para o lado superior é 41.9 °C / 107 F, em comparação com a média do dispositivo de 33.9 °C / ## #class_avg_f### F.
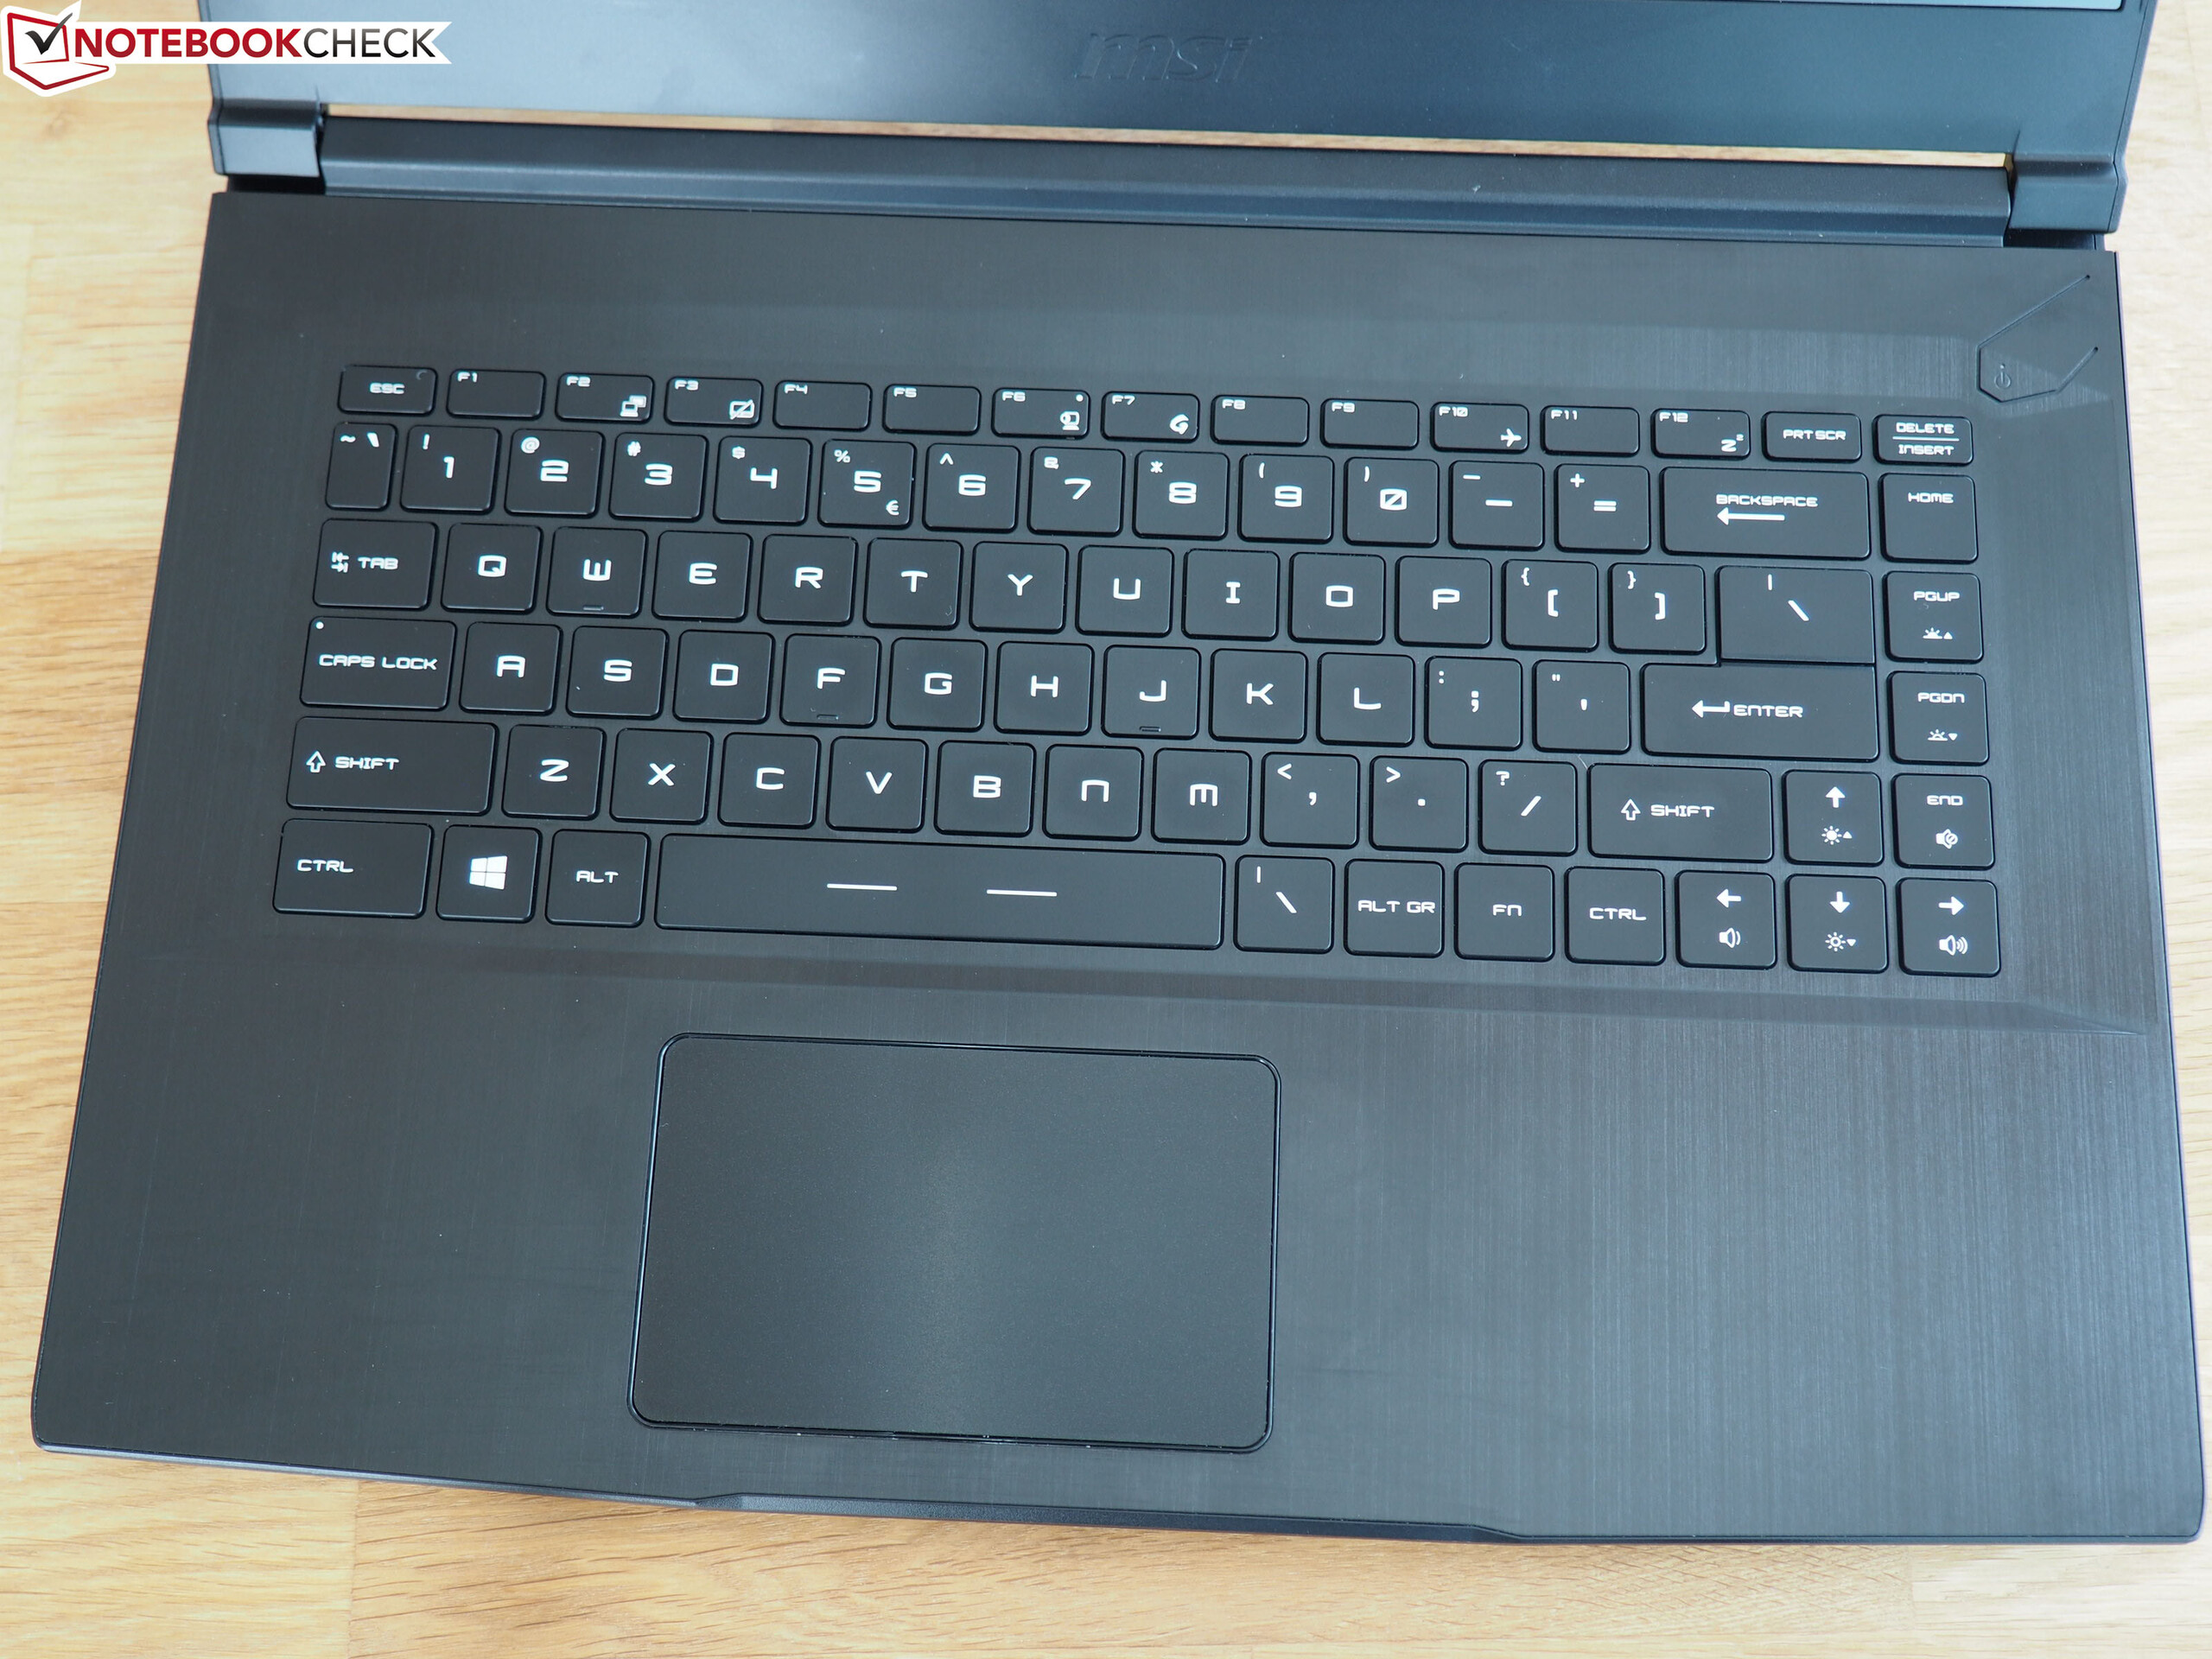
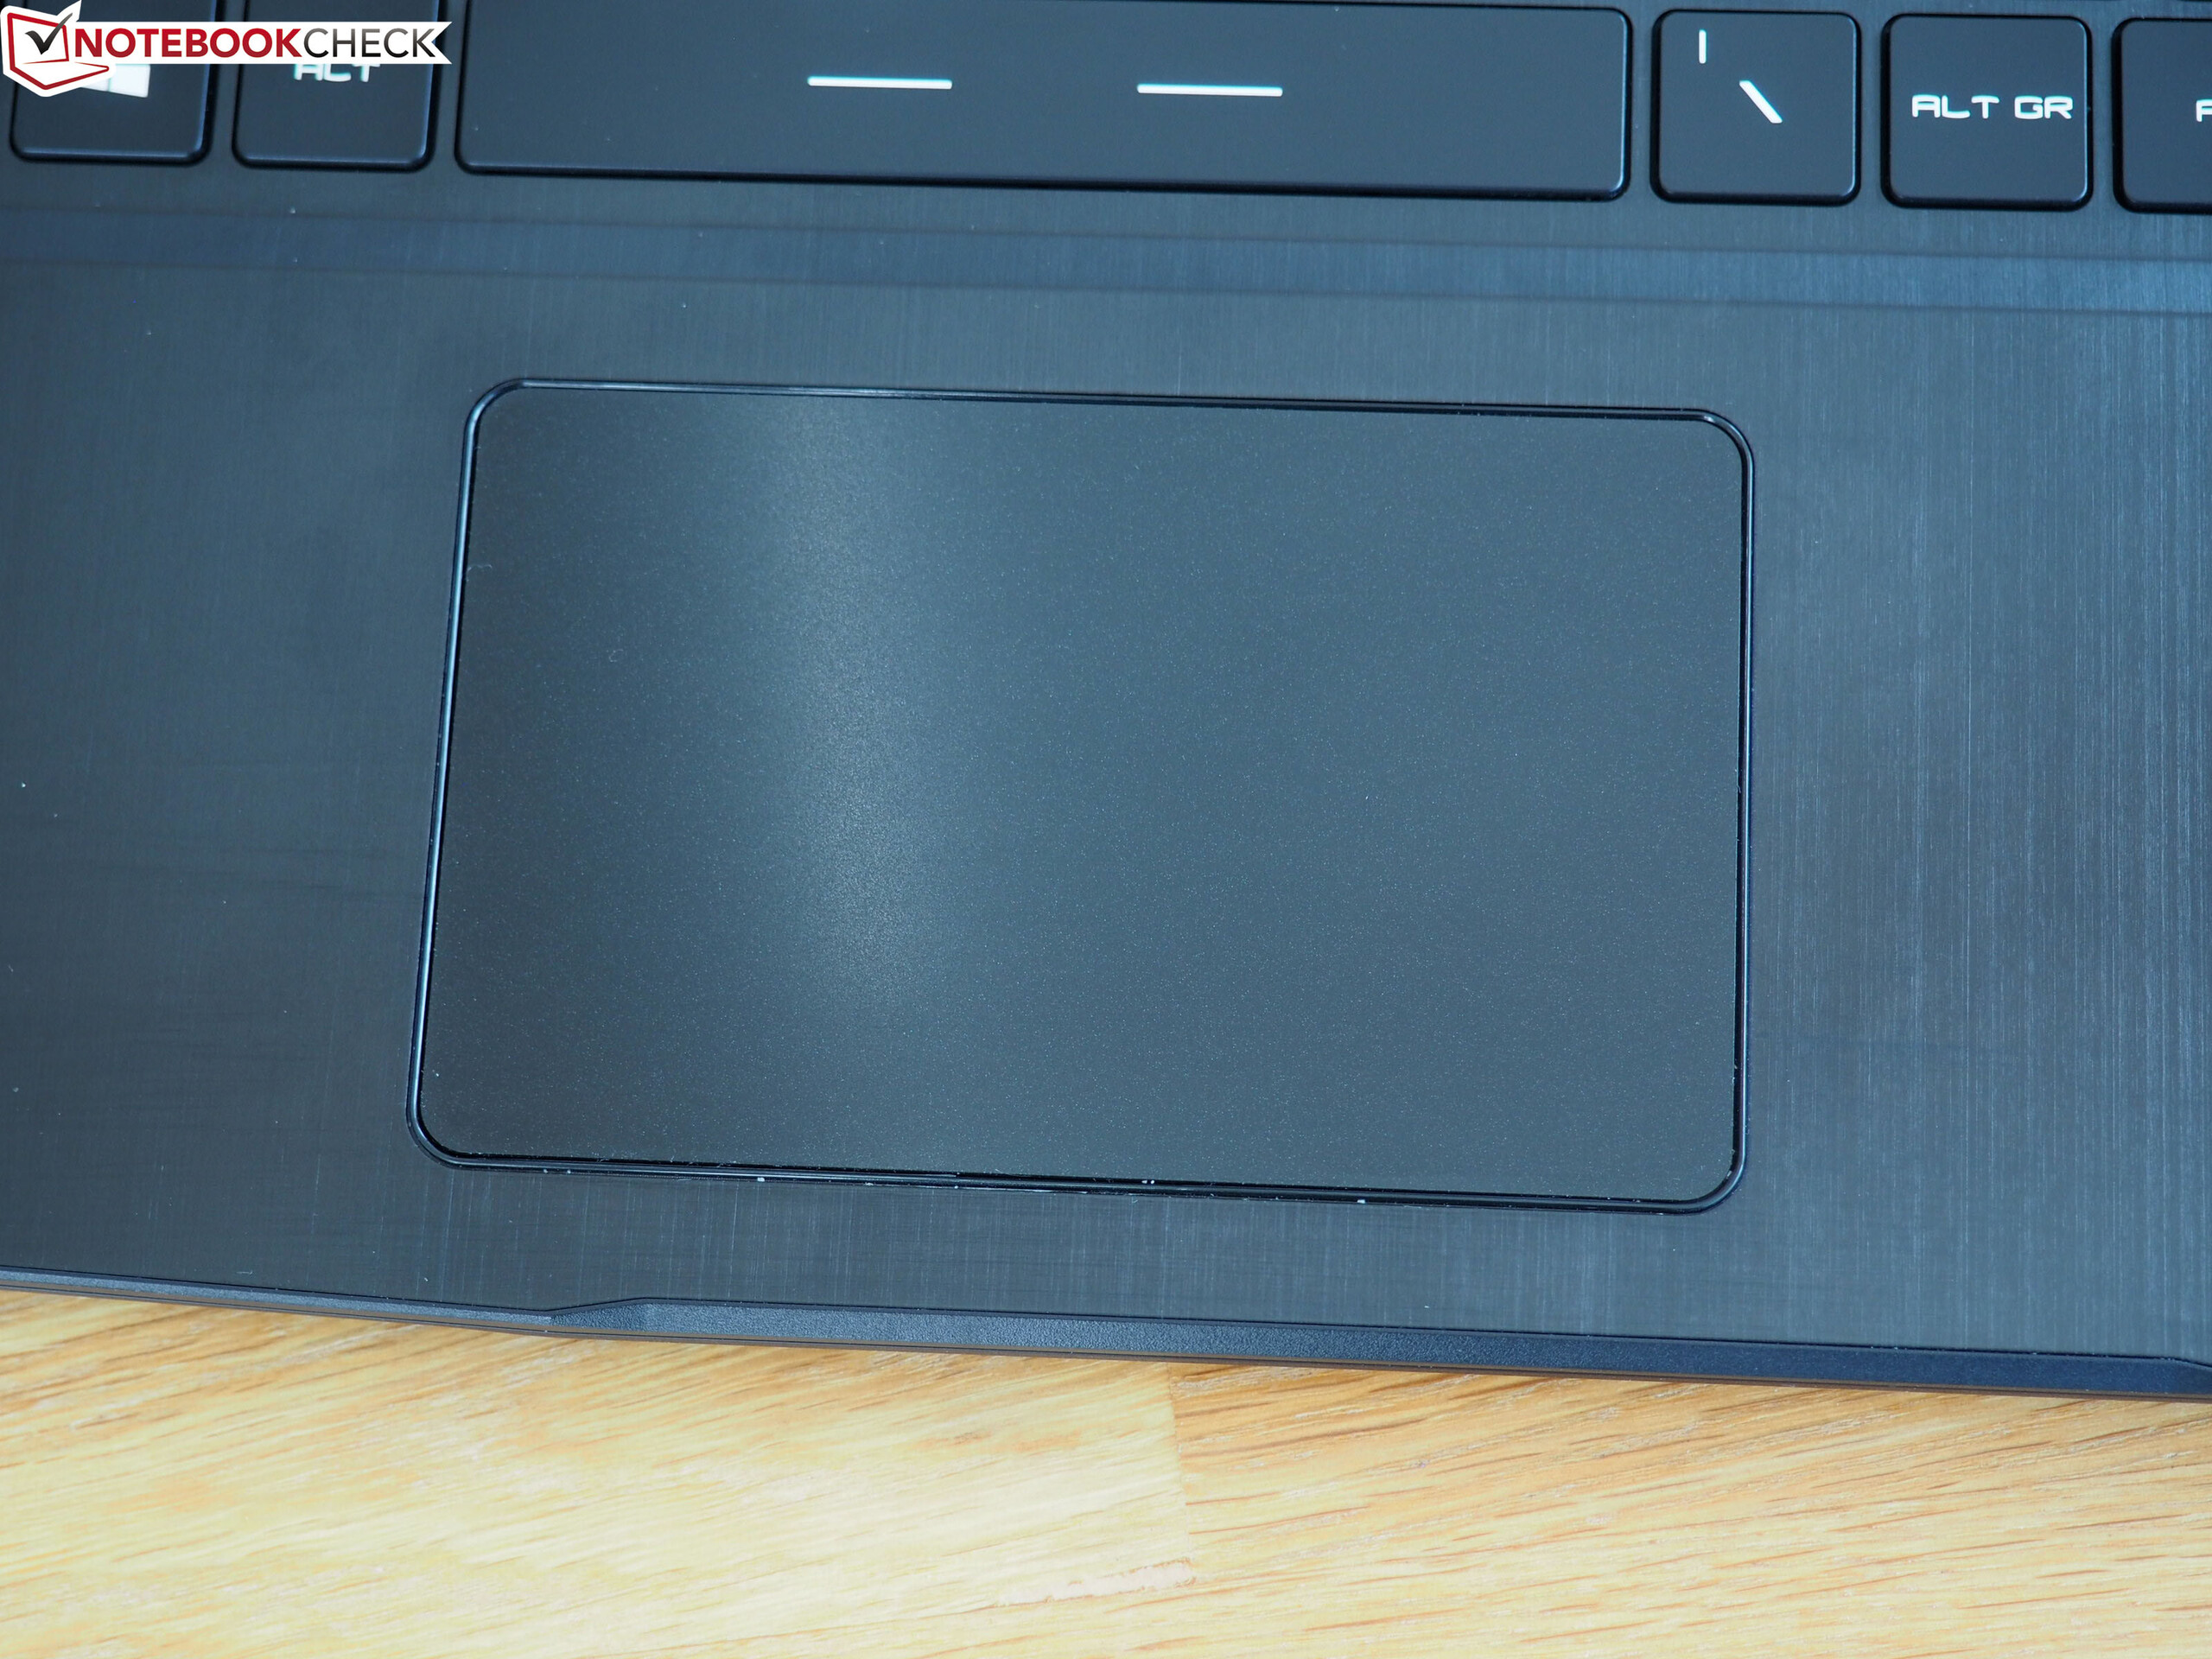
(±) Os apoios para as mãos e o touchpad podem ficar muito quentes ao toque, com um máximo de 36 °C / 96.8 F.
(-) A temperatura média da área do apoio para as mãos de dispositivos semelhantes foi 28.8 °C / 83.8 F (-7.2 °C / -13 F).
| MSI Bravo 15 A4DCR R7 4800H, Radeon RX 5300M | Acer Nitro 5 AN515-44-R5FT R5 4600H, GeForce GTX 1650 Ti Mobile | Asus TUF FX505DT-EB73 R7 3750H, GeForce GTX 1650 Mobile | Dell G5 15 5590-PCNJJ i5-9300H, GeForce GTX 1650 Mobile | HP Omen 15-dc1020ng i5-9300H, GeForce GTX 1650 Mobile | Média da turma Gaming | |
|---|---|---|---|---|---|---|
| Heat | 5% | 3% | 7% | 16% | 0% | |
| Maximum Upper Side * (°C) | 51 | 49 4% | 41.2 19% | 49 4% | 40.3 21% | 45.2 ? 11% |
| Maximum Bottom * (°C) | 50 | 50 -0% | 40 20% | 55 -10% | 48.5 3% | 47.9 ? 4% |
| Idle Upper Side * (°C) | 30 | 28 7% | 34.6 -15% | 25 17% | 23.9 20% | 31.1 ? -4% |
| Idle Bottom * (°C) | 31 | 28 10% | 34.4 -11% | 26 16% | 24.6 21% | 34.2 ? -10% |
* ... menor é melhor
MSI Bravo 15 A4DCR análise de áudio
(+) | os alto-falantes podem tocar relativamente alto (###valor### dB)
Graves 100 - 315Hz
(-) | quase nenhum baixo - em média 19.8% menor que a mediana
(±) | a linearidade dos graves é média (12.7% delta para a frequência anterior)
Médios 400 - 2.000 Hz
(+) | médios equilibrados - apenas 2.7% longe da mediana
(+) | médios são lineares (4.7% delta para frequência anterior)
Altos 2 - 16 kHz
(+) | agudos equilibrados - apenas 2.6% longe da mediana
(+) | os máximos são lineares (5.9% delta da frequência anterior)
Geral 100 - 16.000 Hz
(+) | o som geral é linear (14.6% diferença em relação à mediana)
Comparado com a mesma classe
» 28% de todos os dispositivos testados nesta classe foram melhores, 7% semelhantes, 65% piores
» O melhor teve um delta de 6%, a média foi 18%, o pior foi 132%
Comparado com todos os dispositivos testados
» 19% de todos os dispositivos testados foram melhores, 4% semelhantes, 77% piores
» O melhor teve um delta de 4%, a média foi 24%, o pior foi 134%
Acer Nitro 5 AN515-44-R5FT análise de áudio
(±) | o volume do alto-falante é médio, mas bom (###valor### dB)
Graves 100 - 315Hz
(-) | quase nenhum baixo - em média 24% menor que a mediana
(±) | a linearidade dos graves é média (11% delta para a frequência anterior)
Médios 400 - 2.000 Hz
(±) | médios mais altos - em média 5% maior que a mediana
(+) | médios são lineares (6.9% delta para frequência anterior)
Altos 2 - 16 kHz
(+) | agudos equilibrados - apenas 2.3% longe da mediana
(+) | os máximos são lineares (3.7% delta da frequência anterior)
Geral 100 - 16.000 Hz
(±) | a linearidade do som geral é média (21.5% diferença em relação à mediana)
Comparado com a mesma classe
» 77% de todos os dispositivos testados nesta classe foram melhores, 5% semelhantes, 18% piores
» O melhor teve um delta de 6%, a média foi 18%, o pior foi 132%
Comparado com todos os dispositivos testados
» 61% de todos os dispositivos testados foram melhores, 7% semelhantes, 33% piores
» O melhor teve um delta de 4%, a média foi 24%, o pior foi 134%
| desligado | |
| Ocioso | |
| Carga |
|
Key:
min: | |
| MSI Bravo 15 A4DCR R7 4800H, Radeon RX 5300M | Acer Nitro 5 AN515-44-R5FT R5 4600H, GeForce GTX 1650 Ti Mobile | Asus TUF FX505DT-EB73 R7 3750H, GeForce GTX 1650 Mobile | Dell G5 15 5590-PCNJJ i5-9300H, GeForce GTX 1650 Mobile | HP Omen 15-dc1020ng i5-9300H, GeForce GTX 1650 Mobile | Média da turma Gaming | |
|---|---|---|---|---|---|---|
| Power Consumption | 33% | 25% | 28% | 29% | -32% | |
| Idle Minimum * (Watt) | 11 | 5 55% | 7 36% | 4 64% | 4.04 63% | 13.2 ? -20% |
| Idle Average * (Watt) | 14 | 8 43% | 9.9 29% | 7 50% | 7.2 49% | 18.9 ? -35% |
| Idle Maximum * (Watt) | 25 | 13 48% | 12 52% | 12 52% | 11.4 54% | 24.3 ? 3% |
| Load Average * (Watt) | 72 | 69 4% | 68.4 5% | 95 -32% | 80.8 -12% | 108.3 ? -50% |
| Witcher 3 ultra * (Watt) | 100 | 78 22% | 94.9 5% | 86 14% | 93.6 6% | |
| Load Maximum * (Watt) | 163 | 124 24% | 130.9 20% | 135 17% | 144.5 11% | 254 ? -56% |
* ... menor é melhor
| MSI Bravo 15 A4DCR R7 4800H, Radeon RX 5300M, 51 Wh | Acer Nitro 5 AN515-44-R5FT R5 4600H, GeForce GTX 1650 Ti Mobile, 57.48 Wh | Asus TUF FX505DT-EB73 R7 3750H, GeForce GTX 1650 Mobile, 48 Wh | Dell G5 15 5590-PCNJJ i5-9300H, GeForce GTX 1650 Mobile, 60 Wh | HP Omen 15-dc1020ng i5-9300H, GeForce GTX 1650 Mobile, 52.5 Wh | Média da turma Gaming | |
|---|---|---|---|---|---|---|
| Duração da bateria | 82% | 28% | 110% | 67% | 48% | |
| Reader / Idle (h) | 7 | 13.8 97% | 7.8 11% | 14.5 107% | 15.9 127% | 8.71 ? 24% |
| WiFi v1.3 (h) | 4.5 | 8.7 93% | 4.8 7% | 8 78% | 6.4 42% | 7.04 ? 56% |
| Load (h) | 0.9 | 1.4 56% | 1.5 67% | 2.2 144% | 1.2 33% | 1.47 ? 63% |
| H.264 (h) | 8 | 8.26 ? | ||||
| Witcher 3 ultra (h) | 1 |
Pro
Contra
Os fãs de chips AMD ficarão (muito) satisfeitos com o Bravo 15.
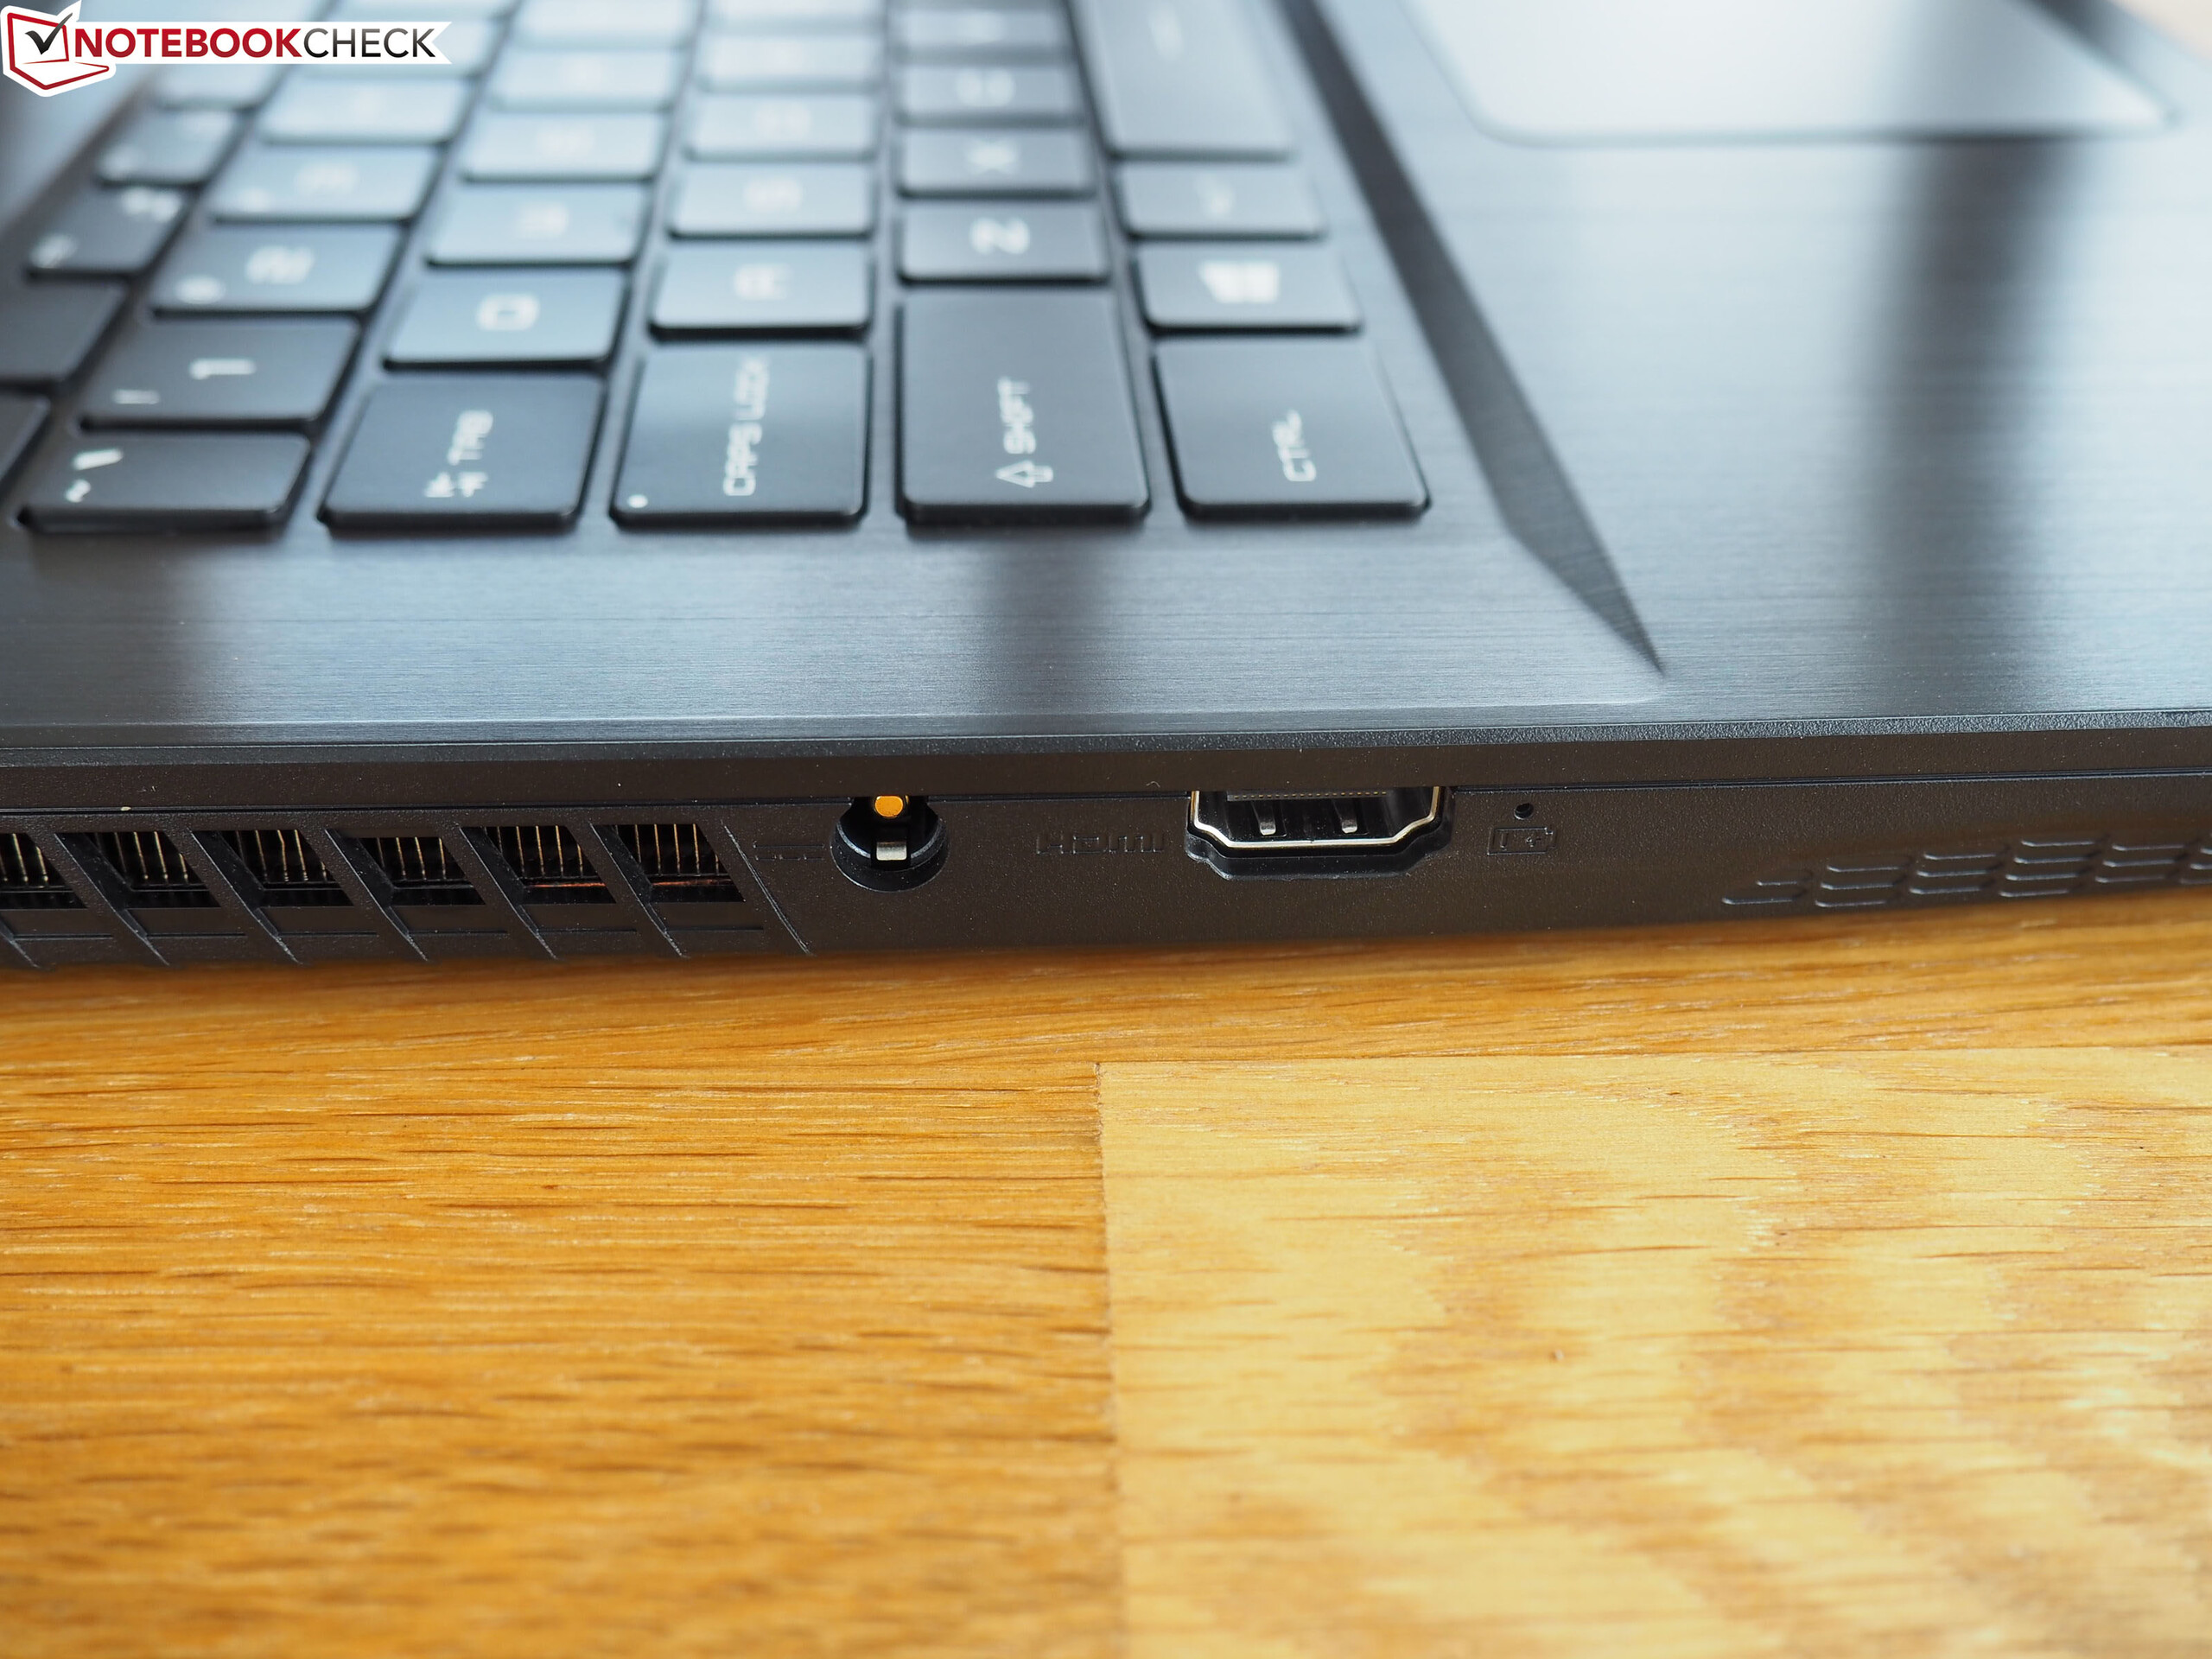
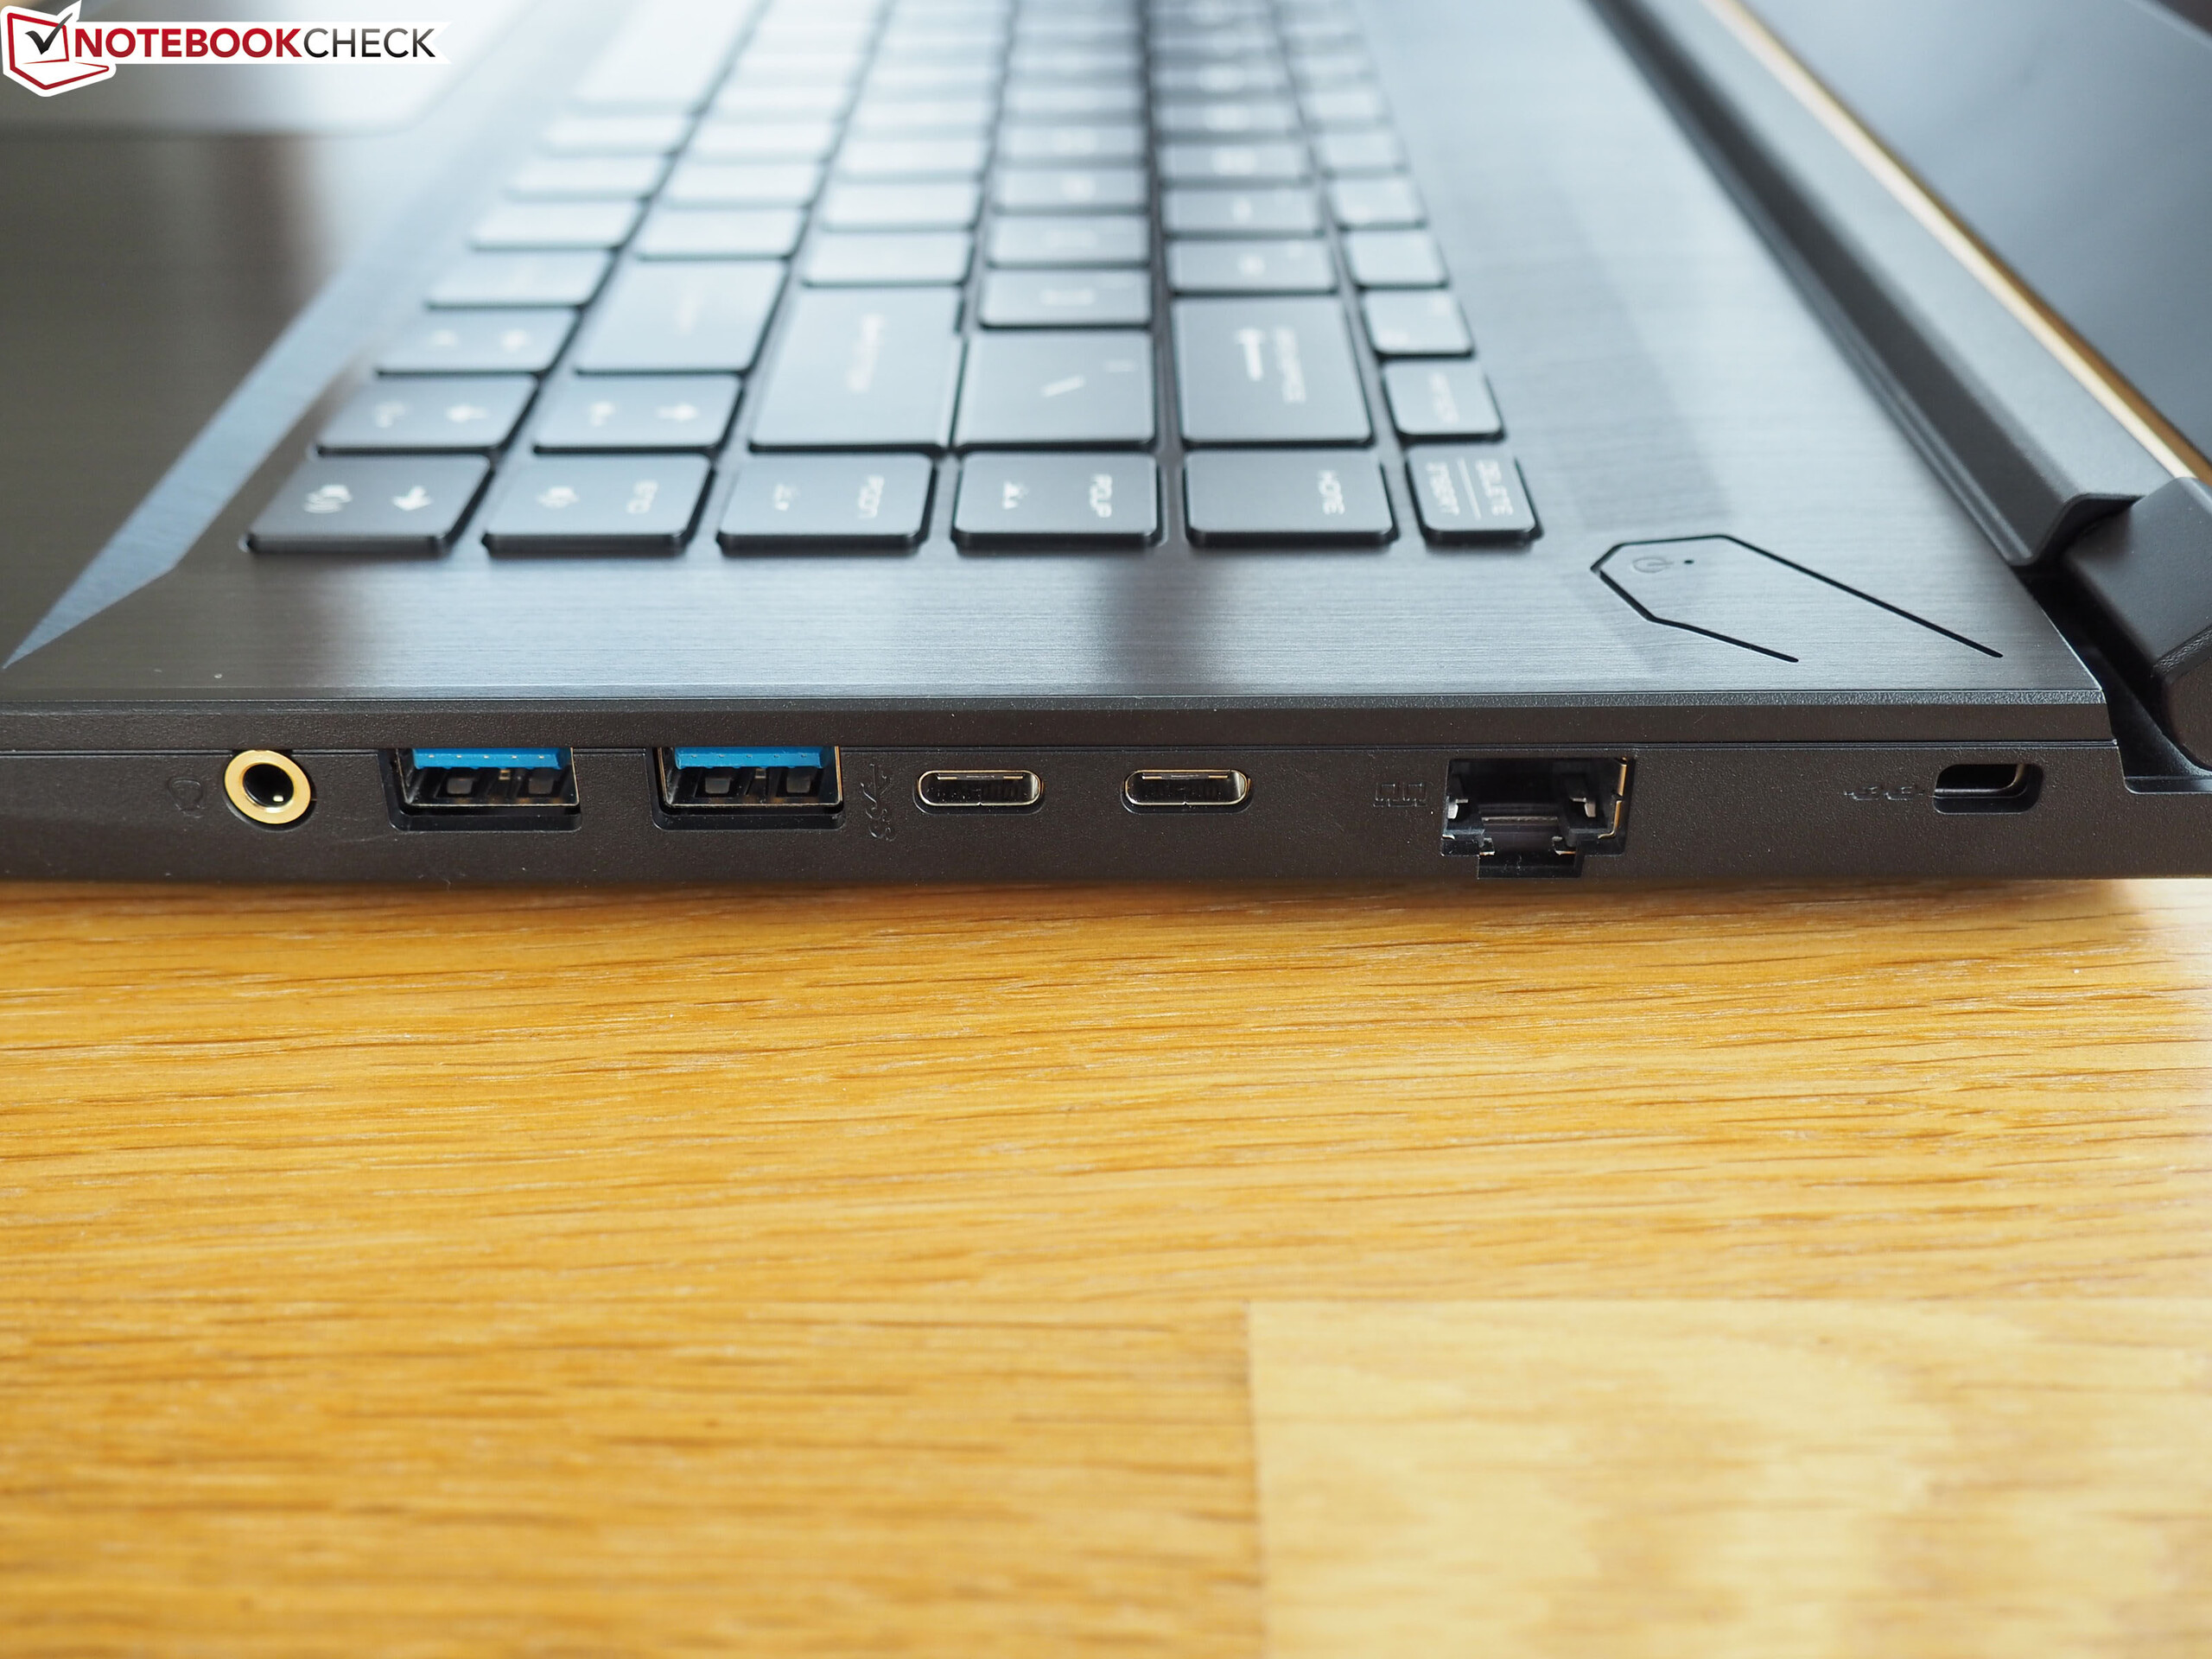
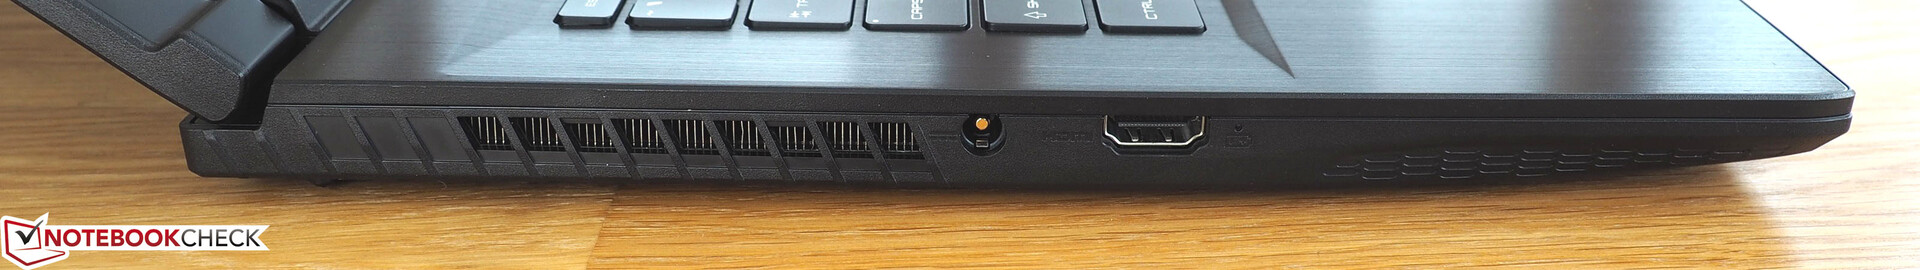
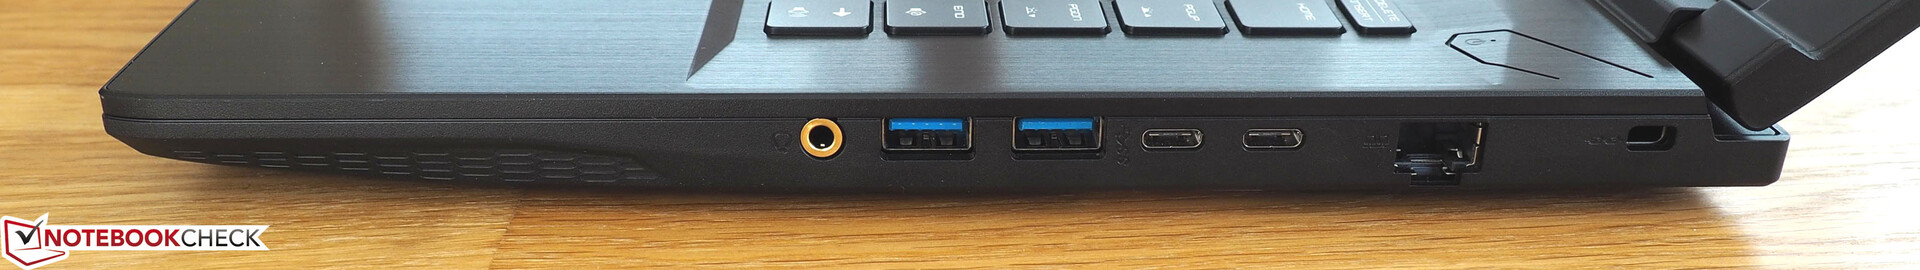
Se você deixar de lado a escassa seleção de portas, a duração bastante curta da bateria e o alto nível de ruído durante os aplicativos 3D, o Bravo 15 é um pacote atraente para jogadores sensíveis ao preço que estabelece novos padrões para o desempenho da CPU na faixa de US$ 1.000. O Ryzen 7 4800H oferece muita potência e está preparado para o futuro. A tela de 144-Hz é satisfatória em grande medida.
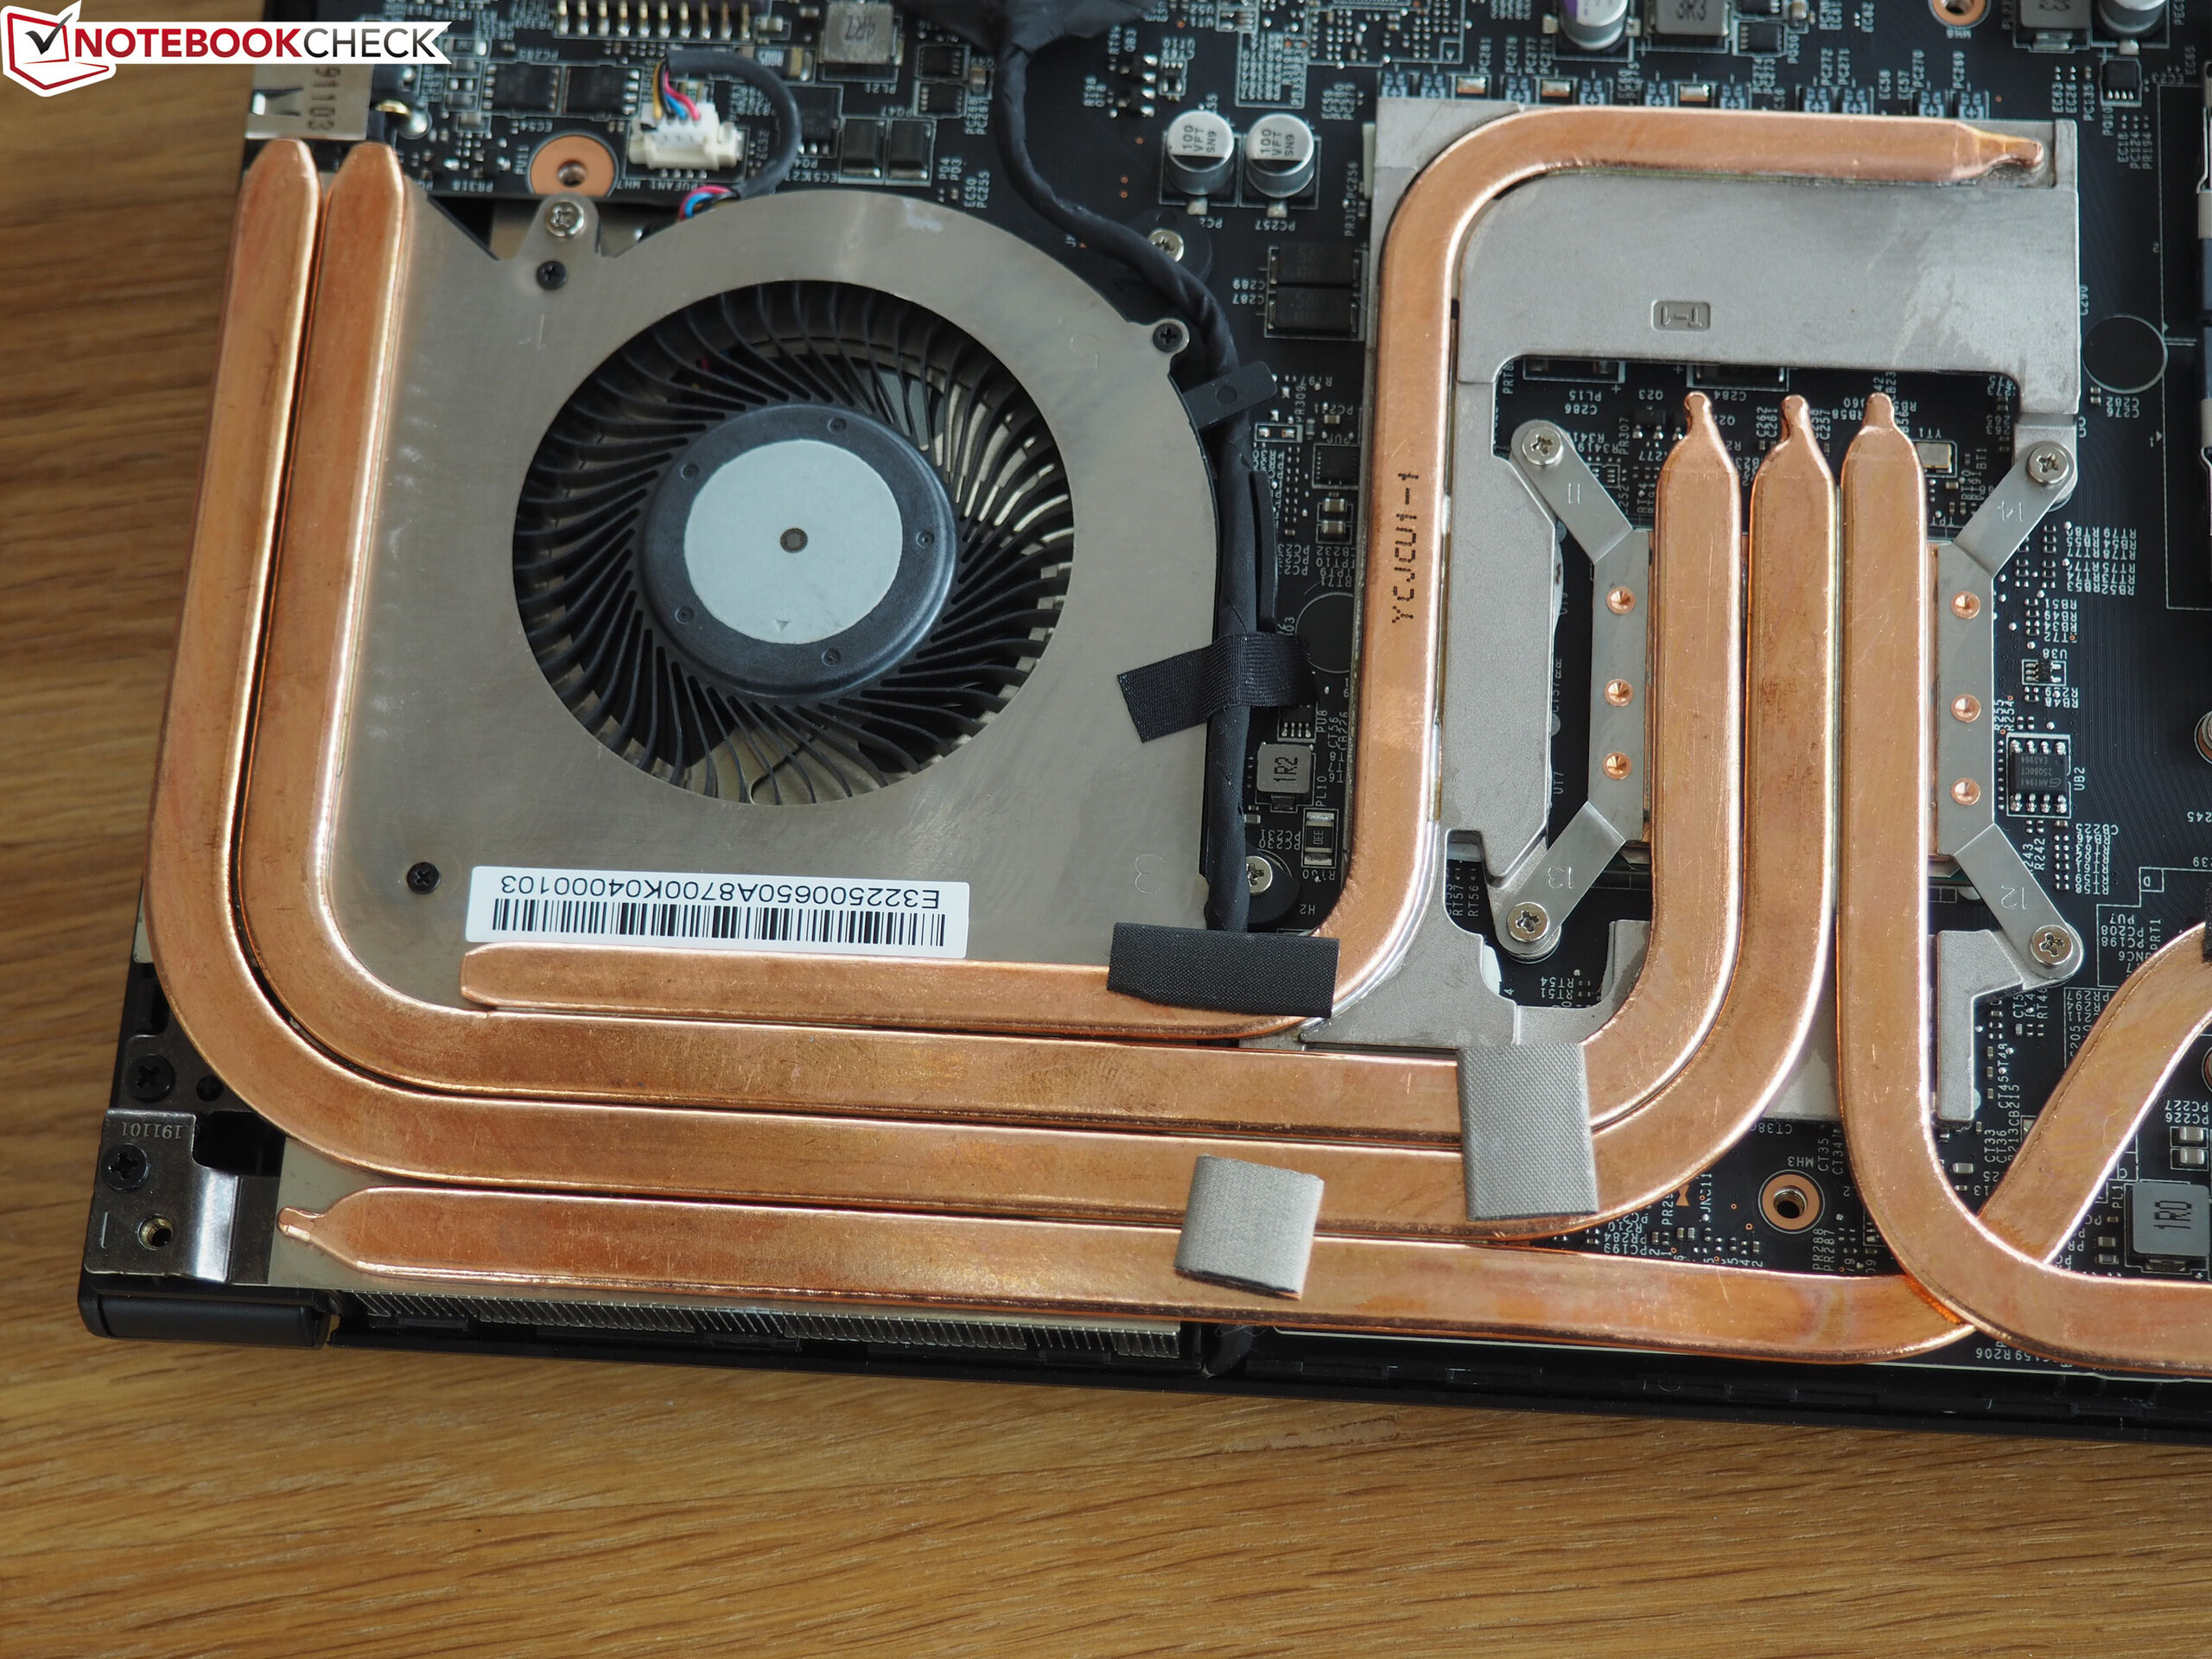
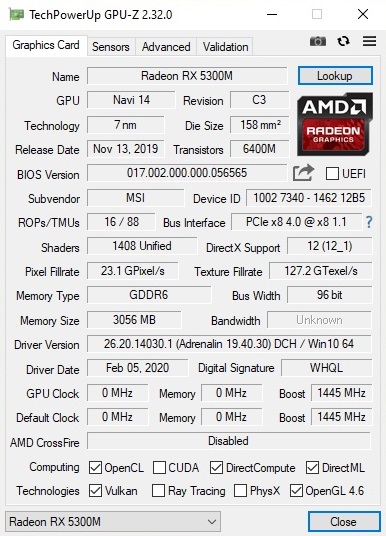
No entanto, recomendamos que os possíveis compradores escolham a configuração com o Radeon RX 5500M devido à memória de vídeo limtada do Radeon RX 5300M (4 GB em vez de 3 GB GDDR6). A vantagem que traz aos usuários definitivamente vale a pena.
MSI Bravo 15 A4DCR
- 07/07/2020 v7 (old)
Florian Glaser
Price comparison