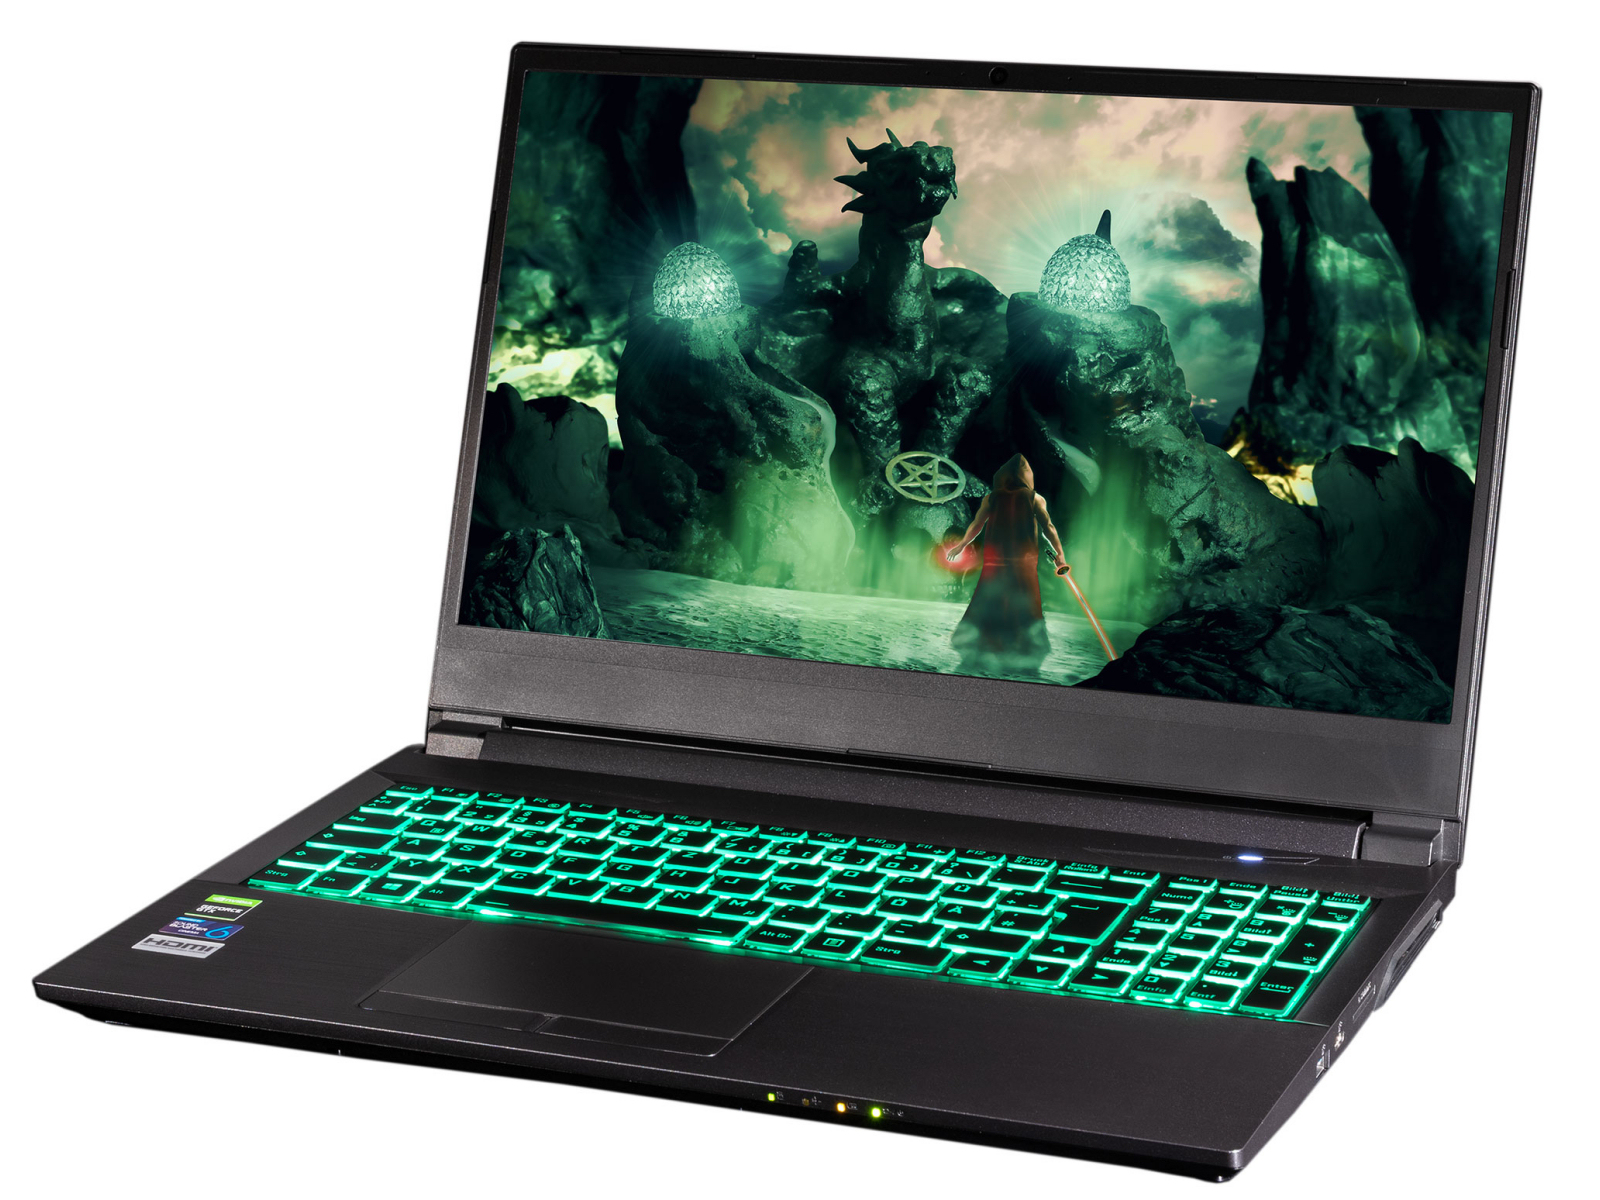
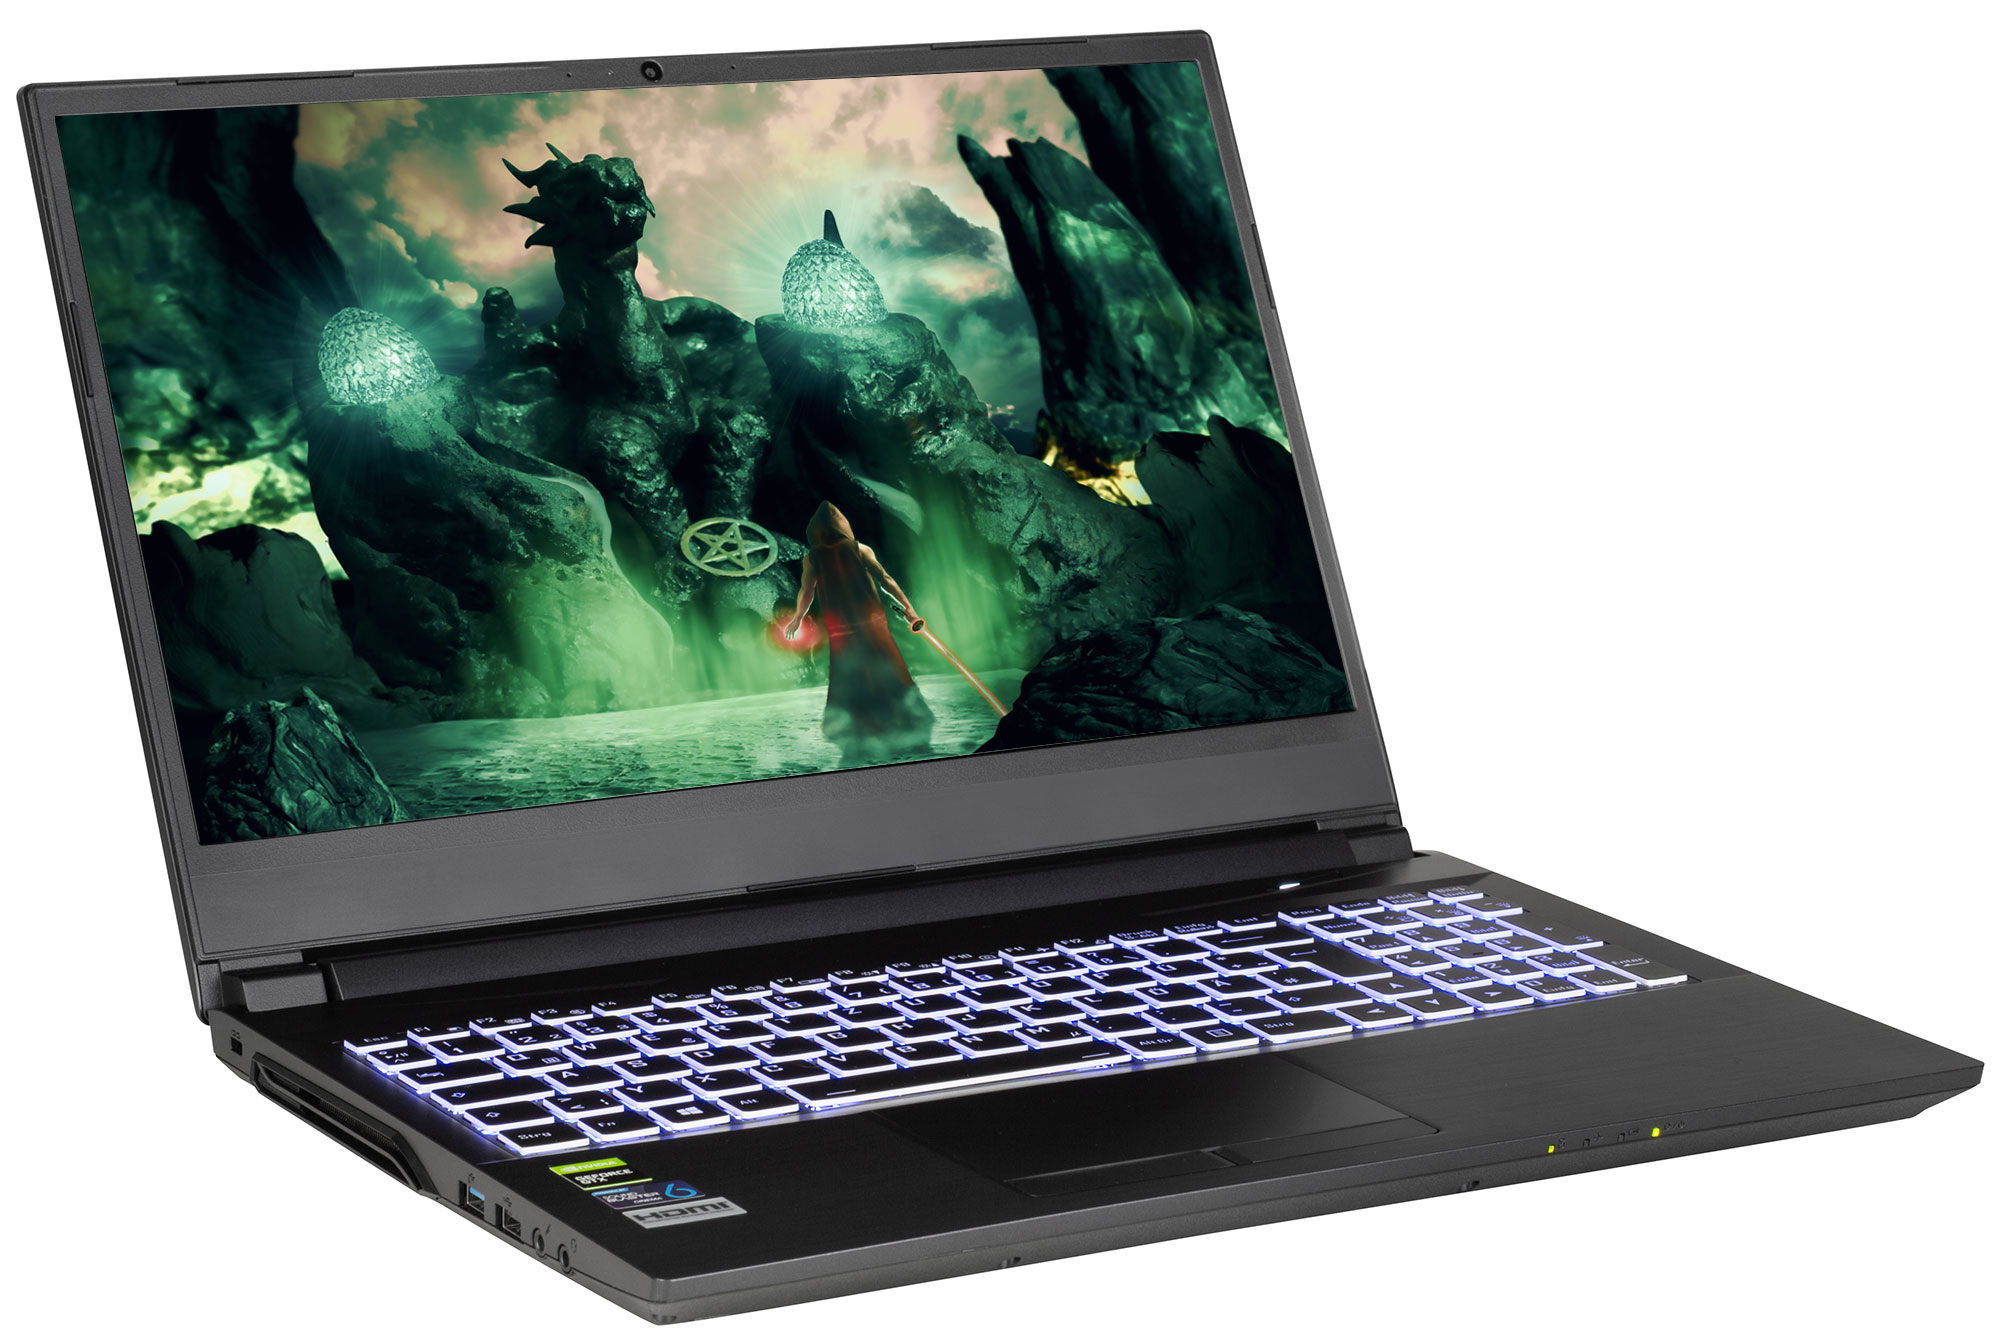
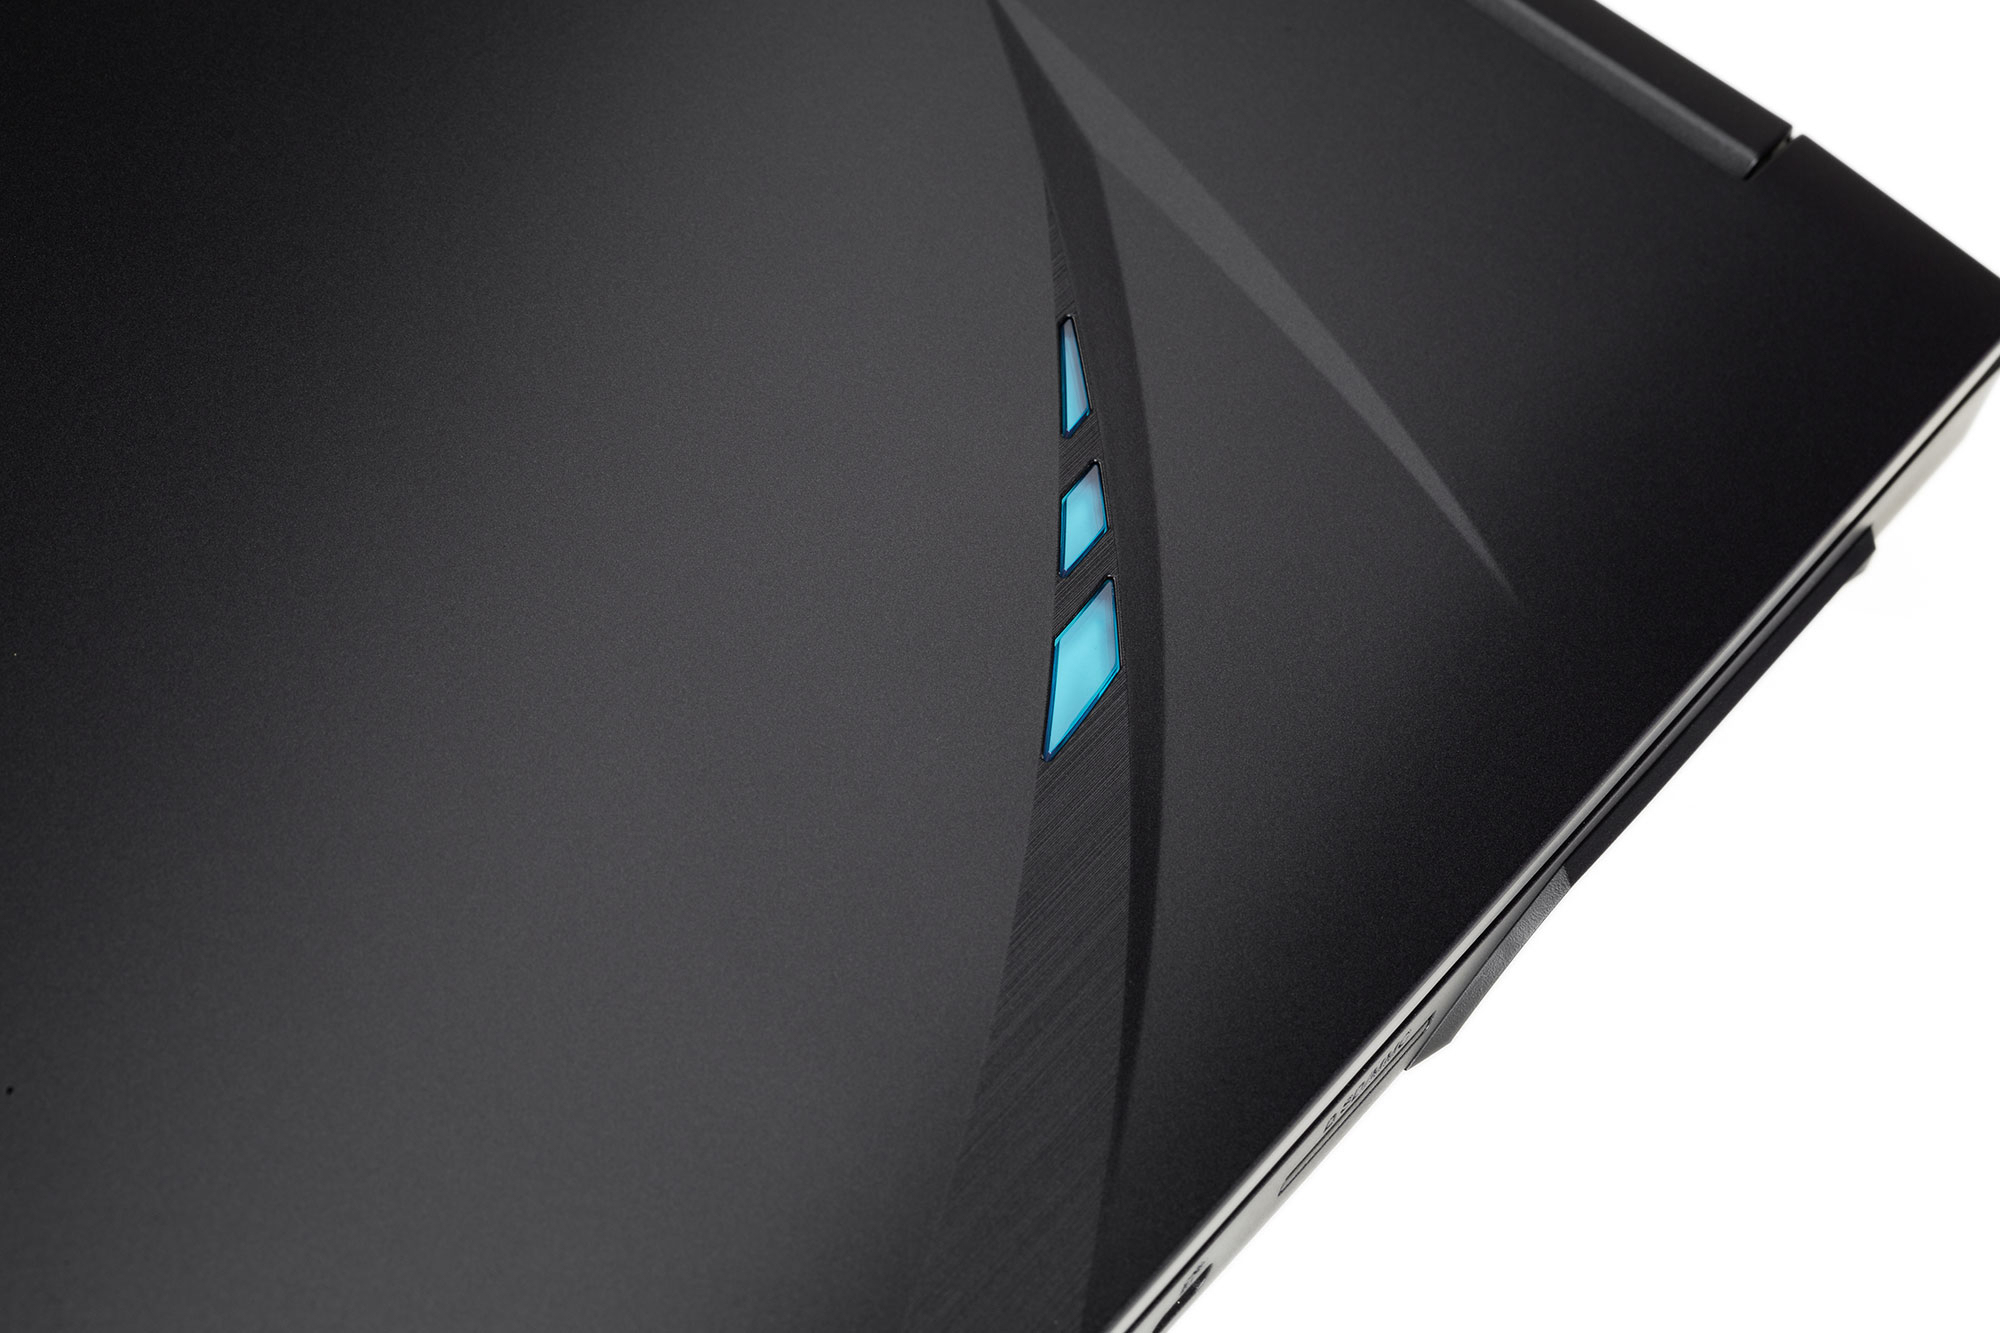
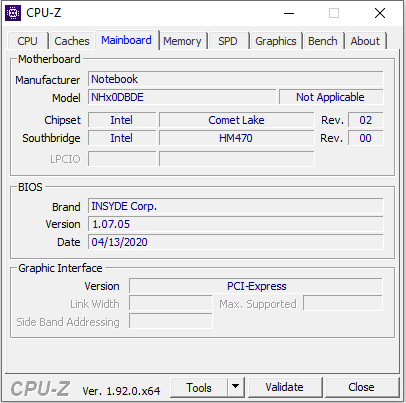
Nexoc GH5 515IG (Clevo NH50DB): Portátil básico para jogos que oferece espaço para três unidades de armazenamento
Avaliação | Data | Modelo | Peso | Altura | Size | Resolução | Preço |
|---|---|---|---|---|---|---|---|
| 81.2 % v7 (old) | 08/2020 | Nexoc GH5 515IG i5-10300H, GeForce GTX 1650 Mobile | 2.1 kg | 24.9 mm | 15.60" | 1920x1080 | |
| 78.4 % v7 (old) | 07/2020 | Lenovo IdeaPad Gaming 3i 15IMH05 i5-10300H, GeForce GTX 1650 Mobile | 2.2 kg | 24.9 mm | 15.60" | 1920x1080 | |
| 80.4 % v6 (old) | 07/2019 | Asus TUF FX505DT-EB73 R7 3750H, GeForce GTX 1650 Mobile | 2.2 kg | 26.8 mm | 15.60" | 1920x1080 | |
| 79.3 % v7 (old) | 10/2019 | Dell G3 3590 i5-9300H, GeForce GTX 1650 Mobile | 2.5 kg | 21.6 mm | 15.60" | 1920x1080 | |
| 75.4 % v7 (old) | HP Pavilion Gaming 15-ec0002ng R5 3550H, GeForce GTX 1050 Mobile | 2.3 kg | 23.5 mm | 15.60" | 1920x1080 | ||
| 79.8 % v7 (old) | 07/2020 | Acer Nitro 5 AN515-44-R5FT R5 4600H, GeForce GTX 1650 Ti Mobile | 2.2 kg | 24 mm | 15.60" | 1920x1080 | |
| 79.5 % v7 (old) | 07/2020 | MSI Bravo 15 A4DCR R7 4800H, Radeon RX 5300M | 2 kg | 22 mm | 15.60" | 1920x1080 |
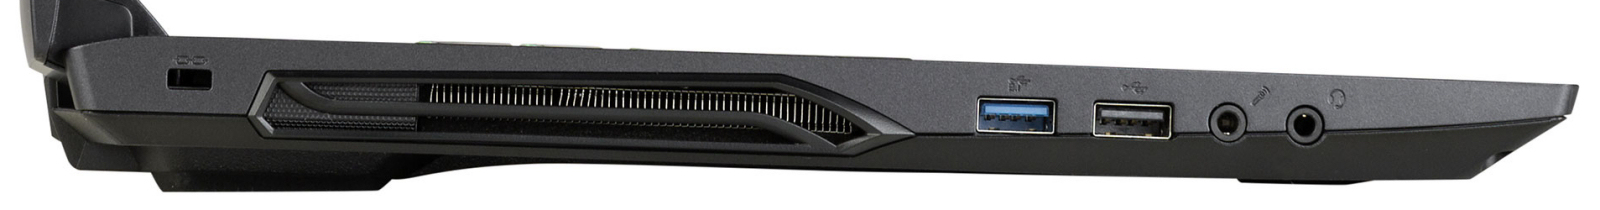
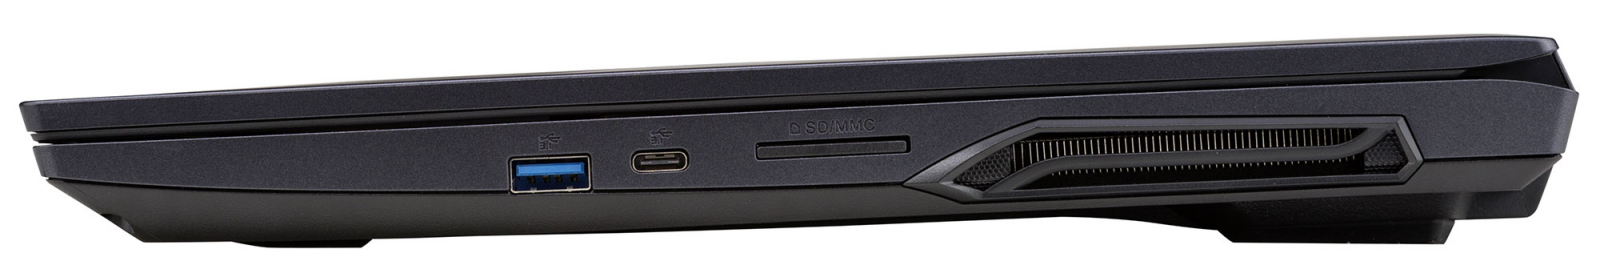
| SD Card Reader | |
| average JPG Copy Test (av. of 3 runs) | |
| Média da turma Gaming (20.9 - 210, n=55, últimos 2 anos) | |
| Nexoc GH5 515IG (Toshiba Exceria Pro SDXC 64 GB UHS-II) | |
| HP Pavilion Gaming 15-ec0002ng (Toshiba Exceria Pro SDXC 64 GB UHS-II) | |
| Dell G3 3590 (Toshiba Exceria Pro SDXC 64 GB UHS-II) | |
| maximum AS SSD Seq Read Test (1GB) | |
| Média da turma Gaming (25.5 - 261, n=52, últimos 2 anos) | |
| Nexoc GH5 515IG (Toshiba Exceria Pro SDXC 64 GB UHS-II) | |
| HP Pavilion Gaming 15-ec0002ng (Toshiba Exceria Pro SDXC 64 GB UHS-II) | |
| Dell G3 3590 (Toshiba Exceria Pro SDXC 64 GB UHS-II) | |
| Networking | |
| iperf3 transmit AX12 | |
| Nexoc GH5 515IG | |
| Acer Nitro 5 AN515-44-R5FT | |
| MSI Bravo 15 A4DCR | |
| HP Pavilion Gaming 15-ec0002ng | |
| Lenovo IdeaPad Gaming 3i 15IMH05 | |
| Asus TUF FX505DT-EB73 | |
| Dell G3 3590 | |
| iperf3 receive AX12 | |
| Nexoc GH5 515IG | |
| Acer Nitro 5 AN515-44-R5FT | |
| MSI Bravo 15 A4DCR | |
| Lenovo IdeaPad Gaming 3i 15IMH05 | |
| HP Pavilion Gaming 15-ec0002ng | |
| Asus TUF FX505DT-EB73 | |
| Dell G3 3590 | |


| |||||||||||||||||||||||||
iluminação: 93 %
iluminação com acumulador: 261 cd/m²
Contraste: 1135:1 (Preto: 0.23 cd/m²)
ΔE ColorChecker Calman: 4.71 | ∀{0.5-29.43 Ø4.73}
calibrated: 3.67
ΔE Greyscale Calman: 2.76 | ∀{0.09-98 Ø4.97}
56% sRGB (Argyll 1.6.3 3D)
36% AdobeRGB 1998 (Argyll 1.6.3 3D)
39.19% AdobeRGB 1998 (Argyll 3D)
57% sRGB (Argyll 3D)
37.91% Display P3 (Argyll 3D)
Gamma: 2.42
CCT: 7090 K
| Nexoc GH5 515IG LG Philips LP156WFC-SPD1, IPS, 1920x1080, 15.6" | Lenovo IdeaPad Gaming 3i 15IMH05 BOE CQ NV156FHM-NX1, IPS, 1920x1080, 15.6" | Asus TUF FX505DT-EB73 Panda LM156LF-GL, IPS, 1920x1080, 15.6" | Dell G3 3590 BOE NV15N3D, IPS, 1920x1080, 15.6" | HP Pavilion Gaming 15-ec0002ng Chi Mei N156HGA-EA3, TN LED, 1920x1080, 15.6" | Acer Nitro 5 AN515-44-R5FT Panda LM156LF-2F01 (NCP004D), IPS, 1920x1080, 15.6" | MSI Bravo 15 A4DCR AU Optronics B156HAN08.0 (AUO80ED), IPS-Level, 1920x1080, 15.6" | |
|---|---|---|---|---|---|---|---|
| Display | -0% | 4% | 6% | 9% | 9% | 59% | |
| Display P3 Coverage (%) | 37.91 | 38.04 0% | 39.56 4% | 40.13 6% | 41.22 9% | 41.16 9% | 62 64% |
| sRGB Coverage (%) | 57 | 56.6 -1% | 59.5 4% | 59.8 5% | 61.8 8% | 61.8 8% | 86.8 52% |
| AdobeRGB 1998 Coverage (%) | 39.19 | 39.3 0% | 40.91 4% | 41.47 6% | 42.62 9% | 42.56 9% | 62.7 60% |
| Response Times | 31% | 2% | -31% | 7% | -18% | 57% | |
| Response Time Grey 50% / Grey 80% * (ms) | 34.8 ? | 25 ? 28% | 30.4 ? 13% | 46 ? -32% | 44 ? -26% | 40.8 ? -17% | 16 ? 54% |
| Response Time Black / White * (ms) | 25.2 ? | 17 ? 33% | 27.6 ? -10% | 32.4 ? -29% | 15 ? 40% | 30 ? -19% | 10.4 ? 59% |
| PWM Frequency (Hz) | 200 ? | 250 ? | |||||
| Screen | -34% | -29% | -24% | -63% | -9% | 5% | |
| Brightness middle (cd/m²) | 261 | 305 17% | 286.2 10% | 276.2 6% | 233 -11% | 287 10% | 311 19% |
| Brightness (cd/m²) | 254 | 294 16% | 267 5% | 261 3% | 211 -17% | 271 7% | 313 23% |
| Brightness Distribution (%) | 93 | 70 -25% | 84 -10% | 86 -8% | 82 -12% | 88 -5% | 88 -5% |
| Black Level * (cd/m²) | 0.23 | 0.405 -76% | 0.33 -43% | 0.24 -4% | 0.405 -76% | 0.25 -9% | 0.43 -87% |
| Contrast (:1) | 1135 | 753 -34% | 867 -24% | 1151 1% | 575 -49% | 1148 1% | 723 -36% |
| Colorchecker dE 2000 * | 4.71 | 6.01 -28% | 5.45 -16% | 5.56 -18% | 8.22 -75% | 4.77 -1% | 4.5 4% |
| Colorchecker dE 2000 max. * | 7.6 | 21.9 -188% | 18.08 -138% | 23.45 -209% | 18.6 -145% | 17.15 -126% | 7.97 -5% |
| Colorchecker dE 2000 calibrated * | 3.67 | 5.12 -40% | 4.47 -22% | 5.23 -43% | 3.73 -2% | 2.65 28% | |
| Greyscale dE 2000 * | 2.76 | 3.23 -17% | 5.3 -92% | 2.8 -1% | 10.13 -267% | 2.7 2% | 3.3 -20% |
| Gamma | 2.42 91% | 2.43 91% | 2.1 105% | 2.37 93% | 2.27 97% | 2.115 104% | 2.129 103% |
| CCT | 7090 92% | 6818 95% | 7679 85% | 6710 97% | 11323 57% | 7187 90% | 7227 90% |
| Color Space (Percent of AdobeRGB 1998) (%) | 36 | 36 0% | 37.6 4% | 37.8 5% | 39 8% | 43 19% | 63 75% |
| Color Space (Percent of sRGB) (%) | 56 | 56 0% | 59.1 6% | 59 5% | 62 11% | 61 9% | 86 54% |
| Média Total (Programa/Configurações) | -1% /
-20% | -8% /
-19% | -16% /
-19% | -16% /
-40% | -6% /
-7% | 40% /
21% |
* ... menor é melhor
Exibir tempos de resposta
| ↔ Tempo de resposta preto para branco | ||
|---|---|---|
| 25.2 ms ... ascensão ↗ e queda ↘ combinadas | ↗ 15.2 ms ascensão | 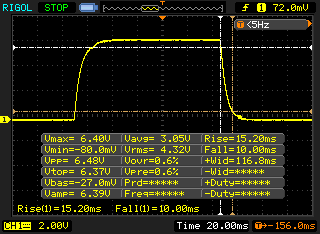 |
| ↘ 10 ms queda | ||
| A tela mostra taxas de resposta relativamente lentas em nossos testes e pode ser muito lenta para os jogadores. Em comparação, todos os dispositivos testados variam de 0.1 (mínimo) a 240 (máximo) ms. » 60 % de todos os dispositivos são melhores. Isso significa que o tempo de resposta medido é pior que a média de todos os dispositivos testados (19.9 ms). | ||
| ↔ Tempo de resposta 50% cinza a 80% cinza | ||
| 34.8 ms ... ascensão ↗ e queda ↘ combinadas | ↗ 17.6 ms ascensão | 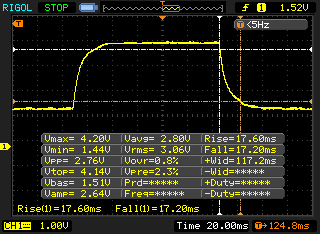 |
| ↘ 17.2 ms queda | ||
| A tela mostra taxas de resposta lentas em nossos testes e será insatisfatória para os jogadores. Em comparação, todos os dispositivos testados variam de 0.165 (mínimo) a 636 (máximo) ms. » 48 % de todos os dispositivos são melhores. Isso significa que o tempo de resposta medido é pior que a média de todos os dispositivos testados (31.1 ms). | ||
Cintilação da tela / PWM (modulação por largura de pulso)
| Tela tremeluzindo / PWM não detectado | 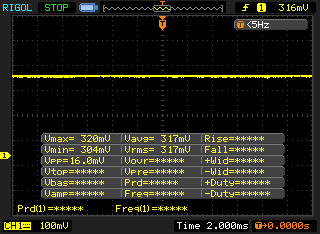 | ||
[pwm_comparison] Em comparação: 52 % de todos os dispositivos testados não usam PWM para escurecer a tela. Se PWM foi detectado, uma média de 7798 (mínimo: 5 - máximo: 343500) Hz foi medida. | |||
| Cinebench R15 | |
| CPU Single 64Bit | |
| Lenovo IdeaPad Gaming 3i 15IMH05 | |
| MSI Bravo 15 A4DCR | |
| Nexoc GH5 515IG | |
| Nexoc GH5 515IG (Leistungsmodus) | |
| Acer Nitro 5 AN515-44-R5FT | |
| Dell G3 3590 | |
| Asus TUF FX505DT-EB73 | |
| HP Pavilion Gaming 15-ec0002ng | |
| CPU Multi 64Bit | |
| MSI Bravo 15 A4DCR | |
| Acer Nitro 5 AN515-44-R5FT | |
| Nexoc GH5 515IG (Leistungsmodus) | |
| Lenovo IdeaPad Gaming 3i 15IMH05 | |
| Nexoc GH5 515IG | |
| Asus TUF FX505DT-EB73 | |
| Dell G3 3590 | |
| HP Pavilion Gaming 15-ec0002ng | |
| Blender - v2.79 BMW27 CPU | |
| Nexoc GH5 515IG | |
| Lenovo IdeaPad Gaming 3i 15IMH05 | |
| Acer Nitro 5 AN515-44-R5FT | |
| MSI Bravo 15 A4DCR | |
| Cinebench R20 | |
| CPU (Single Core) | |
| MSI Bravo 15 A4DCR | |
| Nexoc GH5 515IG | |
| Lenovo IdeaPad Gaming 3i 15IMH05 | |
| Acer Nitro 5 AN515-44-R5FT | |
| Dell G3 3590 | |
| Asus TUF FX505DT-EB73 | |
| HP Pavilion Gaming 15-ec0002ng | |
| CPU (Multi Core) | |
| MSI Bravo 15 A4DCR | |
| Acer Nitro 5 AN515-44-R5FT | |
| Lenovo IdeaPad Gaming 3i 15IMH05 | |
| Nexoc GH5 515IG | |
| Dell G3 3590 | |
| Asus TUF FX505DT-EB73 | |
| HP Pavilion Gaming 15-ec0002ng | |
| Geekbench 5.5 | |
| Single-Core | |
| Nexoc GH5 515IG | |
| Lenovo IdeaPad Gaming 3i 15IMH05 | |
| MSI Bravo 15 A4DCR | |
| Acer Nitro 5 AN515-44-R5FT | |
| HP Pavilion Gaming 15-ec0002ng | |
| Multi-Core | |
| MSI Bravo 15 A4DCR | |
| Acer Nitro 5 AN515-44-R5FT | |
| Nexoc GH5 515IG | |
| Lenovo IdeaPad Gaming 3i 15IMH05 | |
| HP Pavilion Gaming 15-ec0002ng | |
| HWBOT x265 Benchmark v2.2 - 4k Preset | |
| MSI Bravo 15 A4DCR | |
| Acer Nitro 5 AN515-44-R5FT | |
| Lenovo IdeaPad Gaming 3i 15IMH05 | |
| Nexoc GH5 515IG | |
| LibreOffice - 20 Documents To PDF | |
| MSI Bravo 15 A4DCR | |
| Acer Nitro 5 AN515-44-R5FT | |
| Nexoc GH5 515IG | |
| Lenovo IdeaPad Gaming 3i 15IMH05 | |
| R Benchmark 2.5 - Overall mean | |
| Lenovo IdeaPad Gaming 3i 15IMH05 | |
| Acer Nitro 5 AN515-44-R5FT | |
| Nexoc GH5 515IG | |
| MSI Bravo 15 A4DCR | |
* ... menor é melhor
| PCMark 8 Home Score Accelerated v2 | 3971 pontos | |
| PCMark 8 Creative Score Accelerated v2 | 4576 pontos | |
| PCMark 8 Work Score Accelerated v2 | 5179 pontos | |
| PCMark 10 Score | 4936 pontos | |
Ajuda | ||
| PCMark 10 - Score | |
| MSI Bravo 15 A4DCR | |
| Nexoc GH5 515IG | |
| Acer Nitro 5 AN515-44-R5FT | |
| Dell G3 3590 | |
| Asus TUF FX505DT-EB73 | |
| Lenovo IdeaPad Gaming 3i 15IMH05 | |
| HP Pavilion Gaming 15-ec0002ng | |
| PCMark 8 | |
| Home Score Accelerated v2 | |
| Nexoc GH5 515IG | |
| Asus TUF FX505DT-EB73 | |
| Lenovo IdeaPad Gaming 3i 15IMH05 | |
| Dell G3 3590 | |
| HP Pavilion Gaming 15-ec0002ng | |
| Work Score Accelerated v2 | |
| Lenovo IdeaPad Gaming 3i 15IMH05 | |
| Nexoc GH5 515IG | |
| Dell G3 3590 | |
| HP Pavilion Gaming 15-ec0002ng | |
| Asus TUF FX505DT-EB73 | |
| DPC Latencies / LatencyMon - interrupt to process latency (max), Web, Youtube, Prime95 | |
| MSI Bravo 15 A4DCR | |
| Acer Nitro 5 AN515-44-R5FT | |
| Lenovo IdeaPad Gaming 3i 15IMH05 | |
| Nexoc GH5 515IG | |
* ... menor é melhor

| Nexoc GH5 515IG Samsung SSD 860 Evo 512GB | Lenovo IdeaPad Gaming 3i 15IMH05 SK hynix BC511 HFM512GDHTNI-87A0B | Asus TUF FX505DT-EB73 Intel SSD 660p SSDPEKNW512G8 | Dell G3 3590 Toshiba BG4 KBG40ZNS128G | HP Pavilion Gaming 15-ec0002ng Intel SSD 660p SSDPEKNW512G8 | Acer Nitro 5 AN515-44-R5FT SK Hynix BC511 HFM512GDJTNI | MSI Bravo 15 A4DCR Samsung PM981a MZVLB1T0HBLR | |
|---|---|---|---|---|---|---|---|
| CrystalDiskMark 5.2 / 6 | 90% | 81% | 85% | 88% | 240% | ||
| Write 4K (MB/s) | 89.6 | 130 45% | 137.5 53% | 136.9 53% | 94.7 6% | 118.3 32% | |
| Read 4K (MB/s) | 40.88 | 44.44 9% | 57 39% | 57 39% | 38.91 -5% | 43.73 7% | |
| Write Seq (MB/s) | 518 | 1059 104% | 984 90% | 968 87% | 1056 104% | 2854 451% | |
| Read Seq (MB/s) | 539 | 1105 105% | 1564 190% | 1631 203% | 1183 119% | 2302 327% | |
| Write 4K Q32T1 (MB/s) | 304 | 490.3 61% | 237.4 -22% | 237 -22% | 445.3 46% | 418.5 38% | |
| Read 4K Q32T1 (MB/s) | 329 | 309.2 -6% | 340.7 4% | 337.1 2% | 477.7 45% | 517 57% | |
| Write Seq Q32T1 (MB/s) | 529 | 1053 99% | 959 81% | 963 82% | 1063 101% | 3008 469% | |
| Read Seq Q32T1 (MB/s) | 561 | 2261 303% | 1732 209% | 1863 232% | 2154 284% | 3568 536% | |
| AS SSD | 71% | 58% | -194% | -2% | 82% | 269% | |
| Seq Read (MB/s) | 524 | 1348 157% | 1019 94% | 1174 124% | 1623 210% | 1504 187% | 2730 421% |
| Seq Write (MB/s) | 495 | 1000 102% | 889 80% | 186 -62% | 891 80% | 1064 115% | 2513 408% |
| 4K Read (MB/s) | 38.93 | 48.04 23% | 48.22 24% | 34.01 -13% | 48.06 23% | 51.5 32% | 61.4 58% |
| 4K Write (MB/s) | 87.3 | 103.3 18% | 115.5 32% | 69.4 -21% | 102.1 17% | 123.2 41% | 156.1 79% |
| 4K-64 Read (MB/s) | 380 | 755 99% | 321.5 -15% | 424 12% | 325.6 -14% | 703 85% | 1780 368% |
| 4K-64 Write (MB/s) | 335.7 | 749 123% | 787 134% | 68.8 -80% | 94.1 -72% | 730 117% | 1920 472% |
| Access Time Read * (ms) | 0.073 | 0.061 16% | 0.065 11% | 0.168 -130% | 0.171 -134% | 0.064 12% | 0.063 14% |
| Access Time Write * (ms) | 0.039 | 0.036 8% | 0.047 -21% | 0.94 -2310% | 0.048 -23% | 0.031 21% | 0.025 36% |
| Score Read (Points) | 471 | 938 99% | 472 0% | 575 22% | 536 14% | 905 92% | 2114 349% |
| Score Write (Points) | 472 | 952 102% | 992 110% | 157 -67% | 285 -40% | 960 103% | 2327 393% |
| Score Total (Points) | 1198 | 2365 97% | 1717 43% | 987 -18% | 1077 -10% | 2321 94% | 5518 361% |
| Copy ISO MB/s (MB/s) | 500 | 749 50% | 942 88% | 215.7 -57% | 566 13% | ||
| Copy Program MB/s (MB/s) | 283.8 | 342.5 21% | 444.5 57% | 108.2 -62% | 223.8 -21% | ||
| Copy Game MB/s (MB/s) | 319.6 | 571 79% | 867 171% | 165.9 -48% | 104.3 -67% | ||
| Média Total (Programa/Configurações) | 81% /
78% | 70% /
66% | -194% /
-194% | 42% /
30% | 85% /
84% | 255% /
257% |
* ... menor é melhor
Continuous load read: DiskSpd Read Loop, Queue Depth 8
| 3DMark 06 Standard Score | 36299 pontos | |
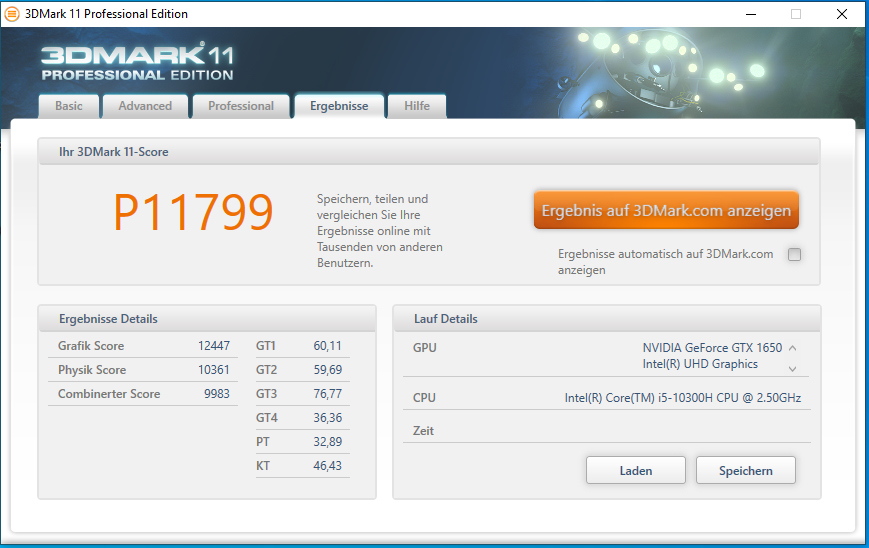
| 3DMark 11 Performance | 11799 pontos | |
| 3DMark Cloud Gate Standard Score | 27676 pontos | |
| 3DMark Fire Strike Score | 8410 pontos | |
| 3DMark Time Spy Score | 3552 pontos | |
Ajuda | ||
| 3DMark 11 - 1280x720 Performance GPU | |
| MSI Bravo 15 A4DCR | |
| Acer Nitro 5 AN515-44-R5FT | |
| Asus TUF FX505DT-EB73 | |
| Dell G3 3590 | |
| Lenovo IdeaPad Gaming 3i 15IMH05 | |
| Nexoc GH5 515IG | |
| HP Pavilion Gaming 15-ec0002ng | |
| 3DMark | |
| 1280x720 Cloud Gate Standard Graphics | |
| Lenovo IdeaPad Gaming 3i 15IMH05 | |
| Nexoc GH5 515IG | |
| Dell G3 3590 | |
| MSI Bravo 15 A4DCR | |
| Acer Nitro 5 AN515-44-R5FT | |
| Asus TUF FX505DT-EB73 | |
| HP Pavilion Gaming 15-ec0002ng | |
| 1920x1080 Fire Strike Graphics | |
| MSI Bravo 15 A4DCR | |
| Acer Nitro 5 AN515-44-R5FT | |
| Nexoc GH5 515IG (Leistungsmodus) | |
| Lenovo IdeaPad Gaming 3i 15IMH05 | |
| Asus TUF FX505DT-EB73 | |
| Dell G3 3590 | |
| Nexoc GH5 515IG | |
| HP Pavilion Gaming 15-ec0002ng | |
| 2560x1440 Time Spy Graphics | |
| Acer Nitro 5 AN515-44-R5FT | |
| Asus TUF FX505DT-EB73 | |
| MSI Bravo 15 A4DCR | |
| Nexoc GH5 515IG (Leistungsmodus) | |
| Dell G3 3590 | |
| Lenovo IdeaPad Gaming 3i 15IMH05 | |
| Nexoc GH5 515IG | |
| HP Pavilion Gaming 15-ec0002ng | |
| Shadow of the Tomb Raider - 1920x1080 Highest Preset AA:T | |
| Acer Nitro 5 AN515-44-R5FT | |
| Lenovo IdeaPad Gaming 3i 15IMH05 | |
| Nexoc GH5 515IG (Leistungsmodus) | |
| Nexoc GH5 515IG | |
| Asus TUF FX505DT-EB73 | |
| MSI Bravo 15 A4DCR | |
| HP Pavilion Gaming 15-ec0002ng | |
| The Witcher 3 - 1920x1080 Ultra Graphics & Postprocessing (HBAO+) | |
| Nexoc GH5 515IG | |
| Acer Nitro 5 AN515-44-R5FT | |
| MSI Bravo 15 A4DCR | |
| Lenovo IdeaPad Gaming 3i 15IMH05 | |
| Nexoc GH5 515IG (Leistungsmodus) | |
| Asus TUF FX505DT-EB73 | |
| Dell G3 3590 | |
| HP Pavilion Gaming 15-ec0002ng | |
| BioShock Infinite - 1920x1080 Ultra Preset, DX11 (DDOF) | |
| Nexoc GH5 515IG (Leistungsmodus) | |
| Lenovo IdeaPad Gaming 3i 15IMH05 | |
| Nexoc GH5 515IG | |
| Dell G3 3590 | |
| Asus TUF FX505DT-EB73 | |
| HP Pavilion Gaming 15-ec0002ng | |
| Star Wars Jedi Fallen Order - 1920x1080 Epic Preset | |
| MSI Bravo 15 A4DCR | |
| Lenovo IdeaPad Gaming 3i 15IMH05 | |
| Nexoc GH5 515IG | |
| HP Pavilion Gaming 15-ec0002ng | |
| Gears Tactics - 1920x1080 Ultra Preset | |
| Acer Nitro 5 AN515-44-R5FT | |
| Lenovo IdeaPad Gaming 3i 15IMH05 | |
| MSI Bravo 15 A4DCR | |
| Nexoc GH5 515IG (Leistungsmodus) | |
| Nexoc GH5 515IG | |
| Doom Eternal - 1920x1080 High Preset | |
| Lenovo IdeaPad Gaming 3i 15IMH05 | |
| Nexoc GH5 515IG | |
| MSI Bravo 15 A4DCR | |
| F1 2020 - 1920x1080 Ultra High Preset AA:T AF:16x | |
| Nexoc GH5 515IG | |
| baixo | média | alto | ultra | |
|---|---|---|---|---|
| BioShock Infinite (2013) | 332.4 | 250.2 | 226.1 | 95.2 |
| The Witcher 3 (2015) | 187.9 | 118.4 | 67.2 | 38.5 |
| Shadow of the Tomb Raider (2018) | 115 | 61 | 51 | 44 |
| Call of Duty Modern Warfare 2019 (2019) | 97.5 | 61.5 | 51.1 | 43.3 |
| Star Wars Jedi Fallen Order (2019) | 78.3 | 61.1 | 51.8 | |
| Doom Eternal (2020) | 148.6 | 81.4 | 62.6 | |
| Gears Tactics (2020) | 230.8 | 89.7 | 61 | 41.9 |
| F1 2020 (2020) | 182 | 104 | 81 | 57 |
| Death Stranding (2020) | 104.9 | 62.8 | 57.3 | 56.5 |
| Horizon Zero Dawn (2020) | 95 | 54 | 45 | 34 |
Barulho
| Ocioso |
| 25 / 31 / 33 dB |
| Carga |
| 53 / 53 dB |
 | ||
30 dB silencioso 40 dB(A) audível 50 dB(A) ruidosamente alto |
||
min: | ||
| Nexoc GH5 515IG i5-10300H, GeForce GTX 1650 Mobile | Lenovo IdeaPad Gaming 3i 15IMH05 i5-10300H, GeForce GTX 1650 Mobile | Asus TUF FX505DT-EB73 R7 3750H, GeForce GTX 1650 Mobile | Dell G3 3590 i5-9300H, GeForce GTX 1650 Mobile | HP Pavilion Gaming 15-ec0002ng R5 3550H, GeForce GTX 1050 Mobile | Acer Nitro 5 AN515-44-R5FT R5 4600H, GeForce GTX 1650 Ti Mobile | MSI Bravo 15 A4DCR R7 4800H, Radeon RX 5300M | |
|---|---|---|---|---|---|---|---|
| Noise | -4% | 3% | 2% | 3% | -3% | -9% | |
| desligado / ambiente * (dB) | 25 | 30.7 -23% | 28.2 -13% | 28.4 -14% | 30.3 -21% | 30 -20% | 30 -20% |
| Idle Minimum * (dB) | 25 | 30.7 -23% | 28.2 -13% | 29.2 -17% | 30.3 -21% | 30 -20% | 31 -24% |
| Idle Average * (dB) | 31 | 30.7 1% | 28.2 9% | 29.4 5% | 30.3 2% | 32 -3% | 32 -3% |
| Idle Maximum * (dB) | 33 | 30.7 7% | 31.4 5% | 29.4 11% | 31 6% | 34 -3% | 40 -21% |
| Load Average * (dB) | 53 | 49.7 6% | 39.8 25% | 39 26% | 39.3 26% | 46 13% | 48 9% |
| Witcher 3 ultra * (dB) | 48 | 47 2% | 47 2% | 49.5 -3% | 42.9 11% | 47 2% | 48 -0% |
| Load Maximum * (dB) | 53 | 50.3 5% | 50.2 5% | 49.7 6% | 43.3 18% | 49 8% | 54 -2% |
* ... menor é melhor
(-) A temperatura máxima no lado superior é 48 °C / 118 F, em comparação com a média de 40.4 °C / 105 F , variando de 21.2 a 68.8 °C para a classe Gaming.
(-) A parte inferior aquece até um máximo de 47 °C / 117 F, em comparação com a média de 43.2 °C / 110 F
(+) Em uso inativo, a temperatura média para o lado superior é 27.6 °C / 82 F, em comparação com a média do dispositivo de 33.9 °C / ### class_avg_f### F.
(-) Jogando The Witcher 3, a temperatura média para o lado superior é 38.1 °C / 101 F, em comparação com a média do dispositivo de 33.9 °C / ## #class_avg_f### F.
(+) Os apoios para as mãos e o touchpad estão atingindo a temperatura máxima da pele (34 °C / 93.2 F) e, portanto, não estão quentes.
(-) A temperatura média da área do apoio para as mãos de dispositivos semelhantes foi 28.8 °C / 83.8 F (-5.2 °C / -9.4 F).
| Nexoc GH5 515IG i5-10300H, GeForce GTX 1650 Mobile | Lenovo IdeaPad Gaming 3i 15IMH05 i5-10300H, GeForce GTX 1650 Mobile | Asus TUF FX505DT-EB73 R7 3750H, GeForce GTX 1650 Mobile | Dell G3 3590 i5-9300H, GeForce GTX 1650 Mobile | HP Pavilion Gaming 15-ec0002ng R5 3550H, GeForce GTX 1050 Mobile | Acer Nitro 5 AN515-44-R5FT R5 4600H, GeForce GTX 1650 Ti Mobile | MSI Bravo 15 A4DCR R7 4800H, Radeon RX 5300M | |
|---|---|---|---|---|---|---|---|
| Heat | 2% | -5% | -13% | 11% | -2% | -8% | |
| Maximum Upper Side * (°C) | 48 | 43 10% | 41.2 14% | 49 -2% | 41 15% | 49 -2% | 51 -6% |
| Maximum Bottom * (°C) | 47 | 50.6 -8% | 40 15% | 49.8 -6% | 39.1 17% | 50 -6% | 50 -6% |
| Idle Upper Side * (°C) | 28 | 27.2 3% | 34.6 -24% | 32.4 -16% | 26 7% | 28 -0% | 30 -7% |
| Idle Bottom * (°C) | 28 | 27.5 2% | 34.4 -23% | 35.6 -27% | 26.5 5% | 28 -0% | 31 -11% |
* ... menor é melhor
Nexoc GH5 515IG análise de áudio
(±) | o volume do alto-falante é médio, mas bom (###valor### dB)
Graves 100 - 315Hz
(-) | quase nenhum baixo - em média 24.4% menor que a mediana
(±) | a linearidade dos graves é média (13% delta para a frequência anterior)
Médios 400 - 2.000 Hz
(+) | médios equilibrados - apenas 4.3% longe da mediana
(±) | a linearidade dos médios é média (7.5% delta para frequência anterior)
Altos 2 - 16 kHz
(±) | máximos mais altos - em média 5% maior que a mediana
(±) | a linearidade dos máximos é média (8.3% delta para frequência anterior)
Geral 100 - 16.000 Hz
(±) | a linearidade do som geral é média (20.2% diferença em relação à mediana)
Comparado com a mesma classe
» 71% de todos os dispositivos testados nesta classe foram melhores, 6% semelhantes, 23% piores
» O melhor teve um delta de 6%, a média foi 18%, o pior foi 132%
Comparado com todos os dispositivos testados
» 52% de todos os dispositivos testados foram melhores, 8% semelhantes, 39% piores
» O melhor teve um delta de 4%, a média foi 24%, o pior foi 134%
| desligado | |
| Ocioso | |
| Carga |
|
Key:
min: | |
| Nexoc GH5 515IG i5-10300H, GeForce GTX 1650 Mobile | Lenovo IdeaPad Gaming 3i 15IMH05 i5-10300H, GeForce GTX 1650 Mobile | Asus TUF FX505DT-EB73 R7 3750H, GeForce GTX 1650 Mobile | Dell G3 3590 i5-9300H, GeForce GTX 1650 Mobile | HP Pavilion Gaming 15-ec0002ng R5 3550H, GeForce GTX 1050 Mobile | Acer Nitro 5 AN515-44-R5FT R5 4600H, GeForce GTX 1650 Ti Mobile | MSI Bravo 15 A4DCR R7 4800H, Radeon RX 5300M | |
|---|---|---|---|---|---|---|---|
| Power Consumption | -24% | -23% | -36% | 18% | -5% | -74% | |
| Idle Minimum * (Watt) | 3 | 5.1 -70% | 7 -133% | 6.2 -107% | 1.9 37% | 5 -67% | 11 -267% |
| Idle Average * (Watt) | 7 | 8.2 -17% | 9.9 -41% | 8.4 -20% | 7.2 -3% | 8 -14% | 14 -100% |
| Idle Maximum * (Watt) | 16 | 10.6 34% | 12 25% | 27.7 -73% | 9.6 40% | 13 19% | 25 -56% |
| Load Average * (Watt) | 85 | 128 -51% | 68.4 20% | 91 -7% | 74 13% | 69 19% | 72 15% |
| Witcher 3 ultra * (Watt) | 86 | 109 -27% | 94.9 -10% | 94.4 -10% | 75 13% | 78 9% | 100 -16% |
| Load Maximum * (Watt) | 134 | 150 -12% | 130.9 2% | 131.5 2% | 124 7% | 124 7% | 163 -22% |
* ... menor é melhor
| Nexoc GH5 515IG i5-10300H, GeForce GTX 1650 Mobile, 48.96 Wh | Lenovo IdeaPad Gaming 3i 15IMH05 i5-10300H, GeForce GTX 1650 Mobile, 45 Wh | Asus TUF FX505DT-EB73 R7 3750H, GeForce GTX 1650 Mobile, 48 Wh | Dell G3 3590 i5-9300H, GeForce GTX 1650 Mobile, 51 Wh | HP Pavilion Gaming 15-ec0002ng R5 3550H, GeForce GTX 1050 Mobile, 52.5 Wh | Acer Nitro 5 AN515-44-R5FT R5 4600H, GeForce GTX 1650 Ti Mobile, 57.48 Wh | MSI Bravo 15 A4DCR R7 4800H, Radeon RX 5300M, 51 Wh | |
|---|---|---|---|---|---|---|---|
| Duração da bateria | 11% | -16% | 4% | 31% | 15% | -36% | |
| Reader / Idle (h) | 14.9 | 12.4 -17% | 7.8 -48% | 13.5 -9% | 13.8 -7% | 7 -53% | |
| H.264 (h) | 6.5 | 7.3 12% | |||||
| WiFi v1.3 (h) | 6.4 | 6.3 -2% | 4.8 -25% | 6.7 5% | 8.4 31% | 8.7 36% | 4.5 -30% |
| Load (h) | 1.2 | 1.8 50% | 1.5 25% | 1.4 17% | 1.4 17% | 0.9 -25% |
Pro
Contra
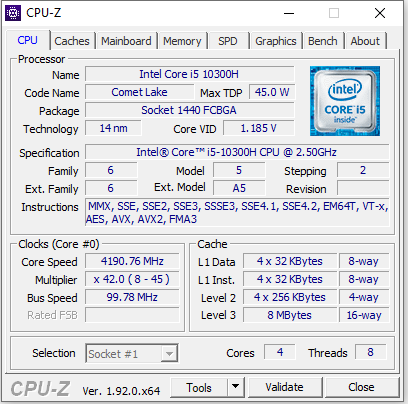
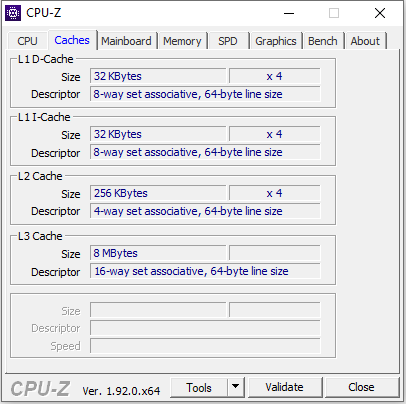
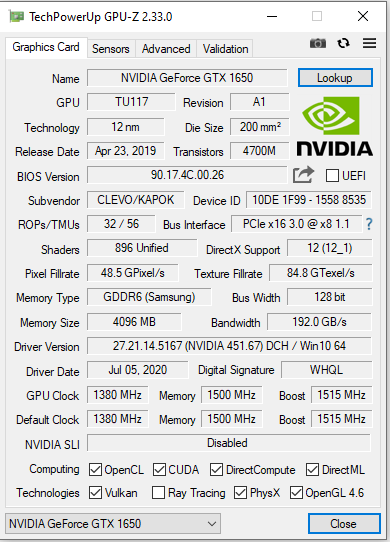
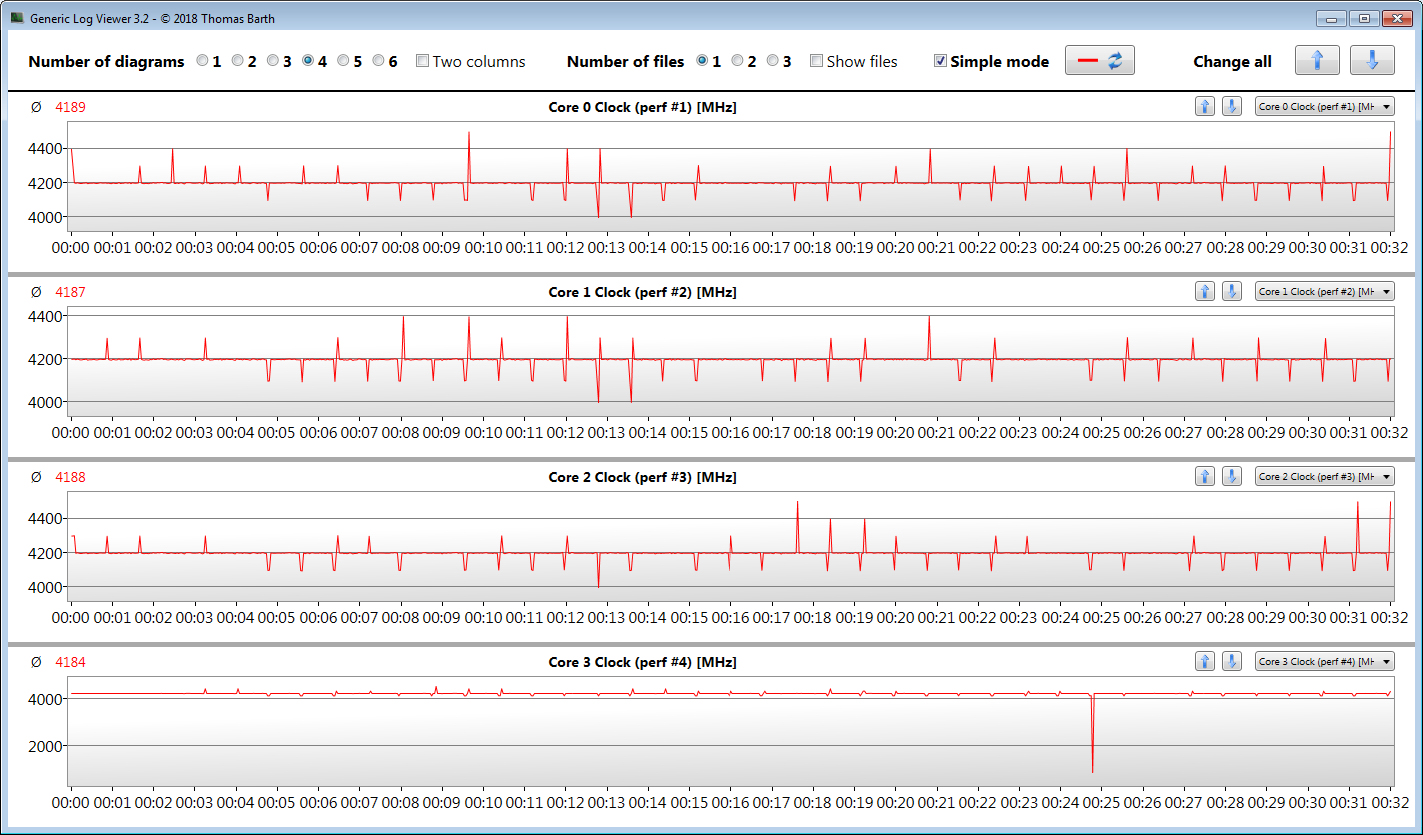
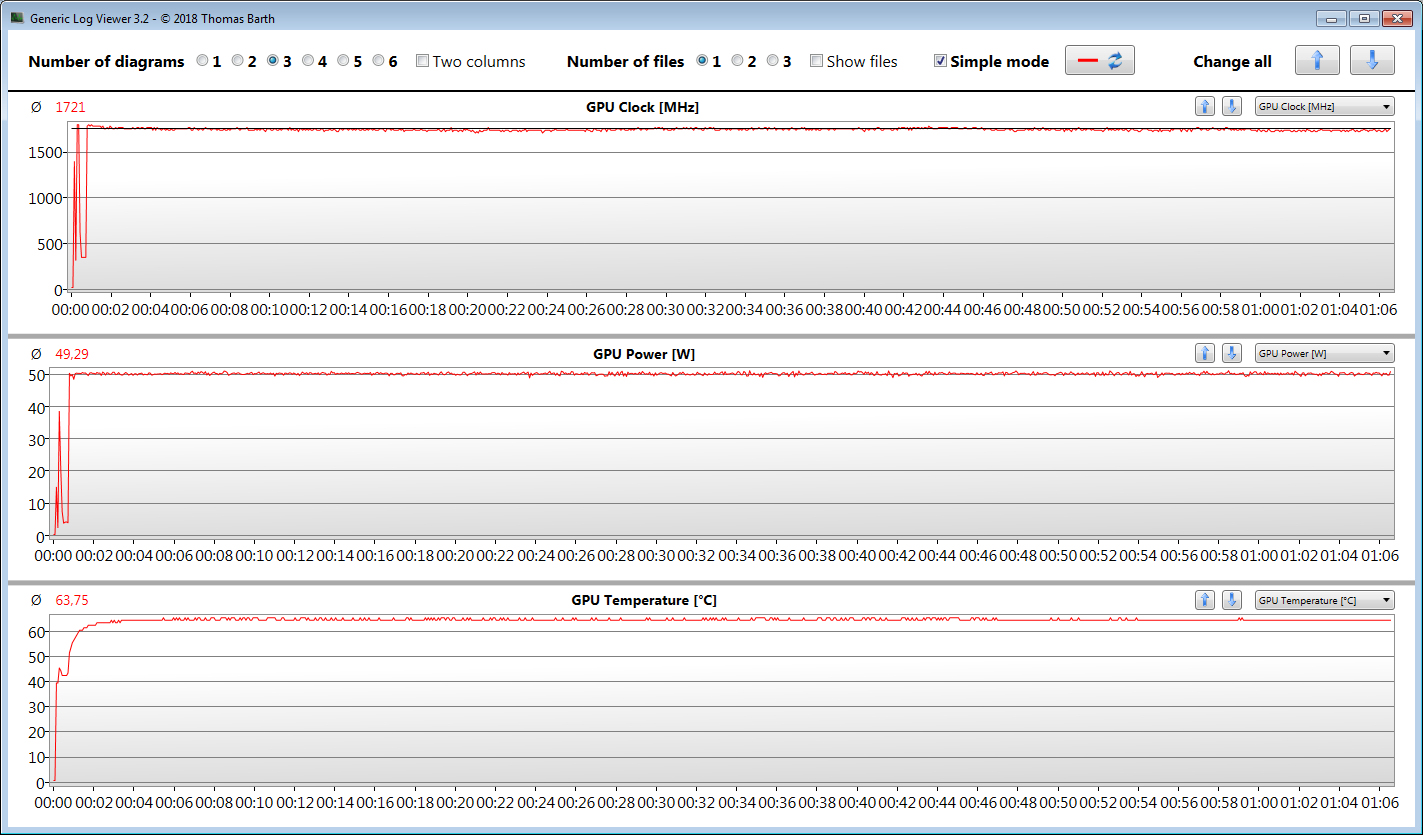
O portátil de jogos da Nexoc roda todos os jogos de computador mais recentes fluentemente na tela graças ao seu processador Core i5-1030NG7 e núcleo gráfico GeForce GTX 1650. No entanto, as configurações de qualidade máxima estão fora do alcance dos proprietários do dispositivo. Positivo: A CPU e a GPU podem funcionar em altas velocidades por longos períodos de tempo.
Com o GH5 515IG, a Nexoc oferece um portátil para jogos completo do segmento de nível básico que pode ser personalizado de acordo com as necessidades dos usuários.
O portátil pode ser configurado individualmente na loja online da Nexoc. Enquanto a versão básica está disponível por cerca de 850 Euros (~$ 1.001), cerca de 1.040 Euros (~ $ 1.225) devem ser pagos pela variante de configuração fornecida a nós. É também a possibilidade de escolher uma configuração que nos permite viver com o SSD SATA integrado (500 GB, M.2 2280). Um SSD NVMe é recomendado como uma unidade de sistema para todos os compradores em potencial.
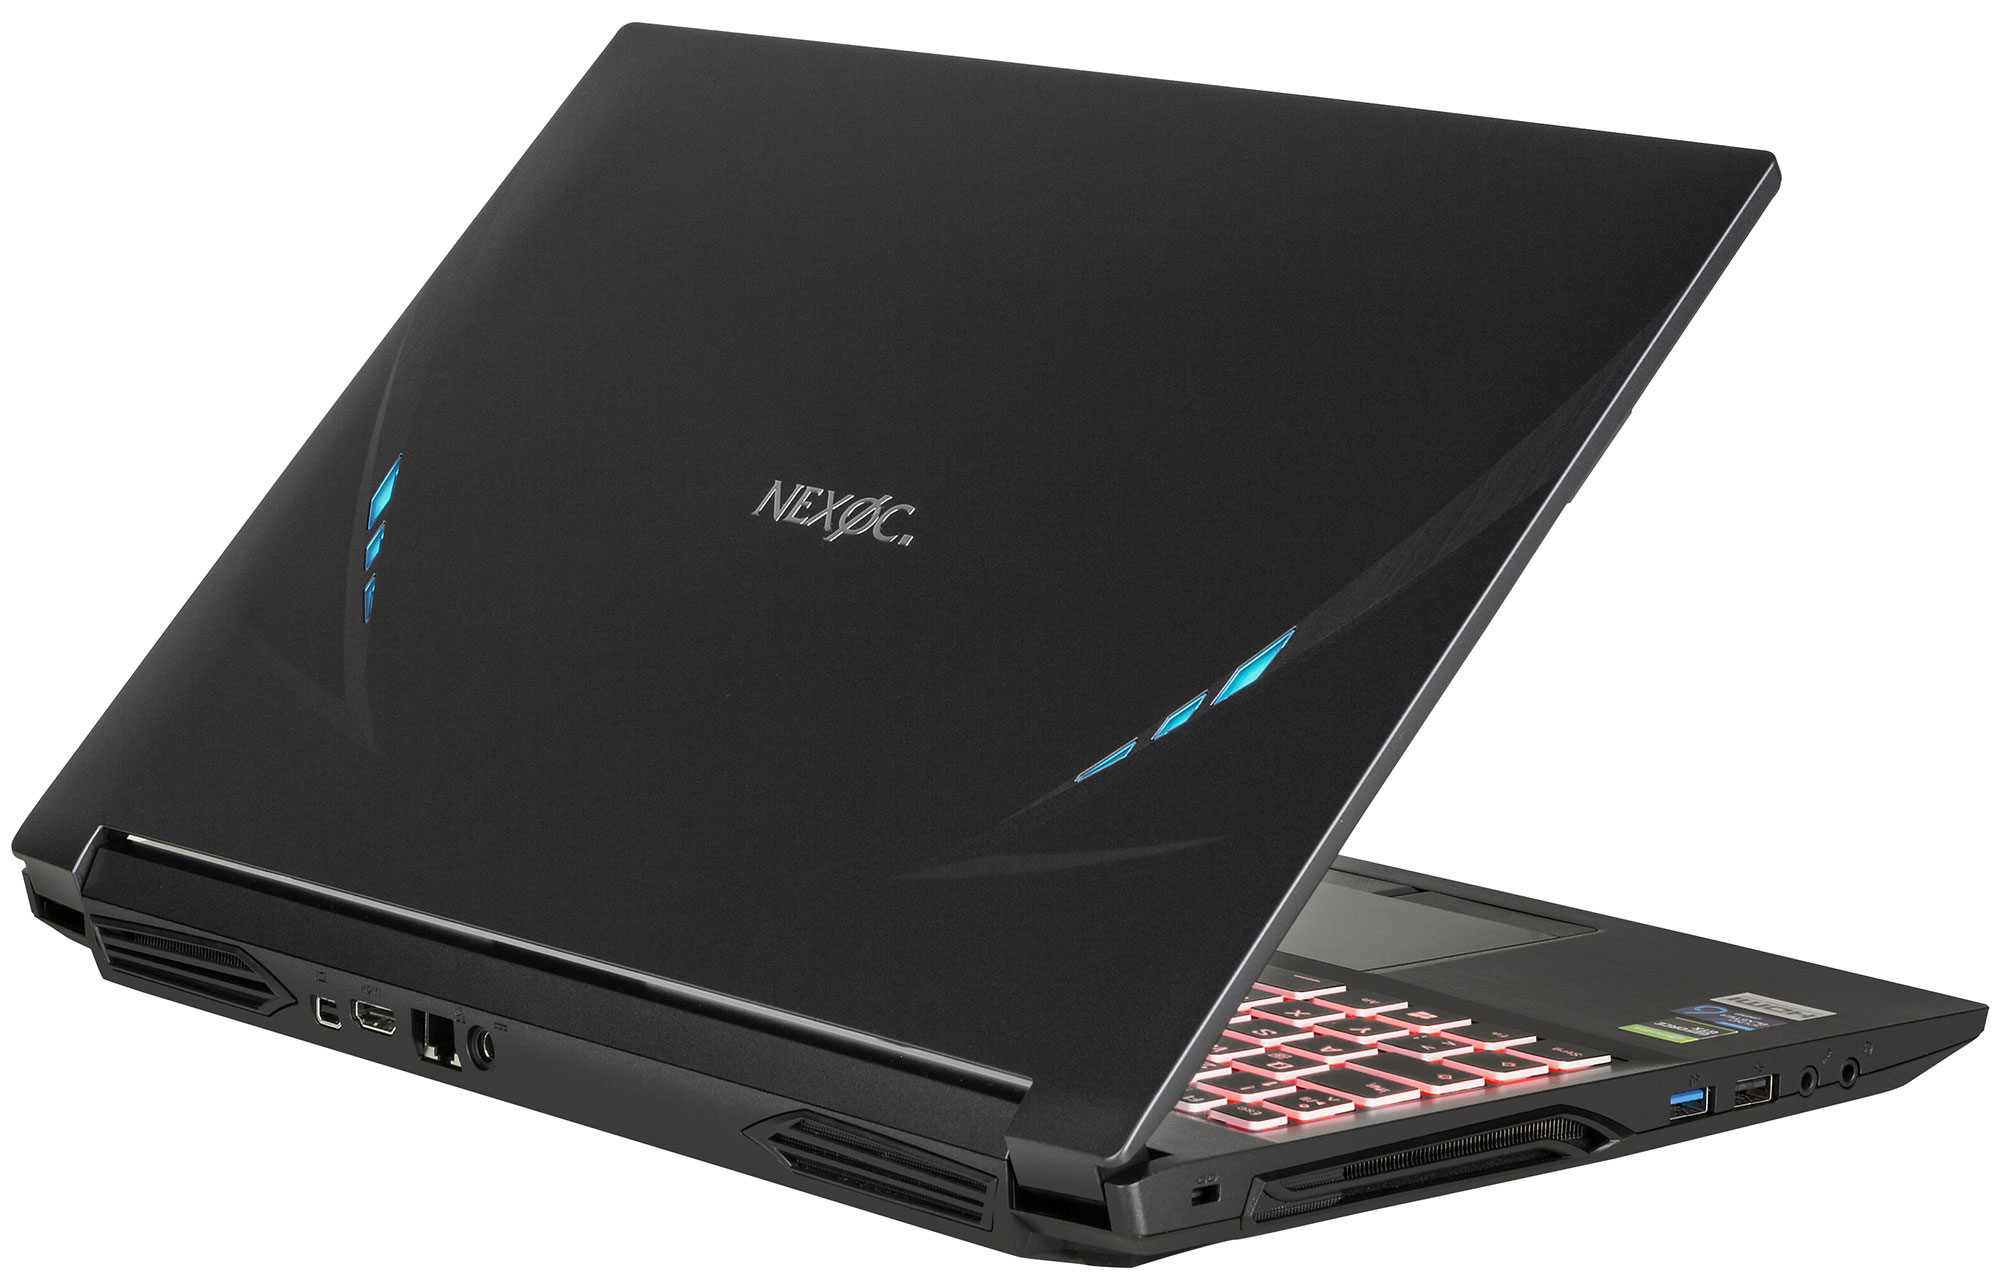
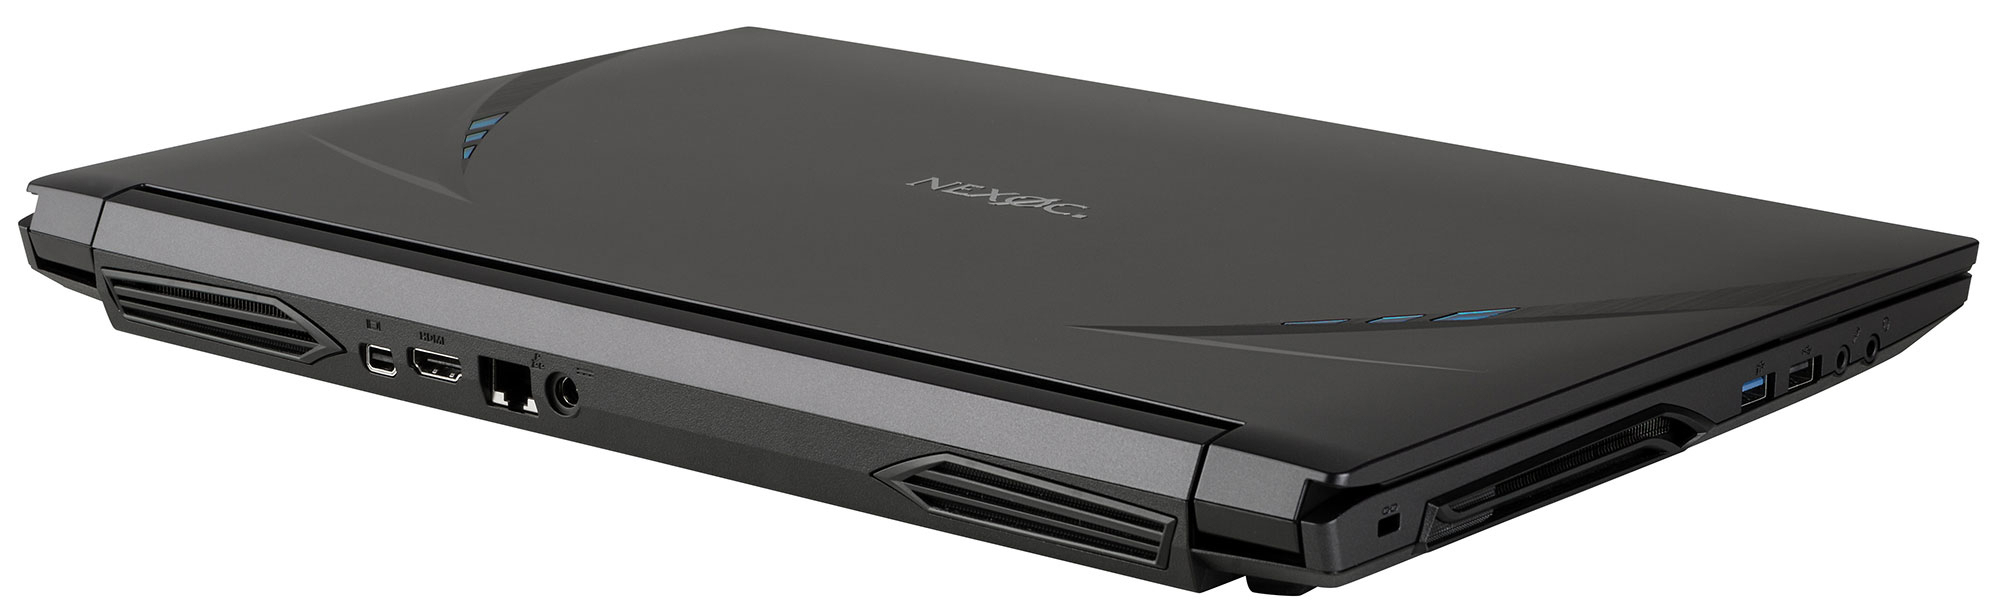
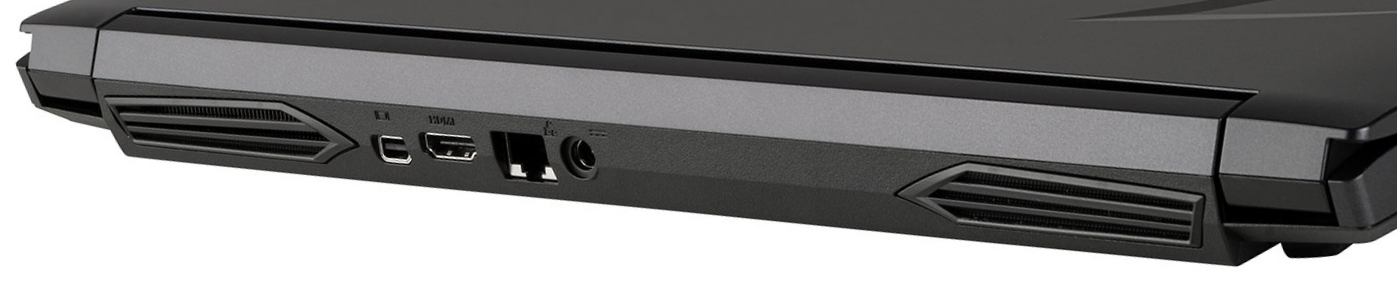
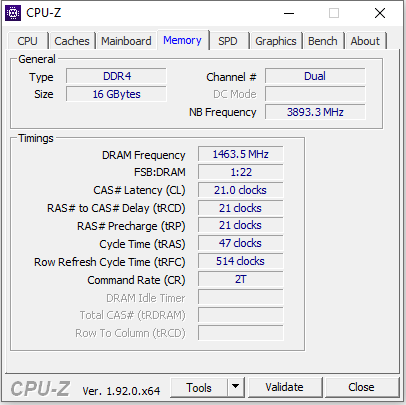
O portátil tem espaço para dois SSDs M.2 (1x NVMe / SATA, 1x NVMe; RAID 0/1) e uma unidade de armazenamento de 2,5 polegadas. Se o espaço de armazenamento do SSD de 500 GB acabar, pode ser facilmente expandido. Para fazer isso, a tampa inferior do portátil teria que ser removida, pois não há escotilha de manutenção.
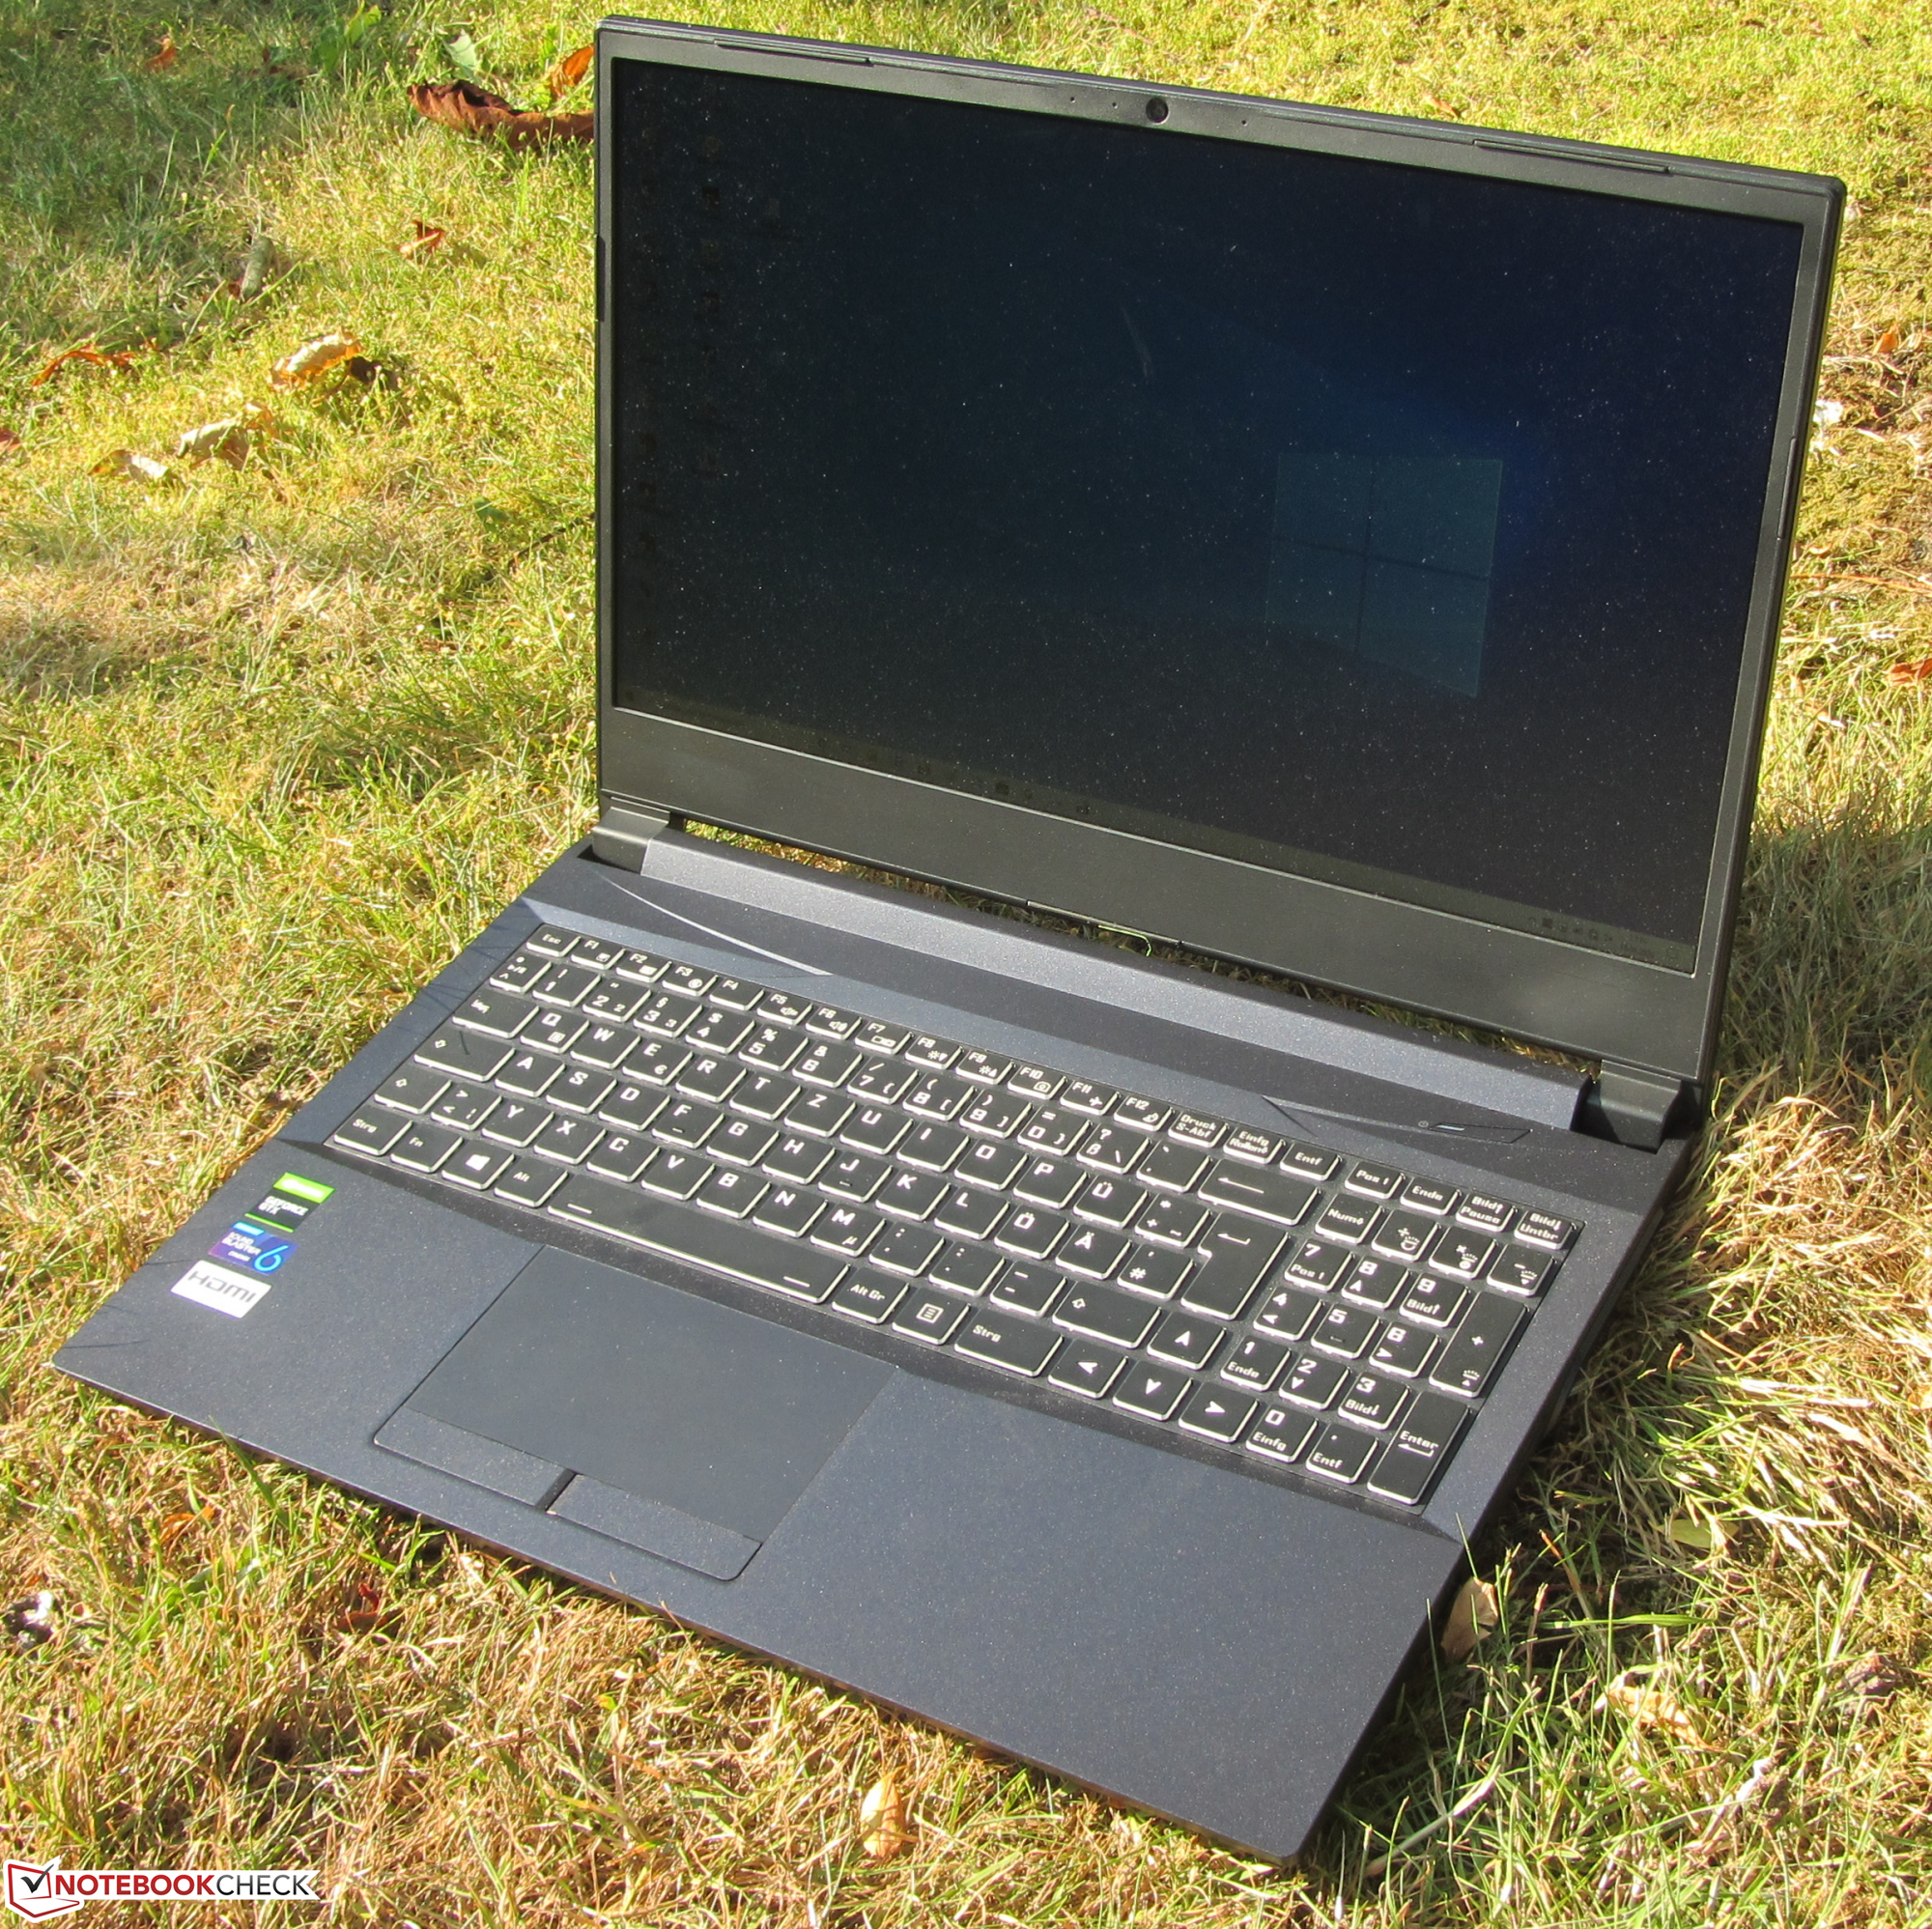
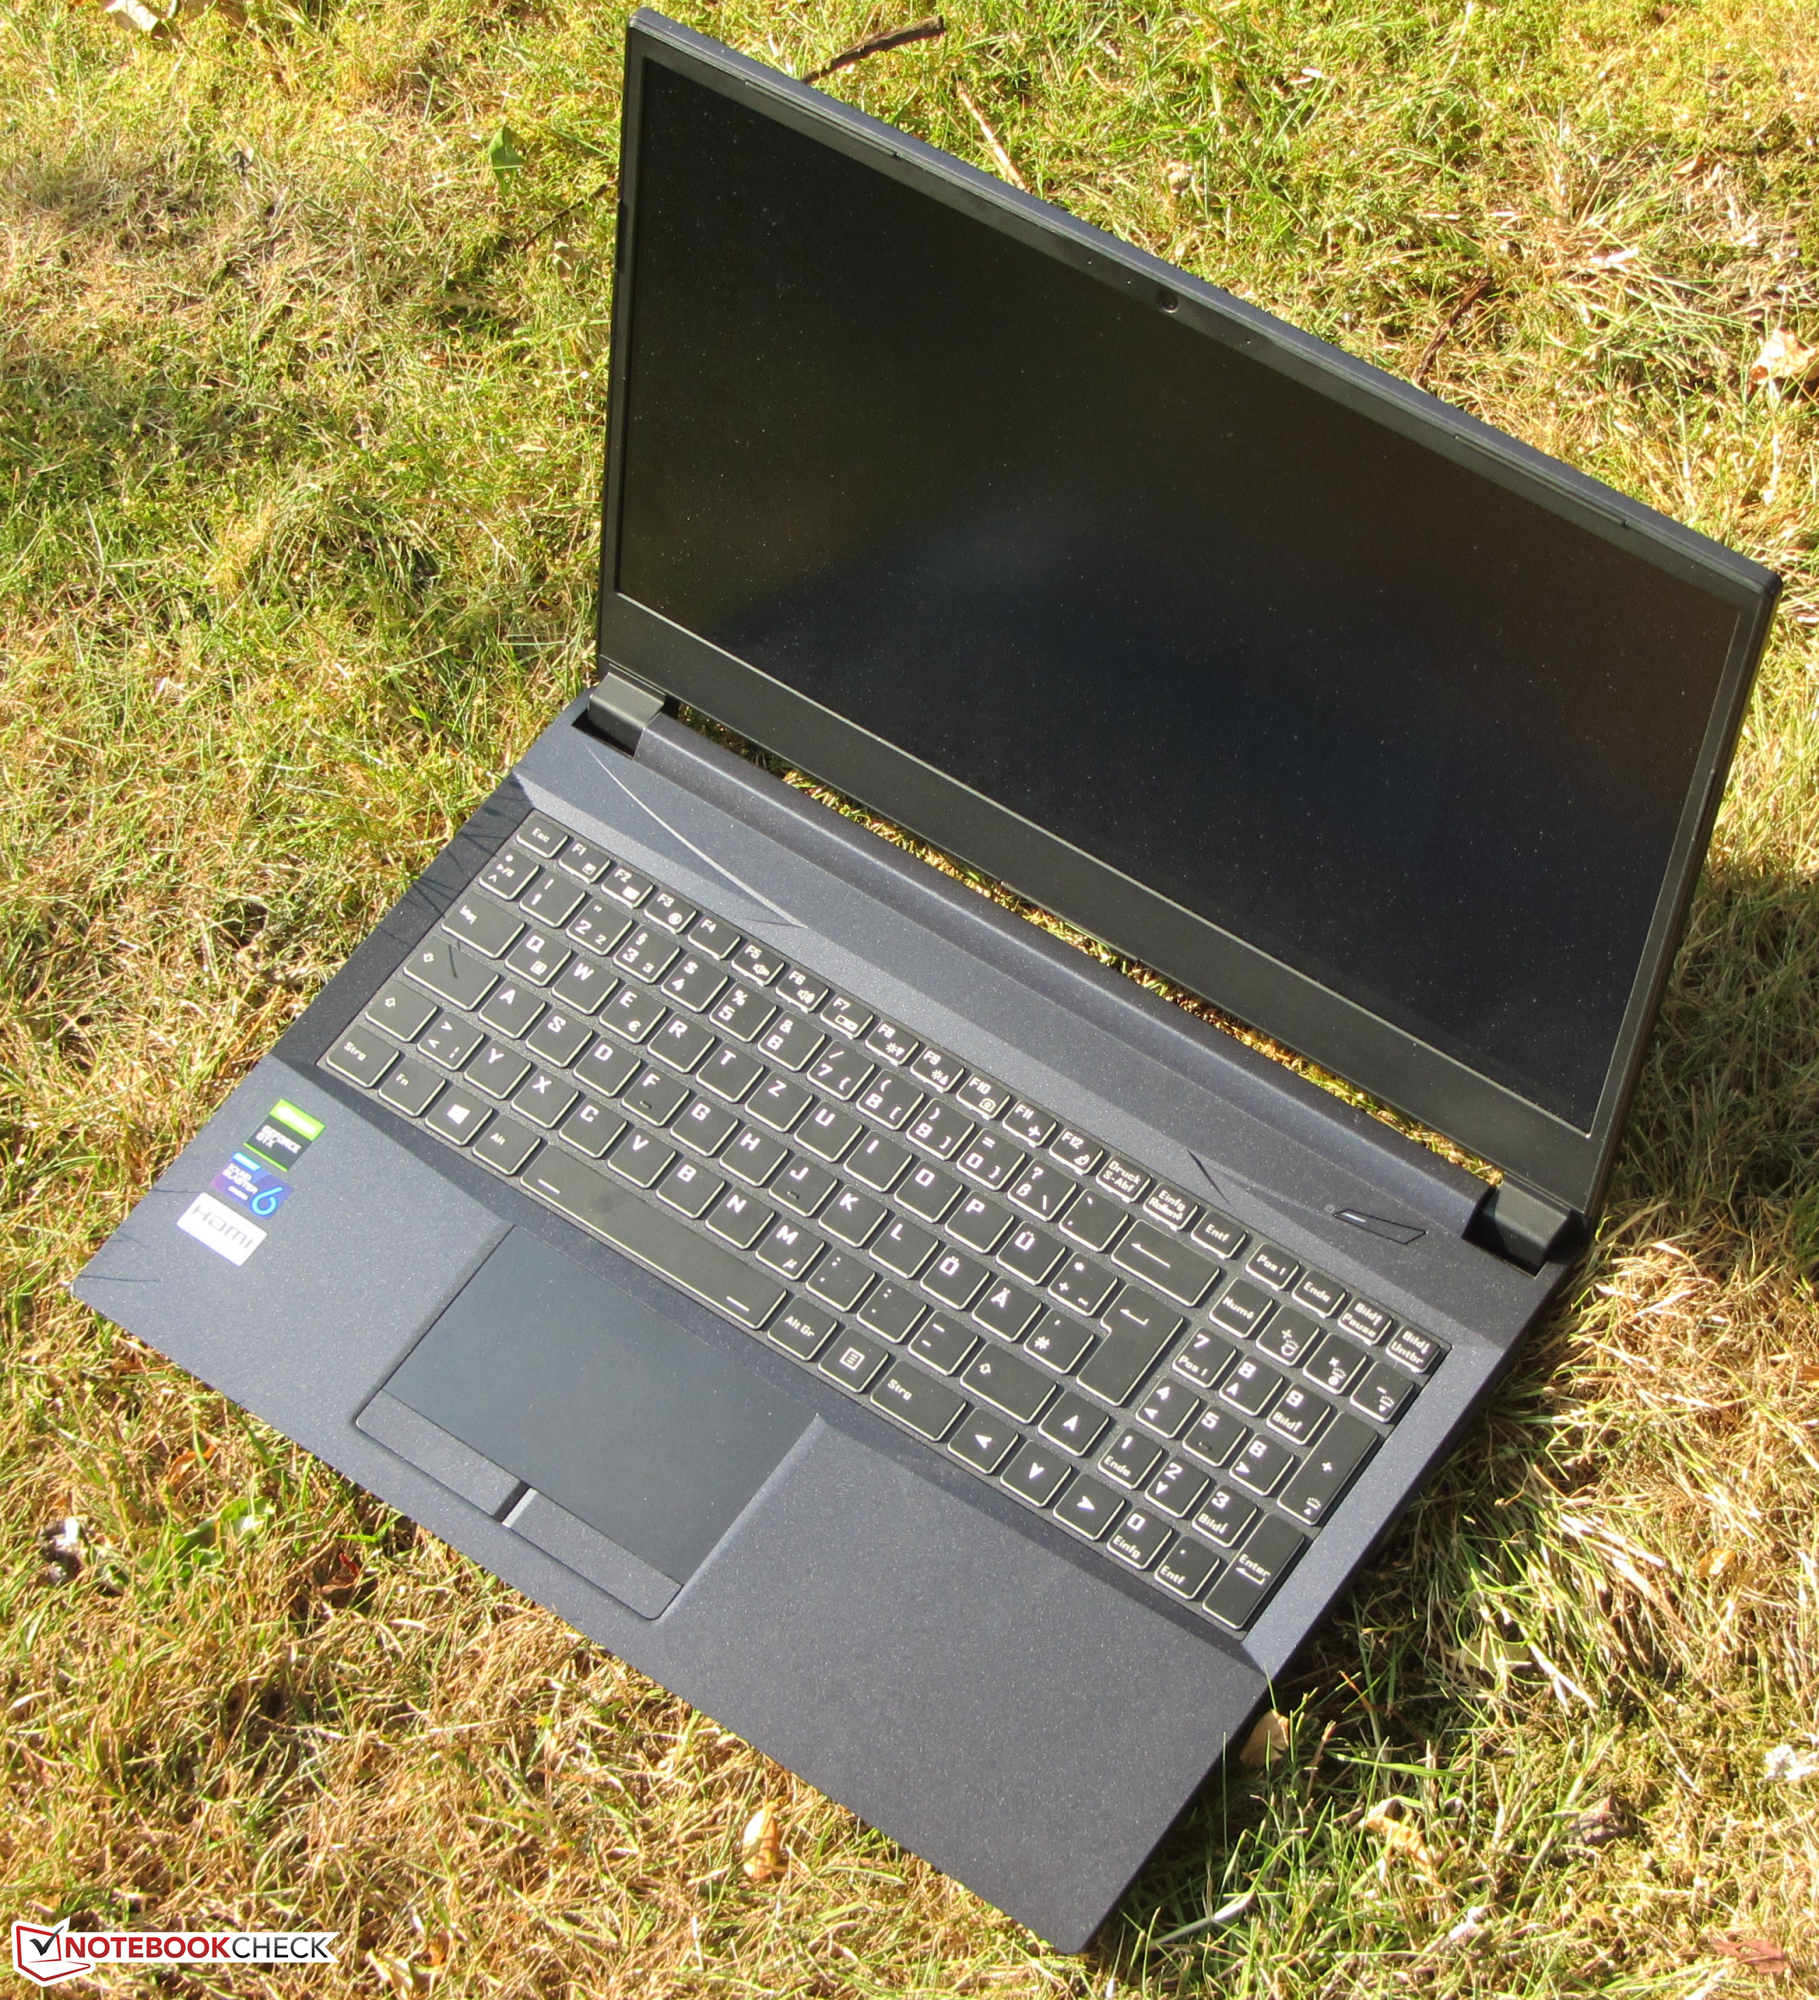
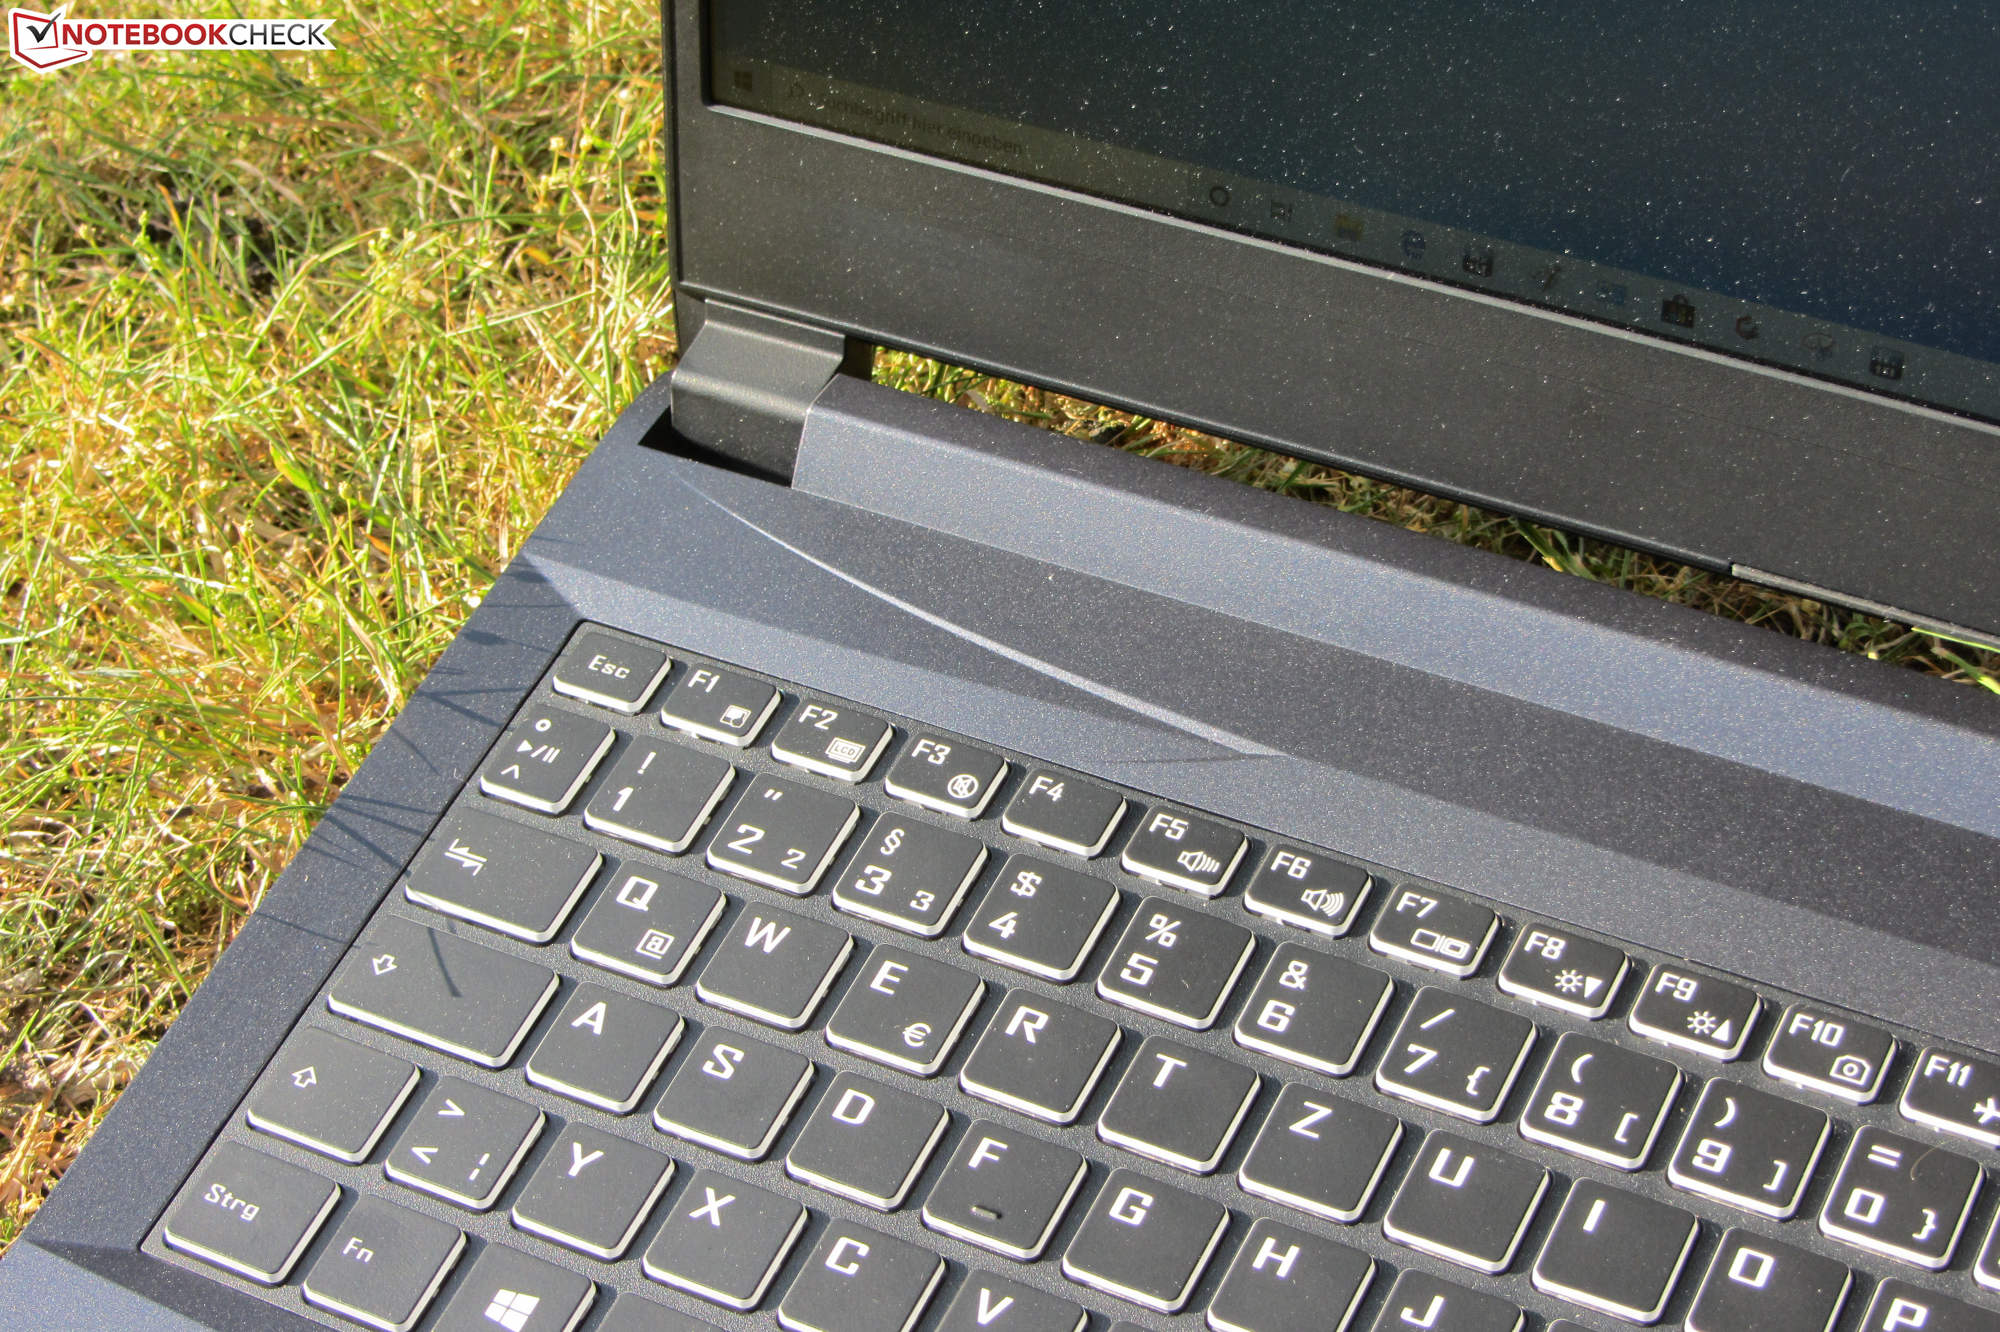
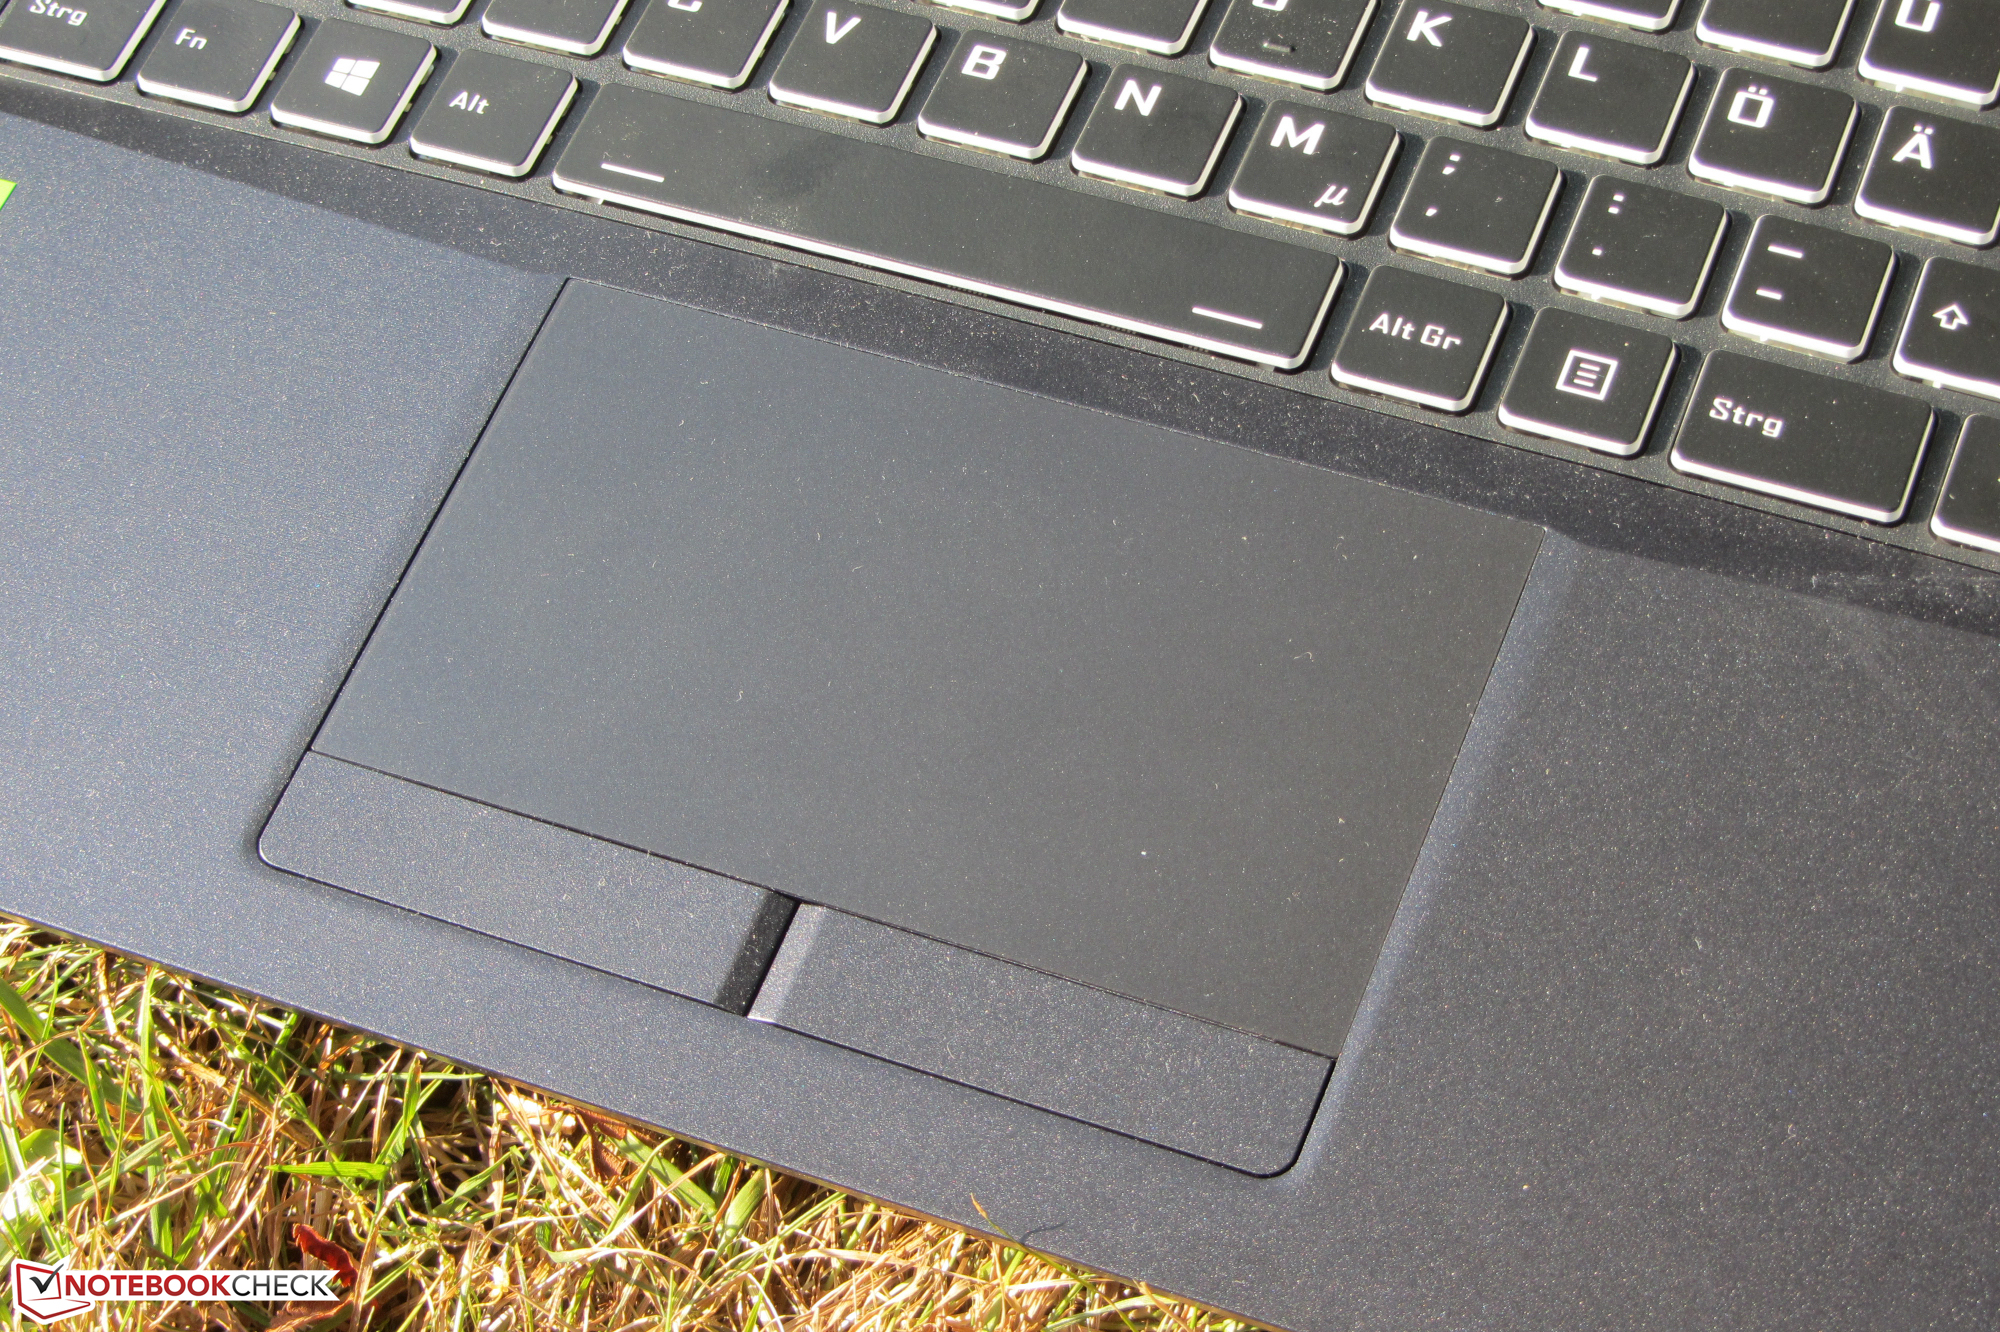
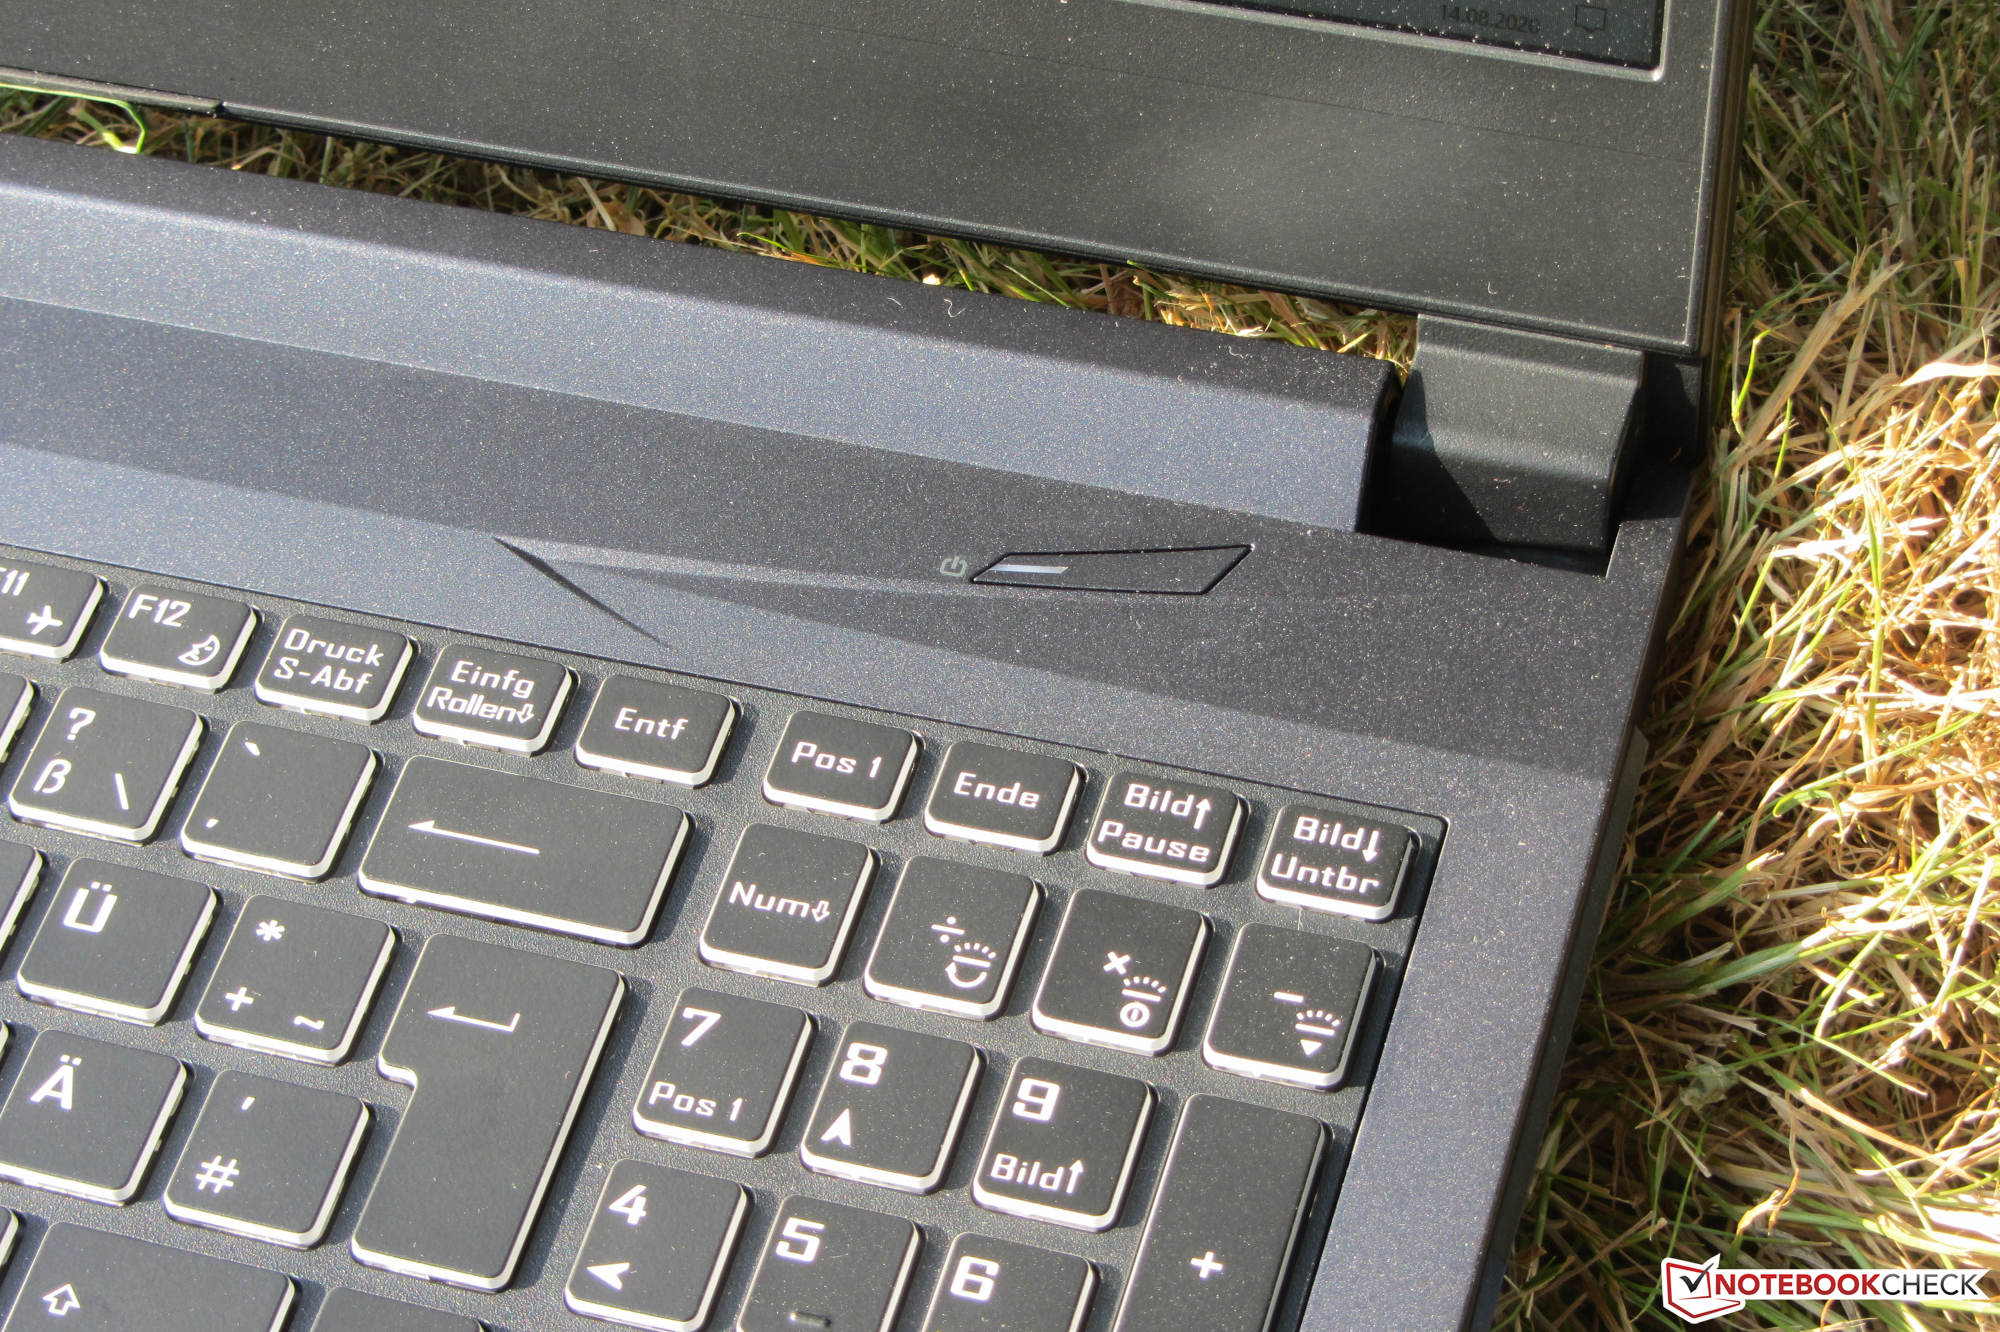
A tela Full HD IPS oferece ângulos de visão estáveis, uma superfície mate, bom contraste e uma reprodução de cores decente. Mas o brilho máximo é muito baixo. A cobertura do espaço de cores não causa entusiasmo. Além disso, o teclado embutido (iluminação RGB) provou ser adequado para o uso diário, enquanto a duração da bateria acabou sendo muito decente.
Nexoc GH5 515IG
- 08/19/2020 v7 (old)
Sascha Mölck
Price comparison
