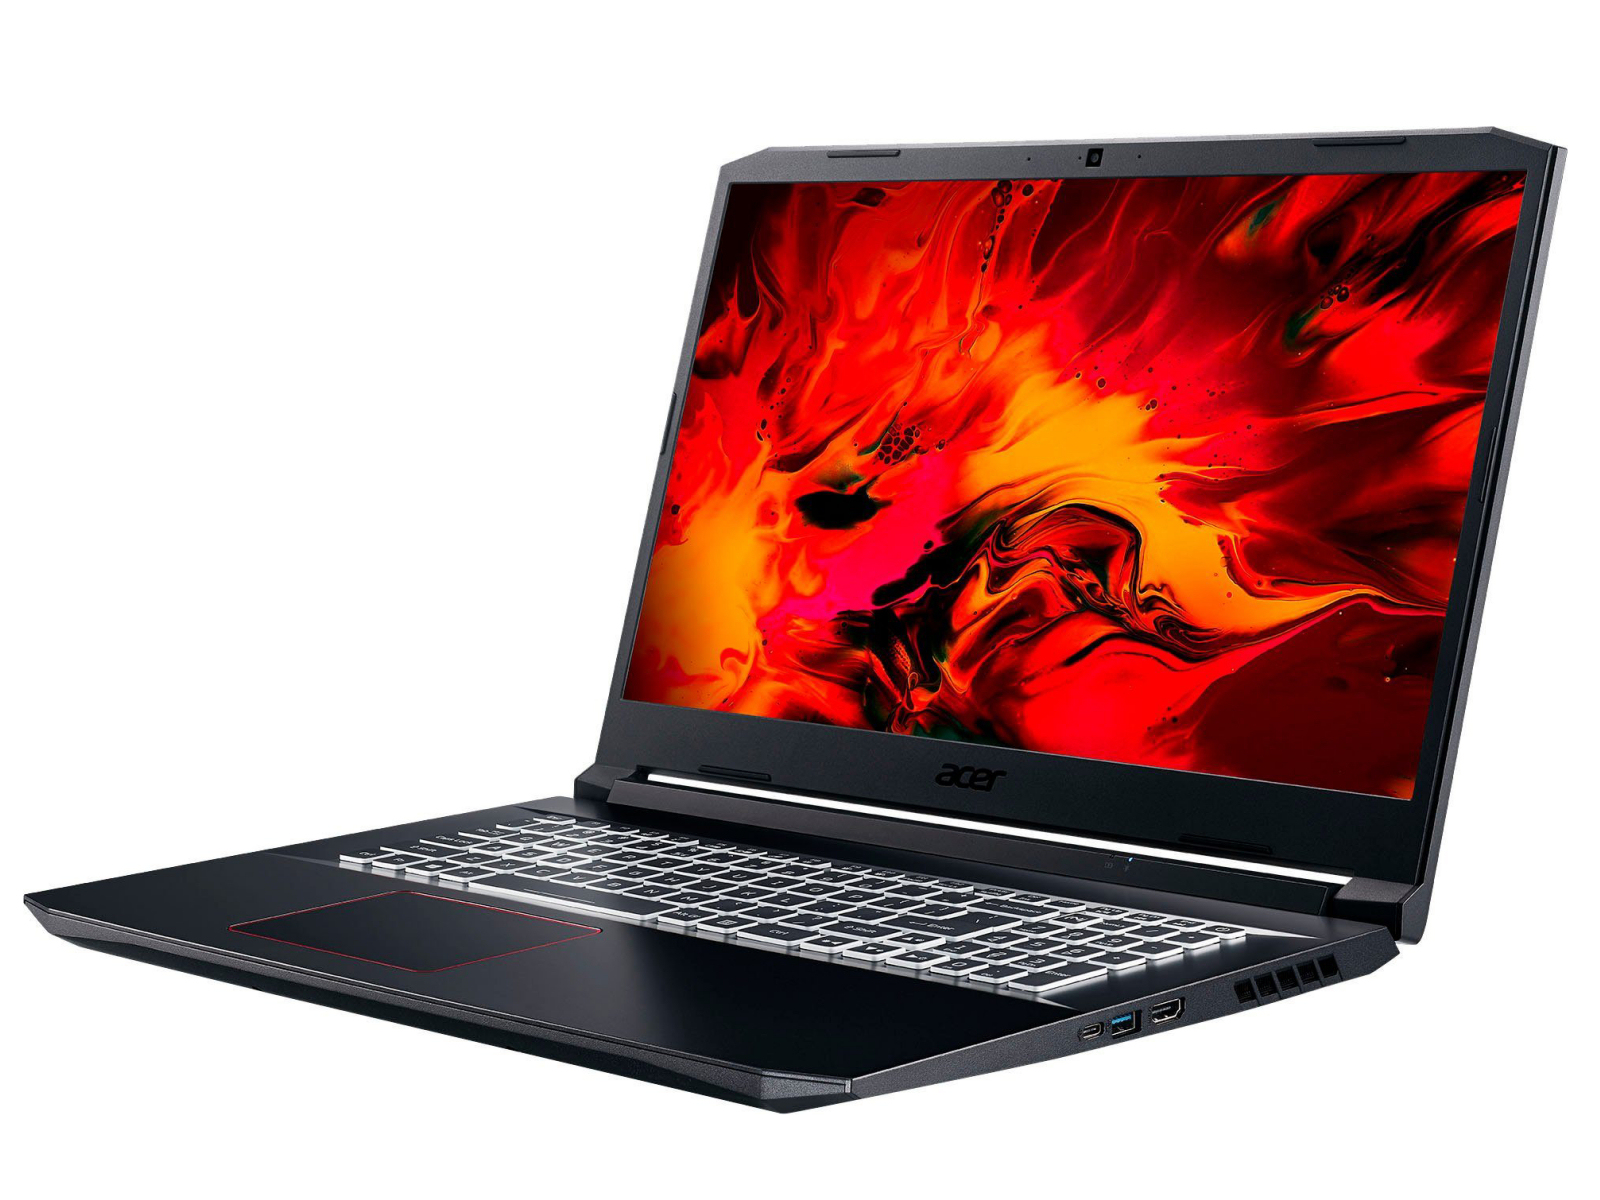
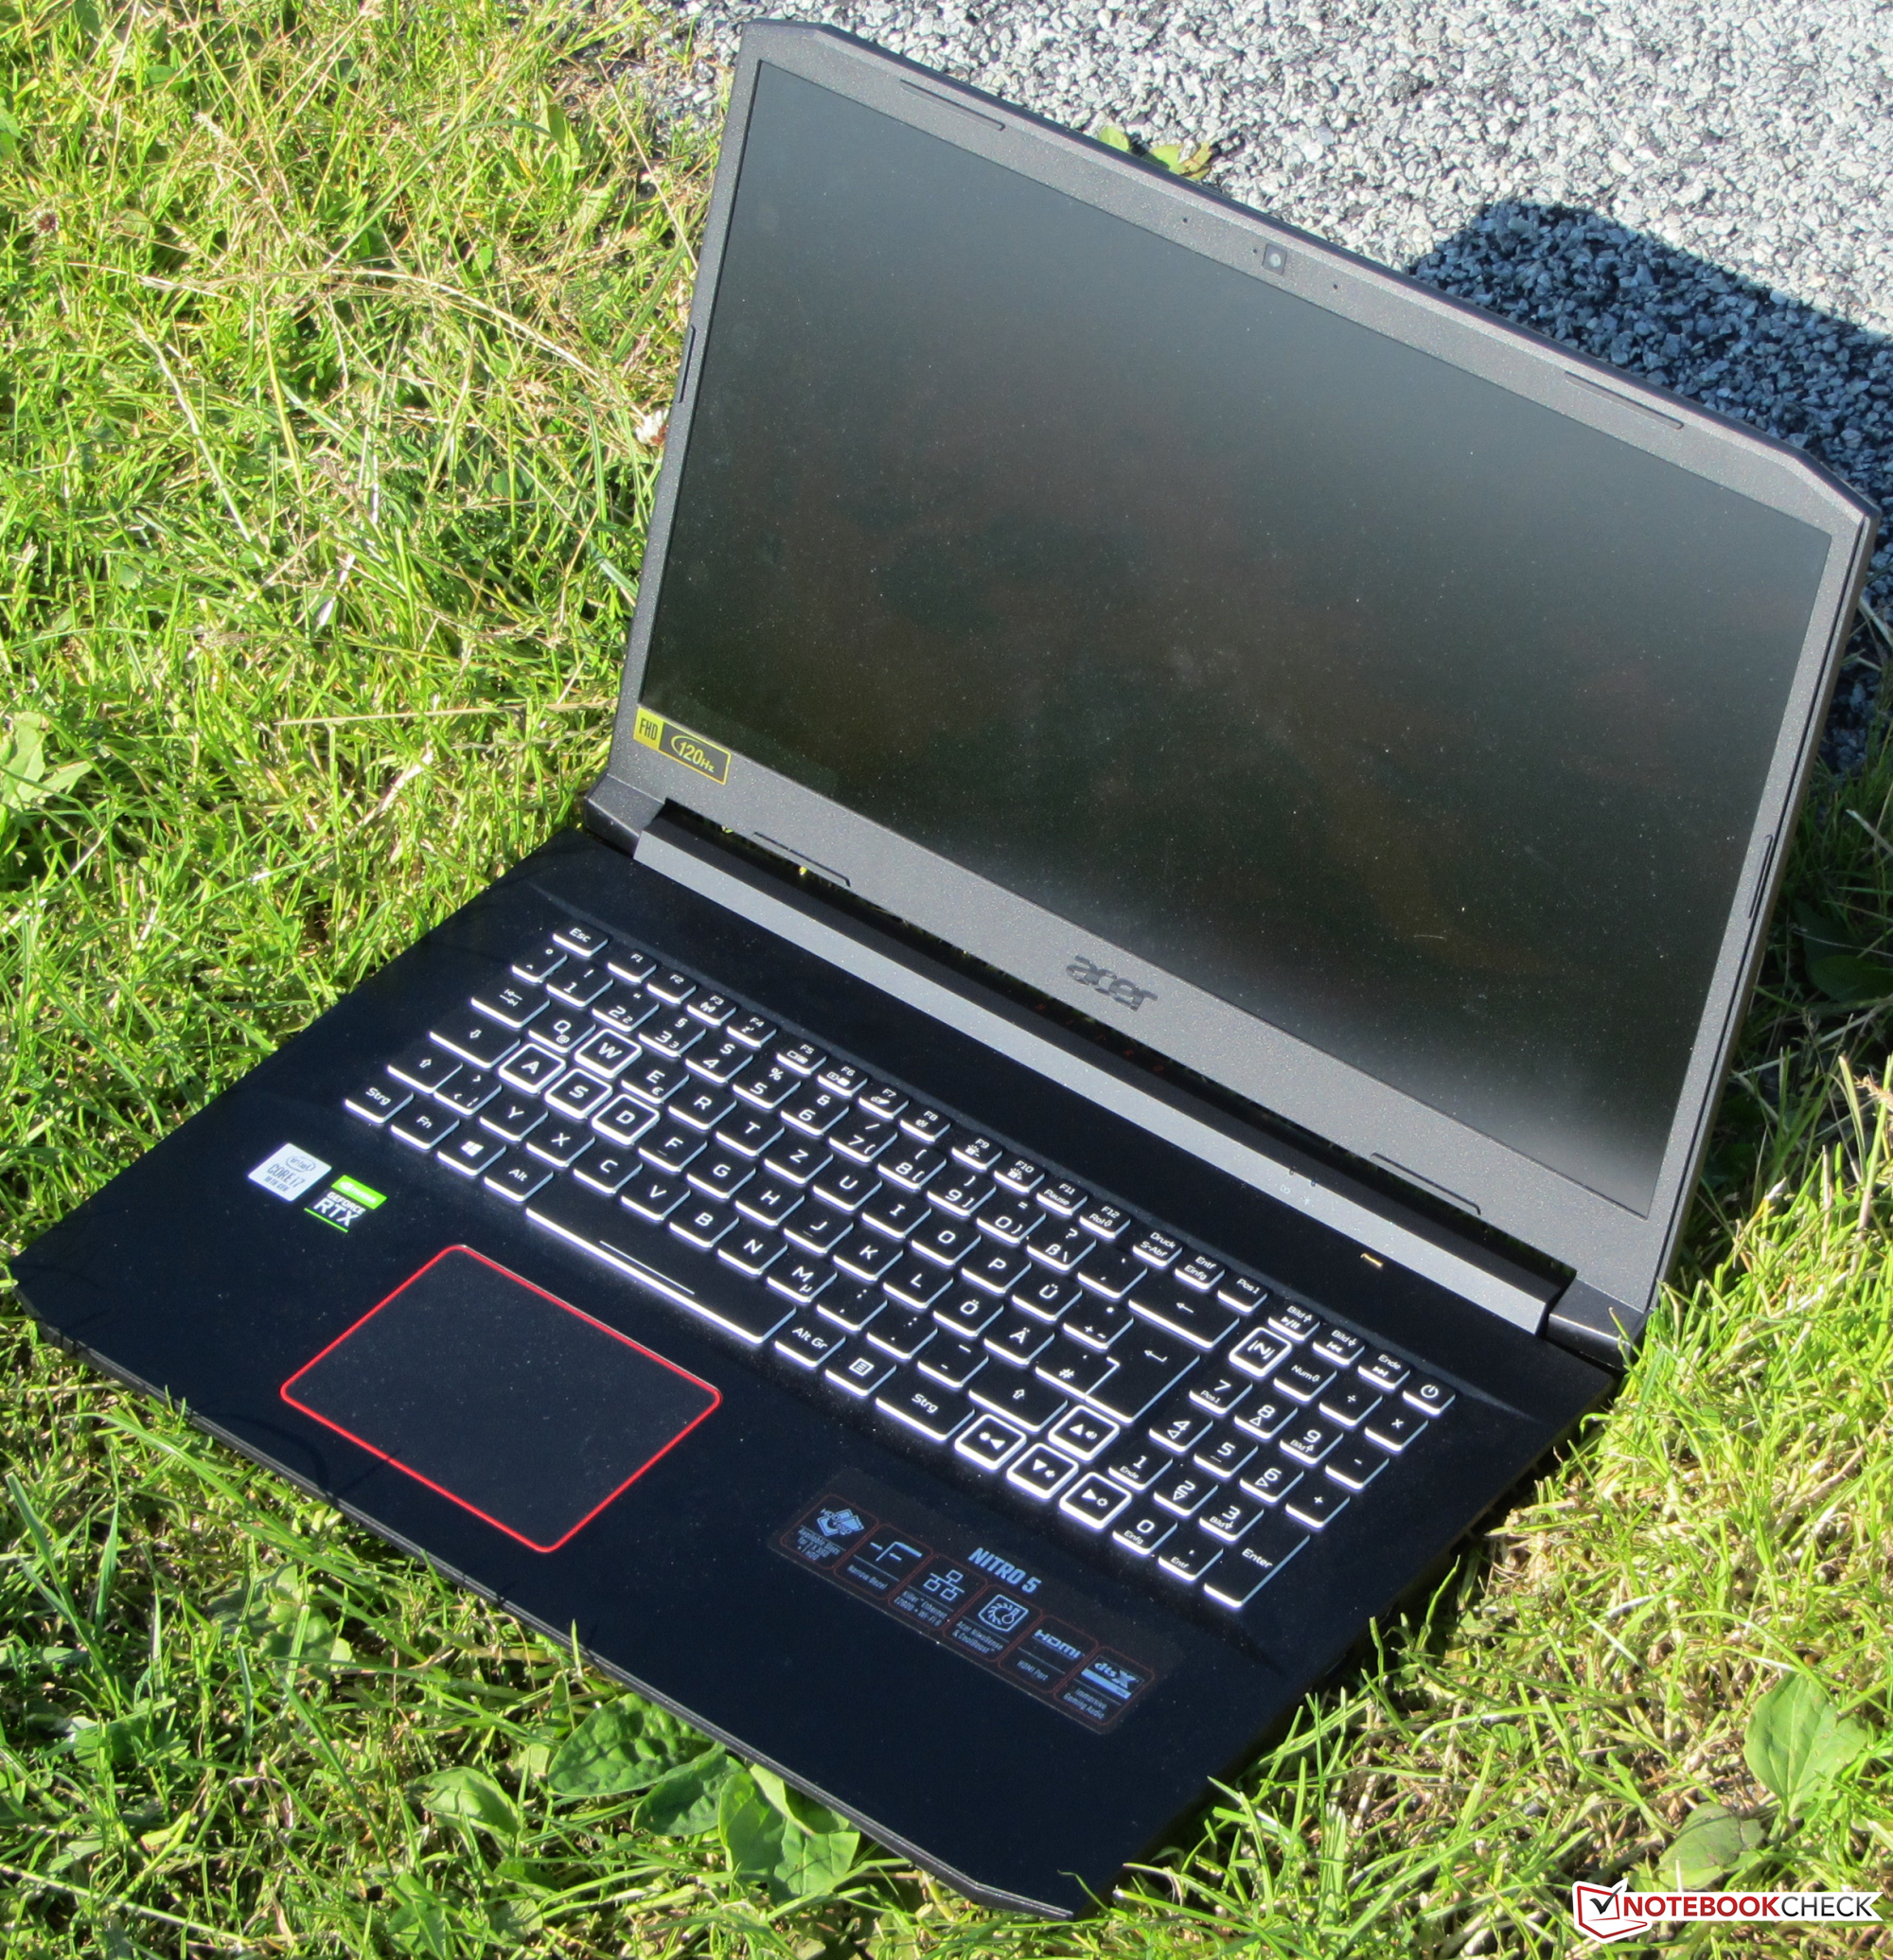
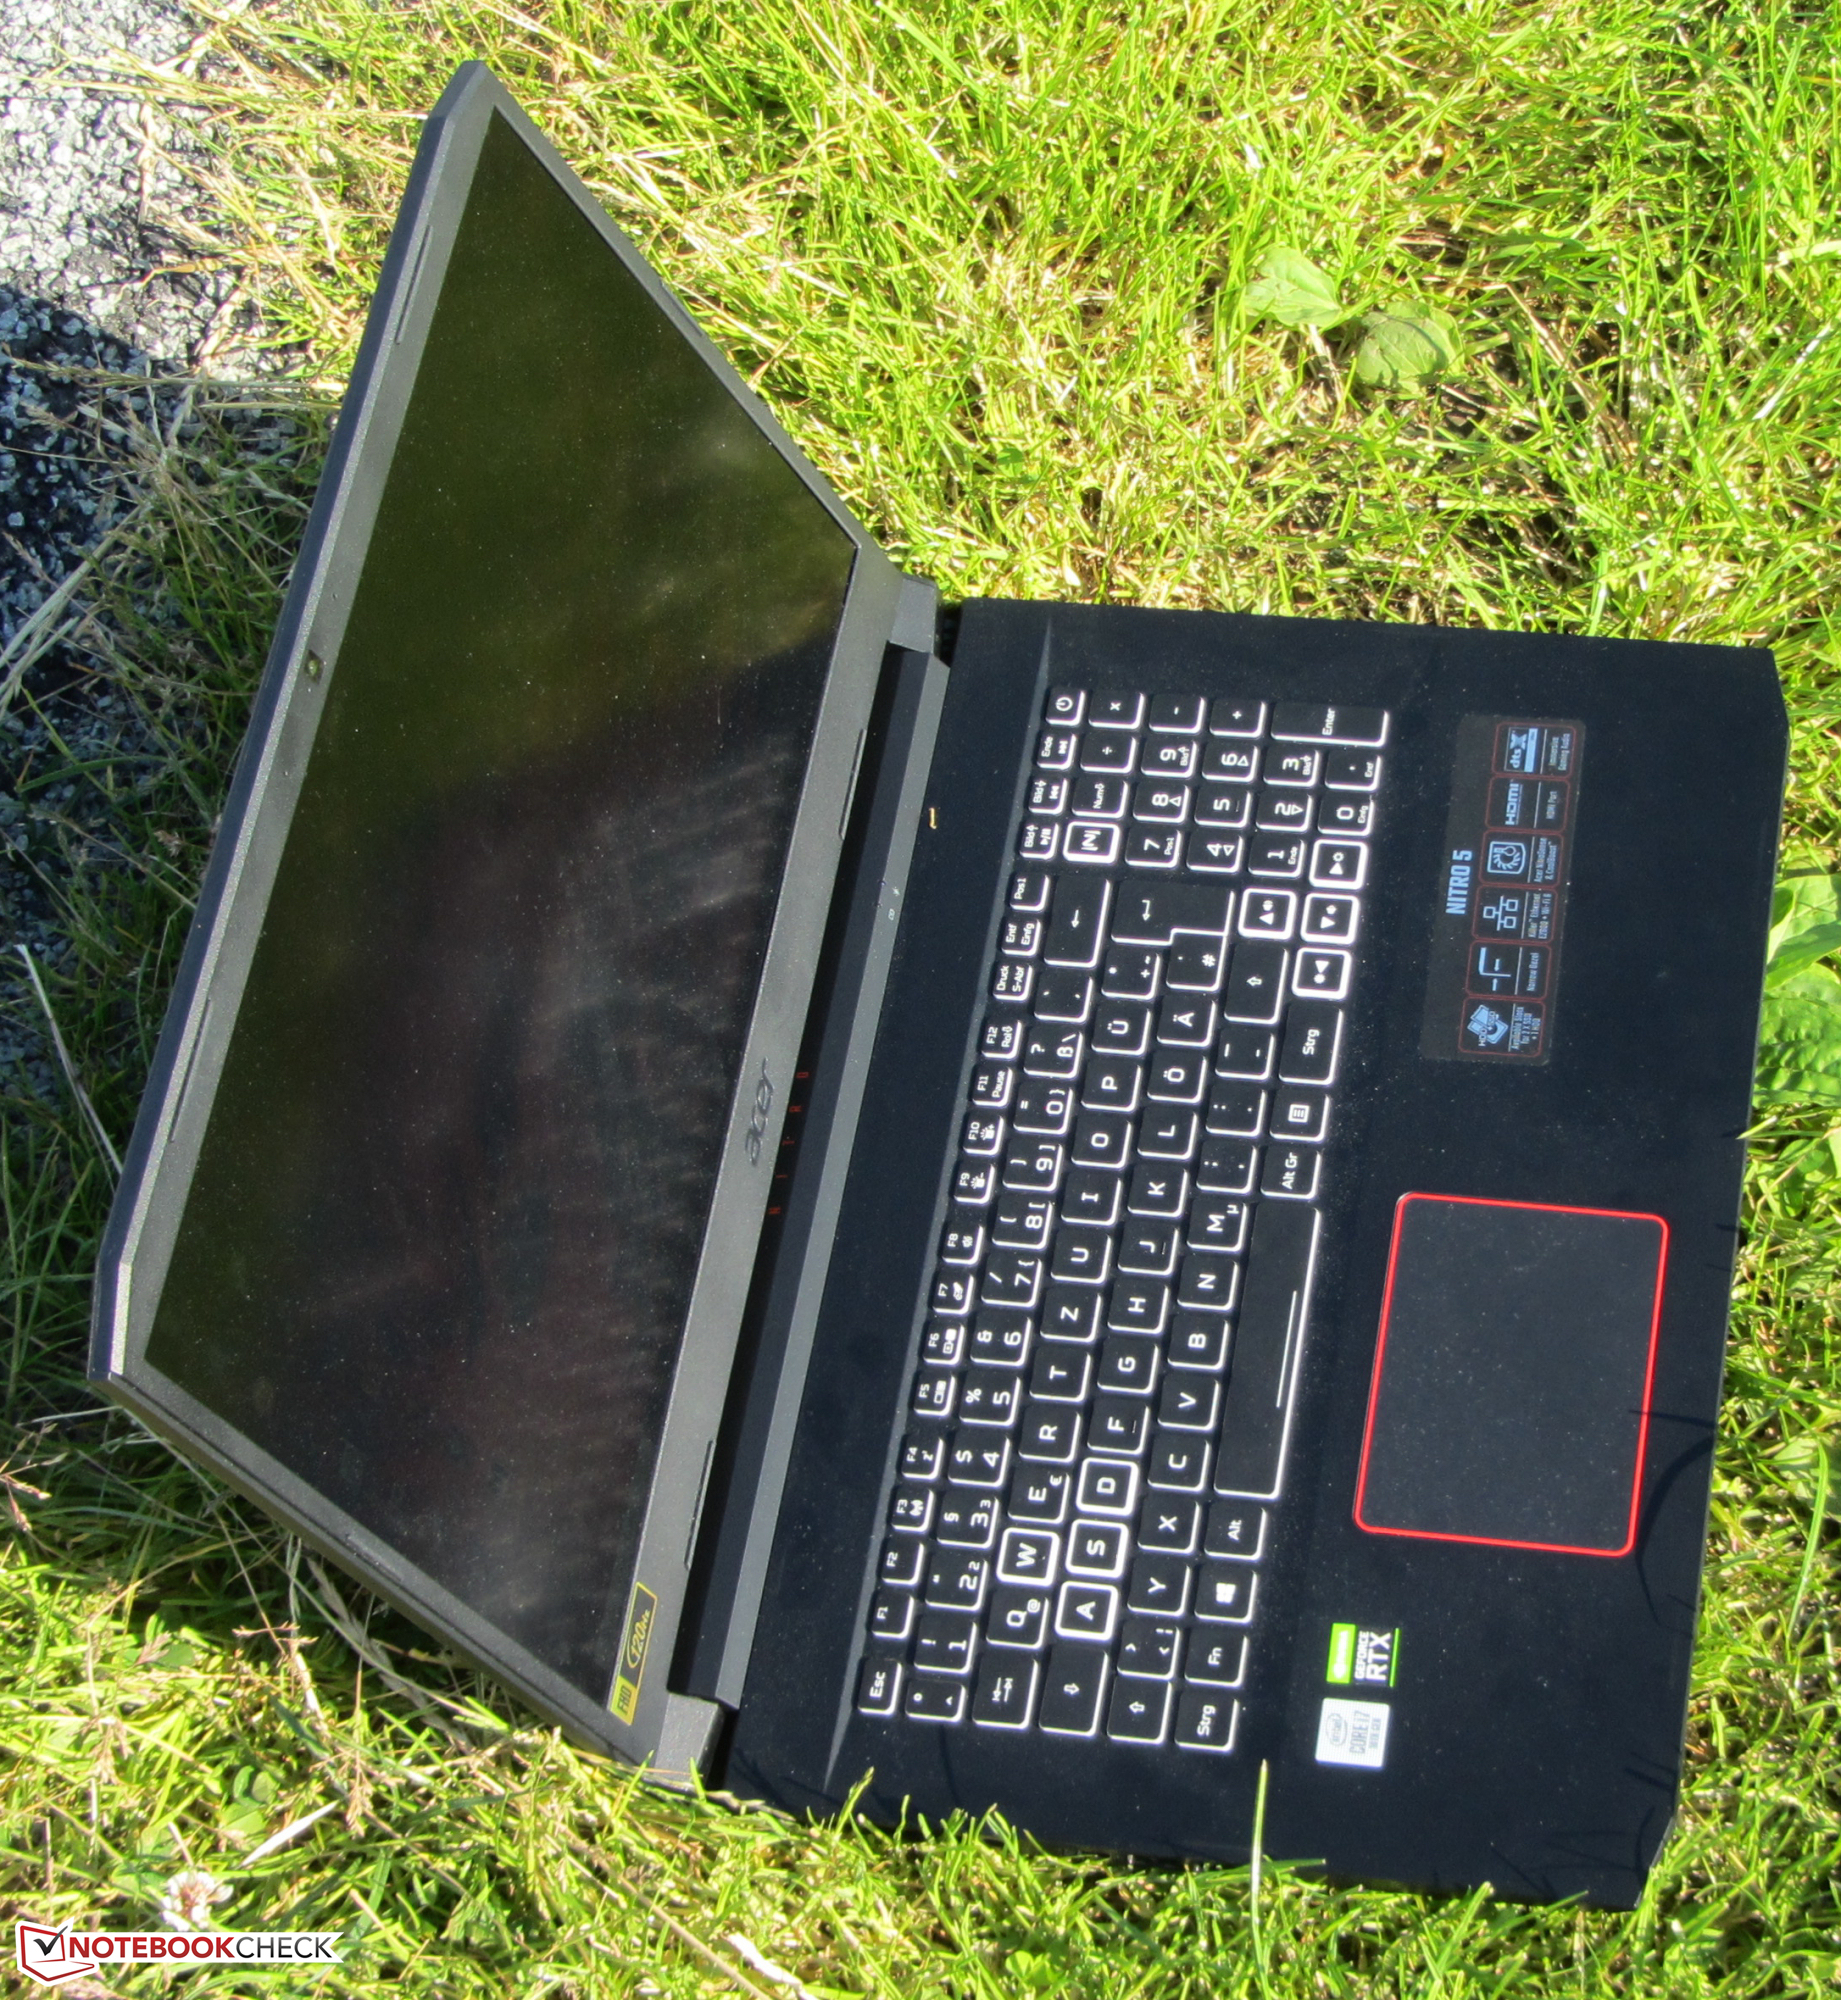
Breve Análise do Acer Nitro 5 AN517-52: O muito versátil portátil para jogos oferece uma duração de bateria decente
Avaliação | Data | Modelo | Peso | Altura | Size | Resolução | Preço |
|---|---|---|---|---|---|---|---|
| 80.6 % v7 (old) | 06/2020 | Acer Nitro 5 AN517-52-77DS i7-10750H, GeForce RTX 2060 Mobile | 2.2 kg | 24.9 mm | 17.30" | 1920x1080 | |
| 82.9 % v7 (old) | 05/2020 | Asus TUF A17 FA706IU-AS76 R7 4800H, GeForce GTX 1660 Ti Mobile | 2.6 kg | 26 mm | 17.30" | 1920x1080 | |
| 83.2 % v7 (old) | 03/2020 | Schenker XMG Pro 17 PB71RD-G i7-9750H, GeForce RTX 2060 Mobile | 2.8 kg | 30 mm | 17.30" | 1920x1080 | |
| 81.6 % v7 (old) | 07/2019 | HP Pavilion Gaming 17-cd0085cl i7-9750H, GeForce GTX 1660 Ti Max-Q | 2.8 kg | 25 mm | 17.30" | 1920x1080 | |
| 82.3 % v7 (old) | Lenovo Legion Y540-17IRH i5-9300H, GeForce GTX 1660 Ti Mobile | 2.8 kg | 26.3 mm | 17.30" | 1920x1080 |
| Networking | |
| iperf3 transmit AX12 | |
| Schenker XMG Pro 17 PB71RD-G | |
| Média Intel Wi-Fi 6 AX201 (49.8 - 1775, n=324) | |
| Lenovo Legion Y540-17IRH | |
| Acer Nitro 5 AN517-52-77DS | |
| HP Pavilion Gaming 17-cd0085cl | |
| Acer Aspire Nitro 5 AN517-51-7887 | |
| Asus TUF A17 FA706IU-AS76 | |
| iperf3 receive AX12 | |
| Schenker XMG Pro 17 PB71RD-G | |
| Média Intel Wi-Fi 6 AX201 (136 - 1743, n=324) | |
| Acer Nitro 5 AN517-52-77DS | |
| Lenovo Legion Y540-17IRH | |
| Acer Aspire Nitro 5 AN517-51-7887 | |
| HP Pavilion Gaming 17-cd0085cl | |
| Asus TUF A17 FA706IU-AS76 | |


| |||||||||||||||||||||||||
iluminação: 85 %
iluminação com acumulador: 263 cd/m²
Contraste: 560:1 (Preto: 0.47 cd/m²)
ΔE ColorChecker Calman: 5.07 | ∀{0.5-29.43 Ø4.71}
calibrated: 4.9
ΔE Greyscale Calman: 2.55 | ∀{0.09-98 Ø4.96}
59% sRGB (Argyll 1.6.3 3D)
37% AdobeRGB 1998 (Argyll 1.6.3 3D)
40.77% AdobeRGB 1998 (Argyll 3D)
58.9% sRGB (Argyll 3D)
39.47% Display P3 (Argyll 3D)
Gamma: 2.37
CCT: 6446 K
| Acer Nitro 5 AN517-52-77DS IPS, 1920x1080, 17.3" | Asus TUF A17 FA706IU-AS76 IPS, 1920x1080, 17.3" | Lenovo Legion Y540-17IRH IPS, 1920x1080, 17.3" | Schenker XMG Pro 17 PB71RD-G IPS, 1920x1080, 17.3" | HP Pavilion Gaming 17-cd0085cl IPS, 1920x1080, 17.3" | Acer Aspire Nitro 5 AN517-51-7887 IPS, 1920x1080, 17.3" | |
|---|---|---|---|---|---|---|
| Display | 2% | 72% | 56% | 57% | 57% | |
| Display P3 Coverage (%) | 39.47 | 40.55 3% | 69 75% | 62.8 59% | 63.3 60% | 62.7 59% |
| sRGB Coverage (%) | 58.9 | 59.7 1% | 98.3 67% | 89.8 52% | 90.2 53% | 92.5 57% |
| AdobeRGB 1998 Coverage (%) | 40.77 | 41.89 3% | 70.7 73% | 64.2 57% | 64.3 58% | 63.5 56% |
| Response Times | 31% | 50% | 53% | 18% | -3% | |
| Response Time Grey 50% / Grey 80% * (ms) | 35 ? | 22.4 ? 36% | 18 ? 49% | 16.8 ? 52% | 31.6 ? 10% | 37 ? -6% |
| Response Time Black / White * (ms) | 26 ? | 19.2 ? 26% | 12.8 ? 51% | 12 ? 54% | 19.6 ? 25% | 26 ? -0% |
| PWM Frequency (Hz) | ||||||
| Screen | 15% | 44% | 27% | 28% | 25% | |
| Brightness middle (cd/m²) | 263 | 264.8 1% | 286 9% | 274 4% | 299.6 14% | 407 55% |
| Brightness (cd/m²) | 246 | 253 3% | 282 15% | 273 11% | 285 16% | 364 48% |
| Brightness Distribution (%) | 85 | 90 6% | 87 2% | 95 12% | 86 1% | 84 -1% |
| Black Level * (cd/m²) | 0.47 | 0.31 34% | 0.19 60% | 0.26 45% | 0.33 30% | 0.3 36% |
| Contrast (:1) | 560 | 854 53% | 1505 169% | 1054 88% | 908 62% | 1357 142% |
| Colorchecker dE 2000 * | 5.07 | 4.73 7% | 3.57 30% | 4.62 9% | 3.68 27% | 4.55 10% |
| Colorchecker dE 2000 max. * | 20.5 | 18.89 8% | 7.5 63% | 7.66 63% | 8.05 61% | 12.44 39% |
| Colorchecker dE 2000 calibrated * | 4.9 | 4.64 5% | 1.31 73% | 1.93 61% | 3.15 36% | |
| Greyscale dE 2000 * | 2.55 | 1.4 45% | 4.51 -77% | 5.3 -108% | 3.8 -49% | 7.61 -198% |
| Gamma | 2.37 93% | 2.16 102% | 2.36 93% | 2.34 94% | 2.12 104% | 2.51 88% |
| CCT | 6446 101% | 6641 98% | 7411 88% | 7619 85% | 7240 90% | 7212 90% |
| Color Space (Percent of AdobeRGB 1998) (%) | 37 | 38.4 4% | 64 73% | 58 57% | 58.1 57% | 59 59% |
| Color Space (Percent of sRGB) (%) | 59 | 59.3 1% | 98 66% | 90 53% | 89.8 52% | 92 56% |
| Média Total (Programa/Configurações) | 16% /
15% | 55% /
50% | 45% /
36% | 34% /
32% | 26% /
27% |
* ... menor é melhor
Exibir tempos de resposta
| ↔ Tempo de resposta preto para branco | ||
|---|---|---|
| 26 ms ... ascensão ↗ e queda ↘ combinadas | ↗ 14 ms ascensão | 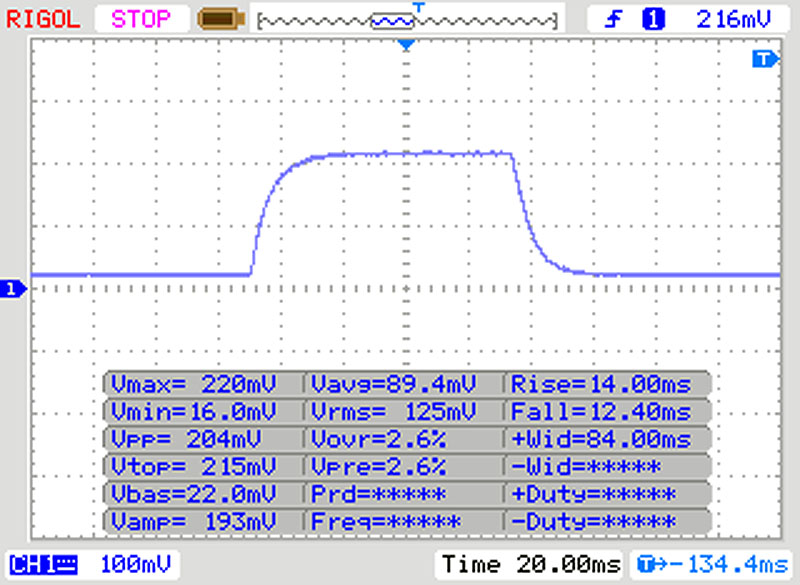 |
| ↘ 12 ms queda | ||
| A tela mostra taxas de resposta relativamente lentas em nossos testes e pode ser muito lenta para os jogadores. Em comparação, todos os dispositivos testados variam de 0.1 (mínimo) a 240 (máximo) ms. » 63 % de todos os dispositivos são melhores. Isso significa que o tempo de resposta medido é pior que a média de todos os dispositivos testados (19.8 ms). | ||
| ↔ Tempo de resposta 50% cinza a 80% cinza | ||
| 35 ms ... ascensão ↗ e queda ↘ combinadas | ↗ 17 ms ascensão | 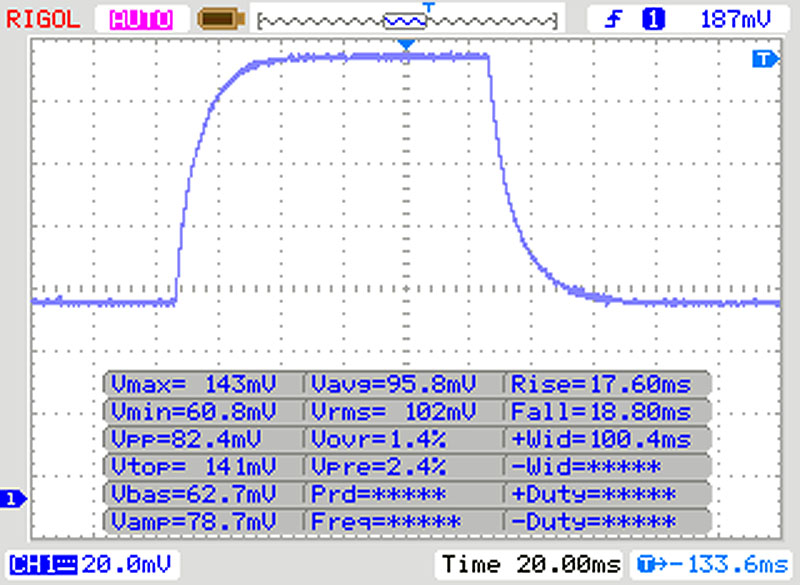 |
| ↘ 18 ms queda | ||
| A tela mostra taxas de resposta lentas em nossos testes e será insatisfatória para os jogadores. Em comparação, todos os dispositivos testados variam de 0.165 (mínimo) a 636 (máximo) ms. » 49 % de todos os dispositivos são melhores. Isso significa que o tempo de resposta medido é pior que a média de todos os dispositivos testados (30.9 ms). | ||
Cintilação da tela / PWM (modulação por largura de pulso)
| Tela tremeluzindo / PWM não detectado | 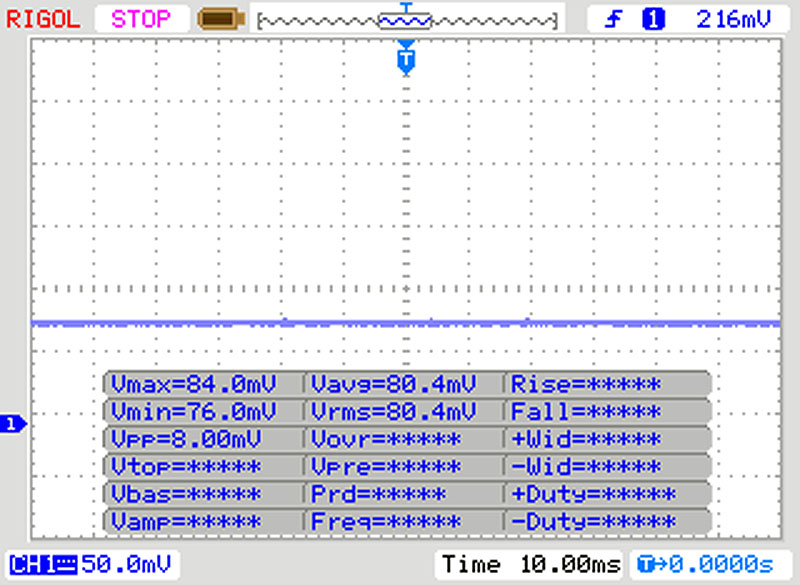 | ||
[pwm_comparison] Em comparação: 52 % de todos os dispositivos testados não usam PWM para escurecer a tela. Se PWM foi detectado, uma média de 7744 (mínimo: 5 - máximo: 343500) Hz foi medida. | |||
| Cinebench R20 | |
| CPU (Single Core) | |
| Média da turma Gaming (622 - 913, n=103, últimos 2 anos) | |
| Acer Nitro 5 AN517-52-77DS | |
| Asus TUF A17 FA706IU-AS76 | |
| Média Intel Core i7-10750H (431 - 504, n=43) | |
| Acer Aspire Nitro 5 AN517-51-7887 | |
| Lenovo Legion Y540-17IRH | |
| Schenker XMG Pro 17 PB71RD-G | |
| CPU (Multi Core) | |
| Média da turma Gaming (4029 - 16433, n=103, últimos 2 anos) | |
| Asus TUF A17 FA706IU-AS76 | |
| Acer Nitro 5 AN517-52-77DS | |
| Média Intel Core i7-10750H (1749 - 3325, n=43) | |
| Schenker XMG Pro 17 PB71RD-G | |
| Acer Aspire Nitro 5 AN517-51-7887 | |
| Lenovo Legion Y540-17IRH | |
| LibreOffice - 20 Documents To PDF | |
| Asus TUF A17 FA706IU-AS76 | |
| Média Intel Core i7-10750H (43.1 - 99.2, n=43) | |
| Acer Nitro 5 AN517-52-77DS | |
| Média da turma Gaming (33.2 - 88.8, n=102, últimos 2 anos) | |
* ... menor é melhor
| PCMark 8 Home Score Accelerated v2 | 3836 pontos | |
| PCMark 8 Creative Score Accelerated v2 | 4075 pontos | |
| PCMark 8 Work Score Accelerated v2 | 5552 pontos | |
| PCMark 10 Score | 5201 pontos | |
Ajuda | ||
| PCMark 8 | |
| Home Score Accelerated v2 | |
| Média da turma Gaming (n=1últimos 2 anos) | |
| Lenovo Legion Y540-17IRH | |
| Acer Aspire Nitro 5 AN517-51-7887 | |
| Asus TUF A17 FA706IU-AS76 | |
| Média Intel Core i7-10750H, NVIDIA GeForce RTX 2060 Mobile (3836 - 4539, n=6) | |
| HP Pavilion Gaming 17-cd0085cl | |
| Acer Nitro 5 AN517-52-77DS | |
| Work Score Accelerated v2 | |
| Asus TUF A17 FA706IU-AS76 | |
| Média Intel Core i7-10750H, NVIDIA GeForce RTX 2060 Mobile (5405 - 5928, n=6) | |
| Acer Nitro 5 AN517-52-77DS | |
| Acer Aspire Nitro 5 AN517-51-7887 | |
| HP Pavilion Gaming 17-cd0085cl | |
| Lenovo Legion Y540-17IRH | |
| Média da turma Gaming (n=1últimos 2 anos) | |
| DPC Latencies / LatencyMon - interrupt to process latency (max), Web, Youtube, Prime95 | |
| Asus TUF A17 FA706IU-AS76 | |
| Acer Nitro 5 AN517-52-77DS | |
* ... menor é melhor

| Acer Nitro 5 AN517-52-77DS WDC PC SN530 SDBPNPZ-1T00 | Asus TUF A17 FA706IU-AS76 Intel SSD 660p 1TB SSDPEKNW010T8 | Lenovo Legion Y540-17IRH WDC PC SN520 SDAPNUW-512G | Schenker XMG Pro 17 PB71RD-G Samsung SSD 970 EVO Plus 500GB | HP Pavilion Gaming 17-cd0085cl Samsung SSD PM981 MZVLB256HAHQ | Acer Aspire Nitro 5 AN517-51-7887 WDC PC SN520 SDAPNUW-512G | Média WDC PC SN530 SDBPNPZ-1T00 | |
|---|---|---|---|---|---|---|---|
| CrystalDiskMark 5.2 / 6 | 10% | -27% | 22% | 16% | -21% | 16% | |
| Write 4K (MB/s) | 140 | 189.7 36% | 105.1 -25% | 117.5 -16% | 135.3 -3% | 104.6 -25% | 182.7 ? 31% |
| Read 4K (MB/s) | 49.04 | 62.3 27% | 34.41 -30% | 46.47 -5% | 63.7 30% | 39.76 -19% | 48.6 ? -1% |
| Write Seq (MB/s) | 1963 | 1681 -14% | 1298 -34% | 1345 -31% | 1337 -32% | 1268 -35% | 1979 ? 1% |
| Read Seq (MB/s) | 1455 | 1608 11% | 1099 -24% | 2804 93% | 1617 11% | 1414 -3% | 1828 ? 26% |
| Write 4K Q32T1 (MB/s) | 398.2 | 468.6 18% | 335.7 -16% | 368.2 -8% | 568 43% | 287.9 -28% | 498 ? 25% |
| Read 4K Q32T1 (MB/s) | 461.9 | 541 17% | 231.4 -50% | 412.9 -11% | 645 40% | 381.1 -17% | 573 ? 24% |
| Write Seq Q32T1 (MB/s) | 1969 | 1770 -10% | 1454 -26% | 3248 65% | 1428 -27% | 1319 -33% | 1980 ? 1% |
| Read Seq Q32T1 (MB/s) | 1927 | 1898 -2% | 1740 -10% | 3559 85% | 3184 65% | 1735 -10% | 2336 ? 21% |
Continuous load read: DiskSpd Read Loop, Queue Depth 8
| 3DMark 06 Standard Score | 38509 pontos | |
| 3DMark 11 Performance | 18057 pontos | |
| 3DMark Ice Storm Standard Score | 117009 pontos | |
| 3DMark Cloud Gate Standard Score | 31601 pontos | |
| 3DMark Fire Strike Score | 14191 pontos | |
| 3DMark Time Spy Score | 5759 pontos | |
Ajuda | ||
| The Witcher 3 - 1920x1080 Ultra Graphics & Postprocessing (HBAO+) | |
| Média da turma Gaming (104.7 - 240, n=7, últimos 2 anos) | |
| Acer Nitro 5 AN517-52-77DS | |
| Média NVIDIA GeForce RTX 2060 Mobile (50.6 - 74, n=40) | |
| Schenker XMG Pro 17 PB71RD-G | |
| Lenovo Legion Y740-17IRH | |
| Asus TUF A17 FA706IU-AS76 | |
| Acer Aspire Nitro 5 AN517-51-7887 | |
| Lenovo Legion Y540-17IRH | |
| HP Pavilion Gaming 17-cd0085cl | |
| BioShock Infinite - 1920x1080 Ultra Preset, DX11 (DDOF) | |
| Lenovo Legion Y740-17IRH | |
| Média NVIDIA GeForce RTX 2060 Mobile (119 - 156, n=17) | |
| Acer Nitro 5 AN517-52-77DS | |
| Lenovo Legion Y540-17IRH | |
| Acer Aspire Nitro 5 AN517-51-7887 | |
| HP Pavilion Gaming 17-cd0085cl | |
| Shadow of the Tomb Raider - 1920x1080 Highest Preset AA:T | |
| Média da turma Gaming (96 - 116, n=2, últimos 2 anos) | |
| Lenovo Legion Y740-17IRH | |
| Média NVIDIA GeForce RTX 2060 Mobile (54 - 86, n=22) | |
| Asus TUF A17 FA706IU-AS76 | |
| Acer Nitro 5 AN517-52-77DS | |
| HP Pavilion Gaming 17-cd0085cl | |
| baixo | média | alto | ultra | |
|---|---|---|---|---|
| BioShock Infinite (2013) | 327.4 | 285.5 | 263.5 | 138.4 |
| The Witcher 3 (2015) | 277 | 188.3 | 108.9 | 63 |
| Dota 2 Reborn (2015) | 146.1 | 133.9 | 123.8 | 116.8 |
| X-Plane 11.11 (2018) | 98.3 | 84.1 | 75.8 | |
| Shadow of the Tomb Raider (2018) | 114 | 89 | 82 | 73 |
| Metro Exodus (2019) | 142.4 | 75.9 | 56.6 | 44.5 |
| Total War: Three Kingdoms (2019) | 229.6 | 107.4 | 66.9 | 46.3 |
| Control (2019) | 201.9 | 74.9 | 54.6 | |
| Borderlands 3 (2019) | 133 | 86.9 | 62.2 | 47.7 |
| Call of Duty Modern Warfare 2019 (2019) | 133.5 | 90.2 | 74.3 | 65.5 |
| Red Dead Redemption 2 (2019) | 116.9 | 76.1 | 50.7 | 32.5 |
| Escape from Tarkov (2020) | 121 | 121 | 117.5 | 103.3 |
| Hunt Showdown (2020) | 170.6 | 94.2 | 75 | |
| Doom Eternal (2020) | 195.6 | 125.4 | 112.4 | 108.9 |
| Gears Tactics (2020) | 236.1 | 145.6 | 93.3 | 60.7 |
Barulho
| Ocioso |
| 30.2 / 30.2 / 30.2 dB |
| Carga |
| 41.5 / 44.6 dB |
 | ||
30 dB silencioso 40 dB(A) audível 50 dB(A) ruidosamente alto |
||
min: | ||
| Acer Nitro 5 AN517-52-77DS i7-10750H, GeForce RTX 2060 Mobile | Asus TUF A17 FA706IU-AS76 R7 4800H, GeForce GTX 1660 Ti Mobile | Schenker XMG Pro 17 PB71RD-G i7-9750H, GeForce RTX 2060 Mobile | Lenovo Legion Y540-17IRH i5-9300H, GeForce GTX 1660 Ti Mobile | HP Pavilion Gaming 17-cd0085cl i7-9750H, GeForce GTX 1660 Ti Max-Q | Acer Aspire Nitro 5 AN517-51-7887 i7-9750H, GeForce GTX 1660 Ti Mobile | Média NVIDIA GeForce RTX 2060 Mobile | Média da turma Gaming | |
|---|---|---|---|---|---|---|---|---|
| Noise | -5% | -14% | -7% | 7% | -3% | -3% | 3% | |
| desligado / ambiente * (dB) | 30.2 | 28.7 5% | 30 1% | 30 1% | 28.2 7% | 30 1% | 27.9 ? 8% | 24.1 ? 20% |
| Idle Minimum * (dB) | 30.2 | 28.7 5% | 30 1% | 30 1% | 30.1 -0% | 30.2 -0% | 29 ? 4% | 25.9 ? 14% |
| Idle Average * (dB) | 30.2 | 30.5 -1% | 32 -6% | 32 -6% | 30.1 -0% | 30.2 -0% | 30 ? 1% | 27.4 ? 9% |
| Idle Maximum * (dB) | 30.2 | 32.5 -8% | 39 -29% | 34 -13% | 30.1 -0% | 31 -3% | 33 ? -9% | 30.1 ? -0% |
| Load Average * (dB) | 41.5 | 42.5 -2% | 51 -23% | 44 -6% | 34.2 18% | 43.4 -5% | 44 ? -6% | 43.7 ? -5% |
| Witcher 3 ultra * (dB) | 44.5 | 50.1 -13% | 54 -21% | 50 -12% | 34.2 23% | 48.5 -9% | ||
| Load Maximum * (dB) | 44.6 | 53.4 -20% | 54 -21% | 52 -17% | 43.8 2% | 45.5 -2% | 51.6 ? -16% | 54.3 ? -22% |
* ... menor é melhor
(-) A temperatura máxima no lado superior é 50.6 °C / 123 F, em comparação com a média de 40.4 °C / 105 F , variando de 21.2 a 68.8 °C para a classe Gaming.
(-) A parte inferior aquece até um máximo de 53.8 °C / 129 F, em comparação com a média de 43.2 °C / 110 F
(+) Em uso inativo, a temperatura média para o lado superior é 25 °C / 77 F, em comparação com a média do dispositivo de 33.9 °C / ### class_avg_f### F.
(±) Jogando The Witcher 3, a temperatura média para o lado superior é 37.3 °C / 99 F, em comparação com a média do dispositivo de 33.9 °C / ## #class_avg_f### F.
(+) Os apoios para as mãos e o touchpad são mais frios que a temperatura da pele, com um máximo de 26.1 °C / 79 F e, portanto, são frios ao toque.
(+) A temperatura média da área do apoio para as mãos de dispositivos semelhantes foi 28.8 °C / 83.8 F (+2.7 °C / 4.8 F).
| Acer Nitro 5 AN517-52-77DS i7-10750H, GeForce RTX 2060 Mobile | Asus TUF A17 FA706IU-AS76 R7 4800H, GeForce GTX 1660 Ti Mobile | Schenker XMG Pro 17 PB71RD-G i7-9750H, GeForce RTX 2060 Mobile | Lenovo Legion Y740-17IRH i7-9750H, GeForce RTX 2060 Mobile | HP Pavilion Gaming 17-cd0085cl i7-9750H, GeForce GTX 1660 Ti Max-Q | Acer Aspire Nitro 5 AN517-51-7887 i7-9750H, GeForce GTX 1660 Ti Mobile | Média NVIDIA GeForce RTX 2060 Mobile | Média da turma Gaming | |
|---|---|---|---|---|---|---|---|---|
| Heat | -4% | -4% | -3% | -11% | -5% | -7% | -5% | |
| Maximum Upper Side * (°C) | 50.6 | 47.6 6% | 47 7% | 43 15% | 42.6 16% | 51.7 -2% | 47.2 ? 7% | 45.1 ? 11% |
| Maximum Bottom * (°C) | 53.8 | 50.8 6% | 48 11% | 46 14% | 49 9% | 55.4 -3% | 52.7 ? 2% | 48.1 ? 11% |
| Idle Upper Side * (°C) | 26.6 | 33 -24% | 30 -13% | 31 -17% | 34 -28% | 29.1 -9% | 31 ? -17% | 31 ? -17% |
| Idle Bottom * (°C) | 27.8 | 29 -4% | 34 -22% | 34 -22% | 39.4 -42% | 29 -4% | 32.9 ? -18% | 34.2 ? -23% |
* ... menor é melhor
Acer Nitro 5 AN517-52-77DS análise de áudio
(-) | alto-falantes não muito altos (###valor### dB)
Graves 100 - 315Hz
(-) | quase nenhum baixo - em média 22.3% menor que a mediana
(±) | a linearidade dos graves é média (12% delta para a frequência anterior)
Médios 400 - 2.000 Hz
(+) | médios equilibrados - apenas 4.1% longe da mediana
(±) | a linearidade dos médios é média (9.2% delta para frequência anterior)
Altos 2 - 16 kHz
(+) | agudos equilibrados - apenas 2.6% longe da mediana
(+) | os máximos são lineares (6.3% delta da frequência anterior)
Geral 100 - 16.000 Hz
(±) | a linearidade do som geral é média (22.4% diferença em relação à mediana)
Comparado com a mesma classe
» 80% de todos os dispositivos testados nesta classe foram melhores, 6% semelhantes, 14% piores
» O melhor teve um delta de 6%, a média foi 18%, o pior foi 132%
Comparado com todos os dispositivos testados
» 66% de todos os dispositivos testados foram melhores, 6% semelhantes, 29% piores
» O melhor teve um delta de 4%, a média foi 23%, o pior foi 134%
Asus TUF A17 FA706IU-AS76 análise de áudio
(±) | o volume do alto-falante é médio, mas bom (###valor### dB)
Graves 100 - 315Hz
(±) | graves reduzidos - em média 12.7% menor que a mediana
(±) | a linearidade dos graves é média (11.5% delta para a frequência anterior)
Médios 400 - 2.000 Hz
(+) | médios equilibrados - apenas 4.8% longe da mediana
(±) | a linearidade dos médios é média (9.1% delta para frequência anterior)
Altos 2 - 16 kHz
(+) | agudos equilibrados - apenas 3.1% longe da mediana
(±) | a linearidade dos máximos é média (8.7% delta para frequência anterior)
Geral 100 - 16.000 Hz
(±) | a linearidade do som geral é média (23.5% diferença em relação à mediana)
Comparado com a mesma classe
» 85% de todos os dispositivos testados nesta classe foram melhores, 5% semelhantes, 10% piores
» O melhor teve um delta de 6%, a média foi 18%, o pior foi 132%
Comparado com todos os dispositivos testados
» 70% de todos os dispositivos testados foram melhores, 6% semelhantes, 24% piores
» O melhor teve um delta de 4%, a média foi 23%, o pior foi 134%
| desligado | |
| Ocioso | |
| Carga |
|
Key:
min: | |
| Acer Nitro 5 AN517-52-77DS i7-10750H, GeForce RTX 2060 Mobile | Asus TUF A17 FA706IU-AS76 R7 4800H, GeForce GTX 1660 Ti Mobile | Schenker XMG Pro 17 PB71RD-G i7-9750H, GeForce RTX 2060 Mobile | Lenovo Legion Y540-17IRH i5-9300H, GeForce GTX 1660 Ti Mobile | HP Pavilion Gaming 17-cd0085cl i7-9750H, GeForce GTX 1660 Ti Max-Q | Acer Aspire Nitro 5 AN517-51-7887 i7-9750H, GeForce GTX 1660 Ti Mobile | Média NVIDIA GeForce RTX 2060 Mobile | Média da turma Gaming | |
|---|---|---|---|---|---|---|---|---|
| Power Consumption | -15% | -60% | -89% | 5% | 10% | -61% | -81% | |
| Idle Minimum * (Watt) | 5.4 | 7.4 -37% | 11 -104% | 19 -252% | 5.4 -0% | 3.9 28% | 11.5 ? -113% | 13.1 ? -143% |
| Idle Average * (Watt) | 9.8 | 10.5 -7% | 18 -84% | 22 -124% | 9.2 6% | 8.9 9% | 16.5 ? -68% | 19 ? -94% |
| Idle Maximum * (Watt) | 10.9 | 17 -56% | 28 -157% | 30 -175% | 13 -19% | 12.2 -12% | 23.7 ? -117% | 24.6 ? -126% |
| Load Average * (Watt) | 104 | 103.7 -0% | 99 5% | 79 24% | 85.9 17% | 83 20% | 107.5 ? -3% | 111.3 ? -7% |
| Witcher 3 ultra * (Watt) | 134.3 | 128.1 5% | 146 -9% | 134 -0% | 107.9 20% | 130 3% | ||
| Load Maximum * (Watt) | 193 | 183.2 5% | 210 -9% | 201 -4% | 182.2 6% | 168 13% | 199.7 ? -3% | 260 ? -35% |
* ... menor é melhor
| Acer Nitro 5 AN517-52-77DS i7-10750H, GeForce RTX 2060 Mobile, 57.48 Wh | Asus TUF A17 FA706IU-AS76 R7 4800H, GeForce GTX 1660 Ti Mobile, 90 Wh | Lenovo Legion Y540-17IRH i5-9300H, GeForce GTX 1660 Ti Mobile, 57 Wh | Schenker XMG Pro 17 PB71RD-G i7-9750H, GeForce RTX 2060 Mobile, 62 Wh | HP Pavilion Gaming 17-cd0085cl i7-9750H, GeForce GTX 1660 Ti Max-Q, 52.5 Wh | Acer Aspire Nitro 5 AN517-51-7887 i7-9750H, GeForce GTX 1660 Ti Mobile, 57 Wh | Média da turma Gaming | |
|---|---|---|---|---|---|---|---|
| Duração da bateria | 26% | -49% | -42% | -20% | -3% | -9% | |
| Reader / Idle (h) | 11 | 9.1 -17% | 5.2 -53% | 5.2 -53% | 11.6 5% | 13.4 22% | 7.84 ? -29% |
| H.264 (h) | 7.3 | 3.4 -53% | 6.3 -14% | 8.27 ? 13% | |||
| WiFi v1.3 (h) | 6.6 | 8.5 29% | 3.7 -44% | 4.1 -38% | 5.7 -14% | 6.2 -6% | 7.08 ? 7% |
| Load (h) | 2 | 3.3 65% | 1.1 -45% | 1.3 -35% | 1 -50% | 1.7 -15% | 1.496 ? -25% |
Pro
Contra
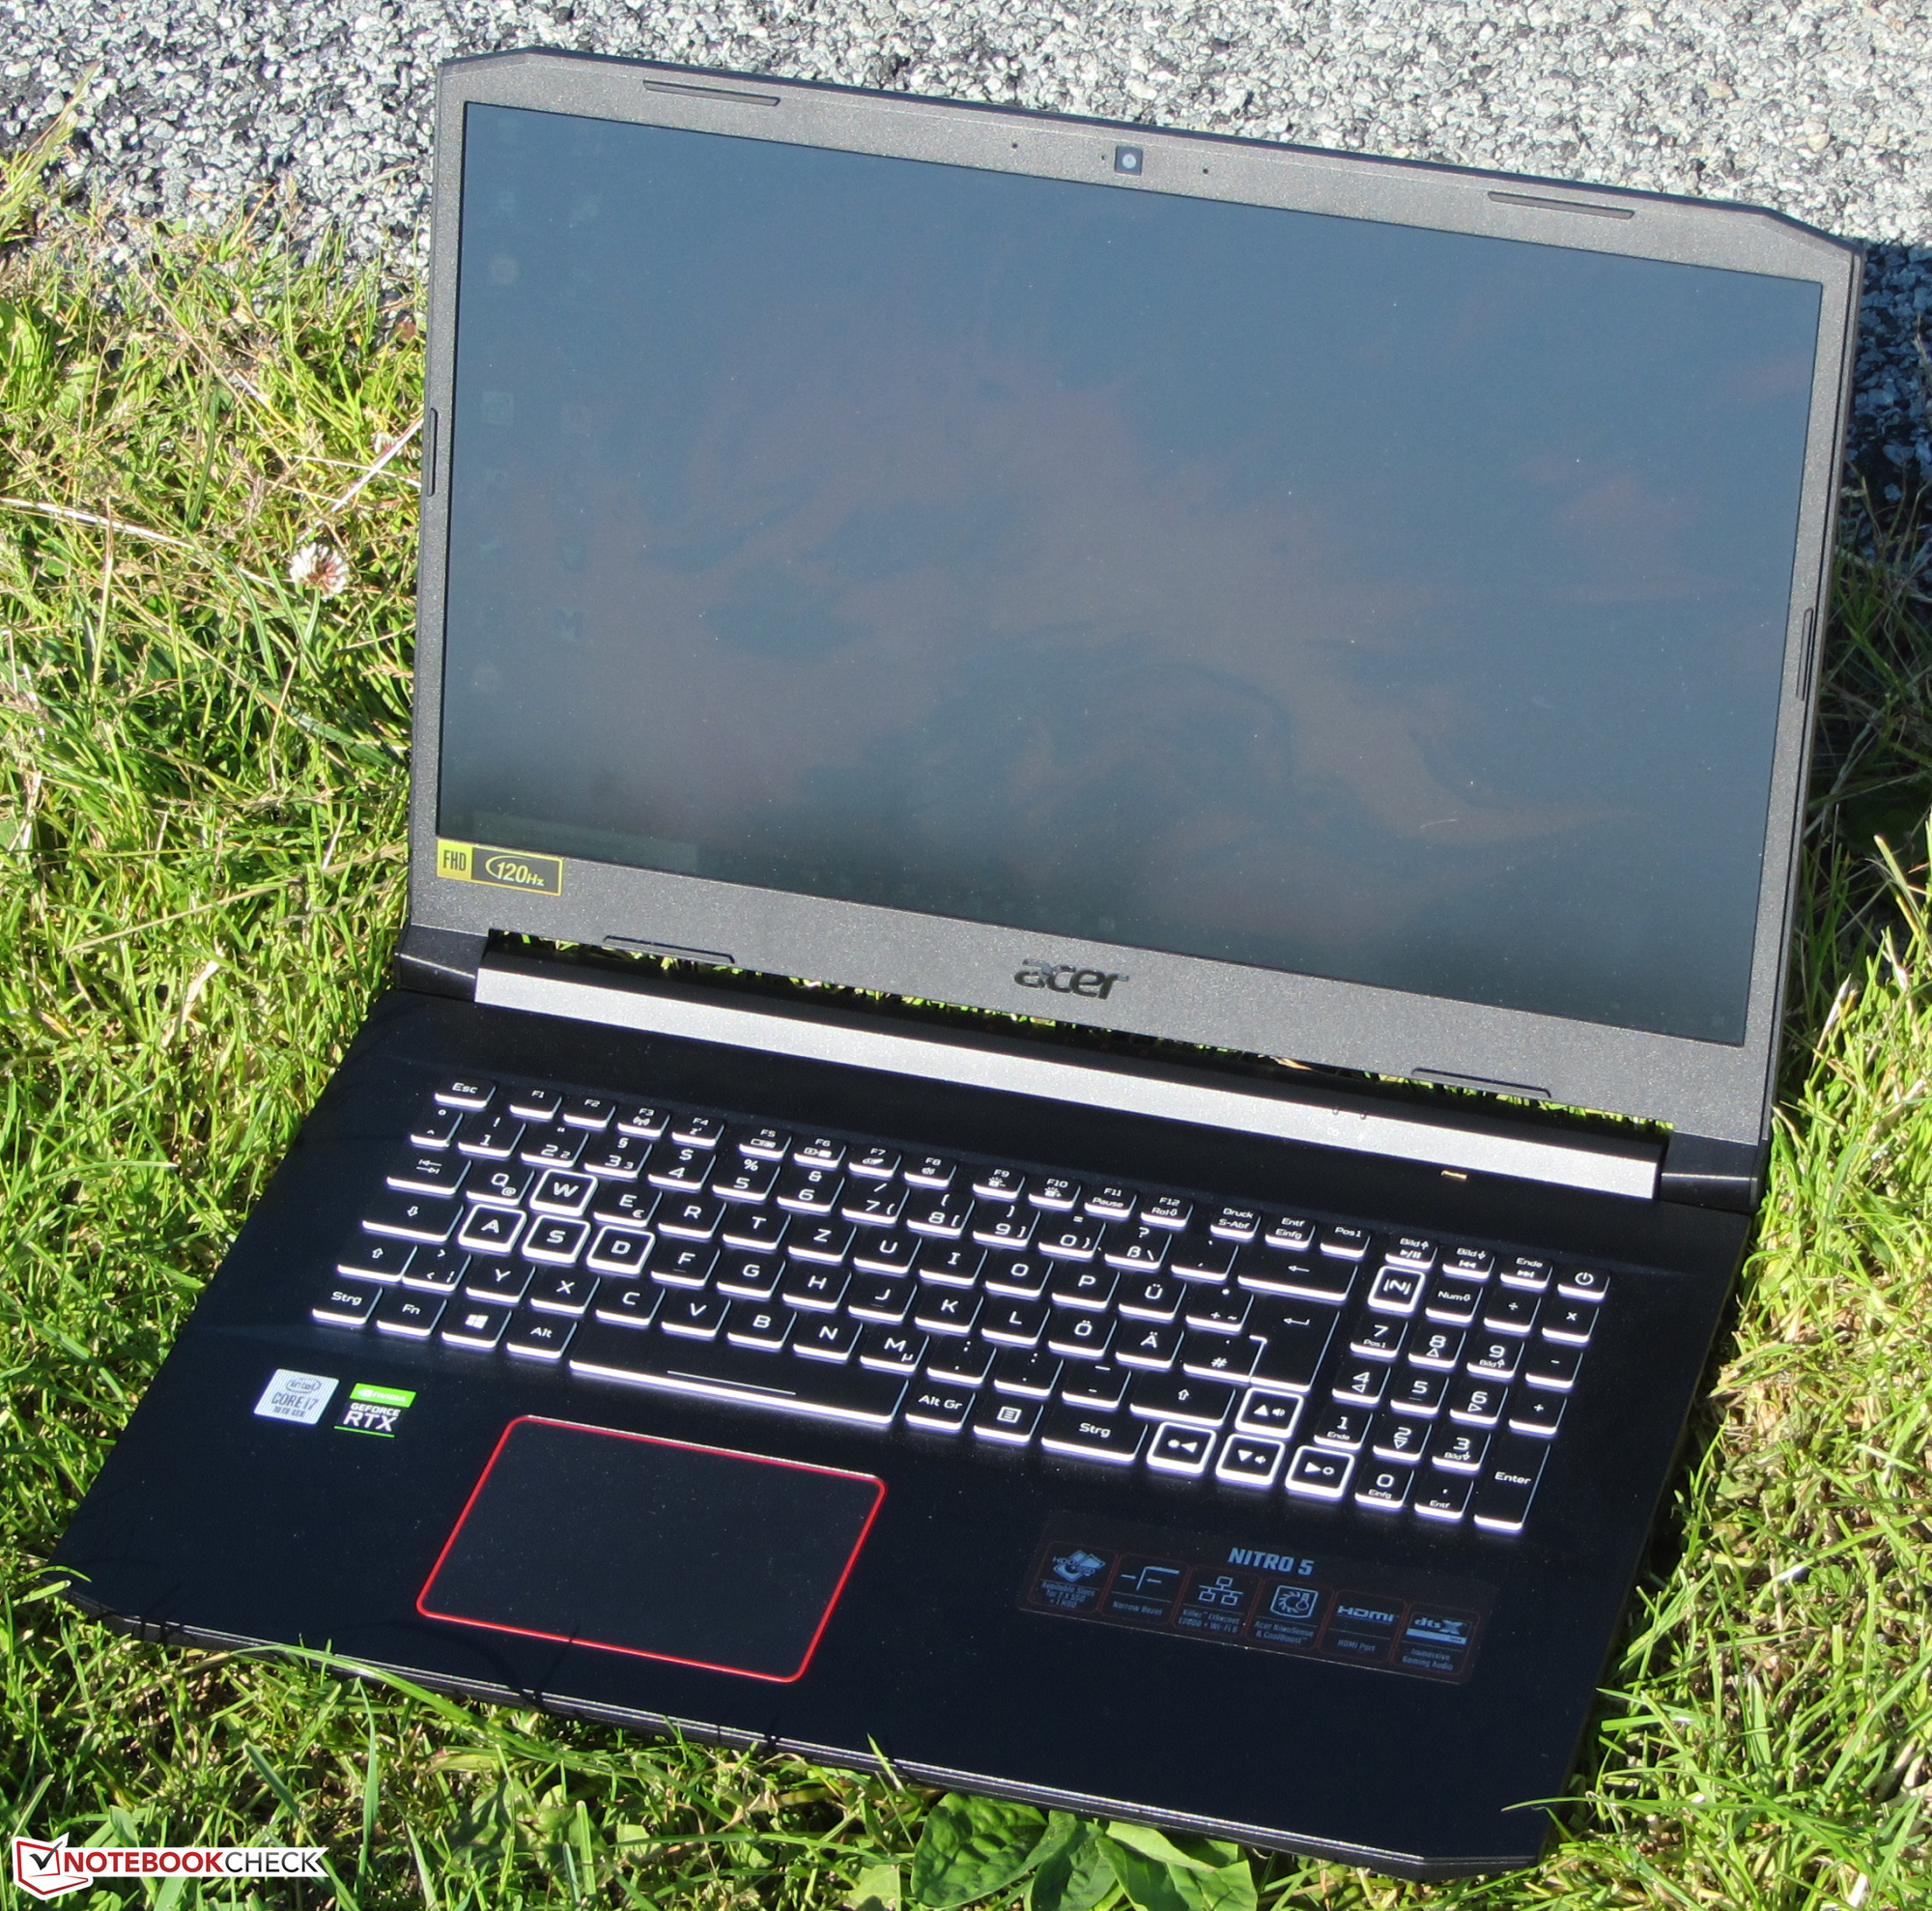
O portátil para jogos de 17,3 polegadas da Acer é capaz de rodar todos os jogos mais recentes sem problemas na tela Full HD mate, graças ao processador Core i7-8550U e a GPU GeForce GTX 2060. Geralmente, você pode jogar na resolução Full HD e nas configurações de qualidade alta a máxima aqui.
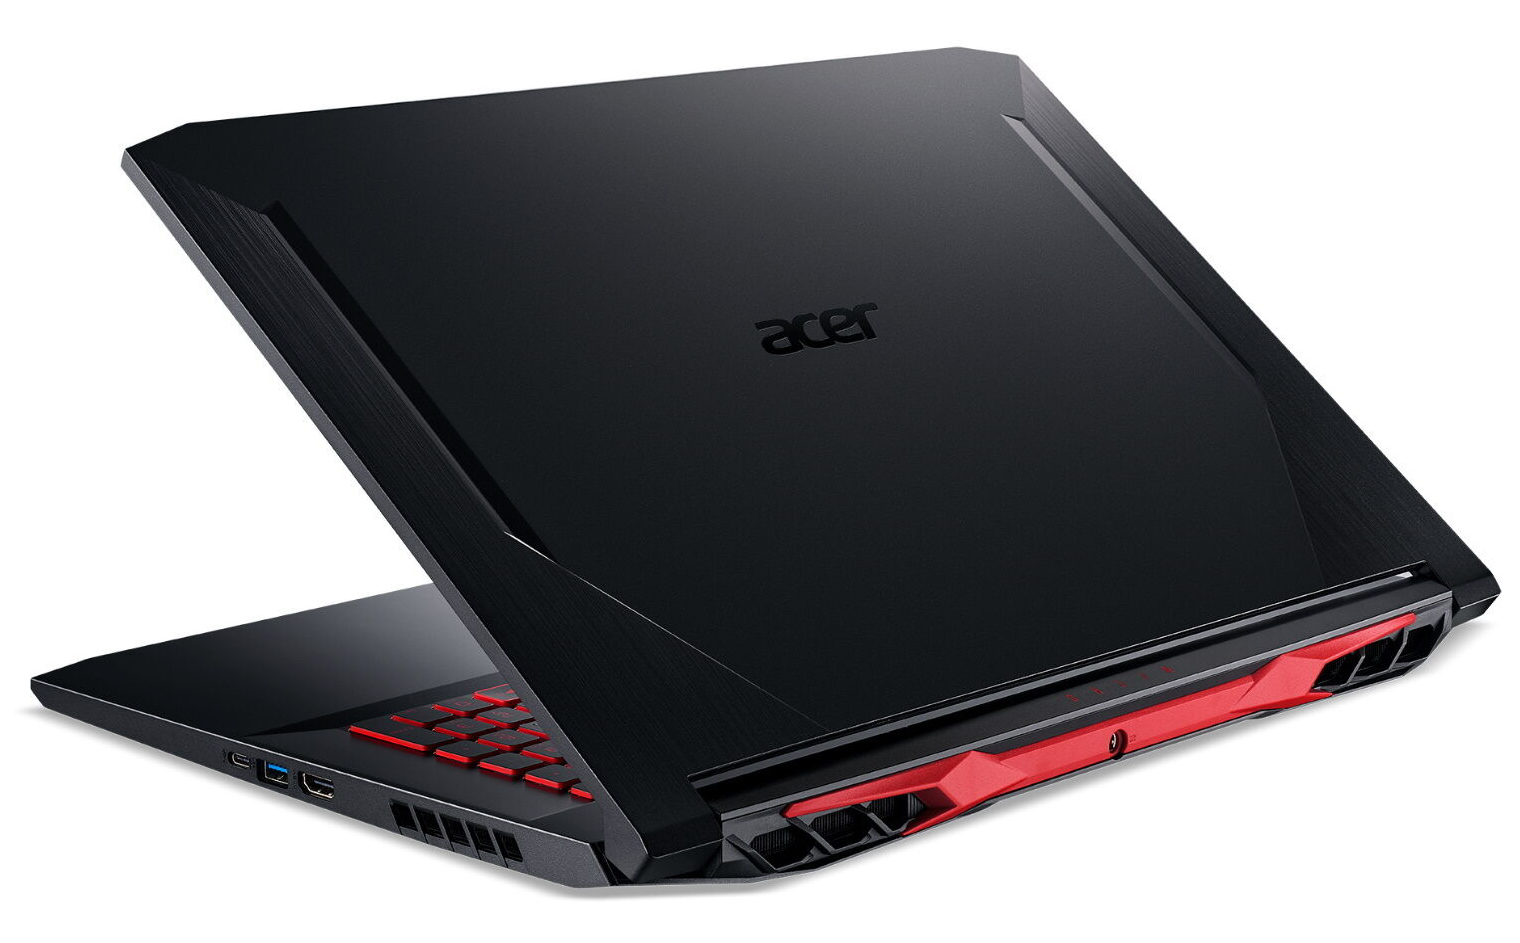
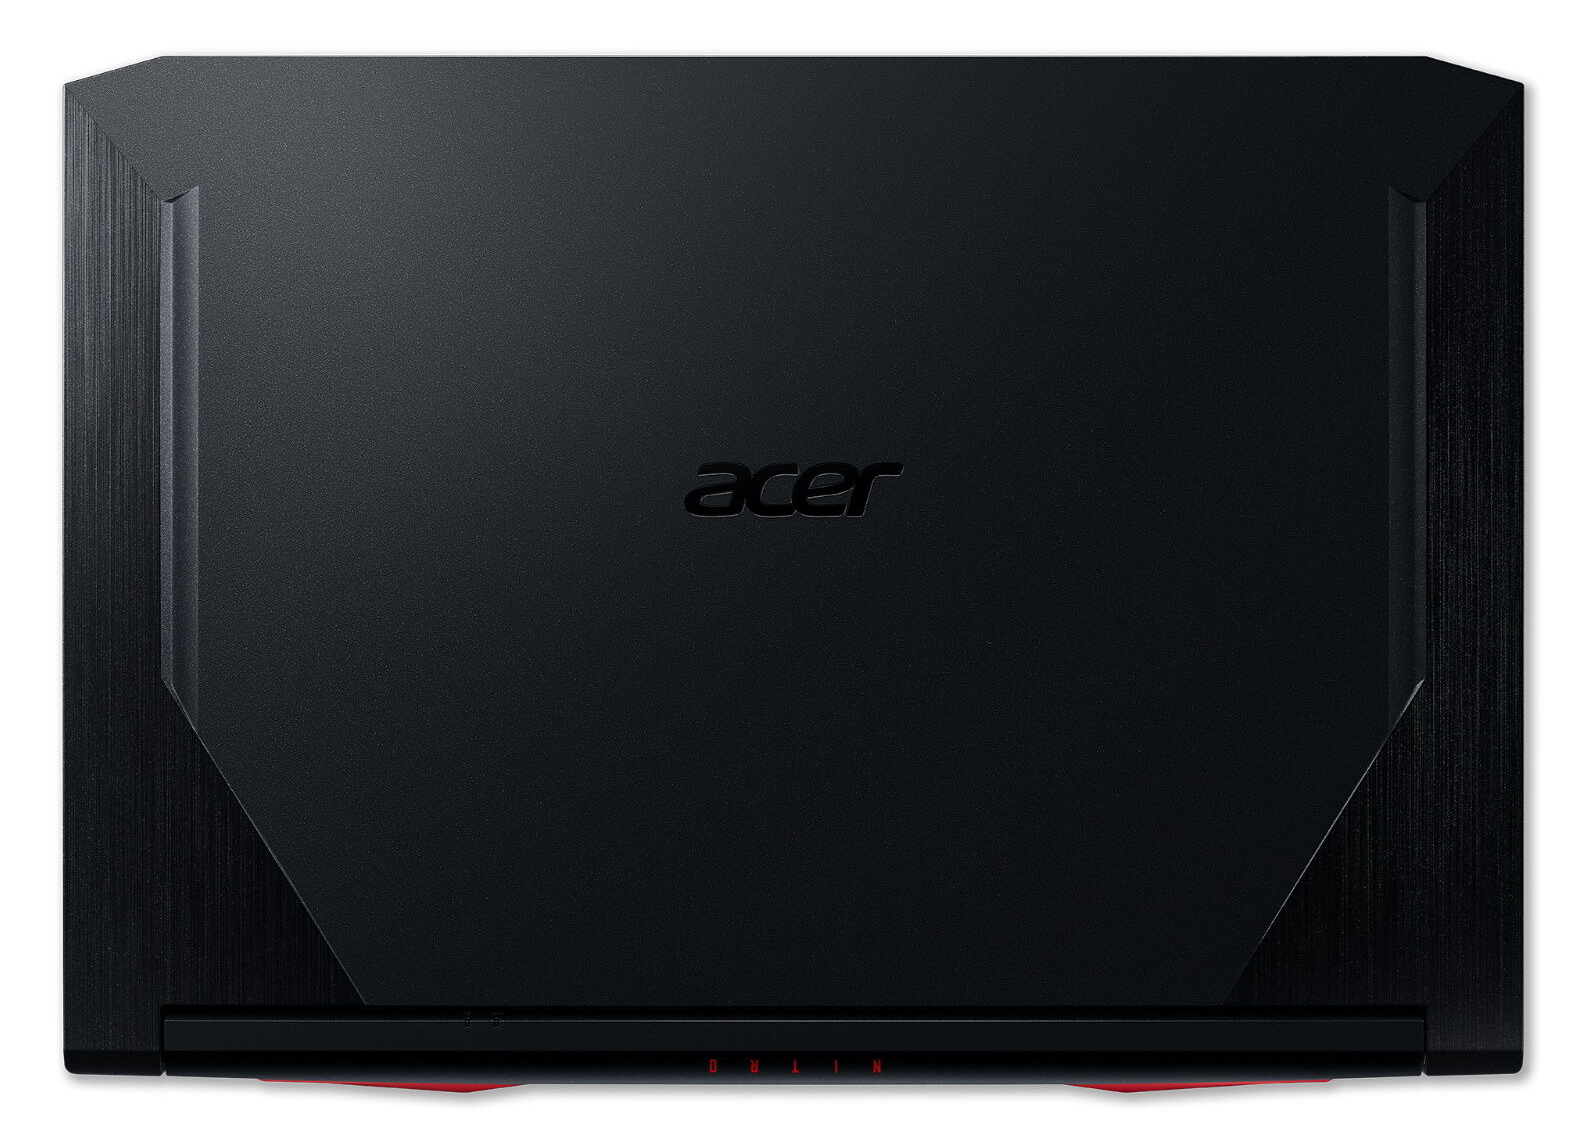
O Acer Nitro 5 AN517-52 é um portátil de jogos bastante versátil que merece uma tela melhor.
Espaço suficiente para jogos e outros aplicativos é fornecido pelo SSD NVMe de 1 TB. Se o espaço de armazenamento acabar, poderá ser expandido. O portátil também pode acomodar um segundo SSD M.2 2280 NVMe e um dispositivo de armazenamento de 2,5 polegadas. Como o computador não possui uma escotilha de manutenção, a carcaça precisaria ser aberta para isso.
Em suma, a tela IPS de 120 Hz não é capaz de convencer. O brilho, o contraste e a cobertura do espaço de cores são muito baixos. Os tempos de resposta podem ser descritos apenas como médios. Um portátil de 1.500 euros (~US$ 1.697) precisa oferecer mais aqui. Os ângulos de visão estáveis, superfície mate e reprodução de cores decente falam pela tela.
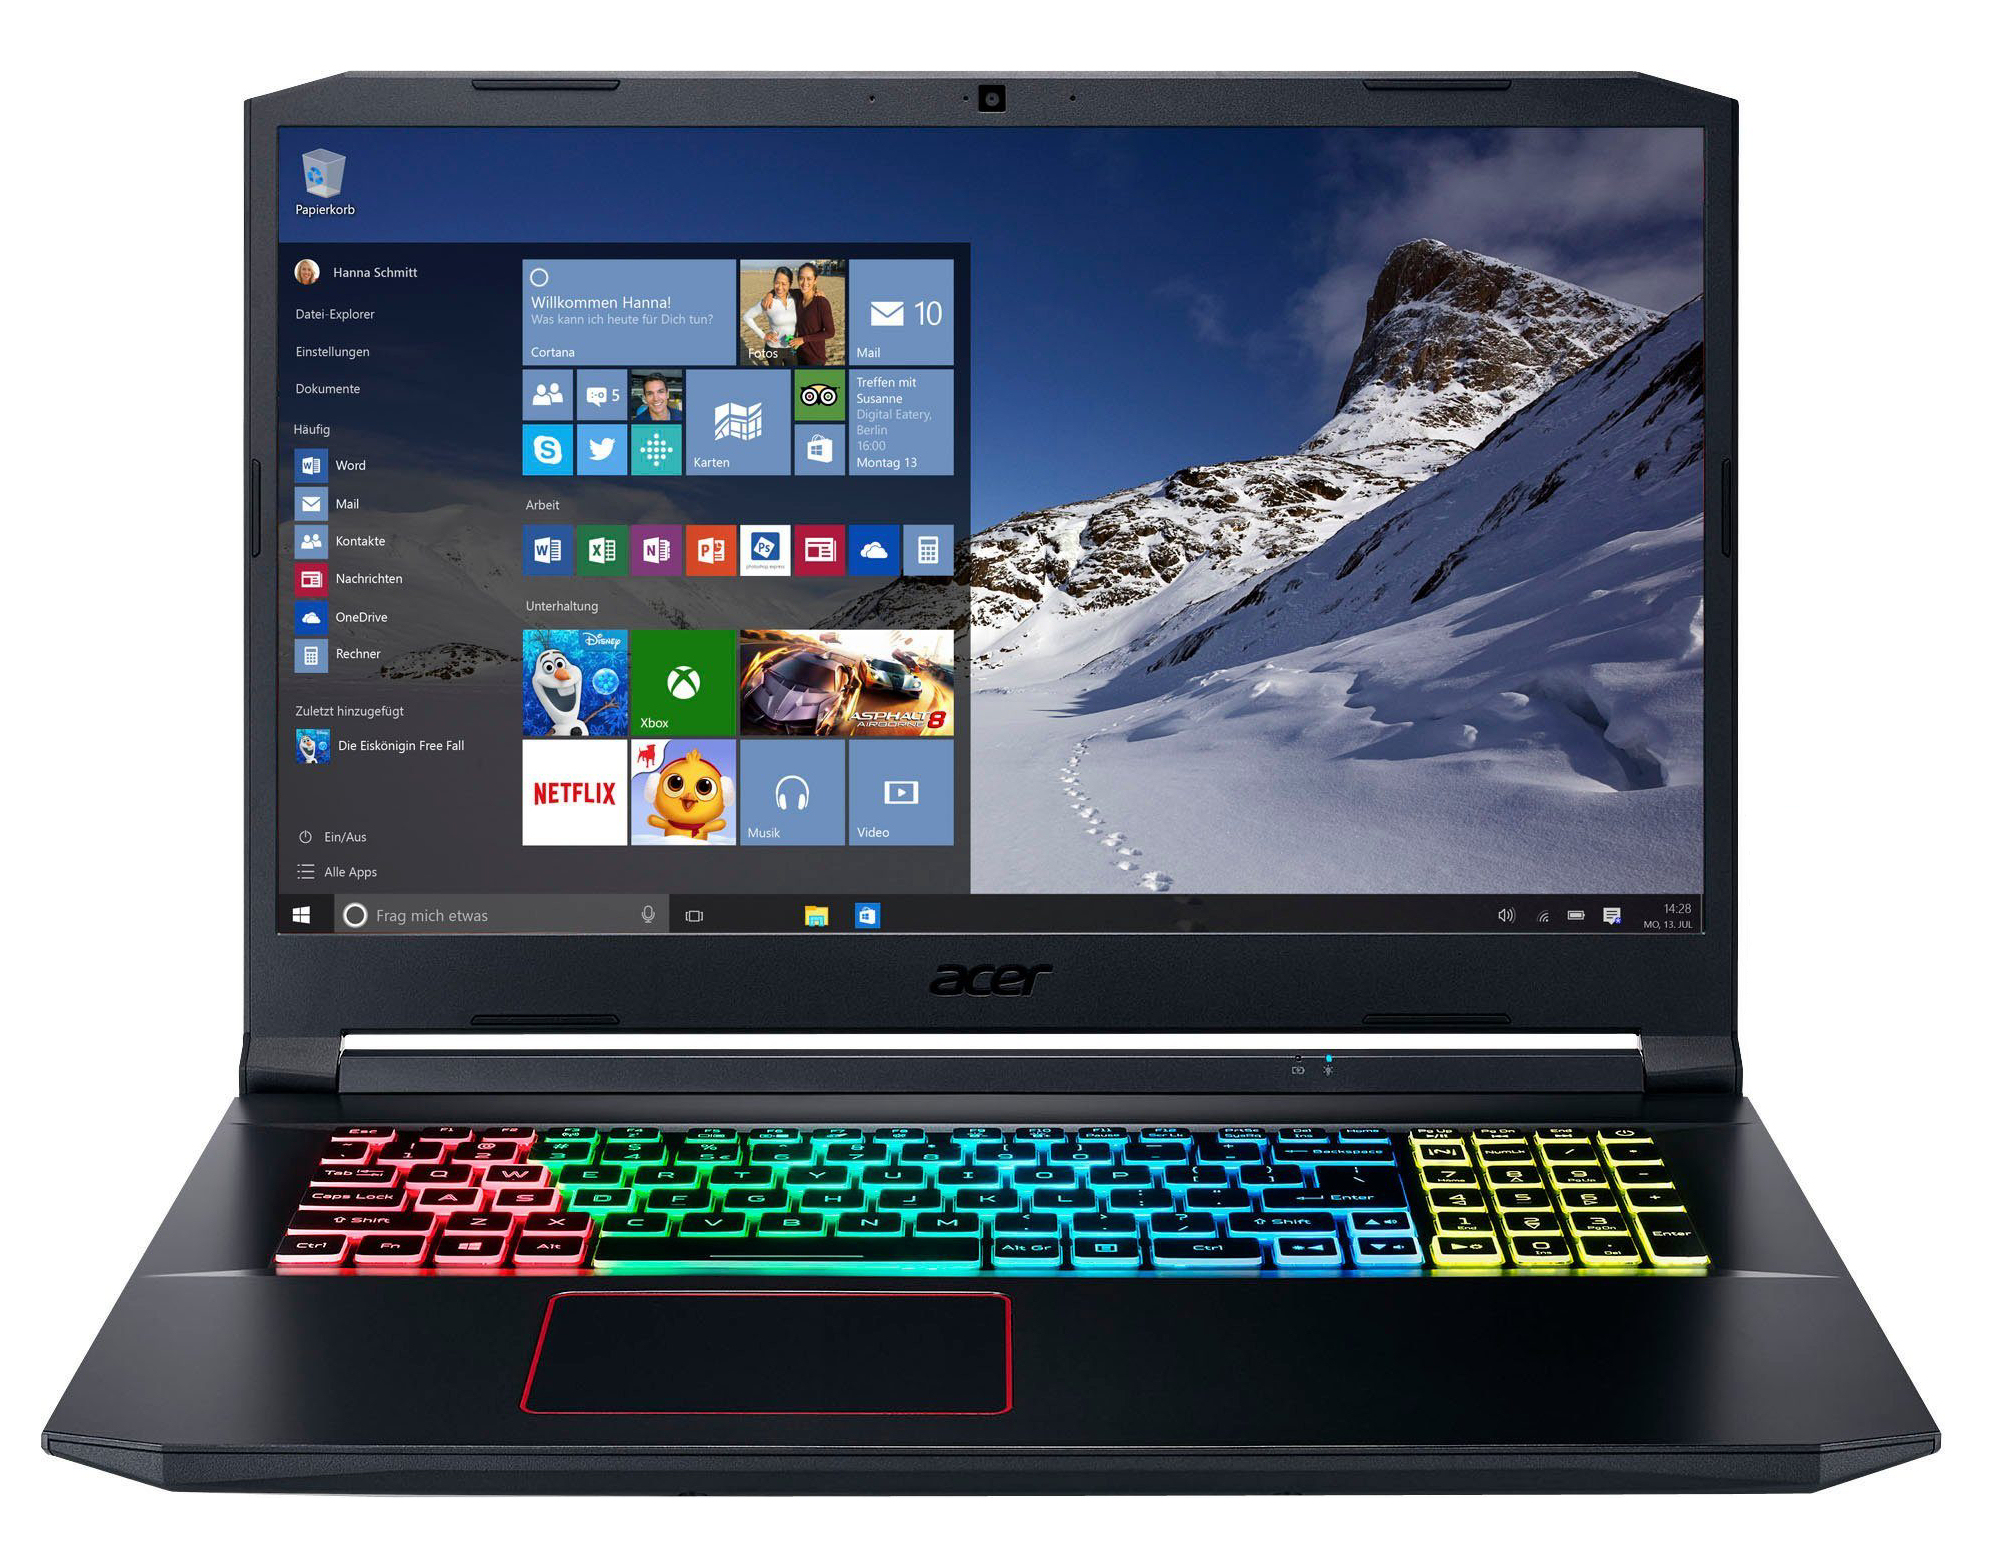
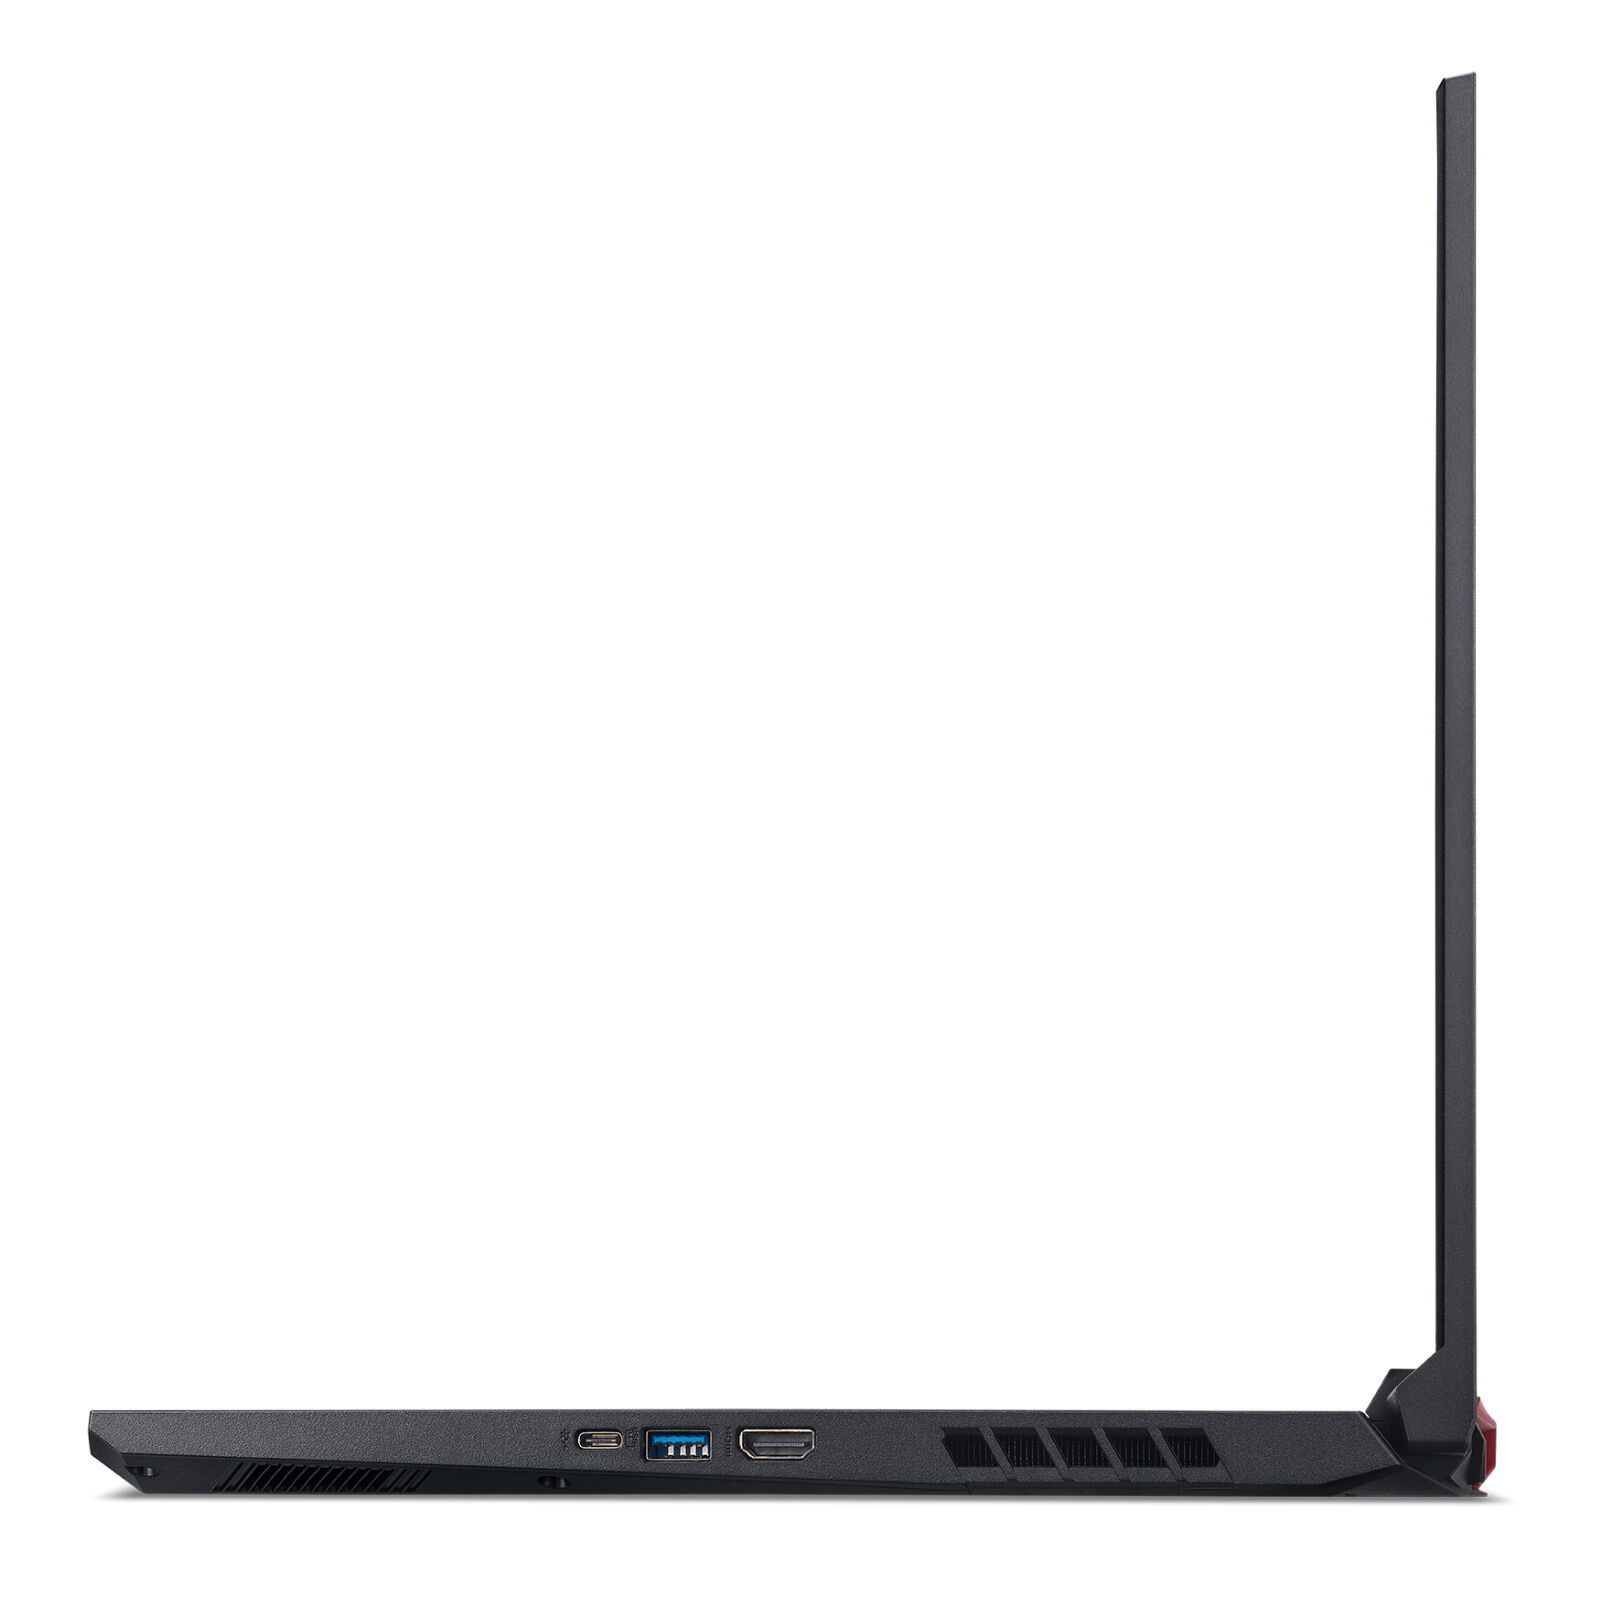
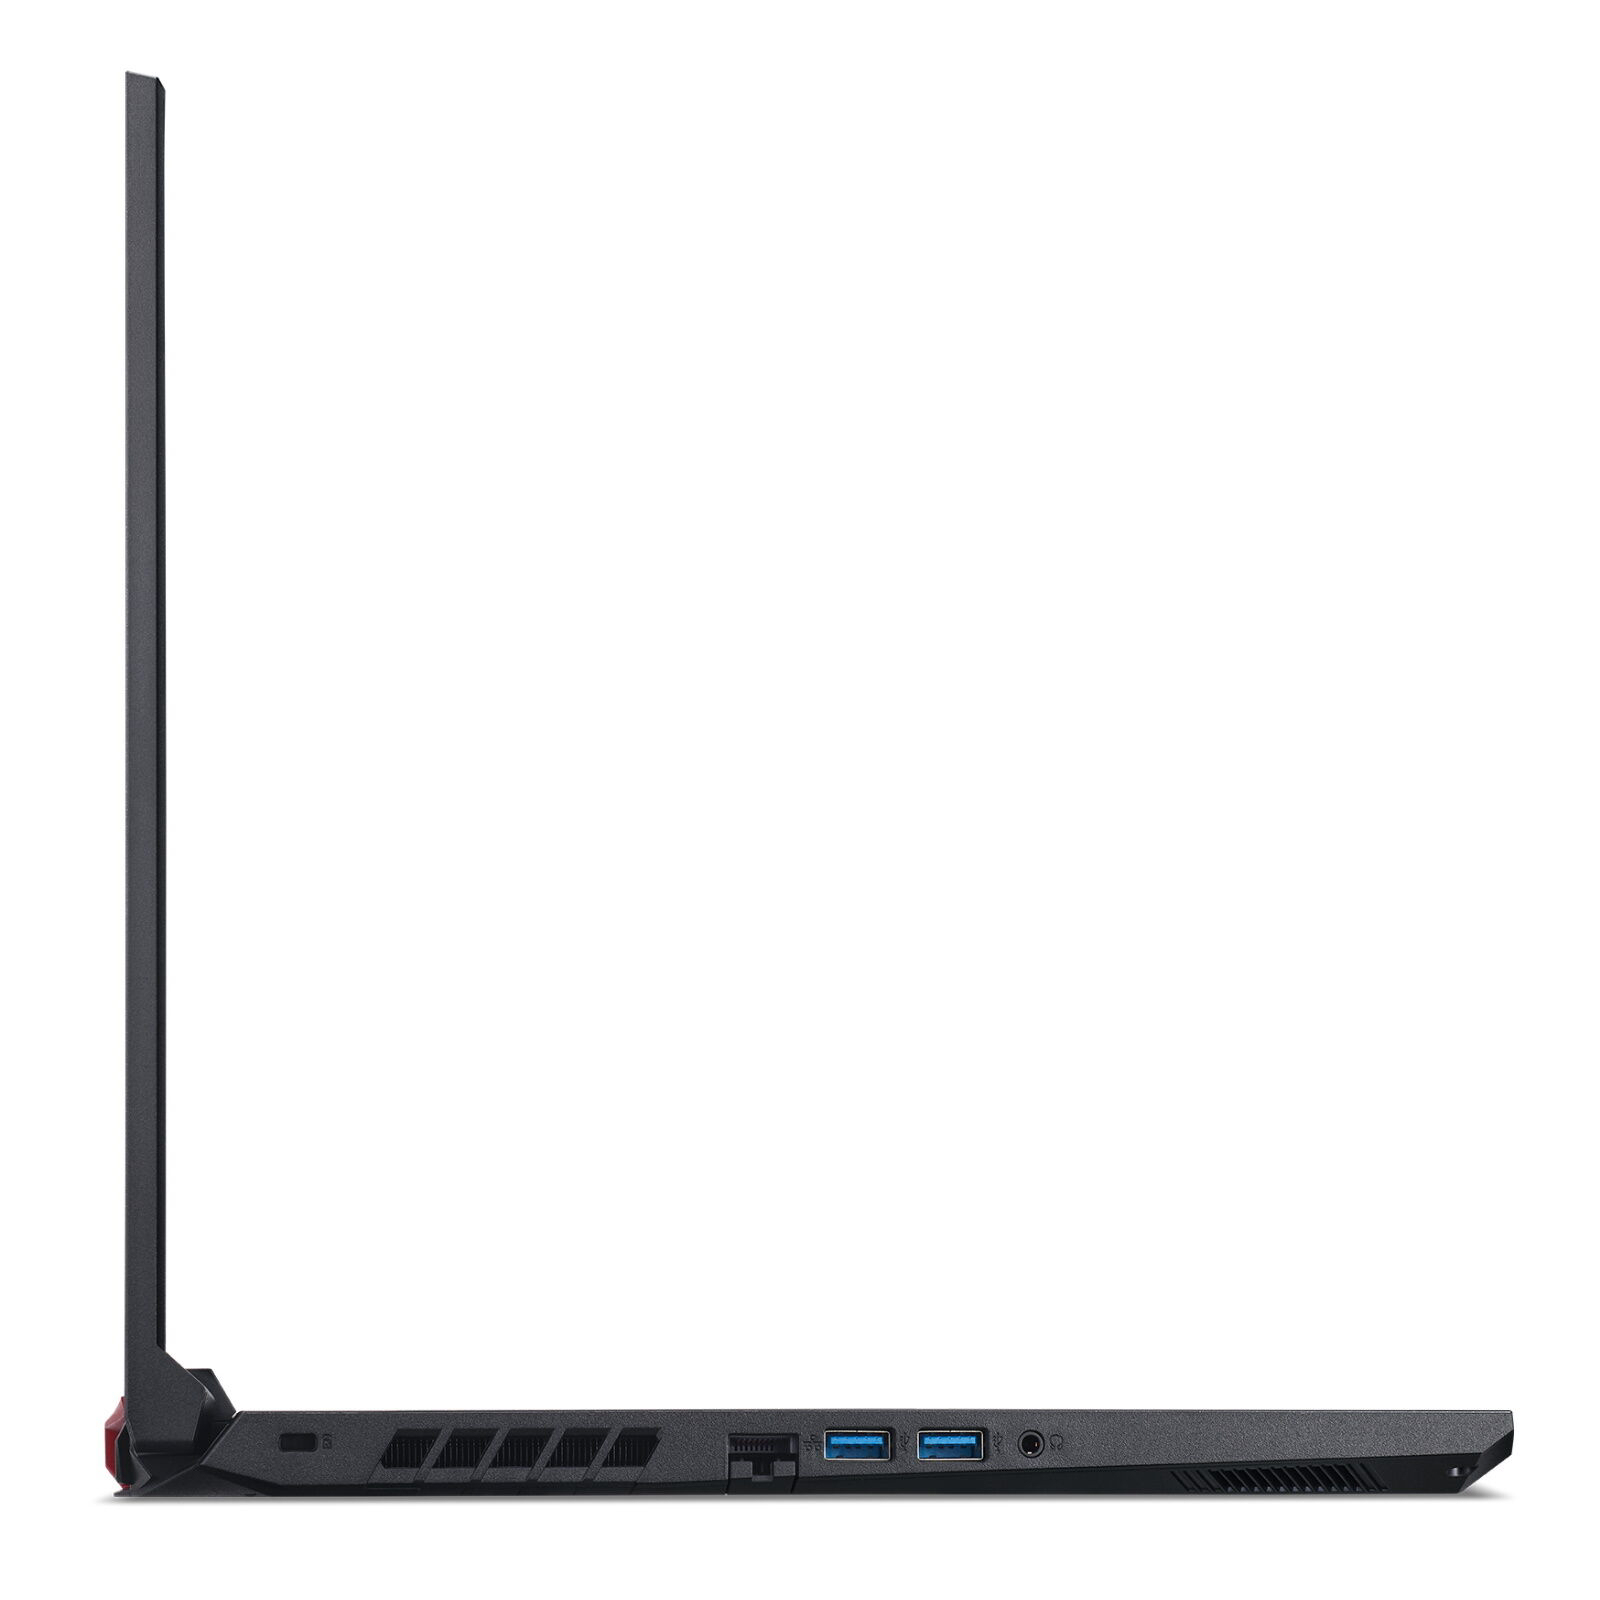
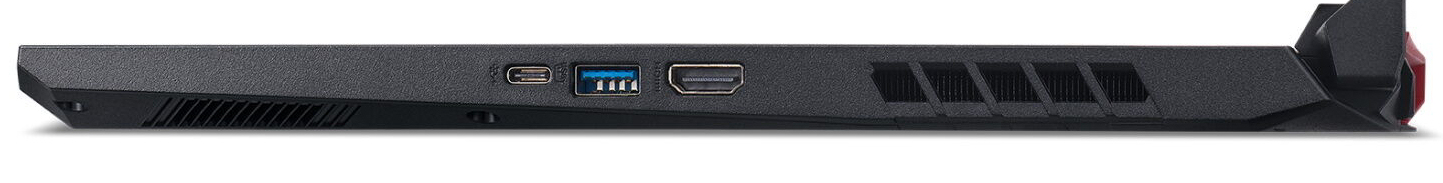
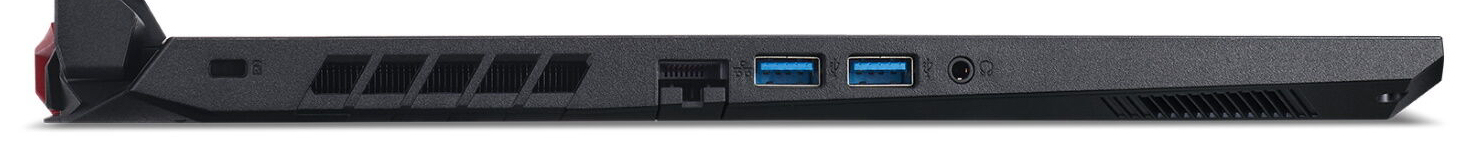
O portátil vem com as portas mais necessárias. Você procurará em vão por uma porta Thunderbolt 3. Existe apenas uma porta USB Type-C 3.2 Gen 2, que não suporta o DisplayPort via função USB-C. O teclado integrado (com Iluminação RGB) provou ser adequado para o uso diário. Além disso, a duração da bateria é mais do que aceitável para um portátil de jogos de 17,3 polegadas.
Atualmente, o portátil custa pouco menos de 1.500 Euros (~$1,697). Como resultado, ele realmente não se representa como uma barganha. No entanto, oferece uma boa relação preço-desempenho.
Acer Nitro 5 AN517-52-77DS
- 06/18/2020 v7 (old)
Sascha Mölck
Price comparison
