Breve Análise do Portátil Dell G5 15 5590: Portátil de jogos de 15 polegadas com uma GPU Max-Q
Avaliação | Data | Modelo | Peso | Altura | Size | Resolução | Preço |
|---|---|---|---|---|---|---|---|
| 82.6 % v7 (old) | 11/2019 | Dell G5 15 5590-P8RVW i7-9750H, GeForce RTX 2070 Max-Q | 2.8 kg | 23.7 mm | 15.60" | 1920x1080 | |
| 84 % v7 (old) | 08/2019 | Acer Predator Triton 500 PT515-51-71PZ i7-9750H, GeForce RTX 2070 Max-Q | 2.1 kg | 18 mm | 15.60" | 1920x1080 | |
| 84 % v7 (old) | 05/2019 | Gigabyte Aero 15 Classic-XA i7-9750H, GeForce RTX 2070 Max-Q | 2.1 kg | 19 mm | 15.60" | 1920x1080 | |
| 82.3 % v7 (old) | 09/2019 | HP Omen X 2S 15-dg0075cl i7-9750H, GeForce RTX 2070 Max-Q | 2.4 kg | 19.8 mm | 15.60" | 1920x1080 | |
| 81.3 % v7 (old) | 05/2019 | Asus Zephyrus S GX502GW i7-9750H, GeForce RTX 2070 Mobile | 2.1 kg | 19 mm | 15.60" | 1920x1080 |
| SD Card Reader | |
| average JPG Copy Test (av. of 3 runs) | |
| Gigabyte Aero 15 Classic-XA (Toshiba Exceria Pro SDXC 64 GB UHS-II) | |
| Média da turma Gaming (20.9 - 210, n=54, últimos 2 anos) | |
| Dell G5 15 5590-P8RVW (Toshiba Exceria Pro SDXC 64 GB UHS-II) | |
| maximum AS SSD Seq Read Test (1GB) | |
| Gigabyte Aero 15 Classic-XA (Toshiba Exceria Pro SDXC 64 GB UHS-II) | |
| Média da turma Gaming (25.5 - 261, n=51, últimos 2 anos) | |
| Dell G5 15 5590-P8RVW (Toshiba Exceria Pro SDXC 64 GB UHS-II) | |
| |||||||||||||||||||||||||
iluminação: 83 %
iluminação com acumulador: 291 cd/m²
Contraste: 1323:1 (Preto: 0.22 cd/m²)
ΔE ColorChecker Calman: 3.95 | ∀{0.5-29.43 Ø4.71}
calibrated: 2.05
ΔE Greyscale Calman: 3.82 | ∀{0.09-98 Ø4.96}
91% sRGB (Argyll 1.6.3 3D)
59% AdobeRGB 1998 (Argyll 1.6.3 3D)
66.7% AdobeRGB 1998 (Argyll 3D)
91.2% sRGB (Argyll 3D)
65.7% Display P3 (Argyll 3D)
Gamma: 2.49
CCT: 7317 K
| Dell G5 15 5590-P8RVW AU Optronics B156HAN (AUO80ED), IPS, 1920x1080 | Acer Predator Triton 500 PT515-51-71PZ NV156FHM-N4K (BOE082A), IPS, 1920x1080 | Gigabyte Aero 15 Classic-XA Sharp LQ156M1JW03 (SHP14C5), IGZO, 1920x1080 | HP Omen X 2S 15-dg0075cl AU Optronics AUO82ED, IPS, 1920x1080 | Asus Zephyrus S GX502GW AU Optronics B156HAN08.2 (AUO82ED), IPS, 1920x1080 | |
|---|---|---|---|---|---|
| Display | -0% | 1% | 1% | -1% | |
| Display P3 Coverage (%) | 65.7 | 64.6 -2% | 65.3 -1% | 66.2 1% | 64.9 -1% |
| sRGB Coverage (%) | 91.2 | 92.6 2% | 95.5 5% | 92.3 1% | 91 0% |
| AdobeRGB 1998 Coverage (%) | 66.7 | 66 -1% | 66.5 0% | 67.2 1% | 65.9 -1% |
| Response Times | 41% | 10% | 12% | 44% | |
| Response Time Grey 50% / Grey 80% * (ms) | 16.4 ? | 5.2 ? 68% | 15.2 ? 7% | 15.2 ? 7% | 7.2 ? 56% |
| Response Time Black / White * (ms) | 12.8 ? | 11.2 ? 13% | 11.2 ? 13% | 10.8 ? 16% | 8.8 ? 31% |
| PWM Frequency (Hz) | 23580 ? | ||||
| Screen | 6% | 3% | -12% | 1% | |
| Brightness middle (cd/m²) | 291 | 288 -1% | 266 -9% | 324.8 12% | 286 -2% |
| Brightness (cd/m²) | 295 | 265 -10% | 248 -16% | 316 7% | 275 -7% |
| Brightness Distribution (%) | 83 | 84 1% | 89 7% | 84 1% | 90 8% |
| Black Level * (cd/m²) | 0.22 | 0.22 -0% | 0.31 -41% | 0.26 -18% | 0.37 -68% |
| Contrast (:1) | 1323 | 1309 -1% | 858 -35% | 1249 -6% | 773 -42% |
| Colorchecker dE 2000 * | 3.95 | 3.22 18% | 2.78 30% | 4.96 -26% | 2.19 45% |
| Colorchecker dE 2000 max. * | 7.46 | 6.26 16% | 5.96 20% | 8.95 -20% | 4.4 41% |
| Colorchecker dE 2000 calibrated * | 2.05 | 1.5 27% | 0.91 56% | 3.23 -58% | 2.27 -11% |
| Greyscale dE 2000 * | 3.82 | 3.43 10% | 3.58 6% | 5 -31% | 2.2 42% |
| Gamma | 2.49 88% | 2.41 91% | 2.46 89% | 2.21 100% | 2.41 91% |
| CCT | 7317 89% | 7290 89% | 7186 90% | 7742 84% | 6405 101% |
| Color Space (Percent of AdobeRGB 1998) (%) | 59 | 60 2% | 62 5% | 59.8 1% | 59 0% |
| Color Space (Percent of sRGB) (%) | 91 | 93 2% | 96 5% | 91.8 1% | 91 0% |
| Média Total (Programa/Configurações) | 16% /
9% | 5% /
3% | 0% /
-7% | 15% /
6% |
* ... menor é melhor
Exibir tempos de resposta
| ↔ Tempo de resposta preto para branco | ||
|---|---|---|
| 12.8 ms ... ascensão ↗ e queda ↘ combinadas | ↗ 7.6 ms ascensão | 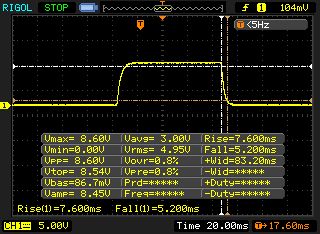 |
| ↘ 5.2 ms queda | ||
| A tela mostra boas taxas de resposta em nossos testes, mas pode ser muito lenta para jogadores competitivos. Em comparação, todos os dispositivos testados variam de 0.1 (mínimo) a 240 (máximo) ms. » 33 % de todos os dispositivos são melhores. Isso significa que o tempo de resposta medido é melhor que a média de todos os dispositivos testados (19.8 ms). | ||
| ↔ Tempo de resposta 50% cinza a 80% cinza | ||
| 16.4 ms ... ascensão ↗ e queda ↘ combinadas | ↗ 8.4 ms ascensão | 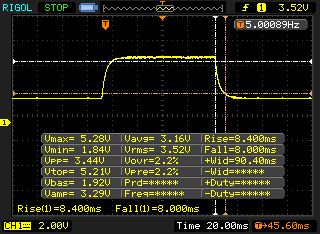 |
| ↘ 8 ms queda | ||
| A tela mostra boas taxas de resposta em nossos testes, mas pode ser muito lenta para jogadores competitivos. Em comparação, todos os dispositivos testados variam de 0.165 (mínimo) a 636 (máximo) ms. » 31 % de todos os dispositivos são melhores. Isso significa que o tempo de resposta medido é melhor que a média de todos os dispositivos testados (30.9 ms). | ||
Cintilação da tela / PWM (modulação por largura de pulso)
| Tela tremeluzindo / PWM não detectado | 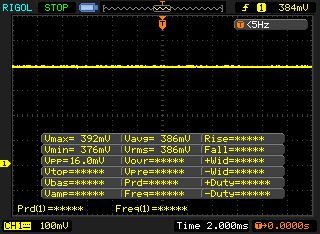 | ||
[pwm_comparison] Em comparação: 52 % de todos os dispositivos testados não usam PWM para escurecer a tela. Se PWM foi detectado, uma média de 7744 (mínimo: 5 - máximo: 343500) Hz foi medida. | |||
| Dell G5 15 5590-P8RVW SK Hynix BC501 HFM512GDJTNG | Acer Predator Triton 500 PT515-51-71PZ WDC PC SN720 SDAPNTW-512G | Gigabyte Aero 15 Classic-XA Intel SSD 760p SSDPEKKW512G8 | HP Omen X 2S 15-dg0075cl WDC PC SN720 SDAPNTW-1T00 | Asus Zephyrus S GX502GW 2x Intel SSD 660p SSDPEKNW512G8 (RAID 0) | |
|---|---|---|---|---|---|
| CrystalDiskMark 5.2 / 6 | 92% | 76% | 105% | 71% | |
| Write 4K (MB/s) | 64.6 | 108.8 68% | 115.5 79% | 137.4 113% | 97 50% |
| Read 4K (MB/s) | 35.64 | 40.31 13% | 58 63% | 41.37 16% | 49.58 39% |
| Write Seq (MB/s) | 748 | 2488 233% | 1555 108% | 2500 234% | 1838 146% |
| Read Seq (MB/s) | 1039 | 1916 84% | 2590 149% | 1576 52% | 2421 133% |
| Write 4K Q32T1 (MB/s) | 435.7 | 382.4 -12% | 369.3 -15% | 446.7 3% | 326.9 -25% |
| Read 4K Q32T1 (MB/s) | 292.4 | 421.8 44% | 441.7 51% | 522 79% | 372.9 28% |
| Write Seq Q32T1 (MB/s) | 870 | 2542 192% | 1547 78% | 2796 221% | 1894 118% |
| Read Seq Q32T1 (MB/s) | 1557 | 3320 113% | 2969 91% | 3415 119% | 2828 82% |

| 3DMark 11 Performance | 18202 pontos | |
| 3DMark Cloud Gate Standard Score | 36724 pontos | |
| 3DMark Fire Strike Score | 15046 pontos | |
| 3DMark Time Spy Score | 6557 pontos | |
Ajuda | ||
| The Witcher 3 - 1920x1080 Ultra Graphics & Postprocessing (HBAO+) | |
| Média da turma Gaming (104.7 - 240, n=7, últimos 2 anos) | |
| Asus Zephyrus S GX502GW | |
| HP Omen X 2S 15-dg0075cl | |
| Acer Predator Triton 500 PT515-51-71PZ | |
| Gigabyte Aero 15 Classic-XA | |
| Dell G5 15 5590-P8RVW | |
| baixo | média | alto | ultra | |
|---|---|---|---|---|
| The Witcher 3 (2015) | 111 | 61.5 | ||
| Apex Legends (2019) | 106 | 105 | ||
| Far Cry New Dawn (2019) | 86 | 78 | ||
| Anthem (2019) | 71.9 | 67.8 | ||
| Dirt Rally 2.0 (2019) | 112 | 68.8 | ||
| Rage 2 (2019) | 74.8 | 71.5 | ||
| F1 2019 (2019) | 130 | 97 | ||
| Control (2019) | 57.4 | |||
| Borderlands 3 (2019) | 65.3 | 51.1 | ||
| FIFA 20 (2019) | 180 | 179 | ||
| Ghost Recon Breakpoint (2019) | 70 | 52 | ||
| GRID 2019 (2019) | 92.6 | 67 |
Barulho
| Ocioso |
| 32 / 33 / 34 dB |
| HDD |
| 32 dB |
| Carga |
| 50 / 52 dB |
 | ||
30 dB silencioso 40 dB(A) audível 50 dB(A) ruidosamente alto |
||
min: | ||
| Dell G5 15 5590-P8RVW i7-9750H, GeForce RTX 2070 Max-Q | Acer Predator Triton 500 PT515-51-71PZ i7-9750H, GeForce RTX 2070 Max-Q | Gigabyte Aero 15 Classic-XA i7-9750H, GeForce RTX 2070 Max-Q | HP Omen X 2S 15-dg0075cl i7-9750H, GeForce RTX 2070 Max-Q | Asus Zephyrus S GX502GW i7-9750H, GeForce RTX 2070 Mobile | Média da turma Gaming | |
|---|---|---|---|---|---|---|
| Noise | 1% | -3% | 5% | -3% | 13% | |
| desligado / ambiente * (dB) | 30 | 30 -0% | 30 -0% | 29 3% | 30 -0% | 24.1 ? 20% |
| Idle Minimum * (dB) | 32 | 30 6% | 31 3% | 30.5 5% | 31 3% | 25.9 ? 19% |
| Idle Average * (dB) | 33 | 33 -0% | 34 -3% | 31.5 5% | 33 -0% | 27.4 ? 17% |
| Idle Maximum * (dB) | 34 | 39 -15% | 39 -15% | 31.5 7% | 38 -12% | 30.1 ? 11% |
| Load Average * (dB) | 50 | 45 10% | 46 8% | 40.6 19% | 50 -0% | 43.7 ? 13% |
| Witcher 3 ultra * (dB) | 50 | 49 2% | 53 -6% | 49.5 1% | 53 -6% | |
| Load Maximum * (dB) | 52 | 51 2% | 55 -6% | 53.4 -3% | 56 -8% | 54.3 ? -4% |
* ... menor é melhor
(-) A temperatura máxima no lado superior é 54 °C / 129 F, em comparação com a média de 40.4 °C / 105 F , variando de 21.2 a 68.8 °C para a classe Gaming.
(-) A parte inferior aquece até um máximo de 61 °C / 142 F, em comparação com a média de 43.2 °C / 110 F
(+) Em uso inativo, a temperatura média para o lado superior é 24.7 °C / 76 F, em comparação com a média do dispositivo de 33.9 °C / ### class_avg_f### F.
(-) Jogando The Witcher 3, a temperatura média para o lado superior é 40.7 °C / 105 F, em comparação com a média do dispositivo de 33.9 °C / ## #class_avg_f### F.
(+) Os apoios para as mãos e o touchpad estão atingindo a temperatura máxima da pele (33 °C / 91.4 F) e, portanto, não estão quentes.
(-) A temperatura média da área do apoio para as mãos de dispositivos semelhantes foi 28.8 °C / 83.8 F (-4.2 °C / -7.6 F).
| Dell G5 15 5590-P8RVW i7-9750H, GeForce RTX 2070 Max-Q | Acer Predator Triton 500 PT515-51-71PZ i7-9750H, GeForce RTX 2070 Max-Q | Gigabyte Aero 15 Classic-XA i7-9750H, GeForce RTX 2070 Max-Q | HP Omen X 2S 15-dg0075cl i7-9750H, GeForce RTX 2070 Max-Q | Asus Zephyrus S GX502GW i7-9750H, GeForce RTX 2070 Mobile | Média da turma Gaming | |
|---|---|---|---|---|---|---|
| Heat | -3% | -13% | -30% | -10% | -5% | |
| Maximum Upper Side * (°C) | 54 | 49 9% | 58 -7% | 48.8 10% | 54 -0% | 45.1 ? 16% |
| Maximum Bottom * (°C) | 61 | 59 3% | 64 -5% | 55 10% | 47 23% | 48.1 ? 21% |
| Idle Upper Side * (°C) | 25 | 28 -12% | 30 -20% | 41 -64% | 33 -32% | 31 ? -24% |
| Idle Bottom * (°C) | 26 | 29 -12% | 31 -19% | 45.6 -75% | 34 -31% | 34.2 ? -32% |
* ... menor é melhor
Dell G5 15 5590-P8RVW análise de áudio
(+) | os alto-falantes podem tocar relativamente alto (###valor### dB)
Graves 100 - 315Hz
(-) | quase nenhum baixo - em média 19.4% menor que a mediana
(±) | a linearidade dos graves é média (10.5% delta para a frequência anterior)
Médios 400 - 2.000 Hz
(+) | médios equilibrados - apenas 3.5% longe da mediana
(+) | médios são lineares (4.9% delta para frequência anterior)
Altos 2 - 16 kHz
(±) | máximos reduzidos - em média 5.5% menor que a mediana
(±) | a linearidade dos máximos é média (8.6% delta para frequência anterior)
Geral 100 - 16.000 Hz
(±) | a linearidade do som geral é média (15.6% diferença em relação à mediana)
Comparado com a mesma classe
» 36% de todos os dispositivos testados nesta classe foram melhores, 6% semelhantes, 58% piores
» O melhor teve um delta de 6%, a média foi 18%, o pior foi 132%
Comparado com todos os dispositivos testados
» 24% de todos os dispositivos testados foram melhores, 5% semelhantes, 72% piores
» O melhor teve um delta de 4%, a média foi 23%, o pior foi 134%
Asus Zephyrus S GX502GW análise de áudio
(+) | os alto-falantes podem tocar relativamente alto (###valor### dB)
Graves 100 - 315Hz
(±) | graves reduzidos - em média 12.7% menor que a mediana
(±) | a linearidade dos graves é média (8.5% delta para a frequência anterior)
Médios 400 - 2.000 Hz
(+) | médios equilibrados - apenas 4.5% longe da mediana
(+) | médios são lineares (4.1% delta para frequência anterior)
Altos 2 - 16 kHz
(±) | máximos mais altos - em média 6.7% maior que a mediana
(±) | a linearidade dos máximos é média (10.8% delta para frequência anterior)
Geral 100 - 16.000 Hz
(+) | o som geral é linear (14.6% diferença em relação à mediana)
Comparado com a mesma classe
» 28% de todos os dispositivos testados nesta classe foram melhores, 8% semelhantes, 65% piores
» O melhor teve um delta de 6%, a média foi 18%, o pior foi 132%
Comparado com todos os dispositivos testados
» 19% de todos os dispositivos testados foram melhores, 4% semelhantes, 77% piores
» O melhor teve um delta de 4%, a média foi 23%, o pior foi 134%
| desligado | |
| Ocioso | |
| Carga |
|
Key:
min: | |
| Dell G5 15 5590-P8RVW i7-9750H, GeForce RTX 2070 Max-Q | Acer Predator Triton 500 PT515-51-71PZ i7-9750H, GeForce RTX 2070 Max-Q | Gigabyte Aero 15 Classic-XA i7-9750H, GeForce RTX 2070 Max-Q | HP Omen X 2S 15-dg0075cl i7-9750H, GeForce RTX 2070 Max-Q | Asus Zephyrus S GX502GW i7-9750H, GeForce RTX 2070 Mobile | Média da turma Gaming | |
|---|---|---|---|---|---|---|
| Power Consumption | -1% | -74% | -230% | -98% | -50% | |
| Idle Minimum * (Watt) | 5 | 7 -40% | 21 -320% | 46 -820% | 24 -380% | 13.1 ? -162% |
| Idle Average * (Watt) | 13 | 12 8% | 23 -77% | 59 -354% | 27 -108% | 19 ? -46% |
| Idle Maximum * (Watt) | 23 | 22 4% | 32 -39% | 65.5 -185% | 33 -43% | 24.6 ? -7% |
| Load Average * (Watt) | 121 | 86 29% | 97 20% | 99.8 18% | 129 -7% | 111.3 ? 8% |
| Witcher 3 ultra * (Watt) | 133 | 144 -8% | 148 -11% | 154.1 -16% | 176 -32% | |
| Load Maximum * (Watt) | 184 | 177 4% | 213 -16% | 222.7 -21% | 216 -17% | 260 ? -41% |
* ... menor é melhor
| Dell G5 15 5590-P8RVW i7-9750H, GeForce RTX 2070 Max-Q, 90 Wh | Acer Predator Triton 500 PT515-51-71PZ i7-9750H, GeForce RTX 2070 Max-Q, Wh | Gigabyte Aero 15 Classic-XA i7-9750H, GeForce RTX 2070 Max-Q, 94.24 Wh | HP Omen X 2S 15-dg0075cl i7-9750H, GeForce RTX 2070 Max-Q, 72 Wh | Asus Zephyrus S GX502GW i7-9750H, GeForce RTX 2070 Mobile, 76 Wh | Média da turma Gaming | |
|---|---|---|---|---|---|---|
| Duração da bateria | 23% | 39% | -46% | -34% | 3% | |
| Reader / Idle (h) | 8.6 | 11.1 29% | 9.1 6% | 3.7 -57% | 5.9 -31% | 7.84 ? -9% |
| WiFi v1.3 (h) | 5.7 | 8 40% | 7 23% | 2.2 -61% | 3.7 -35% | 7.08 ? 24% |
| Load (h) | 1.6 | 1.6 0% | 3 88% | 1.3 -19% | 1 -37% | 1.496 ? -6% |
| H.264 (h) | 6.8 | 8.27 ? |
Pro
Contra
Com exceção da duração da bateria, o Dell G5 15 5590-P8RVW de 2.000-Euros(~$2.229) não é muito melhor do que o G5 15 1000-PCNJJ de 1.000 Euros (~ $1.115).
Além do melhor desempenho (processador, placa gráfica, SSD etc.) e uma porta Thunderbolt 3, o 5590-P8RVW possui uma tela muito mais rápida. Diferentemente da versão básica, a tela de 144 Hz do modelo topo de linha possui um brilho adequado, reprodução de cores utilizável e tempos de resposta mais curtos.
No entanto, o modelo de 2000-Euros (~$2.229) possui as mesmas falhas da variante de orçamento, como o leitor de cartão lento e a otimização da CPU em aplicativos 3D. Essas falhas impedem que o portátil de 15 polegadas alcance uma classificação mais alta.
Dell G5 15 5590-P8RVW
- 05/14/2020 v7 (old)
Florian Glaser
Price comparison