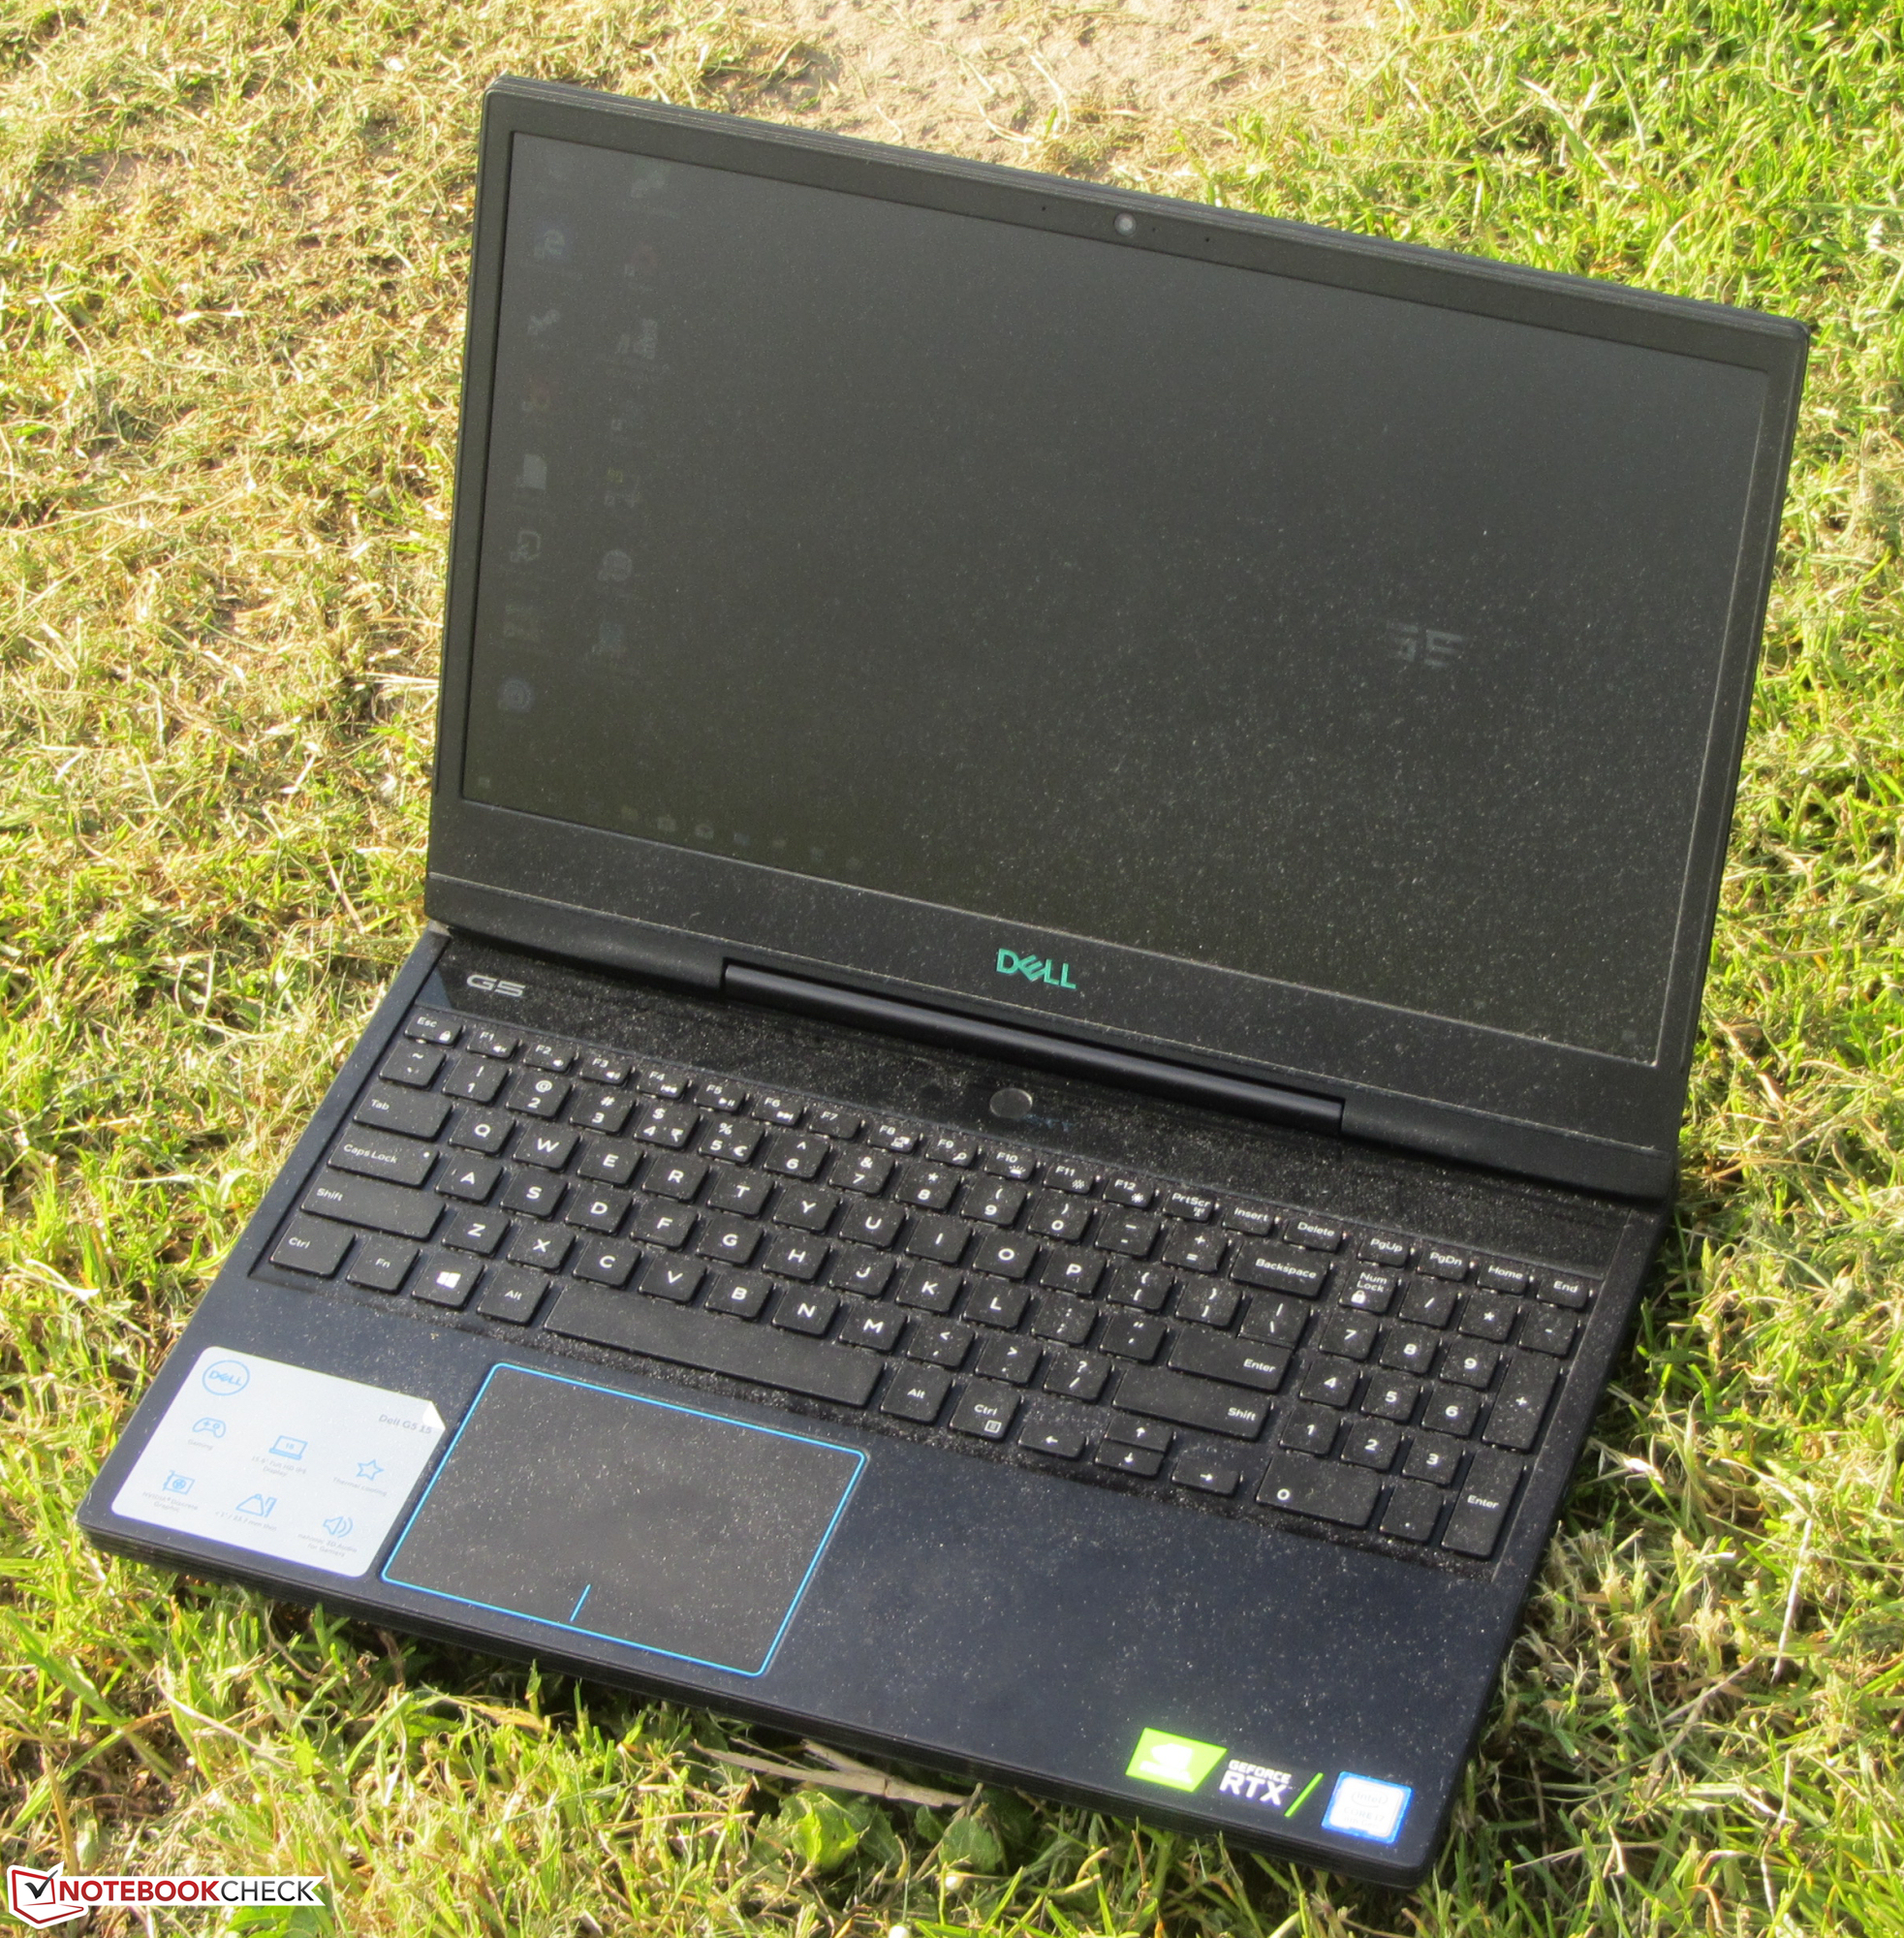
Breve Análise do Portátil Dell G5 15 5590 (i7-8750H, RTX 2060, SSD, FHD)
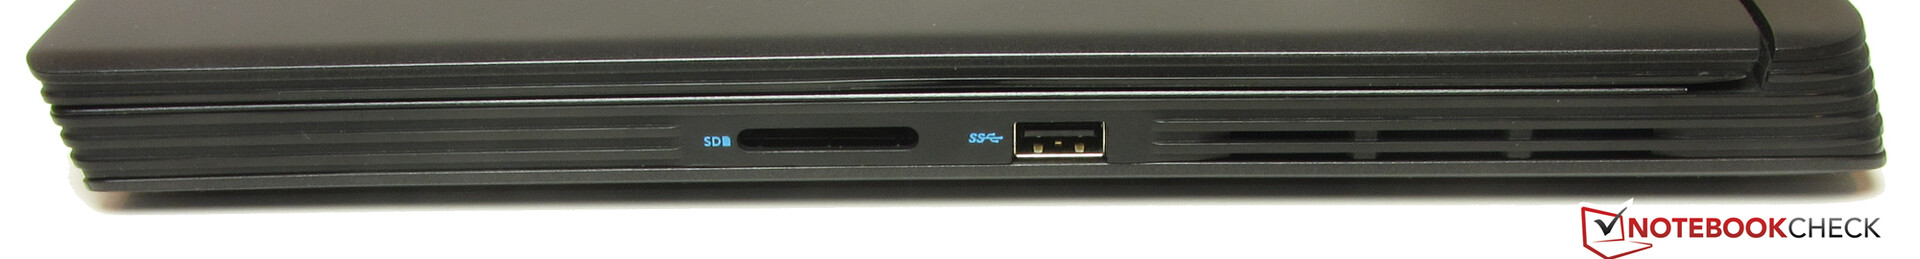
| SD Card Reader | |
| average JPG Copy Test (av. of 3 runs) | |
| Média da turma Gaming (20.9 - 210, n=54, últimos 2 anos) | |
| HP Pavilion Gaming 15t-cx0000 (Toshiba Exceria Pro SDXC 64 GB UHS-II) | |
| HP Omen 15-dc0015ng (Toshiba Exceria Pro SDXC 64 GB UHS-II) | |
| MSI GL73 8SE-010US (Toshiba Exceria Pro SDXC 64 GB UHS-II) | |
| Dell G5 15 5587 (Toshiba Exceria Pro SDXC 64 GB UHS-II) | |
| Dell G5 15 5590 (Toshiba Exceria Pro SDXC 64 GB UHS-II) | |
| maximum AS SSD Seq Read Test (1GB) | |
| Média da turma Gaming (25.5 - 261, n=51, últimos 2 anos) | |
| HP Omen 15-dc0015ng (Toshiba Exceria Pro SDXC 64 GB UHS-II) | |
| HP Pavilion Gaming 15t-cx0000 (Toshiba Exceria Pro SDXC 64 GB UHS-II) | |
| Dell G5 15 5587 (Toshiba Exceria Pro SDXC 64 GB UHS-II) | |
| Dell G5 15 5590 (Toshiba Exceria Pro SDXC 64 GB UHS-II) | |
| MSI GL73 8SE-010US (Toshiba Exceria Pro SDXC 64 GB UHS-II) | |
| |||||||||||||||||||||||||
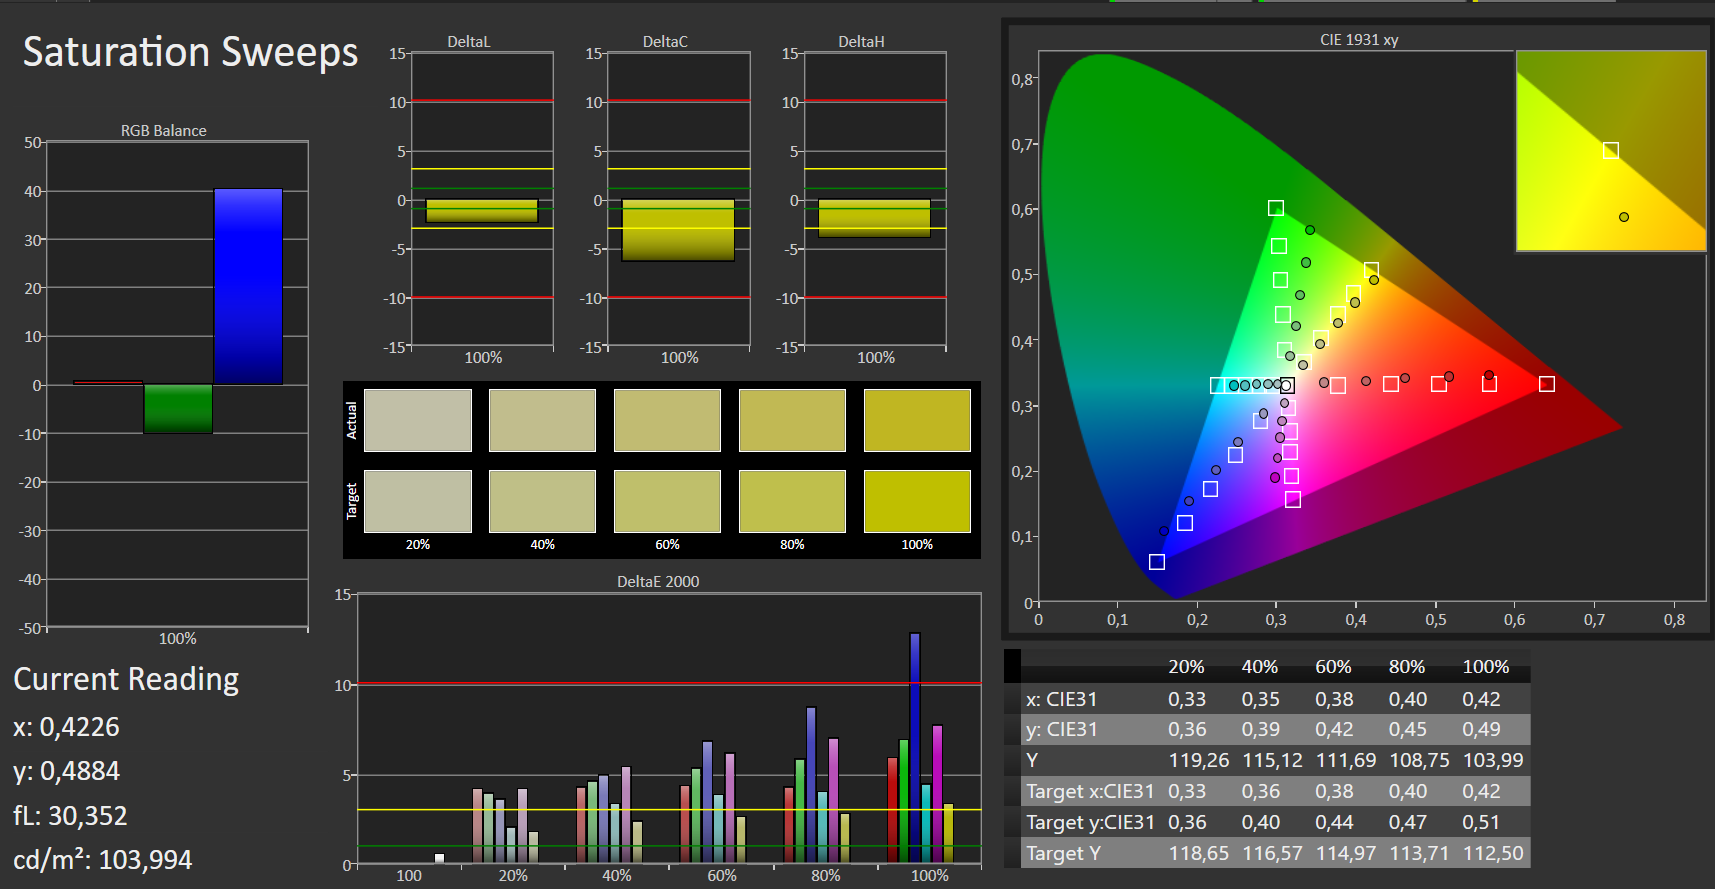
iluminação: 82 %
iluminação com acumulador: 234 cd/m²
Contraste: 1376:1 (Preto: 0.17 cd/m²)
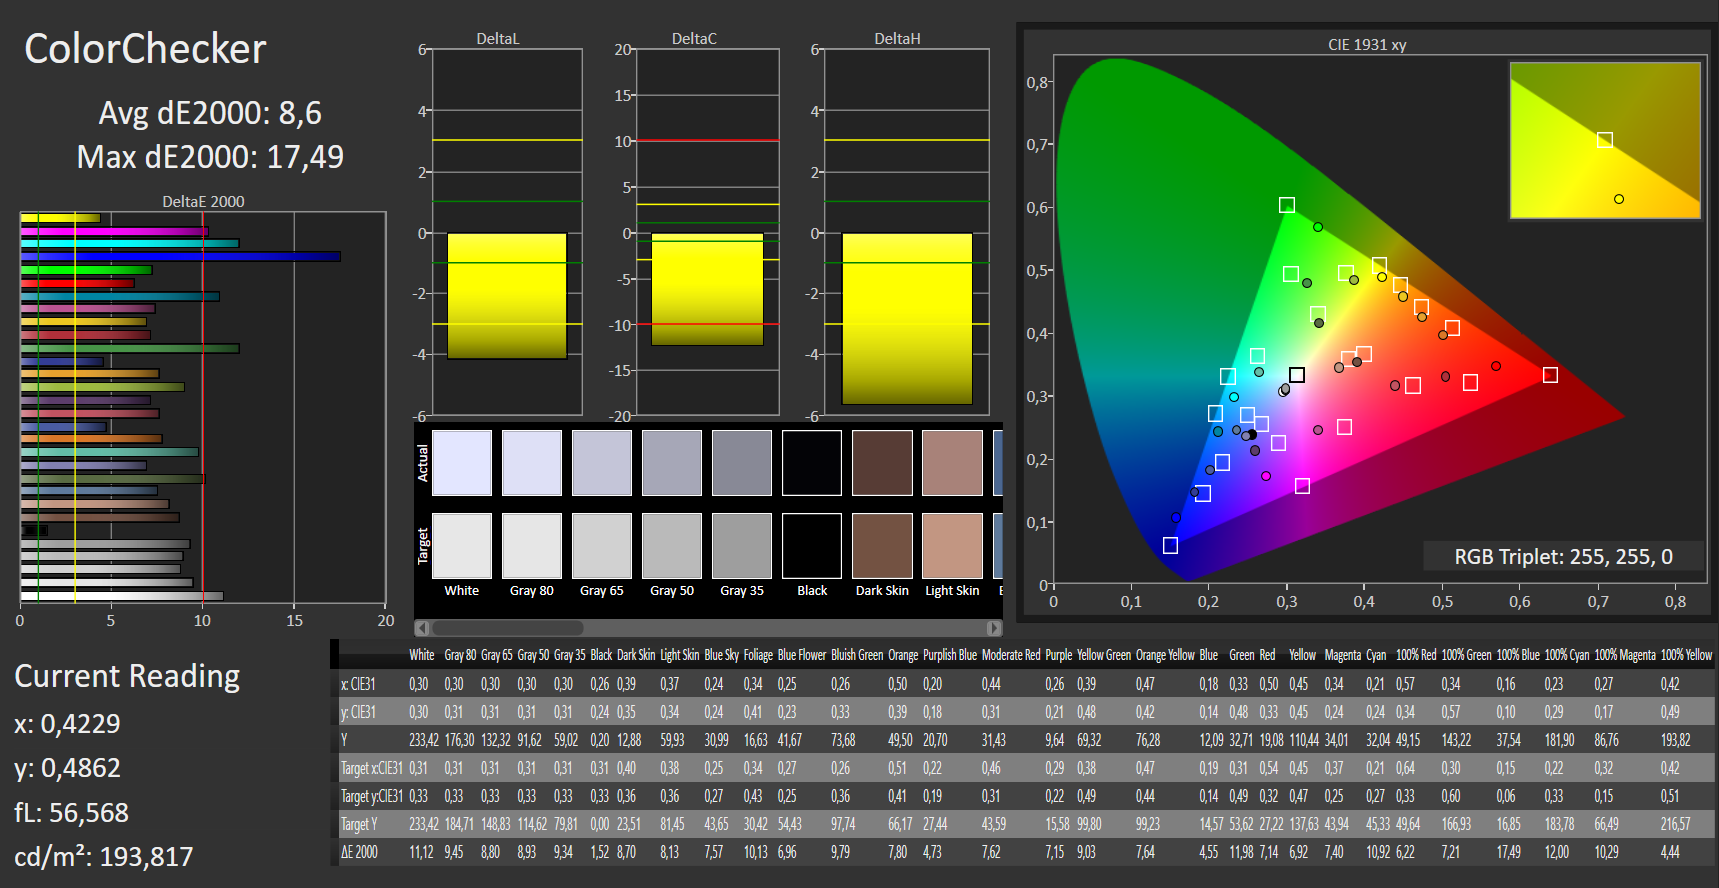
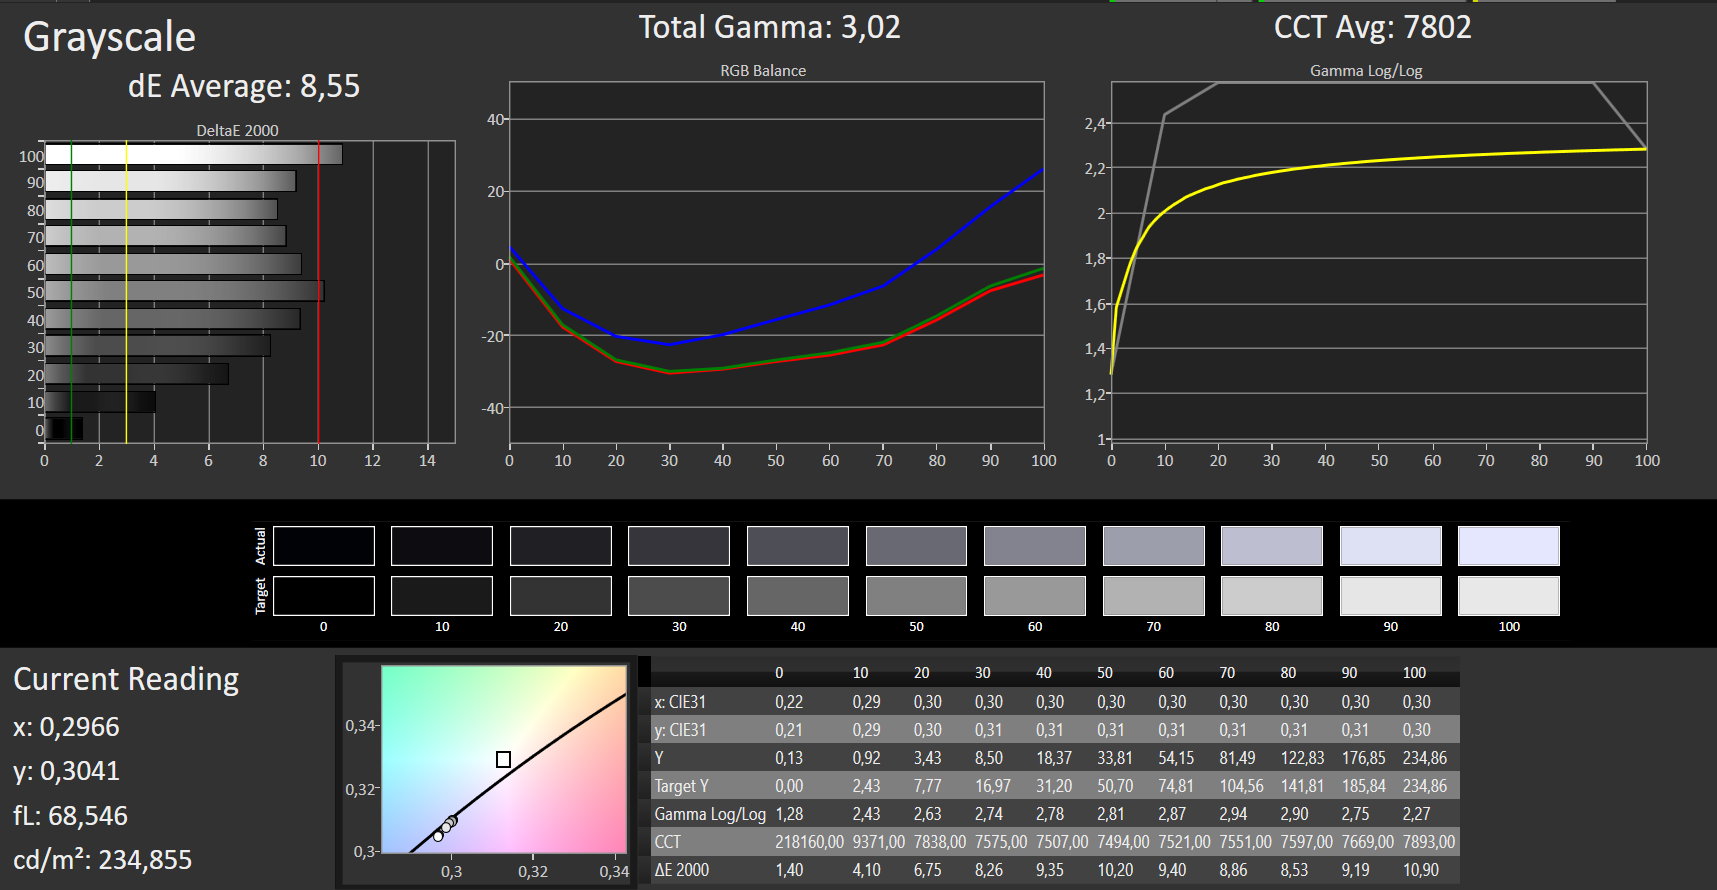
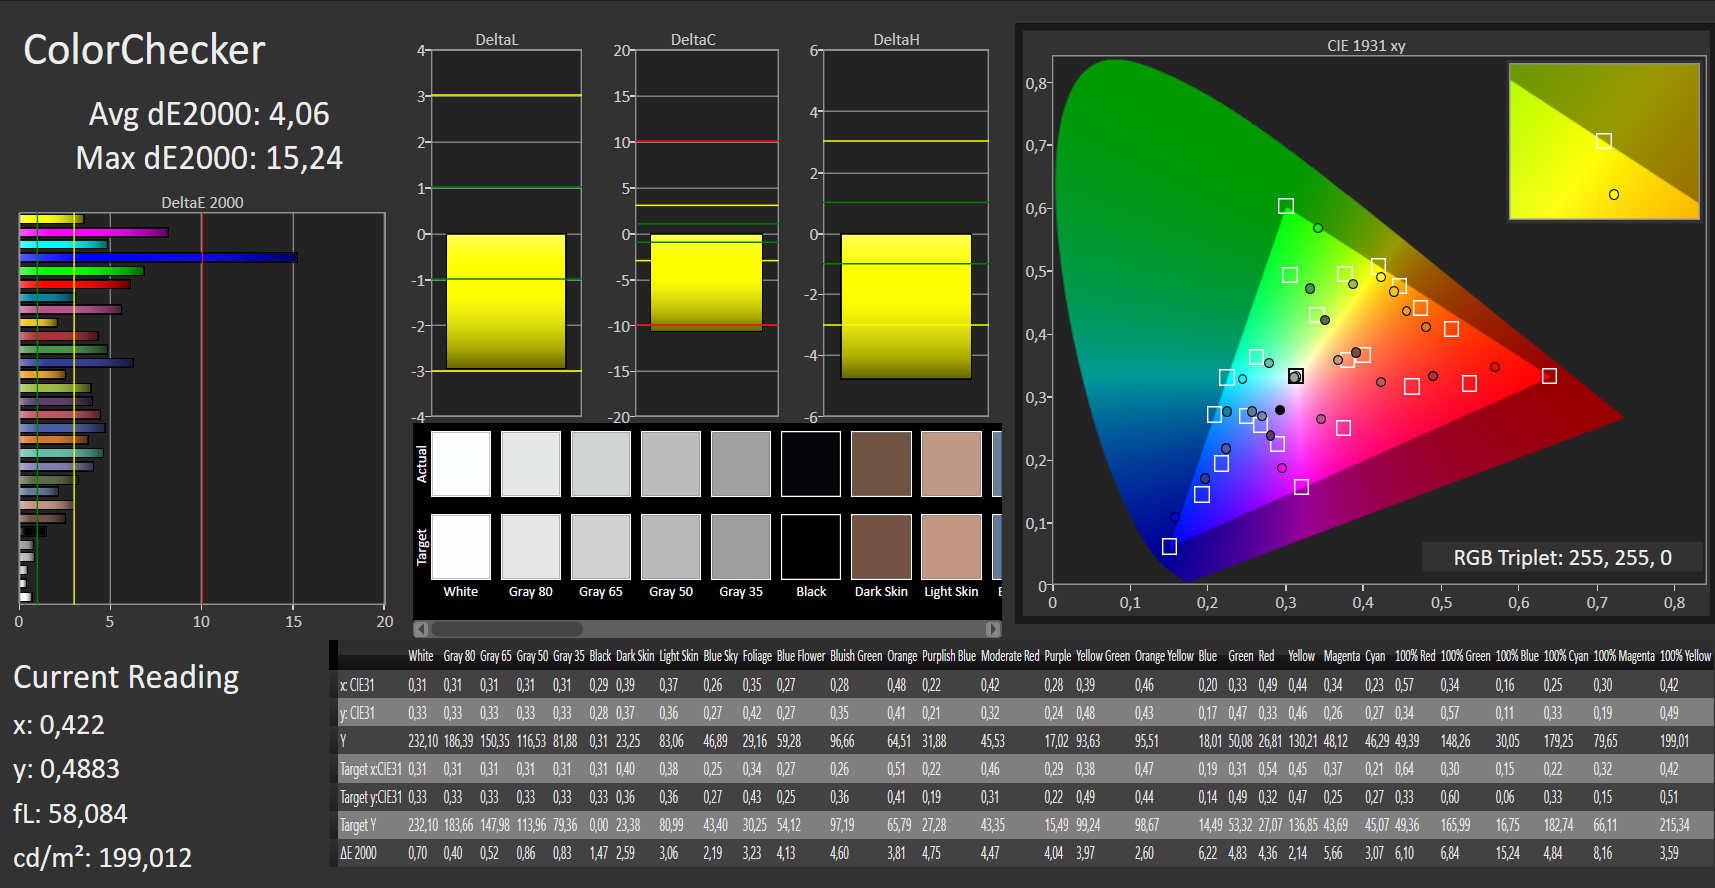
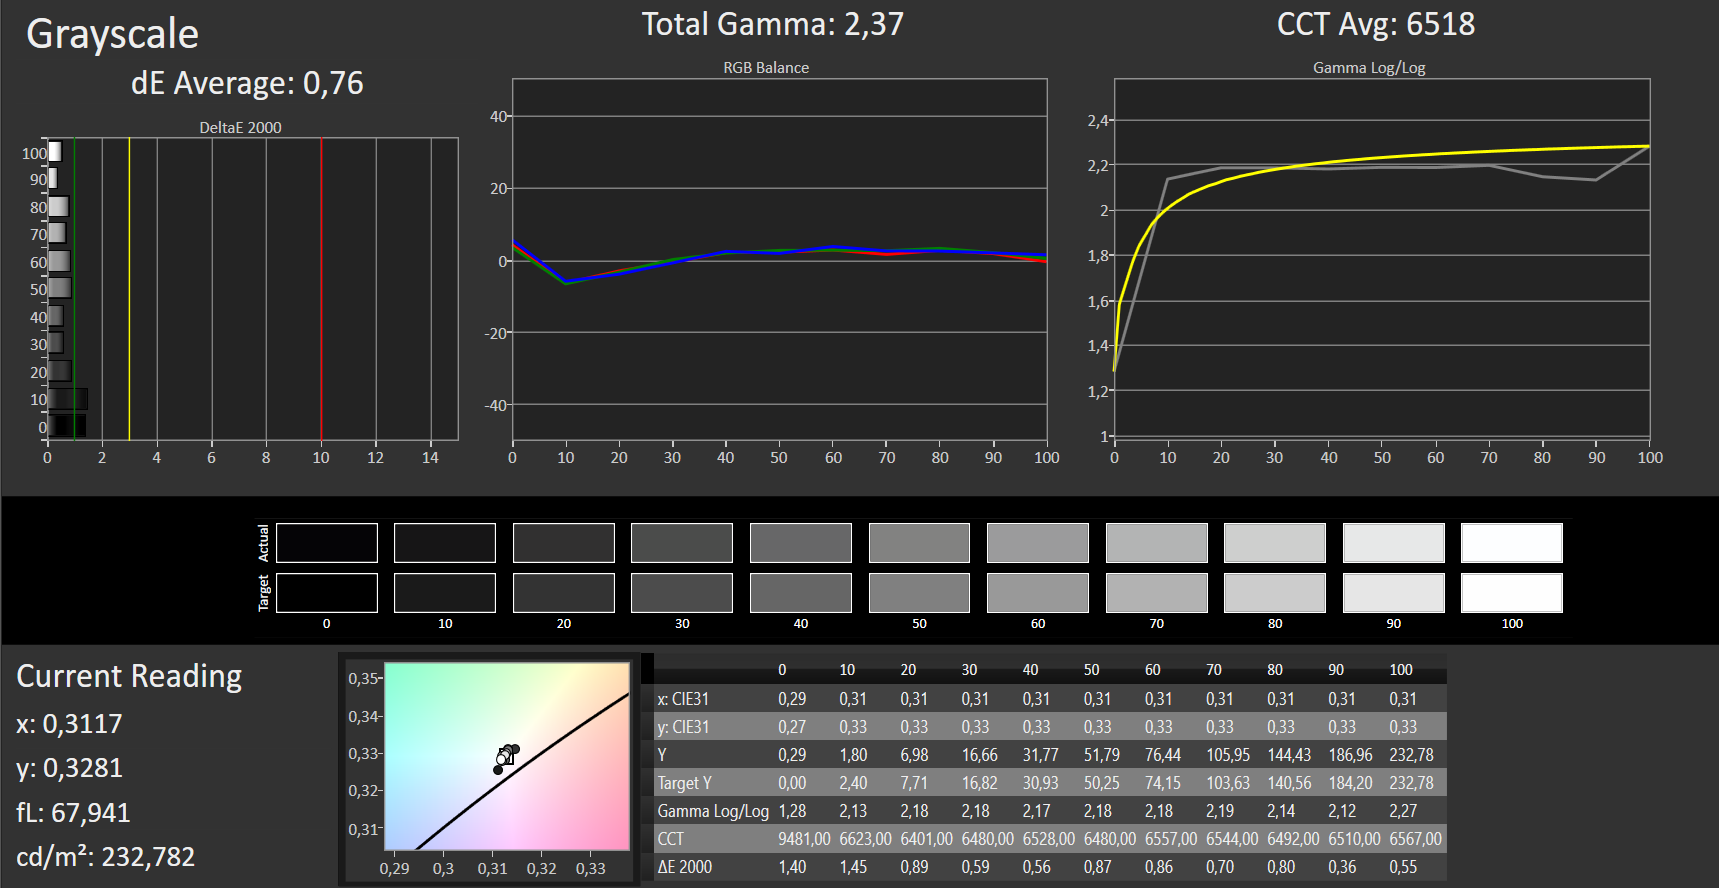
ΔE ColorChecker Calman: 8.6 | ∀{0.5-29.43 Ø4.71}
calibrated: 4.06
ΔE Greyscale Calman: 8.55 | ∀{0.09-98 Ø4.96}
59% sRGB (Argyll 1.6.3 3D)
37% AdobeRGB 1998 (Argyll 1.6.3 3D)
40.56% AdobeRGB 1998 (Argyll 3D)
59.1% sRGB (Argyll 3D)
39.26% Display P3 (Argyll 3D)
Gamma: 3.02
CCT: 7802 K
| Dell G5 15 5590 IPS, 1920x1080, 15.6" | Dell G5 15 5587 IPS, 1920x1080, 15.6" | Lenovo Legion Y530-15ICH IPS, 1920x1080, 15.6" | HP Omen 15-dc0015ng IPS, 1920x1080, 15.6" | Acer Aspire Nitro 5 AN515-54-53Z2 IPS, 1920x1080, 15.6" | HP Pavilion Gaming 15t-cx0000 IPS, 1920x1080, 15.6" | MSI GL73 8SE-010US TN LED, 1920x1080, 17.3" | |
|---|---|---|---|---|---|---|---|
| Display | -3% | 58% | 61% | -3% | 63% | 104% | |
| Display P3 Coverage (%) | 39.26 | 38.13 -3% | 62.5 59% | 64.2 64% | 37.97 -3% | 66.5 69% | 91.1 132% |
| sRGB Coverage (%) | 59.1 | 56.8 -4% | 93 57% | 93.4 58% | 57 -4% | 91.7 55% | 100 69% |
| AdobeRGB 1998 Coverage (%) | 40.56 | 39.47 -3% | 63.8 57% | 65.1 61% | 39.23 -3% | 67.1 65% | 85.4 111% |
| Response Times | 24% | 65% | 63% | 9% | 62% | 73% | |
| Response Time Grey 50% / Grey 80% * (ms) | 45 ? | 33 ? 27% | 15 ? 67% | 17 ? 62% | 42 ? 7% | 17.6 ? 61% | 12.8 ? 72% |
| Response Time Black / White * (ms) | 30 ? | 24 ? 20% | 11 ? 63% | 11 ? 63% | 26.8 ? 11% | 11.2 ? 63% | 8.2 ? 73% |
| PWM Frequency (Hz) | 25770 ? | ||||||
| Screen | -6% | 13% | 6% | 9% | 26% | 20% | |
| Brightness middle (cd/m²) | 234 | 229 -2% | 305 30% | 317 35% | 238 2% | 357.5 53% | 326.4 39% |
| Brightness (cd/m²) | 219 | 224 2% | 284 30% | 283 29% | 226 3% | 351 60% | 317 45% |
| Brightness Distribution (%) | 82 | 87 6% | 83 1% | 76 -7% | 83 1% | 85 4% | 90 10% |
| Black Level * (cd/m²) | 0.17 | 0.28 -65% | 0.52 -206% | 0.62 -265% | 0.27 -59% | 0.36 -112% | 0.28 -65% |
| Contrast (:1) | 1376 | 818 -41% | 587 -57% | 511 -63% | 881 -36% | 993 -28% | 1166 -15% |
| Colorchecker dE 2000 * | 8.6 | 6.1 29% | 3.63 58% | 2.83 67% | 4.11 52% | 4.19 51% | 7.83 9% |
| Colorchecker dE 2000 max. * | 17.49 | 12.2 30% | 8.18 53% | 5.78 67% | 6.89 61% | 6.97 60% | 13.36 24% |
| Colorchecker dE 2000 calibrated * | 4.06 | 6.12 -51% | 1.31 68% | 3.76 7% | 3.2 21% | 2.83 30% | |
| Greyscale dE 2000 * | 8.55 | 5.68 34% | 4.77 44% | 2 77% | 1.78 79% | 3.5 59% | 10.9 -27% |
| Gamma | 3.02 73% | 2.4 92% | 2.54 87% | 2.28 96% | 2.41 91% | 2.324 95% | 1.97 112% |
| CCT | 7802 83% | 6989 93% | 7500 87% | 6493 100% | 6311 103% | 7028 92% | 11056 59% |
| Color Space (Percent of AdobeRGB 1998) (%) | 37 | 36 -3% | 59 59% | 60 62% | 36 -3% | 60 62% | 75.8 105% |
| Color Space (Percent of sRGB) (%) | 59 | 57 -3% | 93 58% | 93 58% | 57 -3% | 91 54% | 100 69% |
| Média Total (Programa/Configurações) | 5% /
-2% | 45% /
28% | 43% /
25% | 5% /
7% | 50% /
37% | 66% /
43% |
* ... menor é melhor
Exibir tempos de resposta
| ↔ Tempo de resposta preto para branco | ||
|---|---|---|
| 30 ms ... ascensão ↗ e queda ↘ combinadas | ↗ 17 ms ascensão | 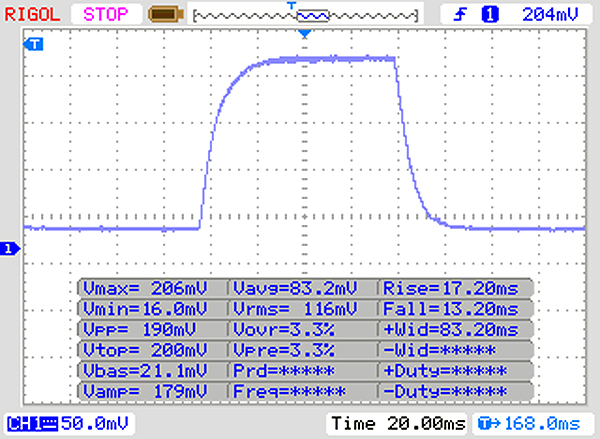 |
| ↘ 13 ms queda | ||
| A tela mostra taxas de resposta lentas em nossos testes e será insatisfatória para os jogadores. Em comparação, todos os dispositivos testados variam de 0.1 (mínimo) a 240 (máximo) ms. » 80 % de todos os dispositivos são melhores. Isso significa que o tempo de resposta medido é pior que a média de todos os dispositivos testados (19.8 ms). | ||
| ↔ Tempo de resposta 50% cinza a 80% cinza | ||
| 45 ms ... ascensão ↗ e queda ↘ combinadas | ↗ 22 ms ascensão | 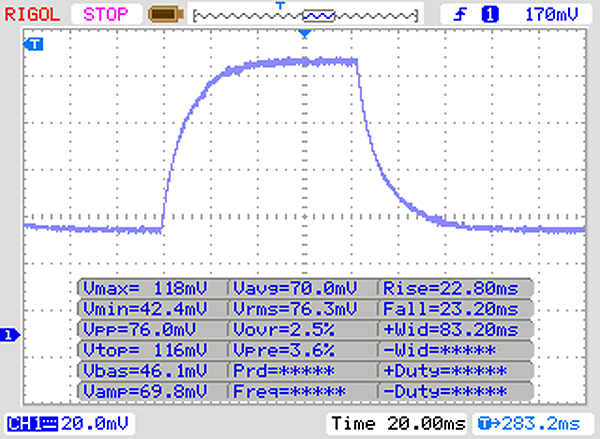 |
| ↘ 23 ms queda | ||
| A tela mostra taxas de resposta lentas em nossos testes e será insatisfatória para os jogadores. Em comparação, todos os dispositivos testados variam de 0.165 (mínimo) a 636 (máximo) ms. » 77 % de todos os dispositivos são melhores. Isso significa que o tempo de resposta medido é pior que a média de todos os dispositivos testados (31 ms). | ||
Cintilação da tela / PWM (modulação por largura de pulso)
| Tela tremeluzindo / PWM não detectado | 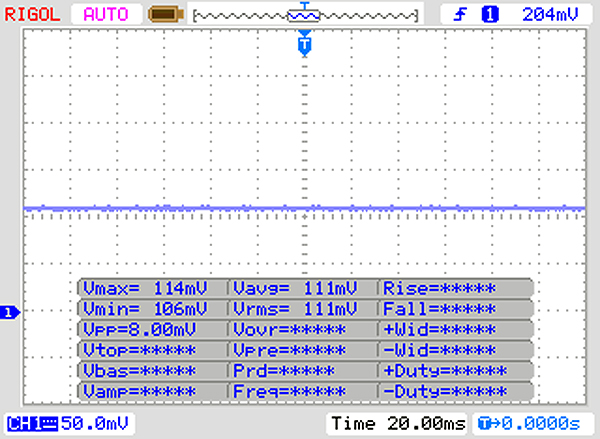 | ||
[pwm_comparison] Em comparação: 52 % de todos os dispositivos testados não usam PWM para escurecer a tela. Se PWM foi detectado, uma média de 7754 (mínimo: 5 - máximo: 343500) Hz foi medida. | |||

| Cinebench R10 | |
| Rendering Single 32Bit | |
| Média da turma Gaming (7457 - 12575, n=9, últimos 2 anos) | |
| Dell G5 15 5587 | |
| Média Intel Core i7-8750H (6236 - 6645, n=25) | |
| HP Omen 15-dc0015ng | |
| Dell G5 15 5590 | |
| Rendering Multiple CPUs 32Bit | |
| Média da turma Gaming (42932 - 102066, n=9, últimos 2 anos) | |
| Dell G5 15 5590 | |
| Média Intel Core i7-8750H (29664 - 35307, n=25) | |
| HP Omen 15-dc0015ng | |
| Dell G5 15 5587 | |
| Cinebench R20 | |
| CPU (Single Core) | |
| Média da turma Gaming (442 - 913, n=106, últimos 2 anos) | |
| Média Intel Core i7-8750H (403 - 418, n=6) | |
| Dell G5 15 5590 | |
| CPU (Multi Core) | |
| Média da turma Gaming (4029 - 16433, n=106, últimos 2 anos) | |
| Dell G5 15 5590 | |
| Média Intel Core i7-8750H (2142 - 2707, n=6) | |
| Geekbench 3 | |
| 32 Bit Multi-Core Score | |
| HP Omen 15-dc0015ng | |
| Dell G5 15 5590 | |
| Média Intel Core i7-8750H (20725 - 22665, n=13) | |
| 32 Bit Single-Core Score | |
| HP Omen 15-dc0015ng | |
| Média Intel Core i7-8750H (3734 - 4163, n=13) | |
| Dell G5 15 5590 | |
| Geekbench 4.4 | |
| 64 Bit Multi-Core Score | |
| Média da turma Gaming (89200 - 101054, n=3, últimos 2 anos) | |
| HP Omen 15-dc0015ng | |
| Média Intel Core i7-8750H (17709 - 23313, n=17) | |
| Dell G5 15 5590 | |
| 64 Bit Single-Core Score | |
| Média da turma Gaming (9335 - 9775, n=3, últimos 2 anos) | |
| HP Omen 15-dc0015ng | |
| Média Intel Core i7-8750H (4669 - 5146, n=17) | |
| Dell G5 15 5590 | |
| Mozilla Kraken 1.1 - Total | |
| Dell G5 15 5590 (Edge 44) | |
| MSI GL73 8SE-010US (Edge 42.17134.1.0) | |
| Dell G5 15 5587 (Edge 42.17134.1.0) | |
| Média Intel Core i7-8750H (695 - 1272, n=50) | |
| HP Omen 15-dc0015ng (Edge 44) | |
| Lenovo Legion Y530-15ICH | |
| Média da turma Gaming (391 - 590, n=100, últimos 2 anos) | |
| Octane V2 - Total Score | |
| Média da turma Gaming (93292 - 139447, n=27, últimos 2 anos) | |
| Lenovo Legion Y530-15ICH | |
| HP Omen 15-dc0015ng (Edge 44) | |
| Dell G5 15 5587 (Edge 42.17134.1.0) | |
| MSI GL73 8SE-010US (Edge 42.17134.1.0) | |
| Média Intel Core i7-8750H (27460 - 44549, n=47) | |
| Dell G5 15 5590 (Edge 44) | |
| JetStream 1.1 - 1.1 Total | |
| Média da turma Gaming (549 - 647, n=3, últimos 2 anos) | |
| MSI GL73 8SE-010US (Edge 42.17134.1.0) | |
| Média Intel Core i7-8750H (205 - 299, n=49) | |
| Dell G5 15 5587 (Edge 42.17134.1.0) | |
| Dell G5 15 5590 (Edge 44) | |
| HP Omen 15-dc0015ng (Edge 44) | |
| Lenovo Legion Y530-15ICH | |
* ... menor é melhor
| PCMark 7 Score | 6138 pontos | |
| PCMark 8 Home Score Accelerated v2 | 4165 pontos | |
| PCMark 8 Creative Score Accelerated v2 | 4921 pontos | |
| PCMark 8 Work Score Accelerated v2 | 5291 pontos | |
| PCMark 10 Score | 5069 pontos | |
Ajuda | ||

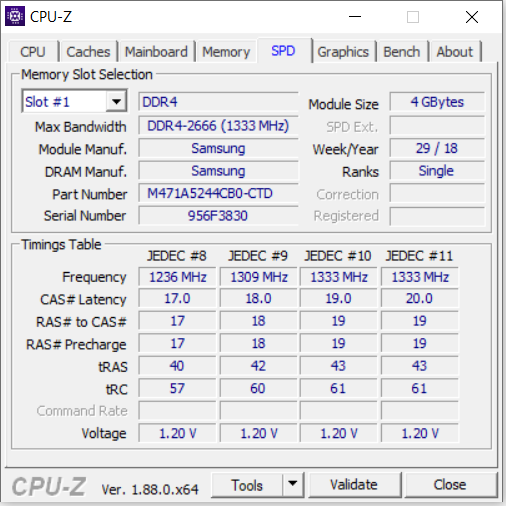
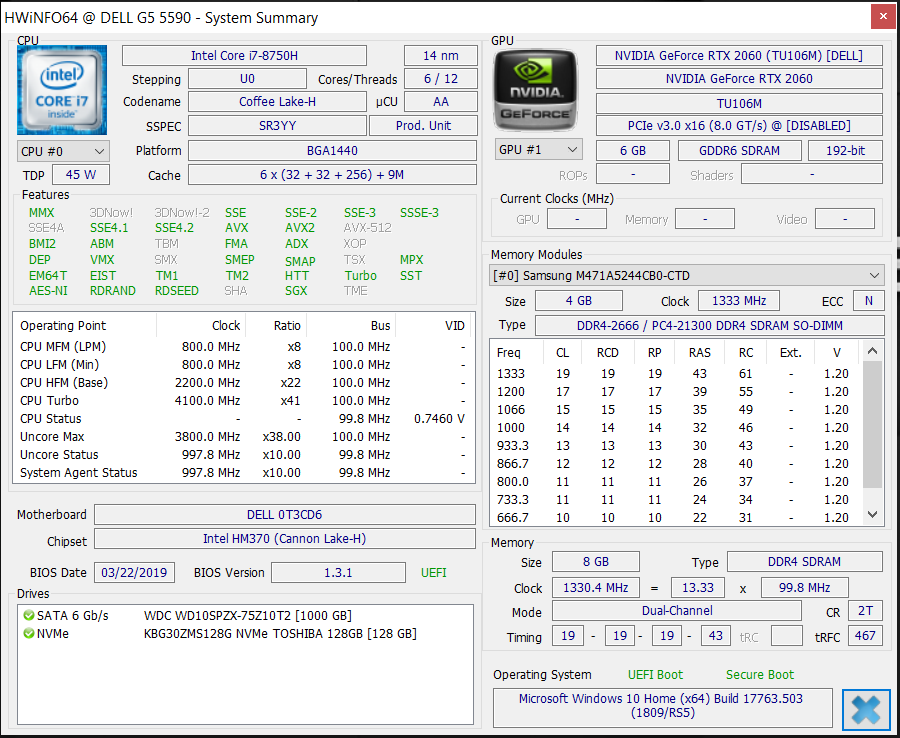
| Dell G5 15 5590 KBG30ZMS128G | Dell G5 15 5587 SK hynix SC311 M.2 | Lenovo Legion Y530-15ICH Samsung SSD PM981 MZVLB256HAHQ | HP Omen 15-dc0015ng Toshiba XG5 KXG50ZNV512G | Acer Aspire Nitro 5 AN515-54-53Z2 WDC PC SN520 SDAPNUW-512G | HP Pavilion Gaming 15t-cx0000 Samsung SSD PM981 MZVLB512HAJQ | Média KBG30ZMS128G | |
|---|---|---|---|---|---|---|---|
| CrystalDiskMark 5.2 / 6 | 17% | 339% | 155% | 321% | 405% | 2% | |
| Write 4K (MB/s) | 64.3 | 67 4% | 108.9 69% | 87.5 36% | 109.1 70% | 129.5 101% | 67 ? 4% |
| Read 4K (MB/s) | 29.3 | 25.8 -12% | 40.23 37% | 16.08 -45% | 42.05 44% | 44.61 52% | 30.8 ? 5% |
| Write Seq (MB/s) | 131.1 | 238 82% | 1390 960% | 614 368% | 1457 1011% | 1268 867% | 129.1 ? -2% |
| Read Seq (MB/s) | 776 | 506 -35% | 964 24% | 1341 73% | 1421 83% | 992 28% | 817 ? 5% |
| Write 4K Q32T1 (MB/s) | 96.8 | 155.2 60% | 314.2 225% | 307.9 218% | 287.8 197% | 535 453% | 95.7 ? -1% |
| Read 4K Q32T1 (MB/s) | 198.6 | 195.8 -1% | 369.2 86% | 358.4 80% | 317.9 60% | 601 203% | 197.6 ? -1% |
| Write Seq Q32T1 (MB/s) | 127.8 | 232.7 82% | 1506 1078% | 525 311% | 1455 1038% | 1938 1416% | 130.3 ? 2% |
| Read Seq Q32T1 (MB/s) | 1044 | 549 -47% | 3446 230% | 3077 195% | 1739 67% | 2306 121% | 1121 ? 7% |
| 3DMark 06 Standard Score | 33034 pontos | |
| 3DMark 11 Performance | 16013 pontos | |
| 3DMark Ice Storm Standard Score | 103519 pontos | |
| 3DMark Cloud Gate Standard Score | 35045 pontos | |
| 3DMark Fire Strike Score | 13912 pontos | |
| 3DMark Time Spy Score | 5994 pontos | |
Ajuda | ||
| BioShock Infinite - 1920x1080 Ultra Preset, DX11 (DDOF) | |
| Média NVIDIA GeForce RTX 2060 Mobile (119 - 156, n=17) | |
| HP Omen 15-dc0015ng | |
| Dell G5 15 5590 | |
| Aorus 15 W9 | |
| MSI GL73 8SE-010US | |
| Lenovo Legion Y530-15ICH | |
| Dell G5 15 5587 | |
| HP Pavilion Gaming 15t-cx0000 | |
| The Witcher 3 - 1920x1080 Ultra Graphics & Postprocessing (HBAO+) | |
| Média da turma Gaming (104.7 - 240, n=7, últimos 2 anos) | |
| Média NVIDIA GeForce RTX 2060 Mobile (50.6 - 74, n=40) | |
| Dell G5 15 5590 | |
| Aorus 15 W9 | |
| HP Omen 15-dc0015ng | |
| MSI GL73 8SE-010US | |
| Lenovo Legion Y530-15ICH | |
| Acer Aspire Nitro 5 AN515-54-53Z2 | |
| Dell G5 15 5587 | |
| GTA V - 1920x1080 Highest AA:4xMSAA + FX AF:16x | |
| Média da turma Gaming (48.3 - 186.9, n=94, últimos 2 anos) | |
| Média NVIDIA GeForce RTX 2060 Mobile (60 - 70.8, n=5) | |
| HP Omen 15-dc0015ng | |
| Dell G5 15 5590 | |
| Dell G5 15 5587 | |
| Far Cry 5 - 1920x1080 Ultra Preset AA:T | |
| Média da turma Gaming (70 - 151, n=6, últimos 2 anos) | |
| Média NVIDIA GeForce RTX 2060 Mobile (76 - 90, n=9) | |
| Dell G5 15 5590 | |
| Dell G5 15 5587 | |
| baixo | média | alto | ultra | |
|---|---|---|---|---|
| StarCraft 2 (2010) | 419.1 | 188.6 | 181.6 | 159.7 |
| Diablo III (2012) | 222.5 | 197.5 | 200.8 | 173 |
| BioShock Infinite (2013) | 266.3 | 254.9 | 241.9 | 136.9 |
| GTA V (2015) | 156.9 | 150.2 | 116.1 | 64.1 |
| The Witcher 3 (2015) | 235.1 | 173.7 | 105.2 | 60 |
| World of Warships (2015) | 178.4 | 151.7 | 129.3 | 123.7 |
| Ashes of the Singularity (2016) | 71.1 | 65.4 | 64.4 | |
| Civilization 6 (2016) | 152.9 | 116.8 | 92.4 | 90.4 |
| Ark Survival Evolved (2017) | 128.5 | 67.4 | 52.1 | 36.1 |
| The Evil Within 2 (2017) | 79.6 | 53.1 | 53.2 | 53.6 |
| Destiny 2 (2017) | 125.9 | 114.7 | 110.5 | 99.7 |
| Final Fantasy XV Benchmark (2018) | 100.2 | 76.8 | 56.8 | |
| World of Tanks enCore (2018) | 425.6 | 218.2 | 121.7 | |
| Far Cry 5 (2018) | 103 | 85 | 83 | 79 |
| F1 2018 (2018) | 175 | 133 | 103 | 78 |
| Forza Horizon 4 (2018) | 135 | 108 | 107 | 88 |
| Far Cry New Dawn (2019) | 95 | 82 | 79 | 72 |
| Metro Exodus (2019) | 113.2 | 70 | 53.3 | 43.7 |
| The Division 2 (2019) | 128 | 90 | 74 | 57 |
| Anno 1800 (2019) | 79.3 | 73.2 | 63.1 | 36.9 |
| Rage 2 (2019) | 159.2 | 85.6 | 72.9 | 70.5 |
Barulho
| Ocioso |
| 30.4 / 30.4 / 33.4 dB |
| Carga |
| 42 / 48.7 dB |
 | ||
30 dB silencioso 40 dB(A) audível 50 dB(A) ruidosamente alto |
||
min: | ||
| Dell G5 15 5590 i7-8750H, GeForce RTX 2060 Mobile | Lenovo Legion Y530-15ICH i7-8750H, GeForce GTX 1060 Mobile | HP Omen 15-dc0015ng i7-8750H, GeForce GTX 1070 Max-Q | Acer Aspire Nitro 5 AN515-54-53Z2 i5-9300H, GeForce GTX 1650 Mobile | HP Pavilion Gaming 15t-cx0000 i7-8750H, GeForce GTX 1060 Max-Q | Dell G5 15 5587 i5-8300H, GeForce GTX 1060 Max-Q | MSI GL73 8SE-010US i7-8750H, GeForce RTX 2060 Mobile | Média NVIDIA GeForce RTX 2060 Mobile | Média da turma Gaming | |
|---|---|---|---|---|---|---|---|---|---|
| Noise | 3% | 0% | -2% | 1% | 4% | -2% | 1% | 7% | |
| desligado / ambiente * (dB) | 30.4 | 30.2 1% | 30.6 -1% | 30 1% | 28.3 7% | 30.3 -0% | 28.6 6% | 27.9 ? 8% | 24.1 ? 21% |
| Idle Minimum * (dB) | 30.4 | 30.9 -2% | 30.6 -1% | 30 1% | 32.2 -6% | 31.1 -2% | 33.8 -11% | 29 ? 5% | 26 ? 14% |
| Idle Average * (dB) | 30.4 | 30.9 -2% | 30.6 -1% | 31 -2% | 32.4 -7% | 31.1 -2% | 34 -12% | 30 ? 1% | 27.4 ? 10% |
| Idle Maximum * (dB) | 33.4 | 31.6 5% | 32.2 4% | 33 1% | 32.4 3% | 34.2 -2% | 34.1 -2% | 33 ? 1% | 30.1 ? 10% |
| Load Average * (dB) | 42 | 42.3 -1% | 47.2 -12% | 46 -10% | 40.2 4% | 34.9 17% | 36.5 13% | 44 ? -5% | 43.6 ? -4% |
| Load Maximum * (dB) | 48.7 | 40 18% | 42.3 13% | 49 -1% | 47.2 3% | 44 10% | 52.2 -7% | 51.6 ? -6% | 54.2 ? -11% |
| Witcher 3 ultra * (dB) | 41.7 | 46 | 45 | 42.7 | 47.8 |
* ... menor é melhor
(-) A temperatura máxima no lado superior é 51.5 °C / 125 F, em comparação com a média de 40.4 °C / 105 F , variando de 21.2 a 68.8 °C para a classe Gaming.
(-) A parte inferior aquece até um máximo de 48.3 °C / 119 F, em comparação com a média de 43.2 °C / 110 F
(+) Em uso inativo, a temperatura média para o lado superior é 25.8 °C / 78 F, em comparação com a média do dispositivo de 33.9 °C / ### class_avg_f### F.
(+) Os apoios para as mãos e o touchpad são mais frios que a temperatura da pele, com um máximo de 28.8 °C / 83.8 F e, portanto, são frios ao toque.
(±) A temperatura média da área do apoio para as mãos de dispositivos semelhantes foi 28.8 °C / 83.8 F (0 °C / 0 F).
| Dell G5 15 5590 i7-8750H, GeForce RTX 2060 Mobile | Lenovo Legion Y530-15ICH i7-8750H, GeForce GTX 1060 Mobile | HP Omen 15-dc0015ng i7-8750H, GeForce GTX 1070 Max-Q | Acer Aspire Nitro 5 AN515-54-53Z2 i5-9300H, GeForce GTX 1650 Mobile | HP Pavilion Gaming 15t-cx0000 i7-8750H, GeForce GTX 1060 Max-Q | Dell G5 15 5587 i5-8300H, GeForce GTX 1060 Max-Q | MSI GL73 8SE-010US i7-8750H, GeForce RTX 2060 Mobile | Média NVIDIA GeForce RTX 2060 Mobile | Média da turma Gaming | |
|---|---|---|---|---|---|---|---|---|---|
| Heat | 3% | -10% | 7% | -6% | -6% | 6% | -9% | -7% | |
| Maximum Upper Side * (°C) | 51.5 | 48.4 6% | 49.7 3% | 47 9% | 46 11% | 50.2 3% | 47 9% | 47.2 ? 8% | 45.2 ? 12% |
| Maximum Bottom * (°C) | 48.3 | 48 1% | 48 1% | 50 -4% | 52 -8% | 57 -18% | 44.4 8% | 52.7 ? -9% | 48.1 ? -0% |
| Idle Upper Side * (°C) | 27.2 | 26.7 2% | 32 -18% | 24 12% | 29 -7% | 28.6 -5% | 24.6 10% | 31 ? -14% | 31 ? -14% |
| Idle Bottom * (°C) | 27.4 | 26.9 2% | 34 -24% | 25 9% | 33 -20% | 28.9 -5% | 28 -2% | 32.9 ? -20% | 34.2 ? -25% |
* ... menor é melhor
Dell G5 15 5590 análise de áudio
(-) | alto-falantes não muito altos (###valor### dB)
Graves 100 - 315Hz
(-) | quase nenhum baixo - em média 21.6% menor que a mediana
(±) | a linearidade dos graves é média (13.3% delta para a frequência anterior)
Médios 400 - 2.000 Hz
(+) | médios equilibrados - apenas 1.9% longe da mediana
(+) | médios são lineares (4.7% delta para frequência anterior)
Altos 2 - 16 kHz
(+) | agudos equilibrados - apenas 3.9% longe da mediana
(±) | a linearidade dos máximos é média (7.7% delta para frequência anterior)
Geral 100 - 16.000 Hz
(±) | a linearidade do som geral é média (18.6% diferença em relação à mediana)
Comparado com a mesma classe
» 61% de todos os dispositivos testados nesta classe foram melhores, 9% semelhantes, 31% piores
» O melhor teve um delta de 6%, a média foi 18%, o pior foi 132%
Comparado com todos os dispositivos testados
» 42% de todos os dispositivos testados foram melhores, 8% semelhantes, 50% piores
» O melhor teve um delta de 4%, a média foi 23%, o pior foi 134%
Lenovo Legion Y530-15ICH análise de áudio
(-) | alto-falantes não muito altos (###valor### dB)
Graves 100 - 315Hz
(±) | graves reduzidos - em média 11.5% menor que a mediana
(+) | o baixo é linear (6.4% delta para a frequência anterior)
Médios 400 - 2.000 Hz
(±) | médios mais altos - em média 5% maior que a mediana
(+) | médios são lineares (6.9% delta para frequência anterior)
Altos 2 - 16 kHz
(+) | agudos equilibrados - apenas 3% longe da mediana
(+) | os máximos são lineares (4.6% delta da frequência anterior)
Geral 100 - 16.000 Hz
(±) | a linearidade do som geral é média (16% diferença em relação à mediana)
Comparado com a mesma classe
» 38% de todos os dispositivos testados nesta classe foram melhores, 6% semelhantes, 55% piores
» O melhor teve um delta de 6%, a média foi 18%, o pior foi 132%
Comparado com todos os dispositivos testados
» 25% de todos os dispositivos testados foram melhores, 5% semelhantes, 69% piores
» O melhor teve um delta de 4%, a média foi 23%, o pior foi 134%
| desligado | |
| Ocioso | |
| Carga |
|
Key:
min: | |
| Dell G5 15 5590 i7-8750H, GeForce RTX 2060 Mobile | Lenovo Legion Y530-15ICH i7-8750H, GeForce GTX 1060 Mobile | HP Omen 15-dc0015ng i7-8750H, GeForce GTX 1070 Max-Q | Acer Aspire Nitro 5 AN515-54-53Z2 i5-9300H, GeForce GTX 1650 Mobile | HP Pavilion Gaming 15t-cx0000 i7-8750H, GeForce GTX 1060 Max-Q | Dell G5 15 5587 i5-8300H, GeForce GTX 1060 Max-Q | MSI GL73 8SE-010US i7-8750H, GeForce RTX 2060 Mobile | Média NVIDIA GeForce RTX 2060 Mobile | Média da turma Gaming | |
|---|---|---|---|---|---|---|---|---|---|
| Power Consumption | -40% | -133% | -3% | -27% | -4% | -75% | -109% | -133% | |
| Idle Minimum * (Watt) | 3.5 | 7.3 -109% | 14 -300% | 5 -43% | 6 -71% | 4.9 -40% | 8.8 -151% | 11.5 ? -229% | 13 ? -271% |
| Idle Average * (Watt) | 6.9 | 11.1 -61% | 18.2 -164% | 7 -1% | 11.2 -62% | 8.5 -23% | 16.2 -135% | 16.5 ? -139% | 19 ? -175% |
| Idle Maximum * (Watt) | 8.5 | 12.6 -48% | 24 -182% | 11 -29% | 13.3 -56% | 9.1 -7% | 18.3 -115% | 23.7 ? -179% | 24.6 ? -189% |
| Load Average * (Watt) | 127 | 109 14% | 143 -13% | 89 30% | 89.2 30% | 90.7 29% | 86.1 32% | 107.5 ? 15% | 110.7 ? 13% |
| Load Maximum * (Watt) | 179 | 168 6% | 190 -6% | 132 26% | 134.5 25% | 144 20% | 186.4 -4% | 199.7 ? -12% | 259 ? -45% |
| Witcher 3 ultra * (Watt) | 126 | 90 | 101.9 | 110 | 146.7 |
* ... menor é melhor
| Dell G5 15 5590 i7-8750H, GeForce RTX 2060 Mobile, 60 Wh | Dell G5 15 5587 i5-8300H, GeForce GTX 1060 Max-Q, 56 Wh | Lenovo Legion Y530-15ICH i7-8750H, GeForce GTX 1060 Mobile, 52 Wh | HP Omen 15-dc0015ng i7-8750H, GeForce GTX 1070 Max-Q, 70.07 Wh | Acer Aspire Nitro 5 AN515-54-53Z2 i5-9300H, GeForce GTX 1650 Mobile, 57 Wh | HP Pavilion Gaming 15t-cx0000 i7-8750H, GeForce GTX 1060 Max-Q, 70 Wh | MSI GL73 8SE-010US i7-8750H, GeForce RTX 2060 Mobile, 41 Wh | Média da turma Gaming | |
|---|---|---|---|---|---|---|---|---|
| Duração da bateria | -23% | -60% | -44% | -8% | -36% | -66% | -25% | |
| Reader / Idle (h) | 14.8 | 11.8 -20% | 8.3 -44% | 7.7 -48% | 17.4 18% | 8 -46% | 6.5 -56% | 8.27 ? -44% |
| H.264 (h) | 8.4 | 5.4 -36% | 3.4 -60% | 8.32 ? -1% | ||||
| WiFi v1.3 (h) | 7.7 | 6.5 -16% | 3.8 -51% | 4.6 -40% | 8.1 5% | 6.3 -18% | 2.8 -64% | 7.11 ? -8% |
| Load (h) | 2.8 | 2.2 -21% | 0.4 -86% | 2 -29% | 1.5 -46% | 1.6 -43% | 0.6 -79% | 1.502 ? -46% |
Pro
Contra
A Dell entrega com o G5 15 5590 um portátil de jogos relativamente razoável no formato de 15,6 polegadas. Parece exagerado falar de um portátil de jogos a preços razoáveis ou a baixo preço quando estamos lidando com um preço de aproximadamente 1.400 Euros (~$1.567). No entanto, esta descrição é verdadeira. Laptops similares que oferecem a mesma combinação de CPU-GPU do G5 podem custar algumas centenas de euros a mais.
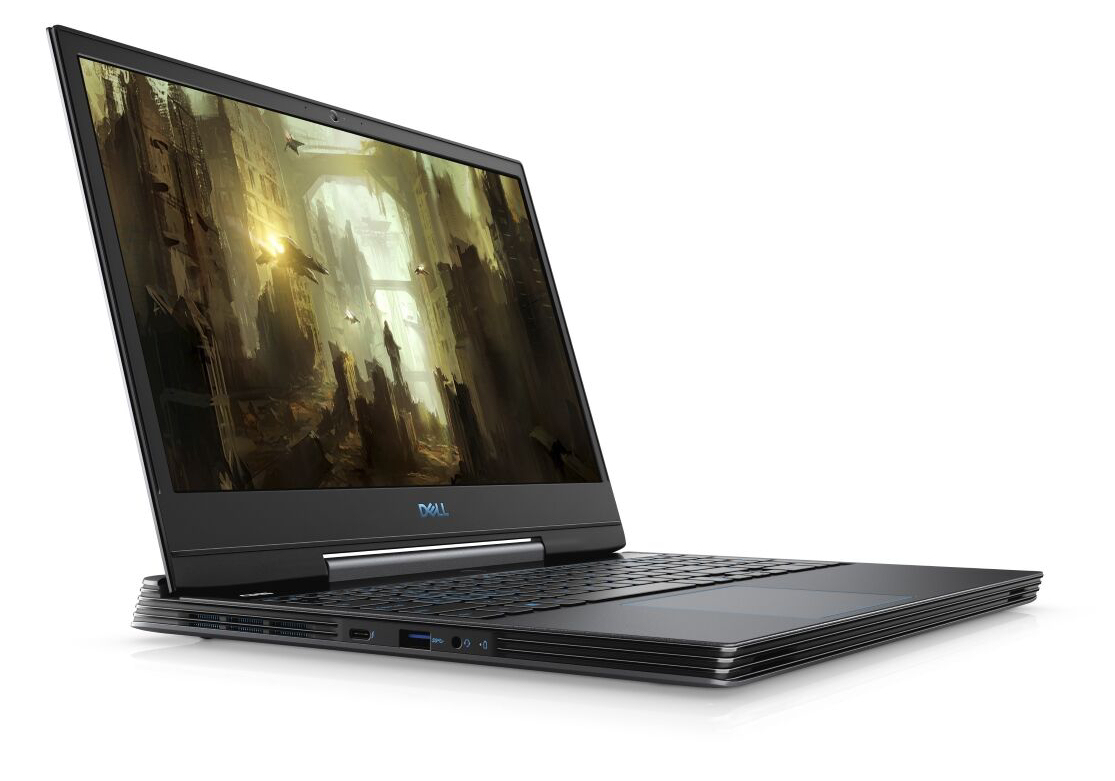
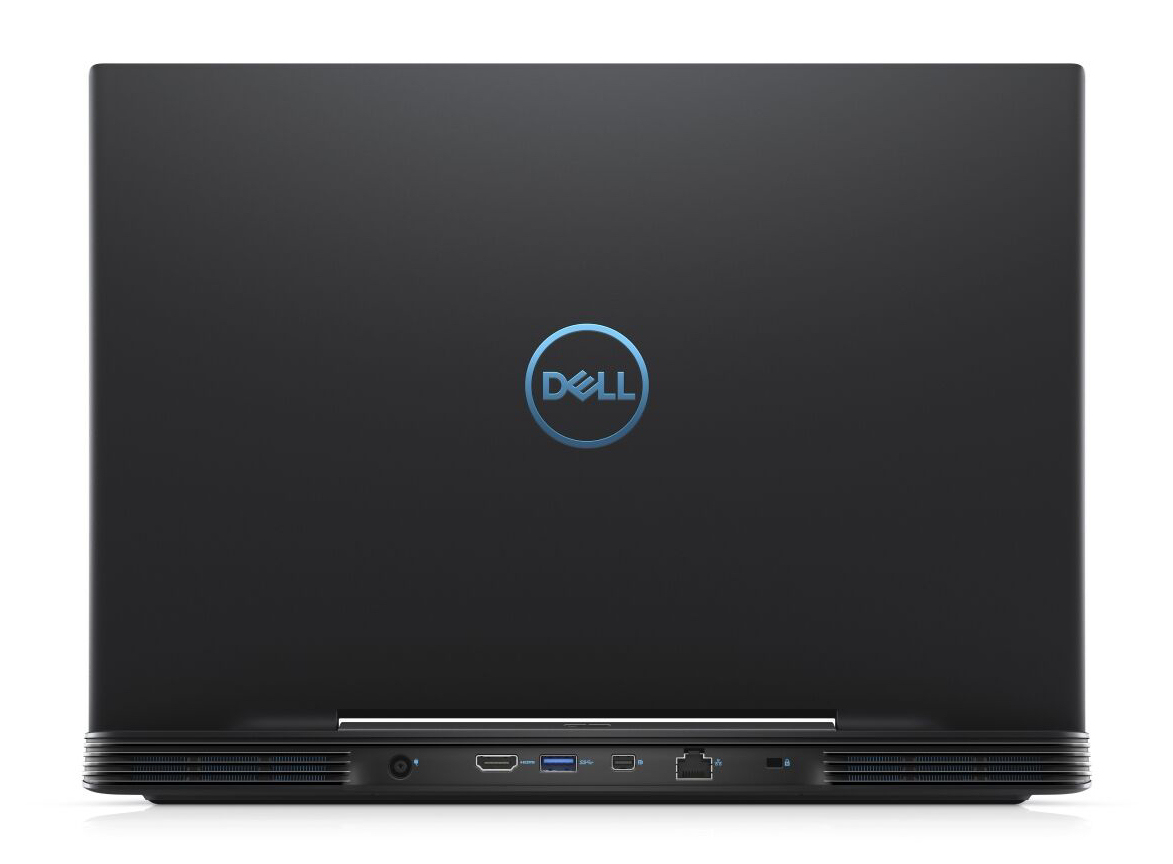
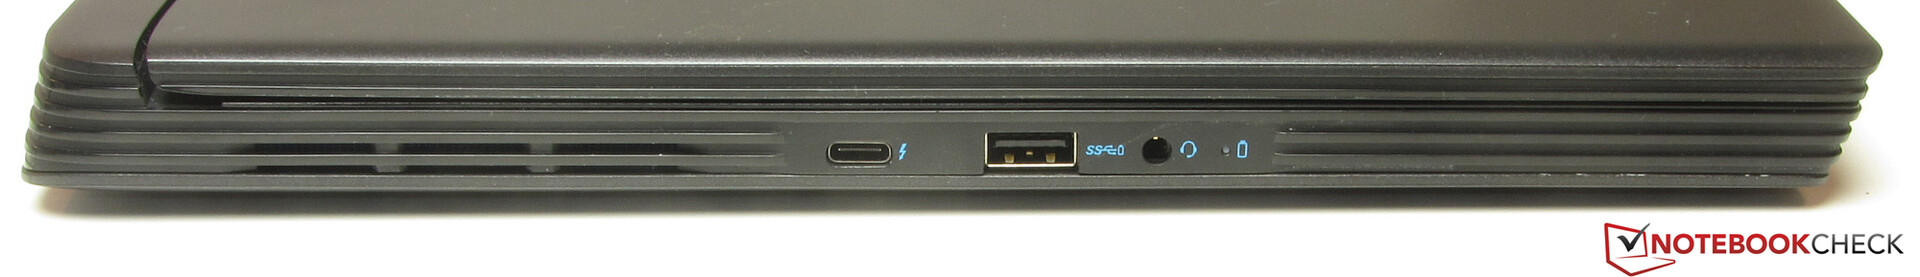
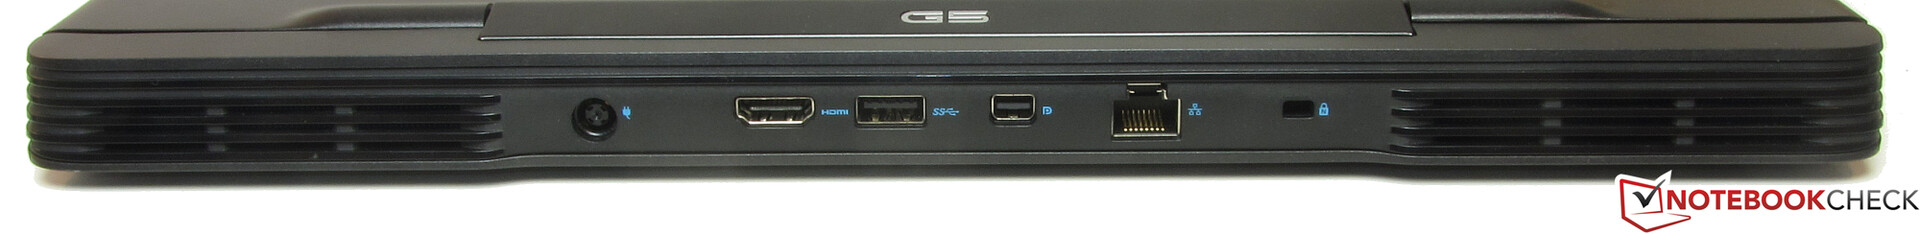
O portátil Dell faz o que deve fazer: Ele executa todos os jogos que são encontrados em nosso banco de dados sem problemas. A combinação do processador Core i7-8750H e a unidade gráfica GeForce GTX 2060 garantirão isto durante os próximos anos. Caso a GPU não seja mais capaz de atender aos requisitos, está disponível a possibilidade de usar uma GPU externa através da porta Thunderbolt 3.
A Dell oferece um portátil de jogos decente com o G5 15 5590. No entanto, o preço relativamente favorável requer alguns compromissos.
Um SSD NVMe garante um sistema operacional veloz. No entanto, o SSD integrado não está entre os modelos SSD mais rápidos. Um dos compromissos é evidente aqui, que a Dell teve que aceitar devido a razões de custo. O SSD é acompanhado por um disco rígido de 2,5 polegadas de 1 TB. Ambas as unidades podem ser trocadas. Para fazer isso, a tampa inferior precisa ser removida - não é um procedimento complicado.
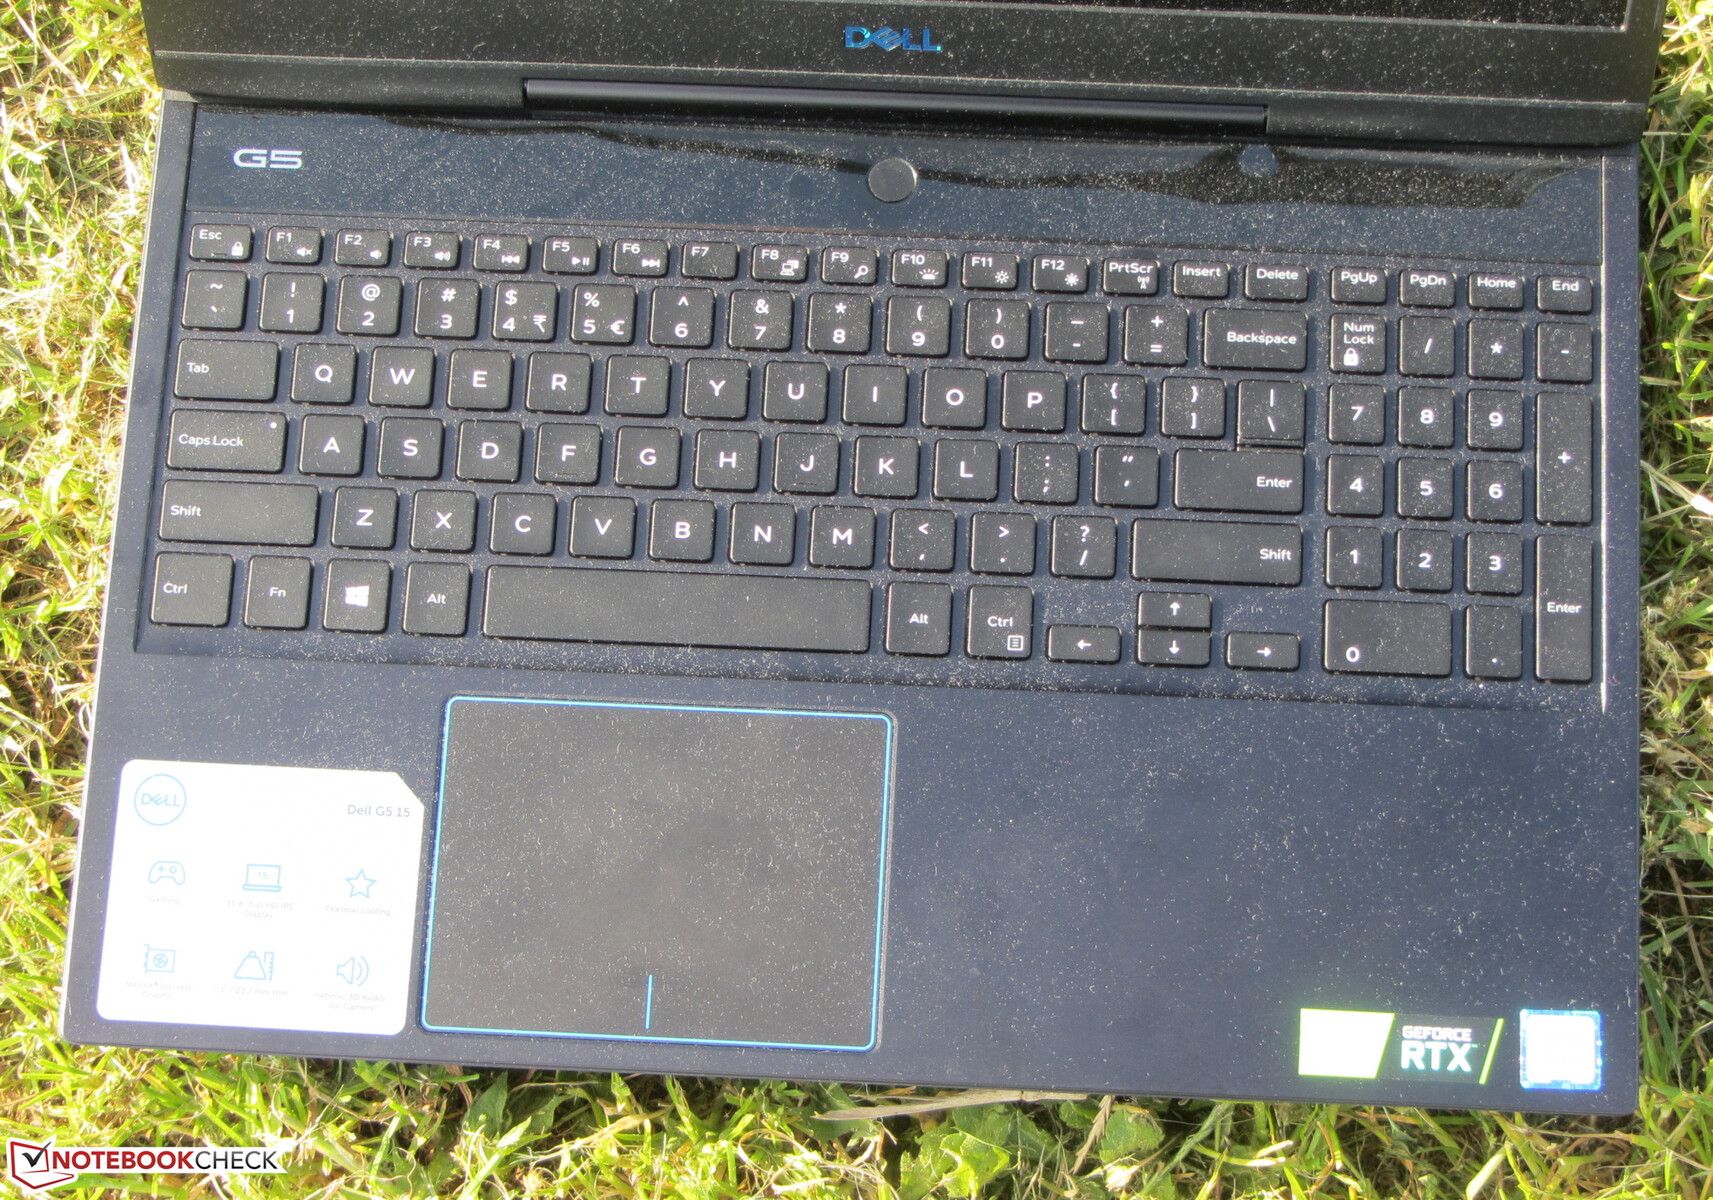
O teclado integrado provou ser adequado para o uso diário. Positivo: A retro iluminação do teclado está disponível. A excelente duração da bateria não deve ser deixada de lado; muitos portáteis de escritório não fornecem isso.
A tela IPS mate no G5 apenas ganha pontos com seu bom contraste e ângulos de visão estáveis. O brilho é muito baixo e os tempos de resposta são muito lentos. A reprodução de cores também não é motivo de entusiasmo. O fato de a Dell apenas honra o G5 com uma garantia de 12 meses é algo a ser criticado. O padrão é oferecer uma garantia de dois anos.
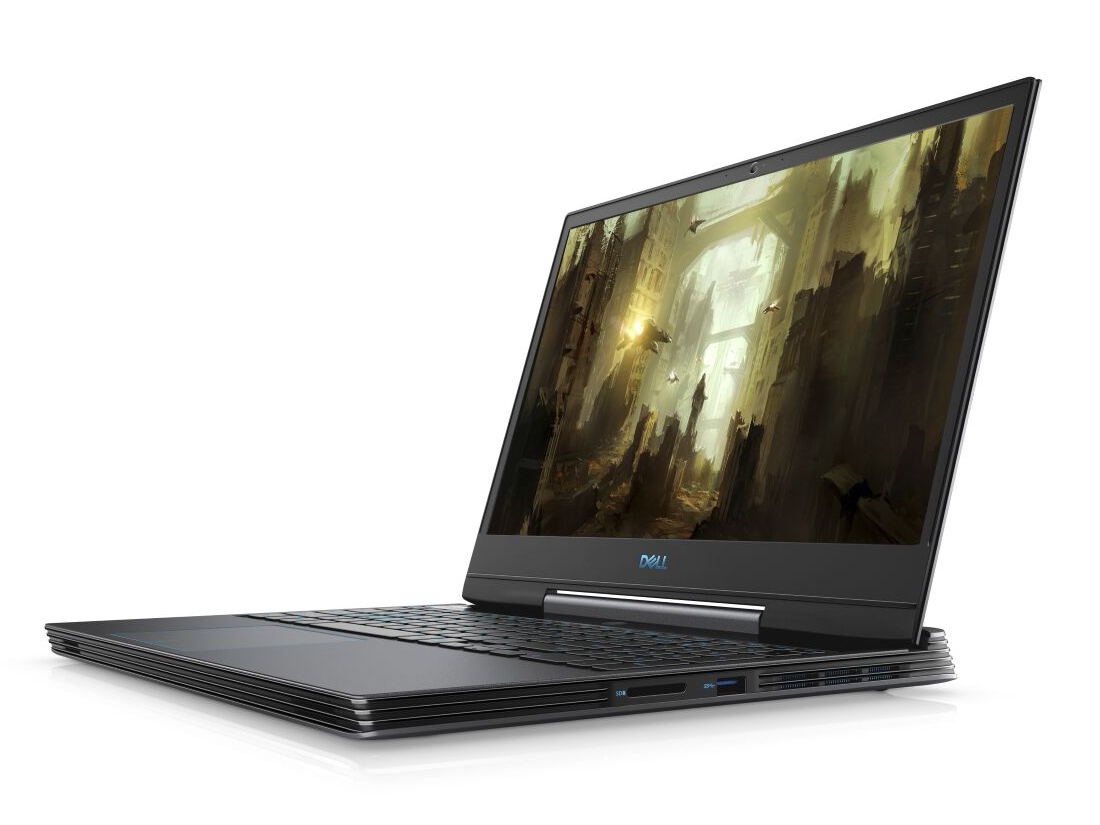
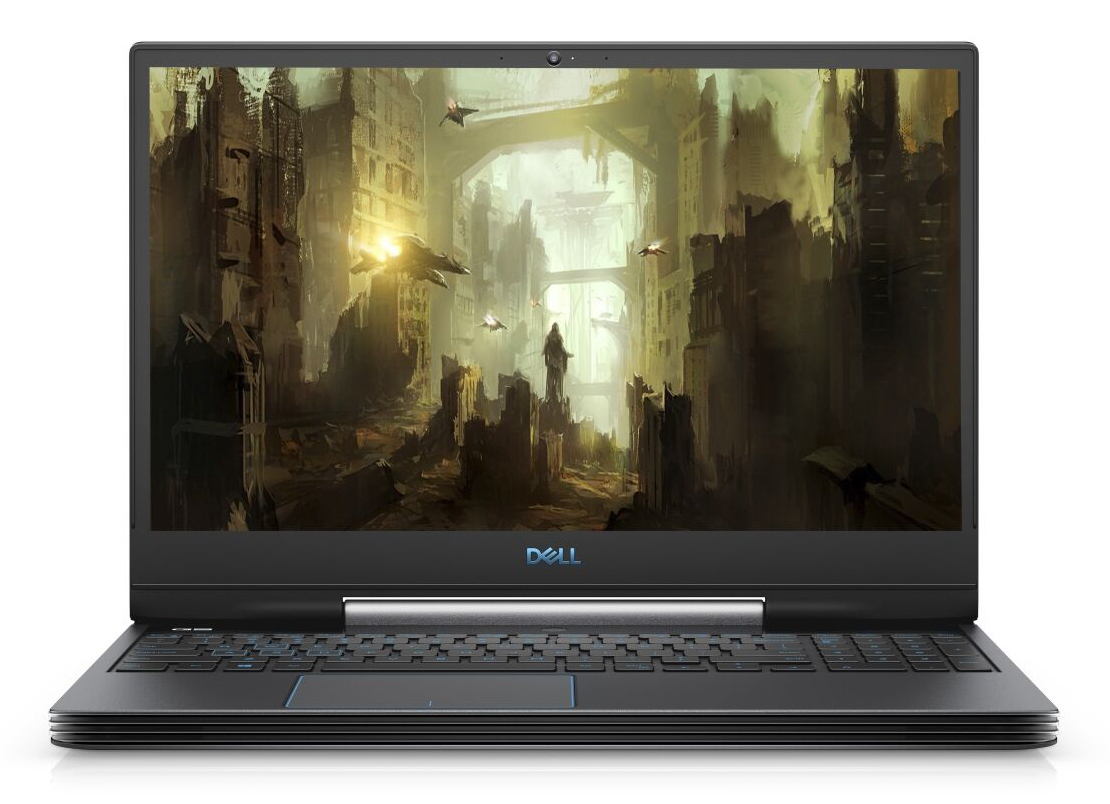
Dell G5 15 5590
- 09/20/2019 v7 (old)
Sascha Mölck