Breve Análise do Portátil Gigabyte Aero 15 Classic-XA (i7-9750H, RTX 2070 Max-Q)
| SD Card Reader | |
| average JPG Copy Test (av. of 3 runs) | |
| Gigabyte Aero 15-X9 (Toshiba Exceria Pro SDXC 64 GB UHS-II) | |
| Gigabyte Aero 15 Classic-XA (Toshiba Exceria Pro SDXC 64 GB UHS-II) | |
| Média da turma Gaming (20.9 - 210, n=54, últimos 2 anos) | |
| Schenker XMG Neo 15 Turing (Toshiba Exceria Pro SDXC 64 GB UHS-II) | |
| maximum AS SSD Seq Read Test (1GB) | |
| Gigabyte Aero 15-X9 (Toshiba Exceria Pro SDXC 64 GB UHS-II) | |
| Gigabyte Aero 15 Classic-XA (Toshiba Exceria Pro SDXC 64 GB UHS-II) | |
| Média da turma Gaming (25.5 - 261, n=51, últimos 2 anos) | |
| Schenker XMG Neo 15 Turing (Toshiba Exceria Pro SDXC 64 GB UHS-II) | |
| |||||||||||||||||||||||||
iluminação: 89 %
iluminação com acumulador: 266 cd/m²
Contraste: 858:1 (Preto: 0.31 cd/m²)
ΔE ColorChecker Calman: 2.78 | ∀{0.5-29.43 Ø4.71}
calibrated: 0.91
ΔE Greyscale Calman: 3.58 | ∀{0.09-98 Ø4.96}
96% sRGB (Argyll 1.6.3 3D)
62% AdobeRGB 1998 (Argyll 1.6.3 3D)
66.5% AdobeRGB 1998 (Argyll 3D)
95.5% sRGB (Argyll 3D)
65.3% Display P3 (Argyll 3D)
Gamma: 2.46
CCT: 7186 K
| Gigabyte Aero 15 Classic-XA Sharp LQ156M1JW03 (SHP14C5), IGZO, 1920x1080, | Gigabyte Aero 15-X9 LGD05C0, IPS, 1920x1080, | Razer Blade 15 RTX 2070 Max-Q LG Philips LGD05C0, IPS, 1920x1080, | Asus Zephyrus S GX531GX AU Optronics B156HAN08.2, IPS, 1920x1080, | Schenker XMG Neo 15 Turing BOEhydis NV156FHM-N4G (BOE07AF), IPS, 1920x1080, | Acer Predator Triton 500 AU Optronics B156HAN08.2 (AUO82ED), IPS, 1920x1080, | Lenovo Legion Y740-15ICHg LP156WFG-SPB2, IPS, 1920x1080, | |
|---|---|---|---|---|---|---|---|
| Display | -3% | -0% | -1% | -3% | -2% | -3% | |
| Display P3 Coverage (%) | 65.3 | 63.5 -3% | 65.3 0% | 65.6 0% | 63.5 -3% | 64.2 -2% | 63.5 -3% |
| sRGB Coverage (%) | 95.5 | 93.1 -3% | 94.9 -1% | 92.2 -3% | 92.3 -3% | 92.6 -3% | 92.4 -3% |
| AdobeRGB 1998 Coverage (%) | 66.5 | 64.5 -3% | 66.3 0% | 66.9 1% | 65 -2% | 65.7 -1% | 64.7 -3% |
| Response Times | -15% | -8% | 34% | 27% | 24% | -21% | |
| Response Time Grey 50% / Grey 80% * (ms) | 15.2 ? | 16.4 ? -8% | 16.8 ? -11% | 7 ? 54% | 8.8 ? 42% | 8 ? 47% | 18.8 ? -24% |
| Response Time Black / White * (ms) | 11.2 ? | 13.6 ? -21% | 11.6 ? -4% | 9.6 ? 14% | 10 ? 11% | 11.2 ? -0% | 13.2 ? -18% |
| PWM Frequency (Hz) | 23580 ? | 1000 ? | |||||
| Screen | 16% | -4% | -11% | -18% | -18% | -17% | |
| Brightness middle (cd/m²) | 266 | 250 -6% | 314.7 18% | 323.6 22% | 268 1% | 304 14% | 320.4 20% |
| Brightness (cd/m²) | 248 | 235 -5% | 312 26% | 315 27% | 270 9% | 299 21% | 298 20% |
| Brightness Distribution (%) | 89 | 85 -4% | 90 1% | 91 2% | 84 -6% | 89 0% | 85 -4% |
| Black Level * (cd/m²) | 0.31 | 0.29 6% | 0.38 -23% | 0.29 6% | 0.24 23% | 0.27 13% | 0.42 -35% |
| Contrast (:1) | 858 | 862 0% | 828 -3% | 1116 30% | 1117 30% | 1126 31% | 763 -11% |
| Colorchecker dE 2000 * | 2.78 | 1.46 47% | 2.56 8% | 3.31 -19% | 4.51 -62% | 4.66 -68% | 3.21 -15% |
| Colorchecker dE 2000 max. * | 5.96 | 2.47 59% | 4.89 18% | 5.74 4% | 9.58 -61% | 9.65 -62% | 5.54 7% |
| Colorchecker dE 2000 calibrated * | 0.91 | 1.71 -88% | 2.73 -200% | 1.57 -73% | 1.72 -89% | 2.36 -159% | |
| Greyscale dE 2000 * | 3.58 | 1.27 65% | 3.4 5% | 2.9 19% | 5.36 -50% | 5.53 -54% | 3.6 -1% |
| Gamma | 2.46 89% | 2.4 92% | 2.3 96% | 2.29 96% | 2.51 88% | 2.5 88% | 2.27 97% |
| CCT | 7186 90% | 6749 96% | 6435 101% | 6765 96% | 7826 83% | 8028 81% | 6503 100% |
| Color Space (Percent of AdobeRGB 1998) (%) | 62 | 60 -3% | 60.7 -2% | 59.7 -4% | 59 -5% | 60 -3% | 59 -5% |
| Color Space (Percent of sRGB) (%) | 96 | 93 -3% | 94.6 -1% | 91.8 -4% | 92 -4% | 93 -3% | 92 -4% |
| Média Total (Programa/Configurações) | -1% /
8% | -4% /
-4% | 7% /
-3% | 2% /
-10% | 1% /
-10% | -14% /
-15% |
* ... menor é melhor
Exibir tempos de resposta
| ↔ Tempo de resposta preto para branco | ||
|---|---|---|
| 11.2 ms ... ascensão ↗ e queda ↘ combinadas | ↗ 6.8 ms ascensão | 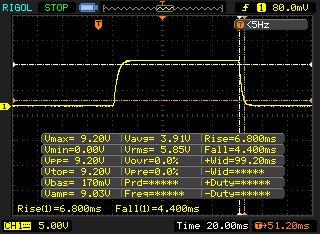 |
| ↘ 4.4 ms queda | ||
| A tela mostra boas taxas de resposta em nossos testes, mas pode ser muito lenta para jogadores competitivos. Em comparação, todos os dispositivos testados variam de 0.1 (mínimo) a 240 (máximo) ms. » 30 % de todos os dispositivos são melhores. Isso significa que o tempo de resposta medido é melhor que a média de todos os dispositivos testados (19.8 ms). | ||
| ↔ Tempo de resposta 50% cinza a 80% cinza | ||
| 15.2 ms ... ascensão ↗ e queda ↘ combinadas | ↗ 7.6 ms ascensão | 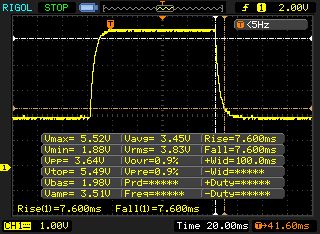 |
| ↘ 7.6 ms queda | ||
| A tela mostra boas taxas de resposta em nossos testes, mas pode ser muito lenta para jogadores competitivos. Em comparação, todos os dispositivos testados variam de 0.165 (mínimo) a 636 (máximo) ms. » 29 % de todos os dispositivos são melhores. Isso significa que o tempo de resposta medido é melhor que a média de todos os dispositivos testados (31 ms). | ||
Cintilação da tela / PWM (modulação por largura de pulso)
| Tela tremeluzindo/PWM detectado | 23580 Hz | ≤ 24 % configuração de brilho | 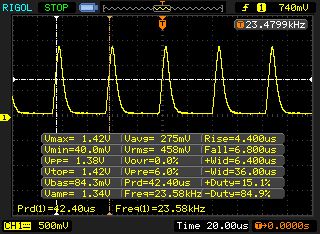 |
A luz de fundo da tela pisca em 23580 Hz (pior caso, por exemplo, utilizando PWM) Cintilação detectada em uma configuração de brilho de 24 % e abaixo. Não deve haver cintilação ou PWM acima desta configuração de brilho. A frequência de 23580 Hz é bastante alta, então a maioria dos usuários sensíveis ao PWM não deve notar nenhuma oscilação. [pwm_comparison] Em comparação: 52 % de todos os dispositivos testados não usam PWM para escurecer a tela. Se PWM foi detectado, uma média de 7757 (mínimo: 5 - máximo: 343500) Hz foi medida. | |||

| Cinebench R10 | |
| Rendering Single 32Bit | |
| Média da turma Gaming (7457 - 12575, n=9, últimos 2 anos) | |
| Gigabyte Aero 15 Classic-XA | |
| Schenker XMG Neo 15 Turing | |
| Gigabyte Aero 15-X9 | |
| Rendering Multiple CPUs 32Bit | |
| Média da turma Gaming (42932 - 102066, n=9, últimos 2 anos) | |
| Gigabyte Aero 15-X9 | |
| Gigabyte Aero 15 Classic-XA | |
| Schenker XMG Neo 15 Turing | |
| Cinebench R20 | |
| CPU (Single Core) | |
| Média da turma Gaming (442 - 913, n=106, últimos 2 anos) | |
| Gigabyte Aero 15 Classic-XA | |
| Schenker XMG Neo 15 Turing | |
| CPU (Multi Core) | |
| Média da turma Gaming (4029 - 16433, n=106, últimos 2 anos) | |
| Gigabyte Aero 15 Classic-XA | |
| Schenker XMG Neo 15 Turing | |
| Geekbench 3 | |
| 32 Bit Multi-Core Score | |
| Gigabyte Aero 15 Classic-XA | |
| Schenker XMG Neo 15 Turing | |
| Gigabyte Aero 15-X9 | |
| 32 Bit Single-Core Score | |
| Gigabyte Aero 15 Classic-XA | |
| Schenker XMG Neo 15 Turing | |
| Gigabyte Aero 15-X9 | |
| Geekbench 4.4 | |
| 64 Bit Multi-Core Score | |
| Média da turma Gaming (89200 - 101054, n=3, últimos 2 anos) | |
| Gigabyte Aero 15 Classic-XA | |
| Schenker XMG Neo 15 Turing | |
| Gigabyte Aero 15-X9 | |
| 64 Bit Single-Core Score | |
| Média da turma Gaming (9335 - 9775, n=3, últimos 2 anos) | |
| Gigabyte Aero 15 Classic-XA | |
| Schenker XMG Neo 15 Turing | |
| Gigabyte Aero 15-X9 | |
| Mozilla Kraken 1.1 - Total | |
| Gigabyte Aero 15-X9 (Edge 44) | |
| Razer Blade 15 RTX 2070 Max-Q (Edge 44.17763.1.0) | |
| Schenker XMG Neo 15 Turing (Edge 44) | |
| Lenovo Legion Y740-15ICHg (Microsoft Edge 44.17763.1.0) | |
| Asus Zephyrus S GX531GX (Edge 42.17134.1.0) | |
| Gigabyte Aero 15 Classic-XA (Edge 44) | |
| Média da turma Gaming (391 - 590, n=100, últimos 2 anos) | |
| Octane V2 - Total Score | |
| Média da turma Gaming (93292 - 139447, n=27, últimos 2 anos) | |
| Gigabyte Aero 15 Classic-XA (Edge 44) | |
| Schenker XMG Neo 15 Turing (Edge 44) | |
| Lenovo Legion Y740-15ICHg (Microsoft Edge 44.17763.1.0) | |
| Gigabyte Aero 15-X9 (Edge 44) | |
| Asus Zephyrus S GX531GX (Edge 42.17134.1.0) | |
| Razer Blade 15 RTX 2070 Max-Q (Edge 44.17763.1.0) | |
| WebXPRT 3 - Overall | |
| Média da turma Gaming (220 - 532, n=98, últimos 2 anos) | |
| Gigabyte Aero 15 Classic-XA (Edge 44) | |
| JetStream 1.1 - 1.1 Total | |
| Média da turma Gaming (549 - 647, n=3, últimos 2 anos) | |
| Razer Blade 15 RTX 2070 Max-Q (Edge 44.17763.1.0) | |
| Schenker XMG Neo 15 Turing (Edge 44) | |
| Asus Zephyrus S GX531GX (Edge 42.17134.1.0) | |
| Lenovo Legion Y740-15ICHg (Microsoft Edge 44.17763.1.0) | |
| Gigabyte Aero 15 Classic-XA (Edge 44) | |
| Gigabyte Aero 15-X9 (Edge 44) | |
* ... menor é melhor
| PCMark 7 Score | 6854 pontos | |
| PCMark 8 Home Score Accelerated v2 | 4851 pontos | |
| PCMark 8 Creative Score Accelerated v2 | 5574 pontos | |
| PCMark 8 Work Score Accelerated v2 | 6035 pontos | |
| PCMark 10 Score | 5697 pontos | |
Ajuda | ||

| Gigabyte Aero 15 Classic-XA Intel SSD 760p SSDPEKKW512G8 | Gigabyte Aero 15-X9 Intel SSD 760p SSDPEKKW010T8 | Razer Blade 15 RTX 2070 Max-Q Samsung SSD PM981 MZVLB512HAJQ | Asus Zephyrus S GX531GX Intel SSD 660p SSDPEKNW512G8 | Schenker XMG Neo 15 Turing Samsung SSD 970 EVO Plus 1TB | Acer Predator Triton 500 2x WDC PC SN720 SDAPNTW-256G-1014 (RAID 0) | Lenovo Legion Y740-15ICHg Samsung SSD PM981 MZVLB256HAHQ | |
|---|---|---|---|---|---|---|---|
| CrystalDiskMark 5.2 / 6 | -15% | -13% | -33% | -6% | 7% | -20% | |
| Write 4K (MB/s) | 115.5 | 97.1 -16% | 93.9 -19% | 93.9 -19% | 92.5 -20% | 93.6 -19% | 81 -30% |
| Read 4K (MB/s) | 58 | 53.7 -7% | 40.56 -30% | 46.29 -20% | 40.45 -30% | 38.82 -33% | 36.03 -38% |
| Write Seq (MB/s) | 1555 | 1526 -2% | 1468 -6% | 974 -37% | 1197 -23% | 2455 58% | 1687 8% |
| Read Seq (MB/s) | 2590 | 2020 -22% | 1540 -41% | 1425 -45% | 1018 -61% | 2107 -19% | 1835 -29% |
| Write 4K Q32T1 (MB/s) | 369.3 | 285.6 -23% | 293.5 -21% | 259.4 -30% | 288.6 -22% | 298.7 -19% | 205.3 -44% |
| Read 4K Q32T1 (MB/s) | 441.7 | 321.8 -27% | 346 -22% | 296.5 -33% | 332 -25% | 338.7 -23% | 229 -48% |
| Write Seq Q32T1 (MB/s) | 1547 | 1533 -1% | 1941 25% | 977 -37% | 3317 114% | 2902 88% | 1683 9% |
| Read Seq Q32T1 (MB/s) | 2969 | 2351 -21% | 3266 10% | 1666 -44% | 3515 18% | 3536 19% | 3363 13% |
| 3DMark 06 Standard Score | 35193 pontos | |
| 3DMark 11 Performance | 18171 pontos | |
| 3DMark Ice Storm Standard Score | 113186 pontos | |
| 3DMark Cloud Gate Standard Score | 35891 pontos | |
| 3DMark Fire Strike Score | 15494 pontos | |
| 3DMark Time Spy Score | 6639 pontos | |
Ajuda | ||
| The Witcher 3 - 1920x1080 Ultra Graphics & Postprocessing (HBAO+) | |
| Média da turma Gaming (104.7 - 240, n=7, últimos 2 anos) | |
| Asus Zephyrus S GX531GX | |
| Acer Predator Triton 500 | |
| Razer Blade 15 RTX 2070 Max-Q | |
| Gigabyte Aero 15 Classic-XA | |
| Schenker XMG Neo 15 Turing | |
| Gigabyte Aero 15-X9 | |
| Lenovo Legion Y740-15ICHg | |
| BioShock Infinite - 1920x1080 Ultra Preset, DX11 (DDOF) | |
| Lenovo Legion Y740-15ICHg | |
| Asus Zephyrus S GX531GX | |
| Razer Blade 15 RTX 2070 Max-Q | |
| Gigabyte Aero 15 Classic-XA | |
| Schenker XMG Neo 15 Turing | |
| Gigabyte Aero 15-X9 | |
| Far Cry 5 - 1920x1080 Ultra Preset AA:T | |
| Média da turma Gaming (70 - 151, n=6, últimos 2 anos) | |
| Gigabyte Aero 15 Classic-XA | |
| Gigabyte Aero 15-X9 | |
| baixo | média | alto | ultra | |
|---|---|---|---|---|
| BioShock Infinite (2013) | 321.3 | 279.3 | 238 | 150.3 |
| The Witcher 3 (2015) | 273.1 | 189.2 | 113.2 | 64.1 |
| Final Fantasy XV Benchmark (2018) | 117.6 | 87.9 | 62.9 | |
| World of Tanks enCore (2018) | 490.3 | 218.9 | 129.1 | |
| Far Cry 5 (2018) | 127 | 100 | 95 | 89 |
| Forza Horizon 4 (2018) | 150 | 121 | 118 | 98 |
| Far Cry New Dawn (2019) | 113 | 93 | 87 | 79 |
| Metro Exodus (2019) | 128.8 | 79.8 | 56.3 | 47.7 |
| The Division 2 (2019) | 147 | 108 | 87 | 70 |
| Anno 1800 (2019) | 92 | 82.1 | 68.1 | 34 |
Barulho
| Ocioso |
| 31 / 34 / 39 dB |
| Carga |
| 46 / 55 dB |
 | ||
30 dB silencioso 40 dB(A) audível 50 dB(A) ruidosamente alto |
||
min: | ||
| Gigabyte Aero 15 Classic-XA i7-9750H, GeForce RTX 2070 Max-Q | Gigabyte Aero 15-X9 i7-8750H, GeForce RTX 2070 Max-Q | Razer Blade 15 RTX 2070 Max-Q i7-8750H, GeForce RTX 2070 Max-Q | Asus Zephyrus S GX531GX i7-8750H, GeForce RTX 2080 Max-Q | Schenker XMG Neo 15 Turing i7-8750H, GeForce RTX 2070 Max-Q | Acer Predator Triton 500 i7-8750H, GeForce RTX 2080 Max-Q | Lenovo Legion Y740-15ICHg i7-8750H, GeForce RTX 2070 Max-Q | |
|---|---|---|---|---|---|---|---|
| Noise | 6% | 16% | 3% | 2% | 8% | 13% | |
| desligado / ambiente * (dB) | 30 | 30 -0% | 28.8 4% | 28.7 4% | 30 -0% | 29 3% | 28 7% |
| Idle Minimum * (dB) | 31 | 32 -3% | 28.8 7% | 29.8 4% | 30 3% | 30 3% | 32.6 -5% |
| Idle Average * (dB) | 34 | 34 -0% | 28.8 15% | 32.4 5% | 32 6% | 32 6% | 32.7 4% |
| Idle Maximum * (dB) | 39 | 36 8% | 29.4 25% | 38 3% | 35 10% | 34 13% | 32.7 16% |
| Load Average * (dB) | 46 | 42 9% | 35.7 22% | 38.2 17% | 47 -2% | 44 4% | 33.3 28% |
| Witcher 3 ultra * (dB) | 53 | 44 17% | 42.5 20% | 56.6 -7% | 53 -0% | 46 13% | 41.6 22% |
| Load Maximum * (dB) | 55 | 48 13% | 45 18% | 56.6 -3% | 55 -0% | 47 15% | 45.2 18% |
* ... menor é melhor
(-) A temperatura máxima no lado superior é 58 °C / 136 F, em comparação com a média de 40.4 °C / 105 F , variando de 21.2 a 68.8 °C para a classe Gaming.
(-) A parte inferior aquece até um máximo de 64 °C / 147 F, em comparação com a média de 43.2 °C / 110 F
(+) Em uso inativo, a temperatura média para o lado superior é 28.1 °C / 83 F, em comparação com a média do dispositivo de 33.9 °C / ### class_avg_f### F.
(-) Jogando The Witcher 3, a temperatura média para o lado superior é 45.4 °C / 114 F, em comparação com a média do dispositivo de 33.9 °C / ## #class_avg_f### F.
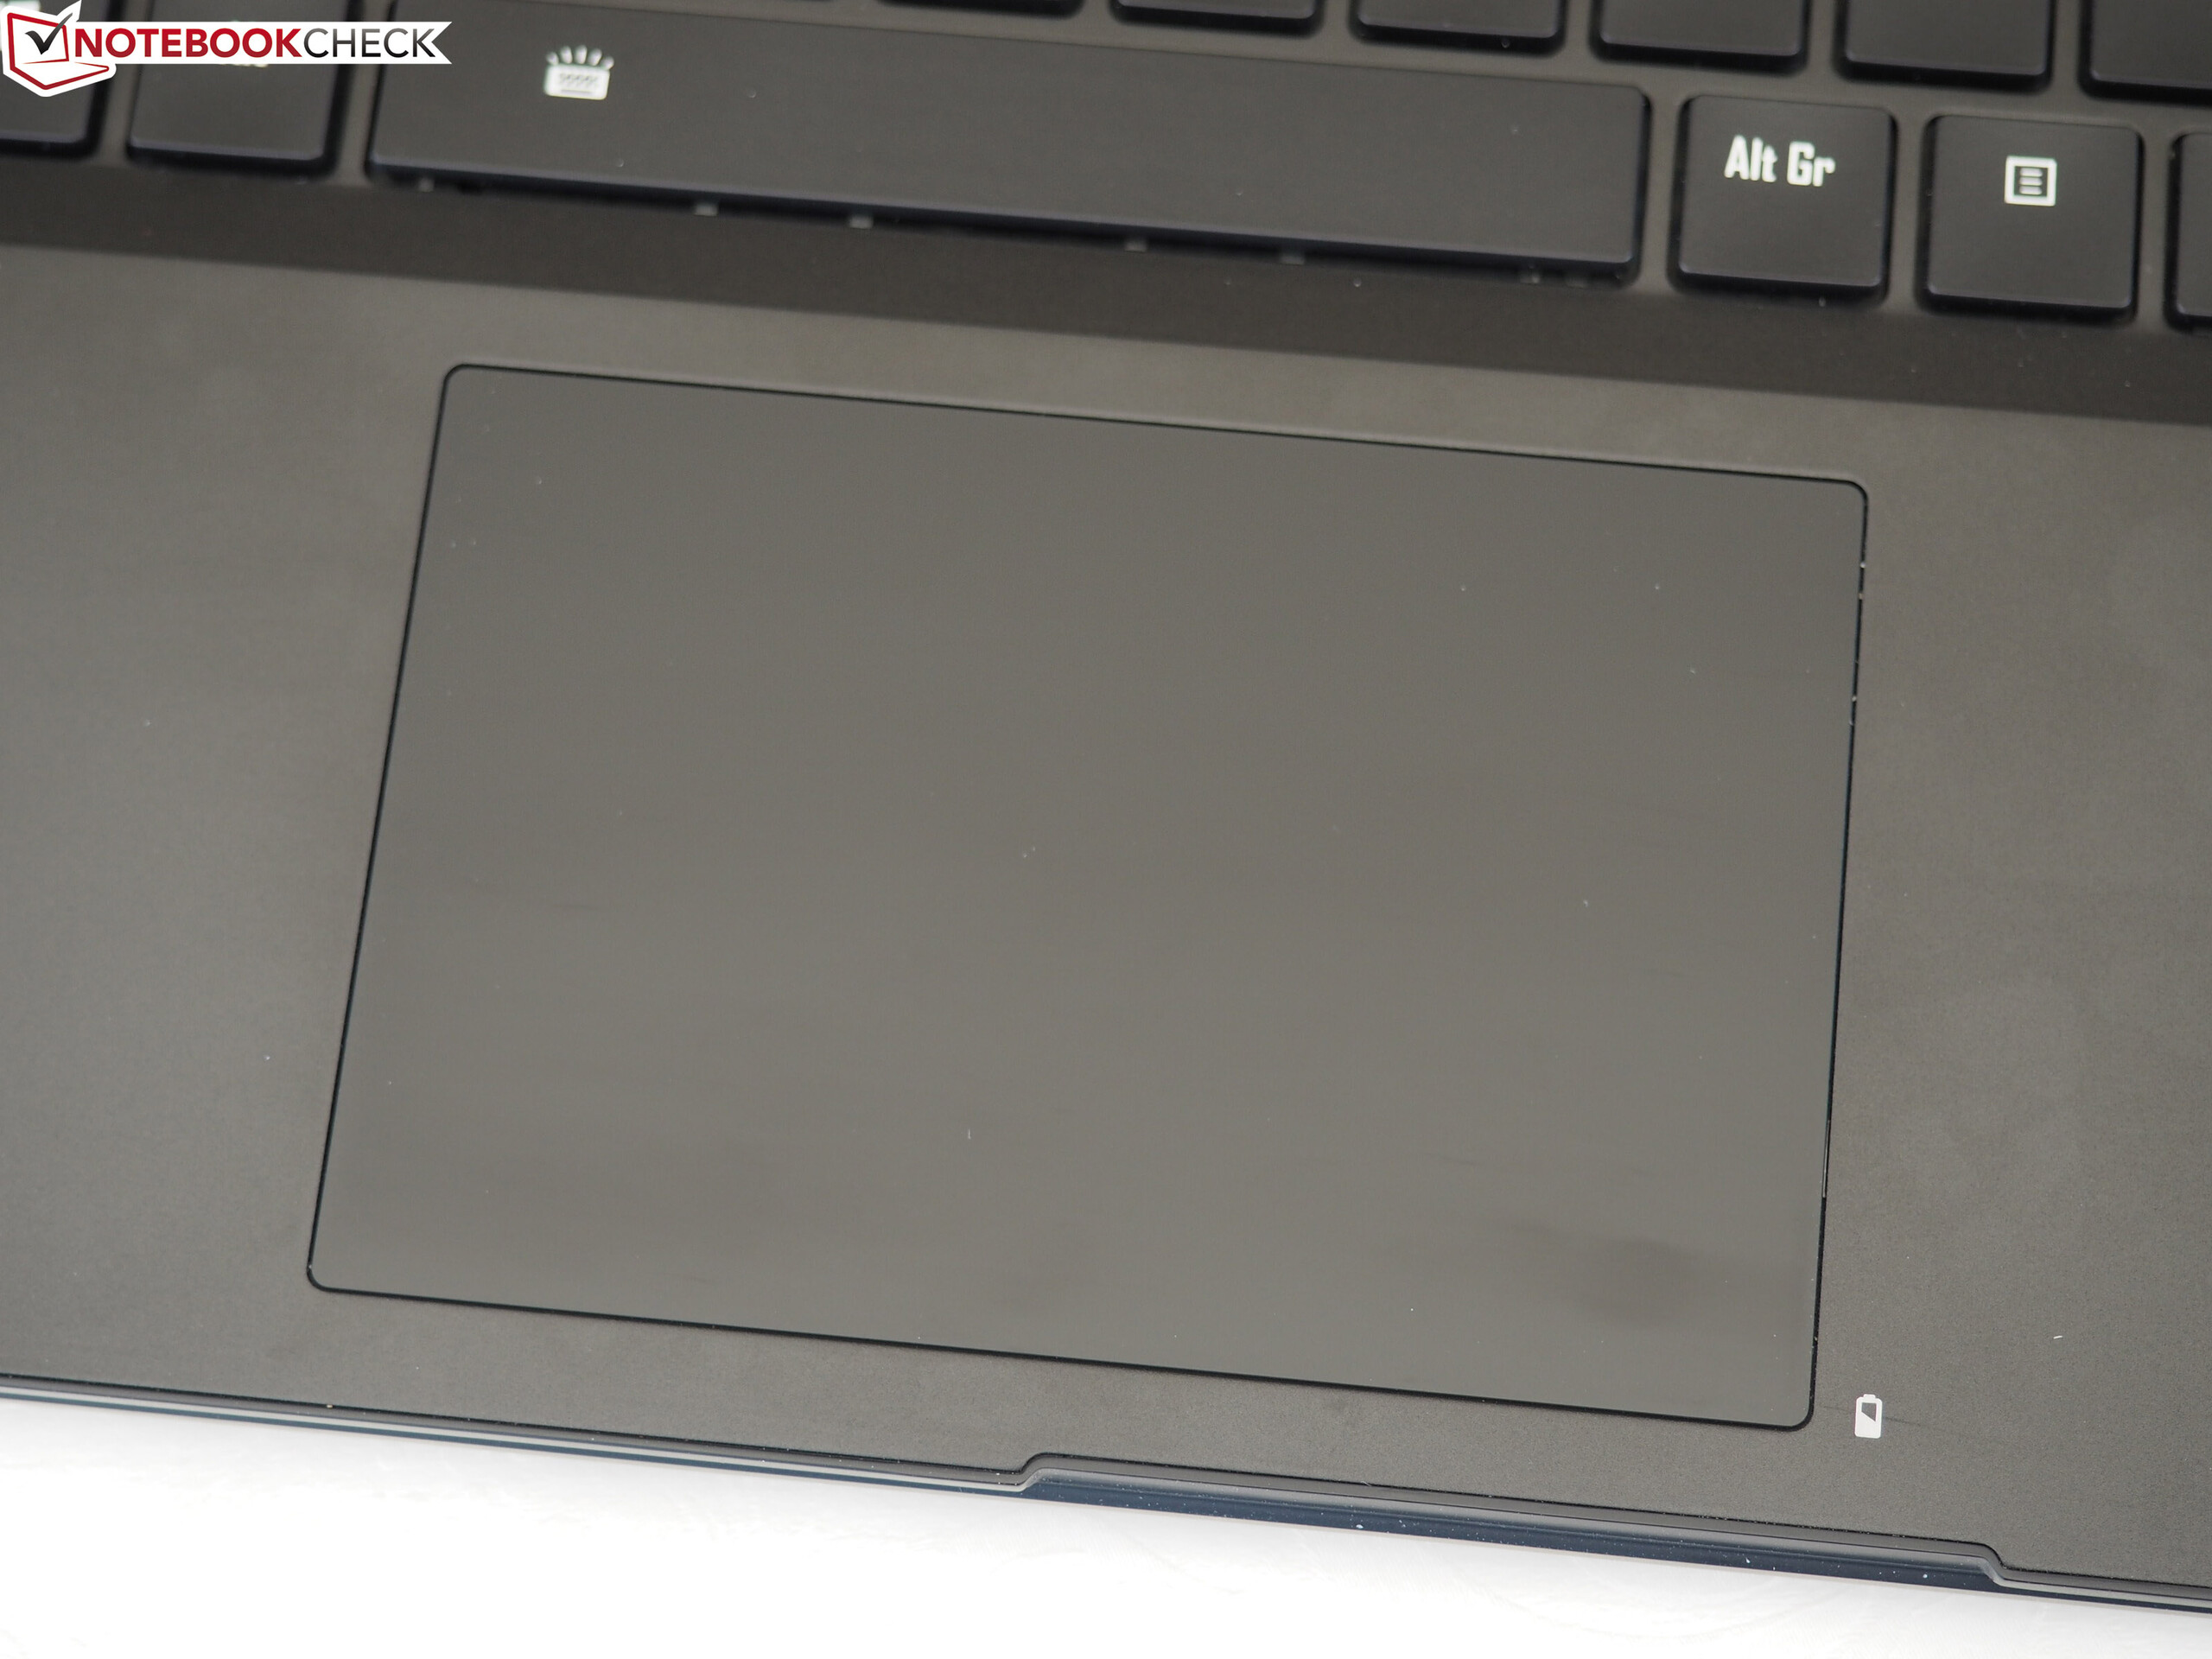
(-) Os apoios para as mãos e o touchpad podem ficar muito quentes ao toque, com um máximo de 40 °C / 104 F.
(-) A temperatura média da área do apoio para as mãos de dispositivos semelhantes foi 28.8 °C / 83.8 F (-11.2 °C / -20.2 F).
| Gigabyte Aero 15 Classic-XA i7-9750H, GeForce RTX 2070 Max-Q | Gigabyte Aero 15-X9 i7-8750H, GeForce RTX 2070 Max-Q | Razer Blade 15 RTX 2070 Max-Q i7-8750H, GeForce RTX 2070 Max-Q | Asus Zephyrus S GX531GX i7-8750H, GeForce RTX 2080 Max-Q | Schenker XMG Neo 15 Turing i7-8750H, GeForce RTX 2070 Max-Q | Acer Predator Triton 500 i7-8750H, GeForce RTX 2080 Max-Q | Lenovo Legion Y740-15ICHg i7-8750H, GeForce RTX 2070 Max-Q | |
|---|---|---|---|---|---|---|---|
| Heat | 6% | 17% | 10% | -2% | 2% | 9% | |
| Maximum Upper Side * (°C) | 58 | 56 3% | 49 16% | 47 19% | 58 -0% | 49 16% | 37.6 35% |
| Maximum Bottom * (°C) | 64 | 66 -3% | 49 23% | 48.6 24% | 68 -6% | 58 9% | 45.2 29% |
| Idle Upper Side * (°C) | 30 | 27 10% | 25.4 15% | 28.8 4% | 30 -0% | 33 -10% | 32.2 -7% |
| Idle Bottom * (°C) | 31 | 27 13% | 27.2 12% | 33.2 -7% | 31 -0% | 33 -6% | 37.2 -20% |
* ... menor é melhor
Gigabyte Aero 15 Classic-XA análise de áudio
(+) | os alto-falantes podem tocar relativamente alto (###valor### dB)
Graves 100 - 315Hz
(-) | quase nenhum baixo - em média 17% menor que a mediana
(±) | a linearidade dos graves é média (10.2% delta para a frequência anterior)
Médios 400 - 2.000 Hz
(+) | médios equilibrados - apenas 4.7% longe da mediana
(+) | médios são lineares (6.2% delta para frequência anterior)
Altos 2 - 16 kHz
(+) | agudos equilibrados - apenas 2.3% longe da mediana
(+) | os máximos são lineares (5.5% delta da frequência anterior)
Geral 100 - 16.000 Hz
(±) | a linearidade do som geral é média (15.5% diferença em relação à mediana)
Comparado com a mesma classe
» 35% de todos os dispositivos testados nesta classe foram melhores, 7% semelhantes, 58% piores
» O melhor teve um delta de 6%, a média foi 18%, o pior foi 132%
Comparado com todos os dispositivos testados
» 23% de todos os dispositivos testados foram melhores, 4% semelhantes, 73% piores
» O melhor teve um delta de 4%, a média foi 23%, o pior foi 134%
Razer Blade 15 RTX 2070 Max-Q análise de áudio
(-) | alto-falantes não muito altos (###valor### dB)
Graves 100 - 315Hz
(±) | graves reduzidos - em média 7.7% menor que a mediana
(±) | a linearidade dos graves é média (11.1% delta para a frequência anterior)
Médios 400 - 2.000 Hz
(±) | médios mais altos - em média 7.8% maior que a mediana
(±) | a linearidade dos médios é média (9.5% delta para frequência anterior)
Altos 2 - 16 kHz
(+) | agudos equilibrados - apenas 3% longe da mediana
(±) | a linearidade dos máximos é média (7.2% delta para frequência anterior)
Geral 100 - 16.000 Hz
(±) | a linearidade do som geral é média (23.9% diferença em relação à mediana)
Comparado com a mesma classe
» 86% de todos os dispositivos testados nesta classe foram melhores, 5% semelhantes, 9% piores
» O melhor teve um delta de 6%, a média foi 18%, o pior foi 132%
Comparado com todos os dispositivos testados
» 72% de todos os dispositivos testados foram melhores, 6% semelhantes, 22% piores
» O melhor teve um delta de 4%, a média foi 23%, o pior foi 134%
| desligado | |
| Ocioso | |
| Carga |
|
Key:
min: | |
| Gigabyte Aero 15 Classic-XA i7-9750H, GeForce RTX 2070 Max-Q | Gigabyte Aero 15-X9 i7-8750H, GeForce RTX 2070 Max-Q | Razer Blade 15 RTX 2070 Max-Q i7-8750H, GeForce RTX 2070 Max-Q | Asus Zephyrus S GX531GX i7-8750H, GeForce RTX 2080 Max-Q | Schenker XMG Neo 15 Turing i7-8750H, GeForce RTX 2070 Max-Q | Acer Predator Triton 500 i7-8750H, GeForce RTX 2080 Max-Q | Lenovo Legion Y740-15ICHg i7-8750H, GeForce RTX 2070 Max-Q | |
|---|---|---|---|---|---|---|---|
| Power Consumption | 21% | 26% | 6% | 23% | 9% | 5% | |
| Idle Minimum * (Watt) | 21 | 16 24% | 10.4 50% | 16.1 23% | 13 38% | 16 24% | 22.9 -9% |
| Idle Average * (Watt) | 23 | 18 22% | 14.6 37% | 20.9 9% | 16 30% | 22 4% | 27.2 -18% |
| Idle Maximum * (Watt) | 32 | 23 28% | 16.3 49% | 27 16% | 21 34% | 32 -0% | 27.5 14% |
| Load Average * (Watt) | 97 | 88 9% | 88.5 9% | 93.4 4% | 84 13% | 89 8% | 83.4 14% |
| Witcher 3 ultra * (Watt) | 148 | 120 19% | 155.4 -5% | 168.2 -14% | 135 9% | 147 1% | 143.6 3% |
| Load Maximum * (Watt) | 213 | 167 22% | 182.4 14% | 215.3 -1% | 183 14% | 173 19% | 160.5 25% |
* ... menor é melhor
| Gigabyte Aero 15 Classic-XA i7-9750H, GeForce RTX 2070 Max-Q, 94.24 Wh | Gigabyte Aero 15-X9 i7-8750H, GeForce RTX 2070 Max-Q, 94.24 Wh | Gigabyte Aero 15X v8 i7-8750H, GeForce GTX 1070 Max-Q, 94.24 Wh | Razer Blade 15 RTX 2070 Max-Q i7-8750H, GeForce RTX 2070 Max-Q, 80 Wh | Asus Zephyrus S GX531GX i7-8750H, GeForce RTX 2080 Max-Q, 50 Wh | Schenker XMG Neo 15 Turing i7-8750H, GeForce RTX 2070 Max-Q, 62.3 Wh | Acer Predator Triton 500 i7-8750H, GeForce RTX 2080 Max-Q, 82 Wh | Lenovo Legion Y740-15ICHg i7-8750H, GeForce RTX 2070 Max-Q, 57 Wh | |
|---|---|---|---|---|---|---|---|---|
| Duração da bateria | -5% | 19% | -11% | -57% | -32% | -48% | -63% | |
| Reader / Idle (h) | 9.1 | 9.2 1% | 12.7 40% | 11.4 25% | 6.9 -24% | 5.6 -38% | 3.9 -57% | |
| H.264 (h) | 6.8 | 6.1 -10% | 8.4 24% | 4.9 -28% | ||||
| WiFi v1.3 (h) | 7 | 6.4 -9% | 8.6 23% | 6.5 -7% | 3 -57% | 5.1 -27% | 3.2 -54% | 2.8 -60% |
| Load (h) | 3 | 2.9 -3% | 2.6 -13% | 1.5 -50% | 1.6 -47% | 1.4 -53% | 0.8 -73% |
Pro
Contra
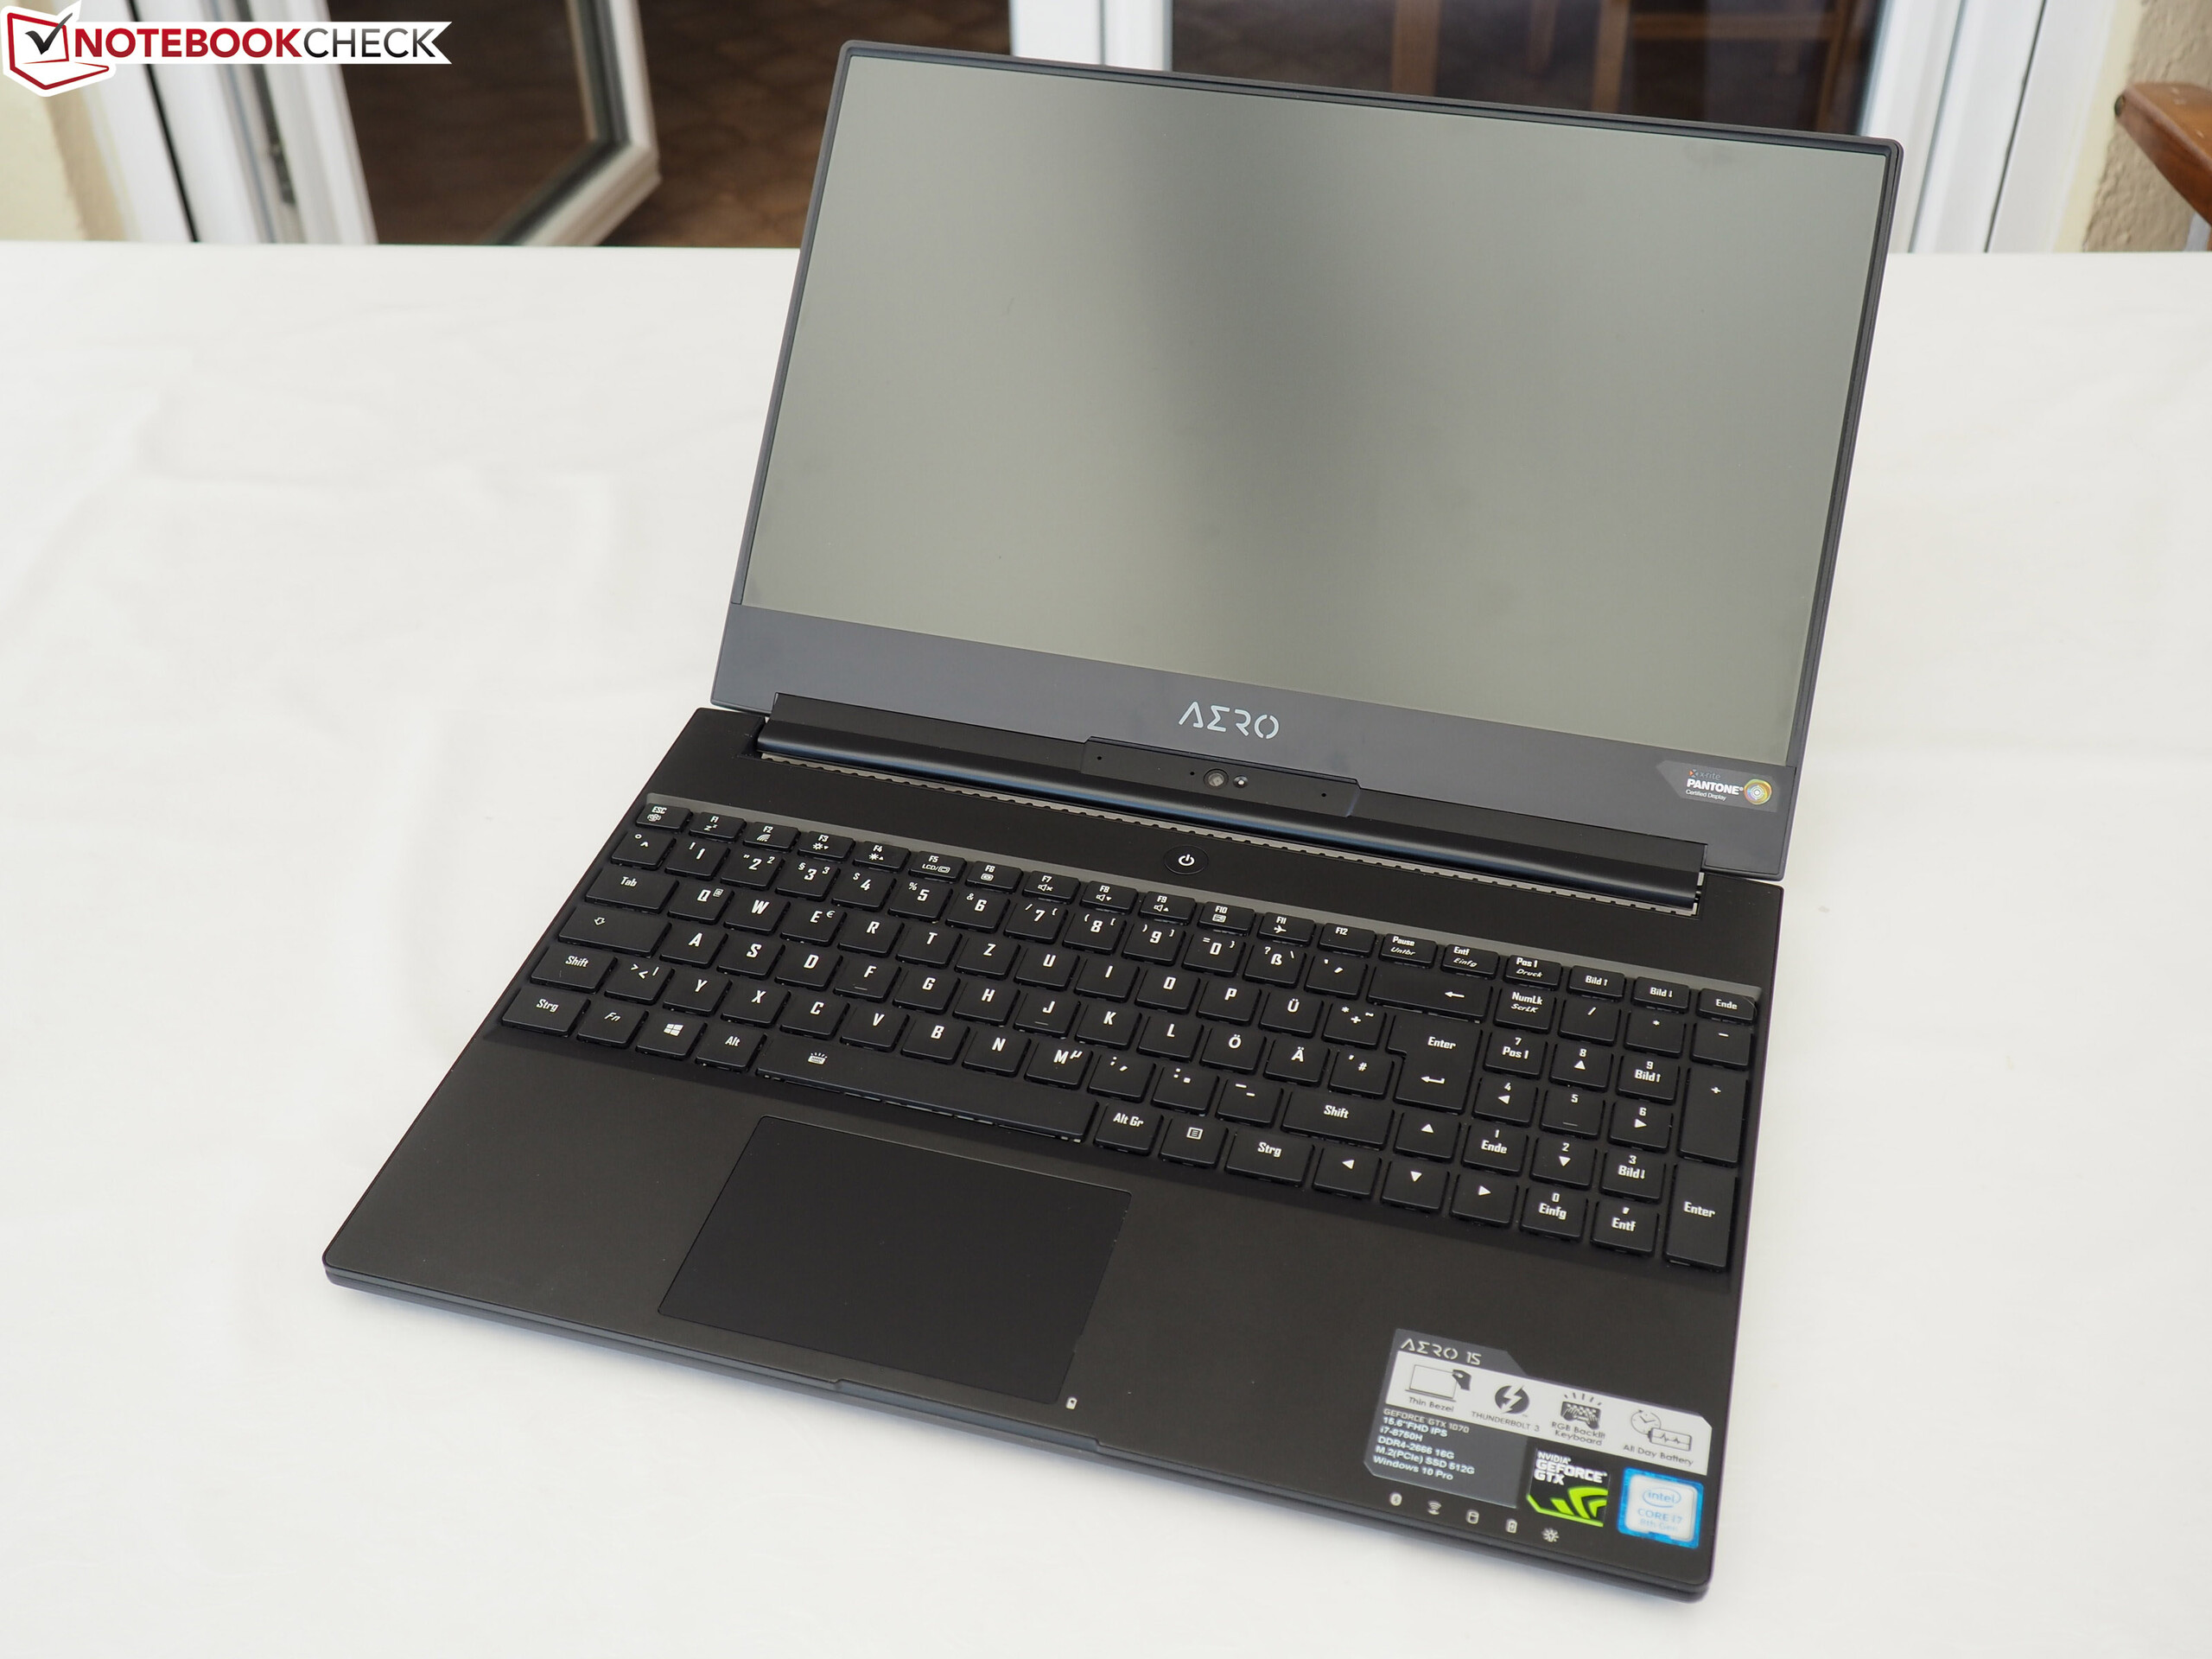
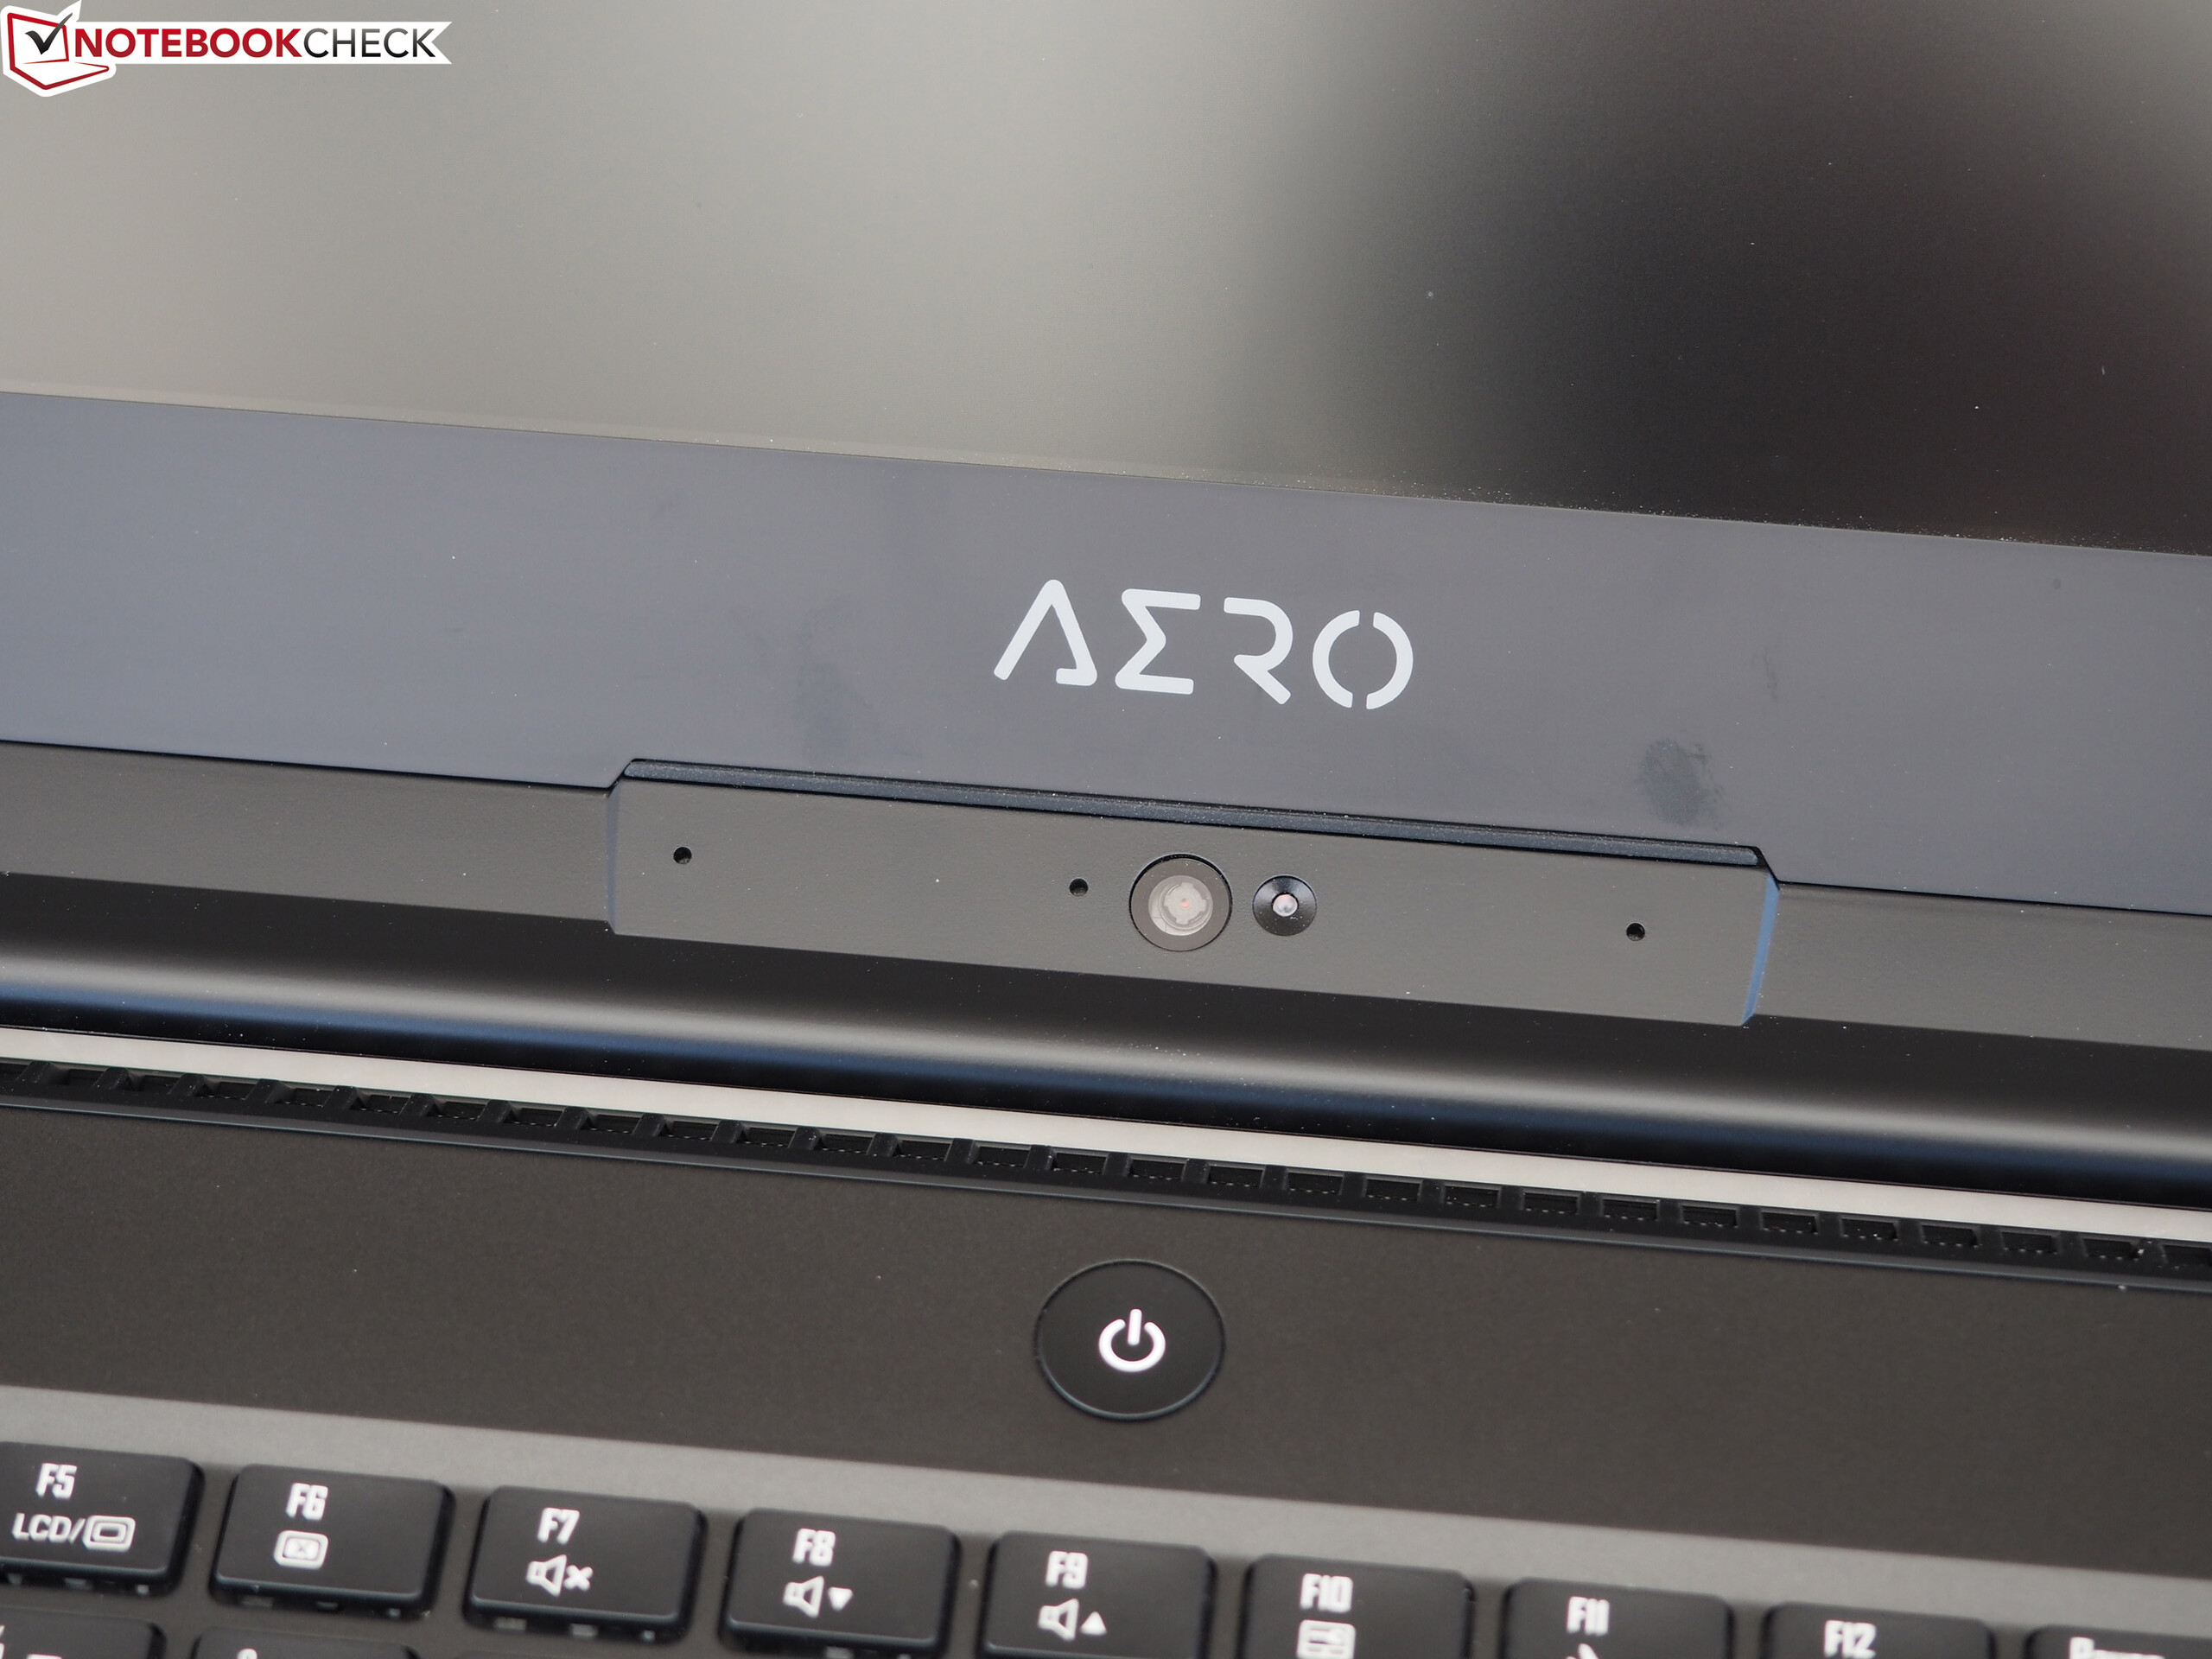
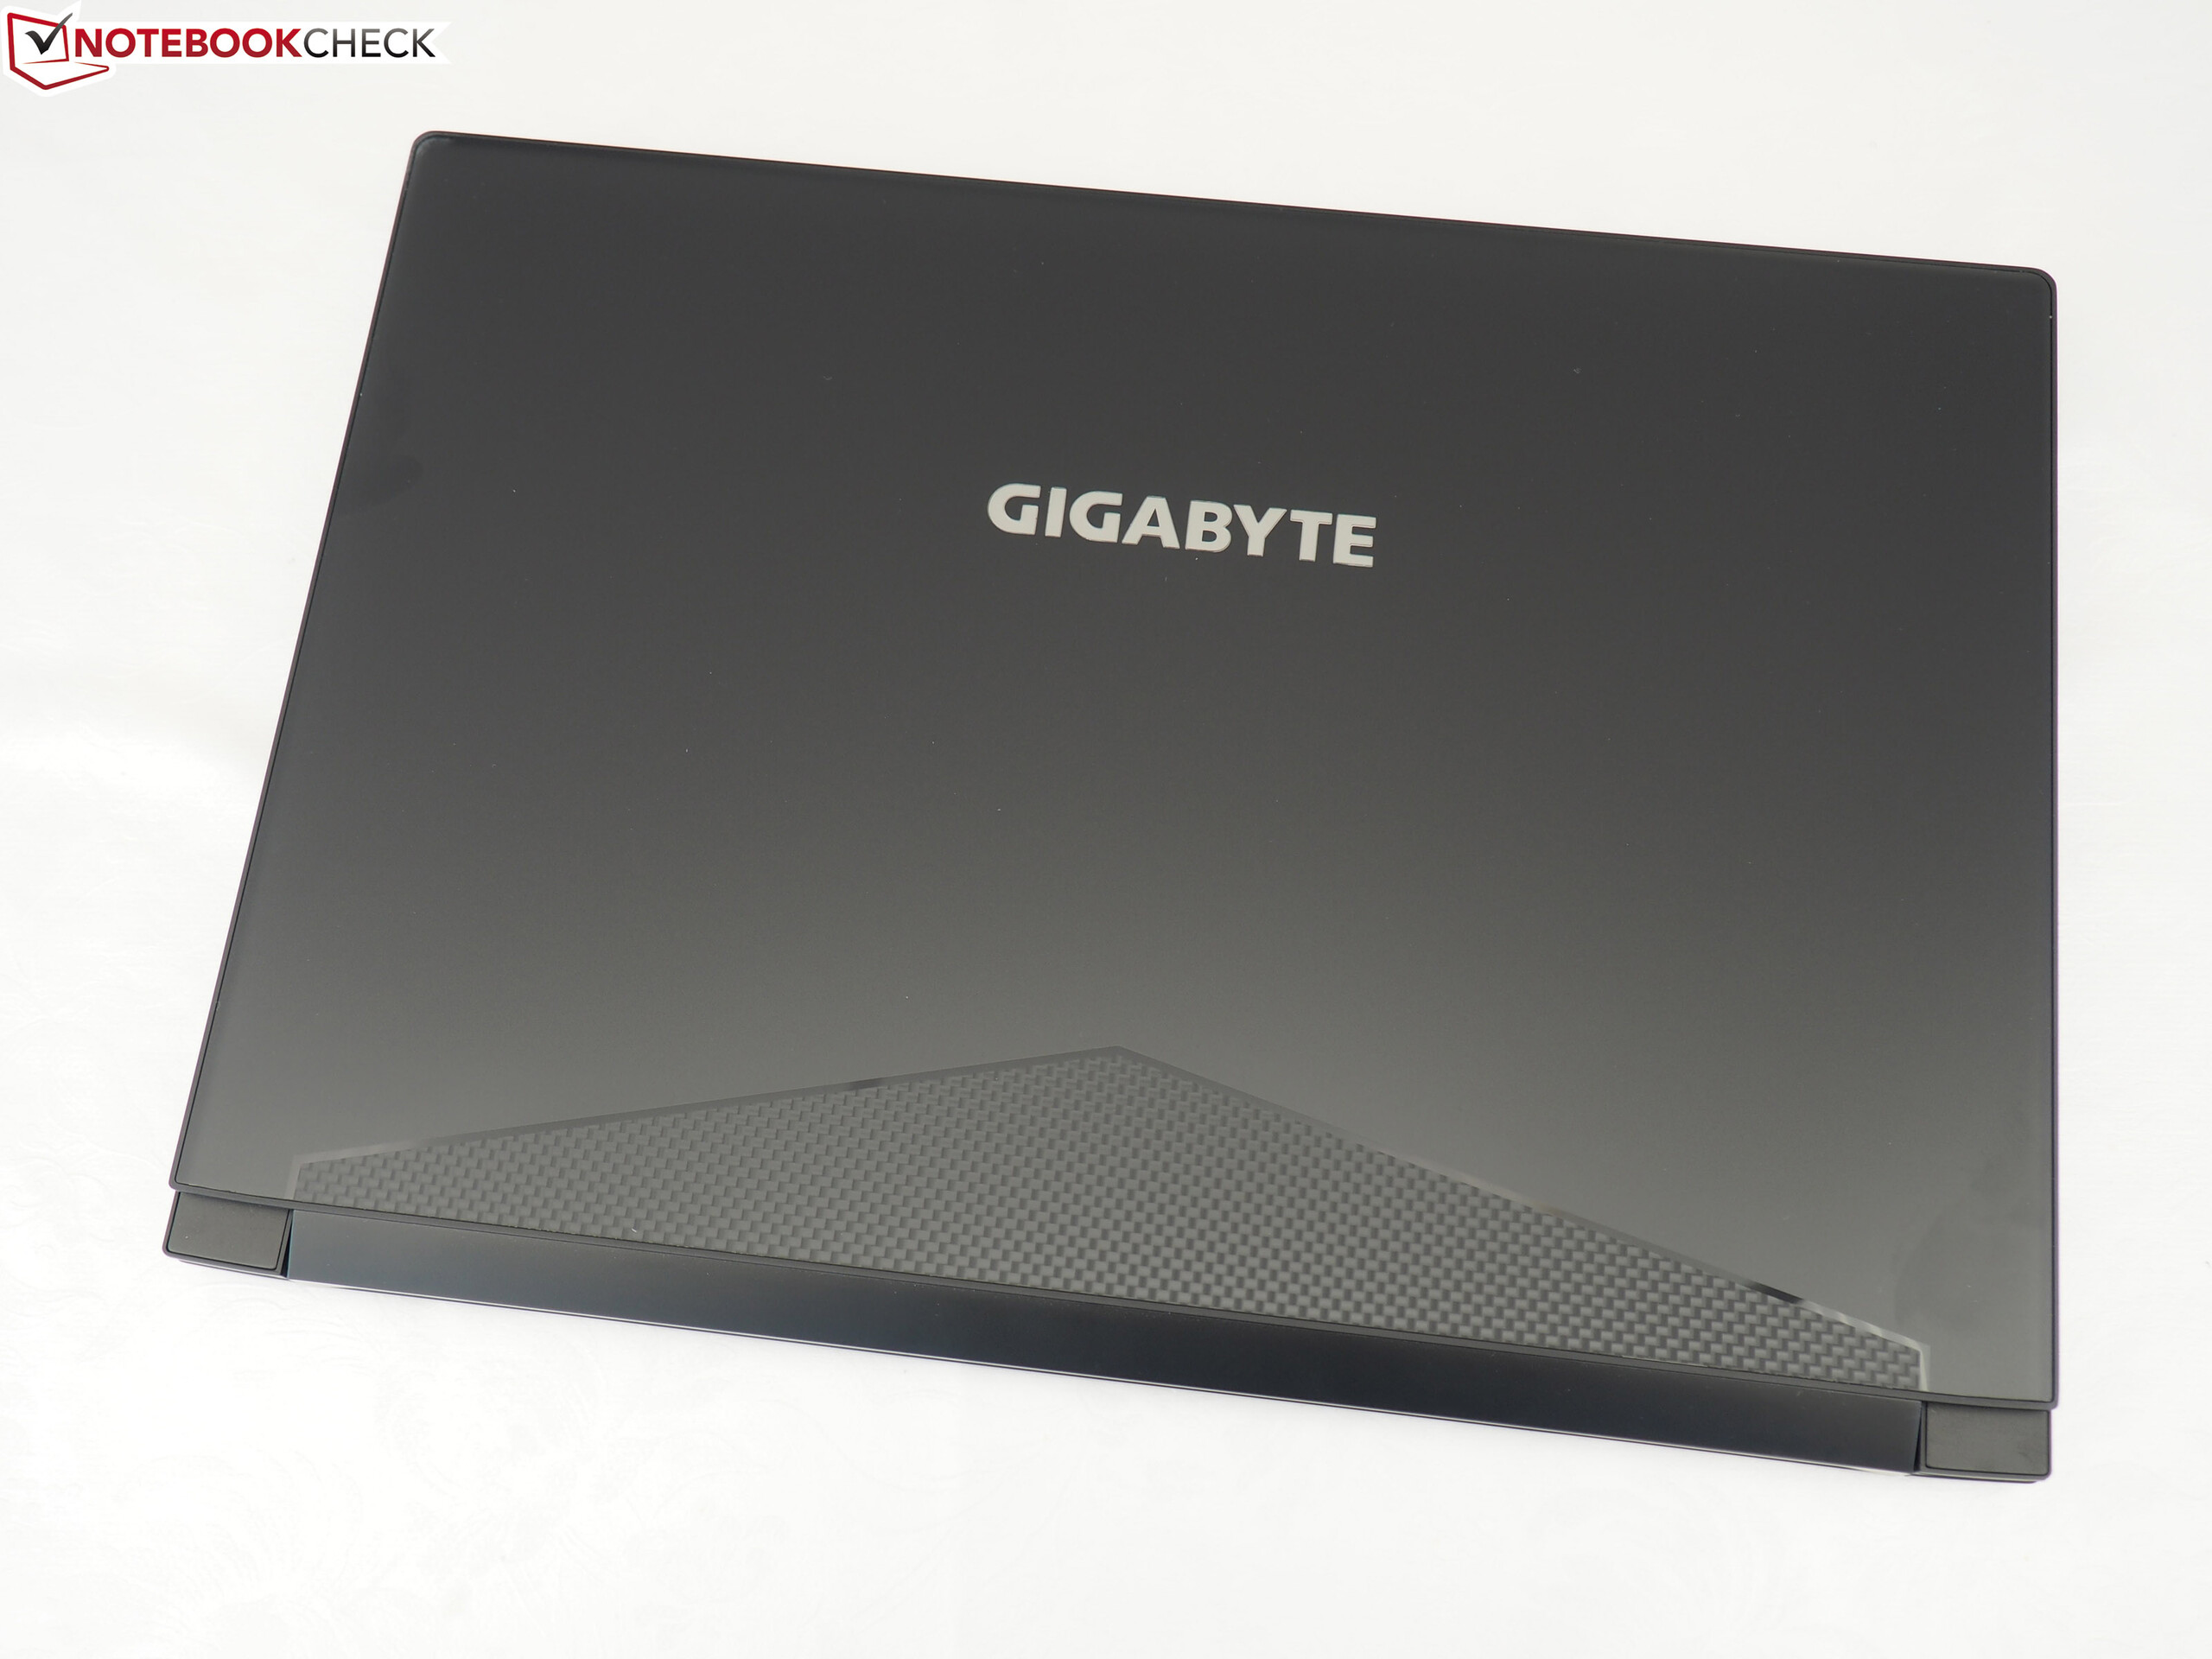
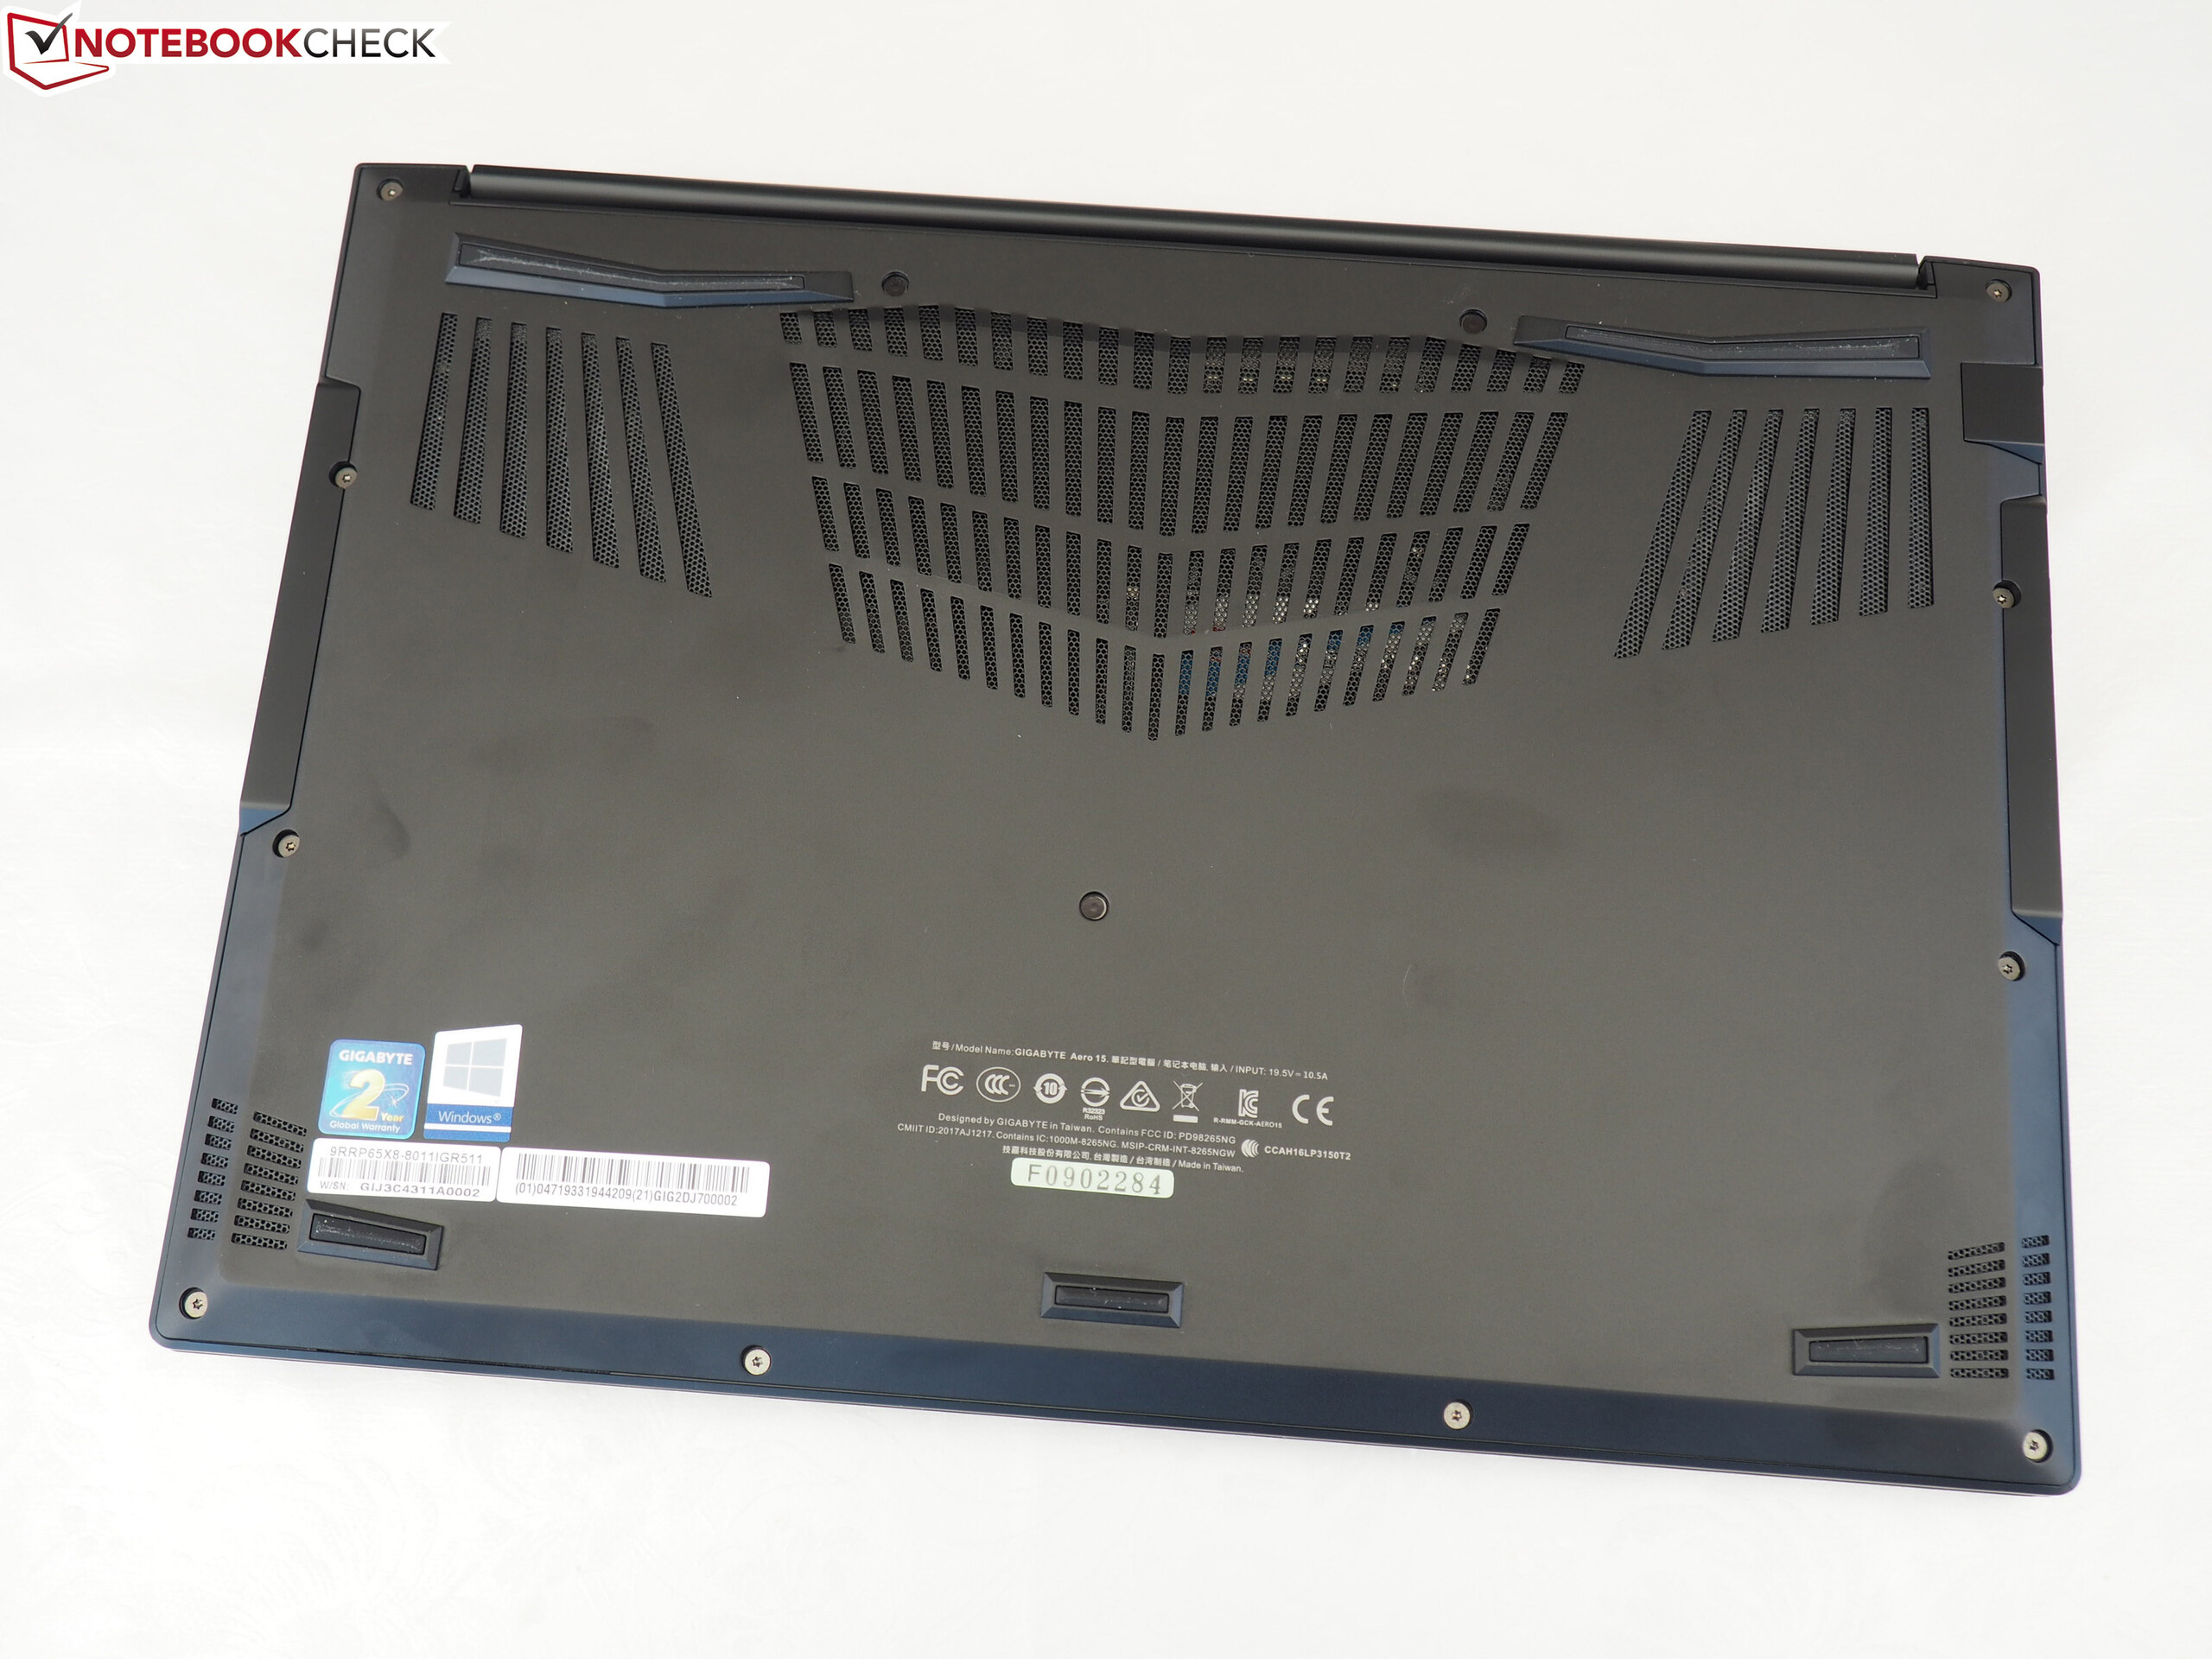
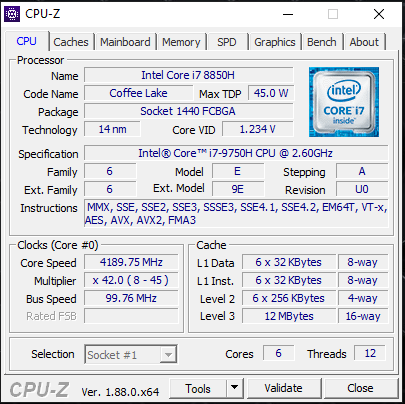
A julgar pelo exterior, o Aero 15 Classic não mudou muito em relação ao seu antecessor Aero 15-X9. As verdadeiras mudanças não estão no interior ... O portátil está equipado com um novíssimo Core i7-8750H de seis núcleos, o sucessor do Core i7-8750H.
O novo Core i7-9750H não oferece melhorias reais.
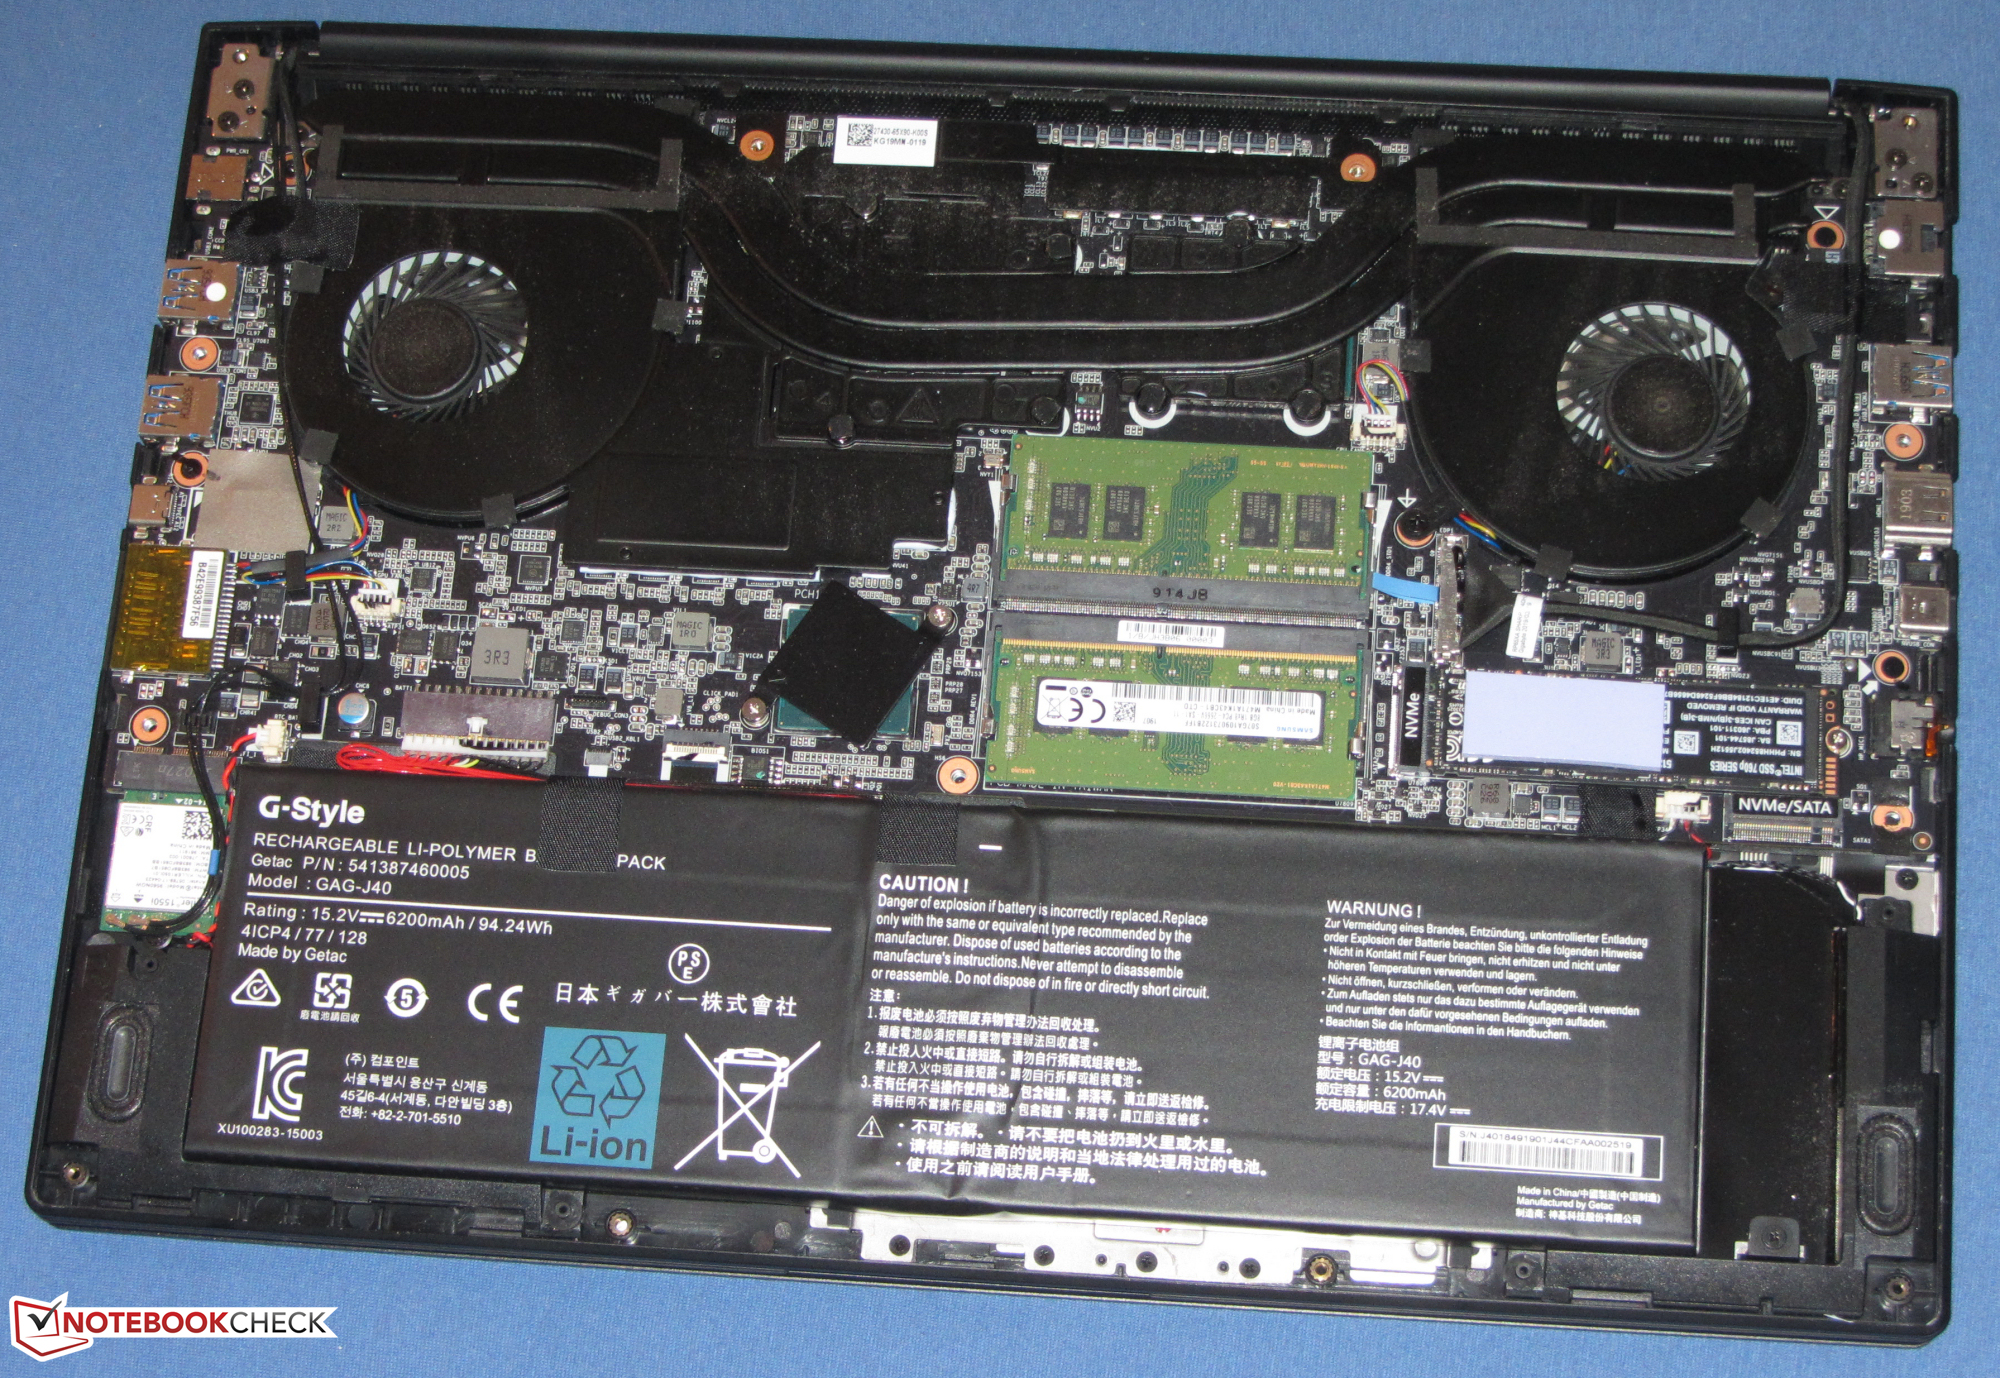
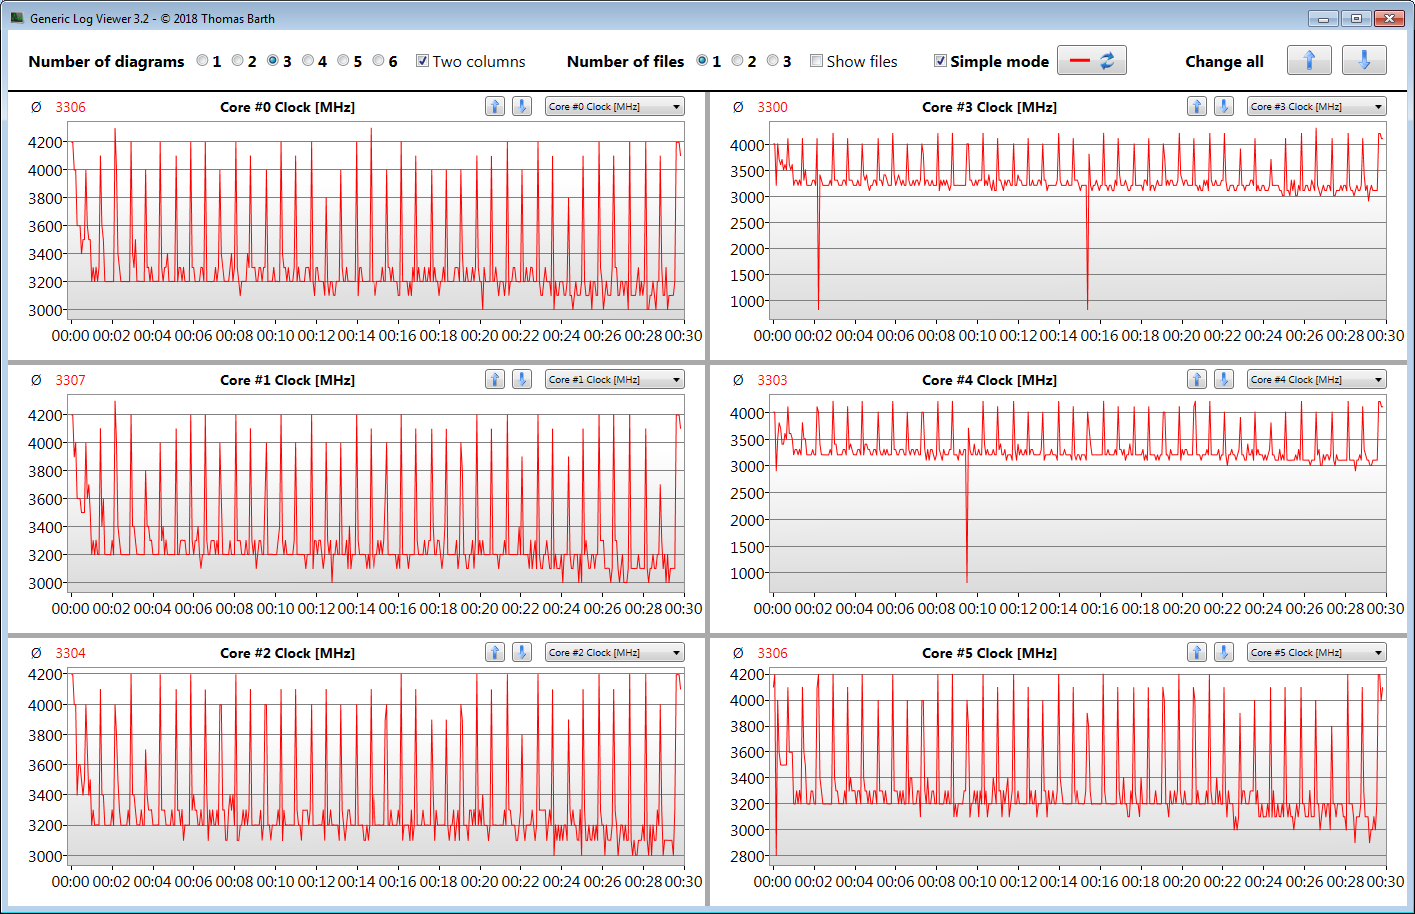
Ele não pode fazer uso real da sua memória de trabalho ligeiramente superior e os resultados são frequentemente parecidos com os do i7-8750H. Além disso, o desempenho cai continuamente sob uso intenso, que medimos com o nosso CineBench R15 loop. Assumimos que o sistema de resfriamento e o processador não estavam muito bem alinhados.
No entanto, a combinação de um Core i7-9750H e um GeForce GTX 2070 Max-Q consegue rodar todos os jogos atuais sem problemas na tela Full HD mate. Os jogos podem ser jogados com configurações altas ou máximas. O rápido SSD NVMe permite um desempenho fluente do sistema e o dispositivo também possui um slot livre para um segundo SSD M.2 2280.
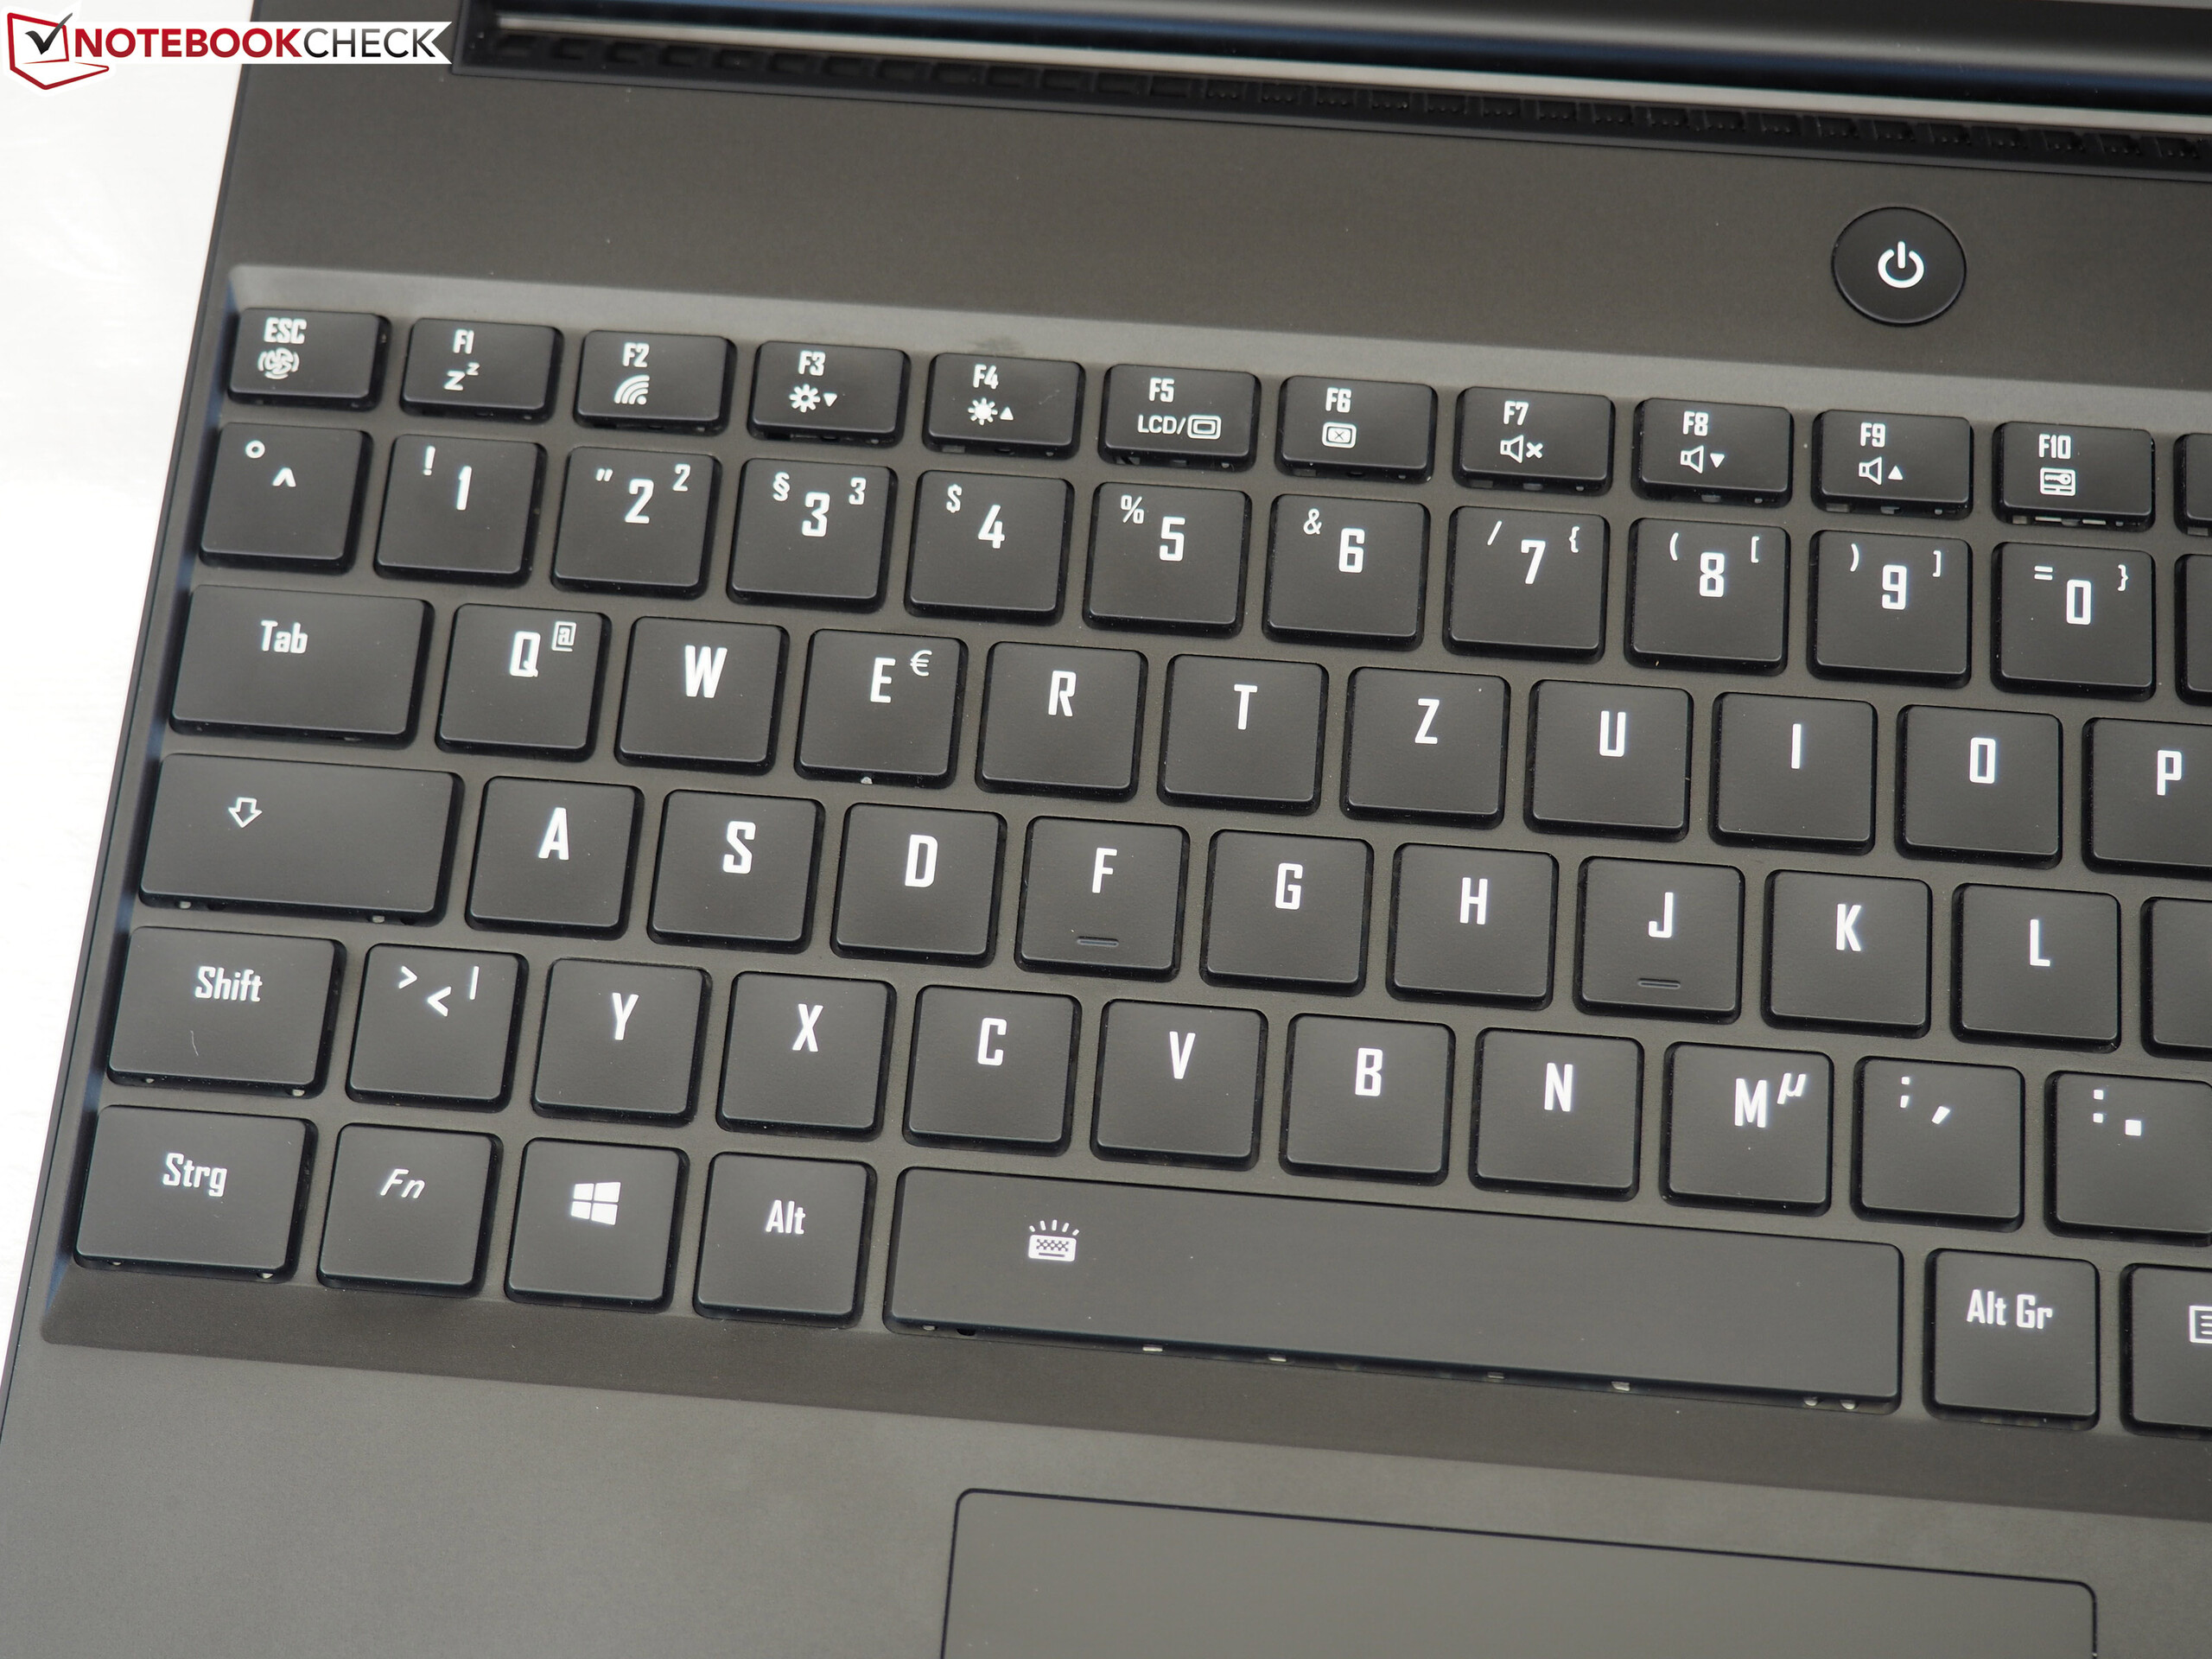
A outra coisa que foi alterada é a tela do Aero 15 Classic. Enquanto o Aero 15-X9 foi equipado com uma tela IPS de 144 Hz, a Gigabyte forneceu ao AERO 15 Classic o painel IGZO de 240 Hz, fabricado pela Sharp. Este novo painel oferece ângulos de visão estáveis, tempos de resposta curtos e, claro, ótimas cores. No entanto, ficamos decepcionados com a relação de brilho e contraste. Estes eram muito baixos, considerando a faixa de preço do dispositivo. As durações da bateria são excelentes para um portátil de jogos.
Gigabyte Aero 15 Classic-XA
- 05/14/2020 v7 (old)
Sascha Mölck
Price comparison
