Breve Análise do Portátil Toshiba Tecra X40-D (i7-7600U, FHD)
| SD Card Reader | |
| average JPG Copy Test (av. of 3 runs) | |
| Dell XPS 13 9360 FHD i7 Iris | |
| Toshiba Tecra X40-D | |
| Lenovo ThinkPad T470s-20HF0012US | |
| Lenovo ThinkPad X1 Carbon 2017-20HR0021GE | |
| Toshiba Portege X30-D (PT274U-01N001) | |
| maximum AS SSD Seq Read Test (1GB) | |
| Dell XPS 13 9360 FHD i7 Iris | |
| Lenovo ThinkPad T470s-20HF0012US | |
| Toshiba Portege X30-D (PT274U-01N001) | |
| Lenovo ThinkPad X1 Carbon 2017-20HR0021GE | |
| Toshiba Tecra X40-D | |
| |||||||||||||||||||||||||
iluminação: 85 %
iluminação com acumulador: 283.9 cd/m²
Contraste: 1136:1 (Preto: 0.25 cd/m²)
ΔE ColorChecker Calman: 6.4 | ∀{0.5-29.43 Ø4.71}
ΔE Greyscale Calman: 6.3 | ∀{0.09-98 Ø4.96}
60% sRGB (Argyll 1.6.3 3D)
38% AdobeRGB 1998 (Argyll 1.6.3 3D)
41.89% AdobeRGB 1998 (Argyll 3D)
61% sRGB (Argyll 3D)
40.55% Display P3 (Argyll 3D)
Gamma: 2.39
CCT: 6511 K
| Toshiba Tecra X40-D Toshiba TOS508F, IPS, 14", 1920x1080 | Toshiba Portege X30-D (PT274U-01N001) Toshiba TOS508F, IPS, 13.3", 1920x1080 | Lenovo ThinkPad X1 Carbon 2017-20HR0021GE B140HAN03_1, IPS, 14", 1920x1080 | Lenovo ThinkPad T470s-20HF0012US LEN40A9 (R140NWF5 R1), IPS, 14", 1920x1080 | HP Spectre 13-v131ng CMN1374, IPS UWVA, 13.3", 1920x1080 | |
|---|---|---|---|---|---|
| Display | 59% | 48% | -0% | 53% | |
| Display P3 Coverage (%) | 40.55 | 66.4 64% | 61.6 52% | 40.35 0% | 64.6 59% |
| sRGB Coverage (%) | 61 | 93.5 53% | 87.6 44% | 60.3 -1% | 88.8 46% |
| AdobeRGB 1998 Coverage (%) | 41.89 | 66.6 59% | 62.6 49% | 41.72 0% | 64.8 55% |
| Response Times | -4% | -20% | -7% | -22% | |
| Response Time Grey 50% / Grey 80% * (ms) | 38 ? | 36.8 ? 3% | 48 ? -26% | 40.8 ? -7% | 46 ? -21% |
| Response Time Black / White * (ms) | 26.8 ? | 29.6 ? -10% | 30.4 ? -13% | 28.8 ? -7% | 33 ? -23% |
| PWM Frequency (Hz) | 20410 ? | 219.3 ? | |||
| Screen | 34% | 33% | 0% | 22% | |
| Brightness middle (cd/m²) | 283.9 | 332.6 17% | 278 -2% | 271.6 -4% | 404 42% |
| Brightness (cd/m²) | 261 | 323 24% | 271 4% | 264 1% | 382 46% |
| Brightness Distribution (%) | 85 | 86 1% | 91 7% | 88 4% | 91 7% |
| Black Level * (cd/m²) | 0.25 | 0.28 -12% | 0.16 36% | 0.24 4% | 0.35 -40% |
| Contrast (:1) | 1136 | 1188 5% | 1738 53% | 1132 0% | 1154 2% |
| Colorchecker dE 2000 * | 6.4 | 2.6 59% | 4.5 30% | 6.1 5% | 5.37 16% |
| Colorchecker dE 2000 max. * | 18.7 | 6.7 64% | 8.4 55% | 28.6 -53% | 9.46 49% |
| Greyscale dE 2000 * | 6.3 | 2.5 60% | 3.2 49% | 3.4 46% | 6.44 -2% |
| Gamma | 2.39 92% | 2.12 104% | 2.02 109% | 2.12 104% | 2.52 87% |
| CCT | 6511 100% | 6720 97% | 7042 92% | 6077 107% | 6738 96% |
| Color Space (Percent of AdobeRGB 1998) (%) | 38 | 62 63% | 57 50% | 38 0% | 58 53% |
| Color Space (Percent of sRGB) (%) | 60 | 94 57% | 87.5 46% | 60 0% | 89 48% |
| Média Total (Programa/Configurações) | 30% /
34% | 20% /
29% | -2% /
-1% | 18% /
22% |
* ... menor é melhor
Exibir tempos de resposta
| ↔ Tempo de resposta preto para branco | ||
|---|---|---|
| 26.8 ms ... ascensão ↗ e queda ↘ combinadas | ↗ 16.4 ms ascensão | 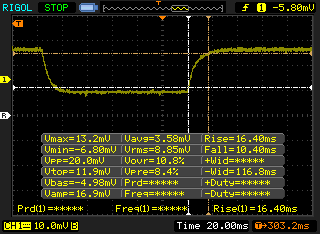 |
| ↘ 10.4 ms queda | ||
| A tela mostra taxas de resposta relativamente lentas em nossos testes e pode ser muito lenta para os jogadores. Em comparação, todos os dispositivos testados variam de 0.1 (mínimo) a 240 (máximo) ms. » 67 % de todos os dispositivos são melhores. Isso significa que o tempo de resposta medido é pior que a média de todos os dispositivos testados (19.8 ms). | ||
| ↔ Tempo de resposta 50% cinza a 80% cinza | ||
| 38 ms ... ascensão ↗ e queda ↘ combinadas | ↗ 19.6 ms ascensão | 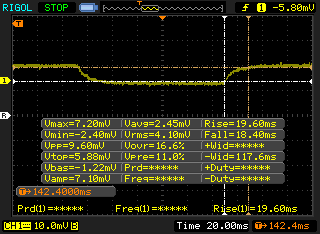 |
| ↘ 18.4 ms queda | ||
| A tela mostra taxas de resposta lentas em nossos testes e será insatisfatória para os jogadores. Em comparação, todos os dispositivos testados variam de 0.165 (mínimo) a 636 (máximo) ms. » 55 % de todos os dispositivos são melhores. Isso significa que o tempo de resposta medido é pior que a média de todos os dispositivos testados (31 ms). | ||
Cintilação da tela / PWM (modulação por largura de pulso)
| Tela tremeluzindo/PWM detectado | 20410 Hz | ≤ 99 % configuração de brilho | 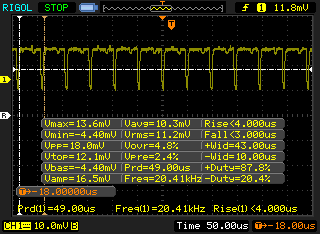 |
A luz de fundo da tela pisca em 20410 Hz (pior caso, por exemplo, utilizando PWM) Cintilação detectada em uma configuração de brilho de 99 % e abaixo. Não deve haver cintilação ou PWM acima desta configuração de brilho. A frequência de 20410 Hz é bastante alta, então a maioria dos usuários sensíveis ao PWM não deve notar nenhuma oscilação. [pwm_comparison] Em comparação: 52 % de todos os dispositivos testados não usam PWM para escurecer a tela. Se PWM foi detectado, uma média de 7757 (mínimo: 5 - máximo: 343500) Hz foi medida. | |||
| Cinebench R15 | |
| CPU Single 64Bit | |
| Dell XPS 13 9360 FHD i7 Iris | |
| Lenovo ThinkPad X270 20HN0012PB | |
| Toshiba Tecra X40-D | |
| Lenovo ThinkPad T470s-20HF0012US | |
| HP Spectre 13-v131ng | |
| Lenovo ThinkPad X1 Carbon 2017-20HR0021GE | |
| Toshiba Portege X30-D (PT274U-01N001) | |
| CPU Multi 64Bit | |
| Lenovo ThinkPad T470s-20HF0012US | |
| Toshiba Tecra X40-D | |
| Toshiba Portege X30-D (PT274U-01N001) | |
| Dell XPS 13 9360 FHD i7 Iris | |
| Lenovo ThinkPad X270 20HN0012PB | |
| Lenovo ThinkPad X1 Carbon 2017-20HR0021GE | |
| HP Spectre 13-v131ng | |
| Cinebench R10 | |
| Rendering Multiple CPUs 32Bit | |
| Toshiba Tecra X40-D | |
| Toshiba Portege X30-D (PT274U-01N001) | |
| HP Spectre 13-v131ng | |
| Lenovo ThinkPad X1 Carbon 2017-20HR0021GE | |
| Rendering Single 32Bit | |
| Toshiba Portege X30-D (PT274U-01N001) | |
| HP Spectre 13-v131ng | |
| Lenovo ThinkPad X1 Carbon 2017-20HR0021GE | |
| wPrime 2.10 - 1024m | |
| Lenovo ThinkPad X270 20HN0012PB | |
| Toshiba Portege X30-D (PT274U-01N001) | |
| Toshiba Tecra X40-D | |
| Lenovo ThinkPad T470s-20HF0012US | |
* ... menor é melhor
| PCMark 7 Score | 5979 pontos | |
| PCMark 8 Home Score Accelerated v2 | 3738 pontos | |
| PCMark 8 Creative Score Accelerated v2 | 4784 pontos | |
| PCMark 8 Work Score Accelerated v2 | 4963 pontos | |
| PCMark 10 Score | 2464 pontos | |
Ajuda | ||
| Toshiba Tecra X40-D Samsung PM961 MZVLW256HEHP | Toshiba Portege X30-D (PT274U-01N001) Samsung PM961 MZVLW256HEHP | Lenovo ThinkPad X1 Carbon 2017-20HR0021GE Toshiba THNSF5256GPUK | Lenovo ThinkPad X270 20HN0012PB Toshiba THNSF5256GPUK | Lenovo ThinkPad T470s-20HF0012US Samsung PM961 MZVLW256HEHP | HP Spectre 13-v131ng Samsung PM961 NVMe MZVLW512HMJP | |
|---|---|---|---|---|---|---|
| AS SSD | -678% | -46% | -43% | 9% | 14% | |
| Copy Game MB/s (MB/s) | 229 | 309.9 | 397.9 | |||
| Copy Program MB/s (MB/s) | 172.4 | 291 | 426 | |||
| Copy ISO MB/s (MB/s) | 623 | 797 | 720 | |||
| Score Total (Points) | 3576 | 2687 -25% | 1398 -61% | 1638 -54% | 3875 8% | 3617 1% |
| Score Write (Points) | 675 | 162 -76% | 337 -50% | 442 -35% | 803 19% | 1115 65% |
| Score Read (Points) | 1963 | 1723 -12% | 726 -63% | 802 -59% | 2083 6% | 1654 -16% |
| Access Time Write * (ms) | 0.028 | 2.01 -7079% | 0.034 -21% | 0.033 -18% | 0.025 11% | 0.026 7% |
| Access Time Read * (ms) | 0.061 | 0.05 18% | 0.102 -67% | 0.113 -85% | 0.06 2% | 0.042 31% |
| 4K-64 Write (MB/s) | 438.4 | 125.8 -71% | 149.6 -66% | 264 -40% | 538 23% | 862 97% |
| 4K-64 Read (MB/s) | 1663 | 1483 -11% | 526 -68% | 633 -62% | 1765 6% | 1465 -12% |
| 4K Write (MB/s) | 124.8 | 1.2 -99% | 109.4 -12% | 100 -20% | 147.9 19% | 134.4 8% |
| 4K Read (MB/s) | 51.6 | 42.8 -17% | 34.34 -33% | 38.8 -25% | 48.84 -5% | 56.4 9% |
| Seq Write (MB/s) | 1117 | 352.7 -68% | 775 -31% | 777 -30% | 1170 5% | 1190 7% |
| Seq Read (MB/s) | 2479 | 1972 -20% | 1649 -33% | 1294 -48% | 2691 9% | 1325 -47% |
* ... menor é melhor

| 3DMark 11 | |
| 1280x720 Performance GPU | |
| Acer Aspire 5 A515-51G-51RL | |
| Asus Zenbook UX3430UQ-GV012T | |
| Dell XPS 13 9360 FHD i7 Iris | |
| Toshiba Tecra X40-D | |
| Lenovo ThinkPad T470s-20HF0012US | |
| HP Spectre 13-v131ng | |
| Lenovo ThinkPad X1 Carbon 2017-20HR0021GE | |
| Lenovo ThinkPad X270 20HN0012PB | |
| Toshiba Portege X30-D (PT274U-01N001) | |
| 1280x720 Performance Combined | |
| Acer Aspire 5 A515-51G-51RL | |
| Dell XPS 13 9360 FHD i7 Iris | |
| Asus Zenbook UX3430UQ-GV012T | |
| Lenovo ThinkPad T470s-20HF0012US | |
| Toshiba Tecra X40-D | |
| Lenovo ThinkPad X1 Carbon 2017-20HR0021GE | |
| HP Spectre 13-v131ng | |
| Toshiba Portege X30-D (PT274U-01N001) | |
| Lenovo ThinkPad X270 20HN0012PB | |
| 3DMark | |
| 1280x720 Cloud Gate Standard Graphics | |
| Acer Aspire 5 A515-51G-51RL | |
| Dell XPS 13 9360 FHD i7 Iris | |
| Lenovo ThinkPad T470s-20HF0012US | |
| Toshiba Tecra X40-D | |
| Asus Zenbook UX3430UQ-GV012T | |
| HP Spectre 13-v131ng | |
| Lenovo ThinkPad X1 Carbon 2017-20HR0021GE | |
| Lenovo ThinkPad X270 20HN0012PB | |
| Toshiba Portege X30-D (PT274U-01N001) | |
| 1920x1080 Fire Strike Graphics | |
| Acer Aspire 5 A515-51G-51RL | |
| Asus Zenbook UX3430UQ-GV012T | |
| Dell XPS 13 9360 FHD i7 Iris | |
| Toshiba Tecra X40-D | |
| Lenovo ThinkPad T470s-20HF0012US | |
| Lenovo ThinkPad X1 Carbon 2017-20HR0021GE | |
| HP Spectre 13-v131ng | |
| Lenovo ThinkPad X270 20HN0012PB | |
| Toshiba Portege X30-D (PT274U-01N001) | |
| 1920x1080 Ice Storm Extreme Graphics | |
| Lenovo ThinkPad X1 Carbon 2017-20HR0021GE | |
| HP Spectre 13-v131ng | |
| Acer Aspire 5 A515-51G-51RL | |
| Lenovo ThinkPad X270 20HN0012PB | |
| Toshiba Portege X30-D (PT274U-01N001) | |
| 3DMark 11 Performance | 1789 pontos | |
| 3DMark Cloud Gate Standard Score | 6655 pontos | |
| 3DMark Fire Strike Score | 980 pontos | |
Ajuda | ||
| BioShock Infinite - 1920x1080 Ultra Preset, DX11 (DDOF) (classificar por valor) | |
| Toshiba Tecra X40-D | |
| Lenovo ThinkPad X1 Carbon 2017-20HR0021GE | |
| Lenovo ThinkPad X270 20HN0012PB | |
| Lenovo ThinkPad T470s-20HF0012US | |
| Dell XPS 13 9360 FHD i7 Iris | |
| Acer Aspire 5 A515-51G-51RL | |
| Asus Zenbook UX3410UQ-GV077T | |
| HP Spectre 13-v131ng | |
| Ashes of the Singularity - 1920x1080 high (classificar por valor) | |
| Toshiba Tecra X40-D | |
| Acer Aspire 5 A515-51G-51RL | |
| Rise of the Tomb Raider - 1920x1080 Very High Preset AA:FX AF:16x (classificar por valor) | |
| Toshiba Tecra X40-D | |
| Acer Aspire 5 A515-51G-51RL | |
| baixo | média | alto | ultra | |
|---|---|---|---|---|
| BioShock Infinite (2013) | 27 | 17 | ||
| Rise of the Tomb Raider (2016) | 5 | 2 | ||
| Ashes of the Singularity (2016) | 7 | 6 |
Barulho
| Ocioso |
| 28 / 28 / 28.2 dB |
| Carga |
| 33.2 / 39.9 dB |
 | ||
30 dB silencioso 40 dB(A) audível 50 dB(A) ruidosamente alto |
||
min: | ||
| Toshiba Tecra X40-D HD Graphics 620, i7-7600U, Samsung PM961 MZVLW256HEHP | Toshiba Portege X30-D (PT274U-01N001) HD Graphics 620, i7-7600U, Samsung PM961 MZVLW256HEHP | Lenovo ThinkPad X1 Carbon 2017-20HR0021GE HD Graphics 620, i5-7200U, Toshiba THNSF5256GPUK | Lenovo ThinkPad X270 20HN0012PB HD Graphics 620, i7-7500U, Toshiba THNSF5256GPUK | Lenovo ThinkPad T470s-20HF0012US HD Graphics 620, i5-7300U, Samsung PM961 MZVLW256HEHP | Dell XPS 13 9360 FHD i7 Iris Iris Plus Graphics 640, i7-7560U, Toshiba XG4 NVMe (THNSN5512GPUK) | HP Spectre 13-v131ng HD Graphics 620, i7-7500U, Samsung PM961 NVMe MZVLW512HMJP | |
|---|---|---|---|---|---|---|---|
| Noise | 0% | -4% | -8% | -1% | -3% | -9% | |
| desligado / ambiente * (dB) | 28 | 28.4 -1% | 29.6 -6% | 27.8 1% | 29.9 -7% | 30.4 -9% | |
| Idle Minimum * (dB) | 28 | 28.4 -1% | 29.6 -6% | 30 -7% | 27.8 1% | 29.9 -7% | 30.4 -9% |
| Idle Average * (dB) | 28 | 28.4 -1% | 29.6 -6% | 30 -7% | 27.8 1% | 29.9 -7% | 30.4 -9% |
| Idle Maximum * (dB) | 28.2 | 28.4 -1% | 32.2 -14% | 33.2 -18% | 27.8 1% | 30.3 -7% | 30.4 -8% |
| Load Average * (dB) | 33.2 | 33.2 -0% | 34.2 -3% | 37.2 -12% | 34.8 -5% | 33.9 -2% | 40 -20% |
| Load Maximum * (dB) | 39.9 | 37.9 5% | 36.1 10% | 37.9 5% | 42 -5% | 34.9 13% | 40 -0% |
| Witcher 3 ultra * (dB) | 42 |
* ... menor é melhor
(±) A temperatura máxima no lado superior é 43 °C / 109 F, em comparação com a média de 34.3 °C / 94 F , variando de 21.2 a 62.5 °C para a classe Office.
(±) A parte inferior aquece até um máximo de 42 °C / 108 F, em comparação com a média de 36.8 °C / 98 F
(+) Em uso inativo, a temperatura média para o lado superior é 26 °C / 79 F, em comparação com a média do dispositivo de 29.5 °C / ### class_avg_f### F.
(+) Os apoios para as mãos e o touchpad são mais frios que a temperatura da pele, com um máximo de 27.6 °C / 81.7 F e, portanto, são frios ao toque.
(±) A temperatura média da área do apoio para as mãos de dispositivos semelhantes foi 27.5 °C / 81.5 F (-0.1 °C / -0.2 F).
Toshiba Tecra X40-D análise de áudio
(±) | o volume do alto-falante é médio, mas bom (###valor### dB)
Graves 100 - 315Hz
(-) | quase nenhum baixo - em média 15.2% menor que a mediana
(±) | a linearidade dos graves é média (7.2% delta para a frequência anterior)
Médios 400 - 2.000 Hz
(+) | médios equilibrados - apenas 3.6% longe da mediana
(+) | médios são lineares (5.7% delta para frequência anterior)
Altos 2 - 16 kHz
(±) | máximos mais altos - em média 5.6% maior que a mediana
(+) | os máximos são lineares (5.2% delta da frequência anterior)
Geral 100 - 16.000 Hz
(±) | a linearidade do som geral é média (22% diferença em relação à mediana)
Comparado com a mesma classe
» 58% de todos os dispositivos testados nesta classe foram melhores, 8% semelhantes, 34% piores
» O melhor teve um delta de 7%, a média foi 21%, o pior foi 53%
Comparado com todos os dispositivos testados
» 64% de todos os dispositivos testados foram melhores, 6% semelhantes, 30% piores
» O melhor teve um delta de 4%, a média foi 23%, o pior foi 134%
Lenovo ThinkPad T470s-20HF0012US análise de áudio
(±) | o volume do alto-falante é médio, mas bom (###valor### dB)
Graves 100 - 315Hz
(-) | quase nenhum baixo - em média 15.3% menor que a mediana
(±) | a linearidade dos graves é média (14.1% delta para a frequência anterior)
Médios 400 - 2.000 Hz
(+) | médios equilibrados - apenas 3.2% longe da mediana
(±) | a linearidade dos médios é média (11% delta para frequência anterior)
Altos 2 - 16 kHz
(+) | agudos equilibrados - apenas 4.4% longe da mediana
(±) | a linearidade dos máximos é média (12.5% delta para frequência anterior)
Geral 100 - 16.000 Hz
(±) | a linearidade do som geral é média (24.8% diferença em relação à mediana)
Comparado com a mesma classe
» 74% de todos os dispositivos testados nesta classe foram melhores, 7% semelhantes, 19% piores
» O melhor teve um delta de 7%, a média foi 21%, o pior foi 53%
Comparado com todos os dispositivos testados
» 76% de todos os dispositivos testados foram melhores, 5% semelhantes, 19% piores
» O melhor teve um delta de 4%, a média foi 23%, o pior foi 134%
| desligado | |
| Ocioso | |
| Carga |
|
Key:
min: | |
| Toshiba Tecra X40-D i7-7600U, HD Graphics 620, Samsung PM961 MZVLW256HEHP, IPS, 1920x1080, 14" | Toshiba Portege X30-D (PT274U-01N001) i7-7600U, HD Graphics 620, Samsung PM961 MZVLW256HEHP, IPS, 1920x1080, 13.3" | Lenovo ThinkPad X1 Carbon 2017-20HR0021GE i5-7200U, HD Graphics 620, Toshiba THNSF5256GPUK, IPS, 1920x1080, 14" | Lenovo ThinkPad X270 20HN0012PB i7-7500U, HD Graphics 620, Toshiba THNSF5256GPUK, , 1920x1080, 12.5" | Lenovo ThinkPad T470s-20HF0012US i5-7300U, HD Graphics 620, Samsung PM961 MZVLW256HEHP, IPS, 1920x1080, 14" | HP Spectre 13-v131ng i7-7500U, HD Graphics 620, Samsung PM961 NVMe MZVLW512HMJP, IPS UWVA, 1920x1080, 13.3" | |
|---|---|---|---|---|---|---|
| Power Consumption | -1% | -16% | -6% | -19% | -9% | |
| Idle Minimum * (Watt) | 5.2 | 4.6 12% | 3.8 27% | 3.8 27% | 4.8 8% | 3.6 31% |
| Idle Average * (Watt) | 6.9 | 7.6 -10% | 7.1 -3% | 7.3 -6% | 6.6 4% | 6.4 7% |
| Idle Maximum * (Watt) | 7 | 8.2 -17% | 8.3 -19% | 10 -43% | 7 -0% | 9.2 -31% |
| Load Average * (Watt) | 24.6 | 23.8 3% | 34.2 -39% | 28.1 -14% | 39.2 -59% | 34 -38% |
| Load Maximum * (Watt) | 30.1 | 28 7% | 43.3 -44% | 29 4% | 44.8 -49% | 34.4 -14% |
* ... menor é melhor
| Toshiba Tecra X40-D i7-7600U, HD Graphics 620, 48 Wh | Toshiba Portege X30-D (PT274U-01N001) i7-7600U, HD Graphics 620, 48 Wh | Lenovo ThinkPad X1 Carbon 2017-20HR0021GE i5-7200U, HD Graphics 620, 57 Wh | Lenovo ThinkPad T470s-20HF0012US i5-7300U, HD Graphics 620, 51 Wh | HP Spectre 13-v131ng i7-7500U, HD Graphics 620, 38 Wh | |
|---|---|---|---|---|---|
| Duração da bateria | 6% | 14% | 31% | -15% | |
| Reader / Idle (h) | 14.6 | 15 3% | 13.7 -6% | 17.7 21% | 12 -18% |
| WiFi v1.3 (h) | 6 | 7.2 20% | 9.1 52% | 8.1 35% | 6.6 10% |
| Load (h) | 2.1 | 2 -5% | 2 -5% | 2.9 38% | 1.3 -38% |
Pro
Contra
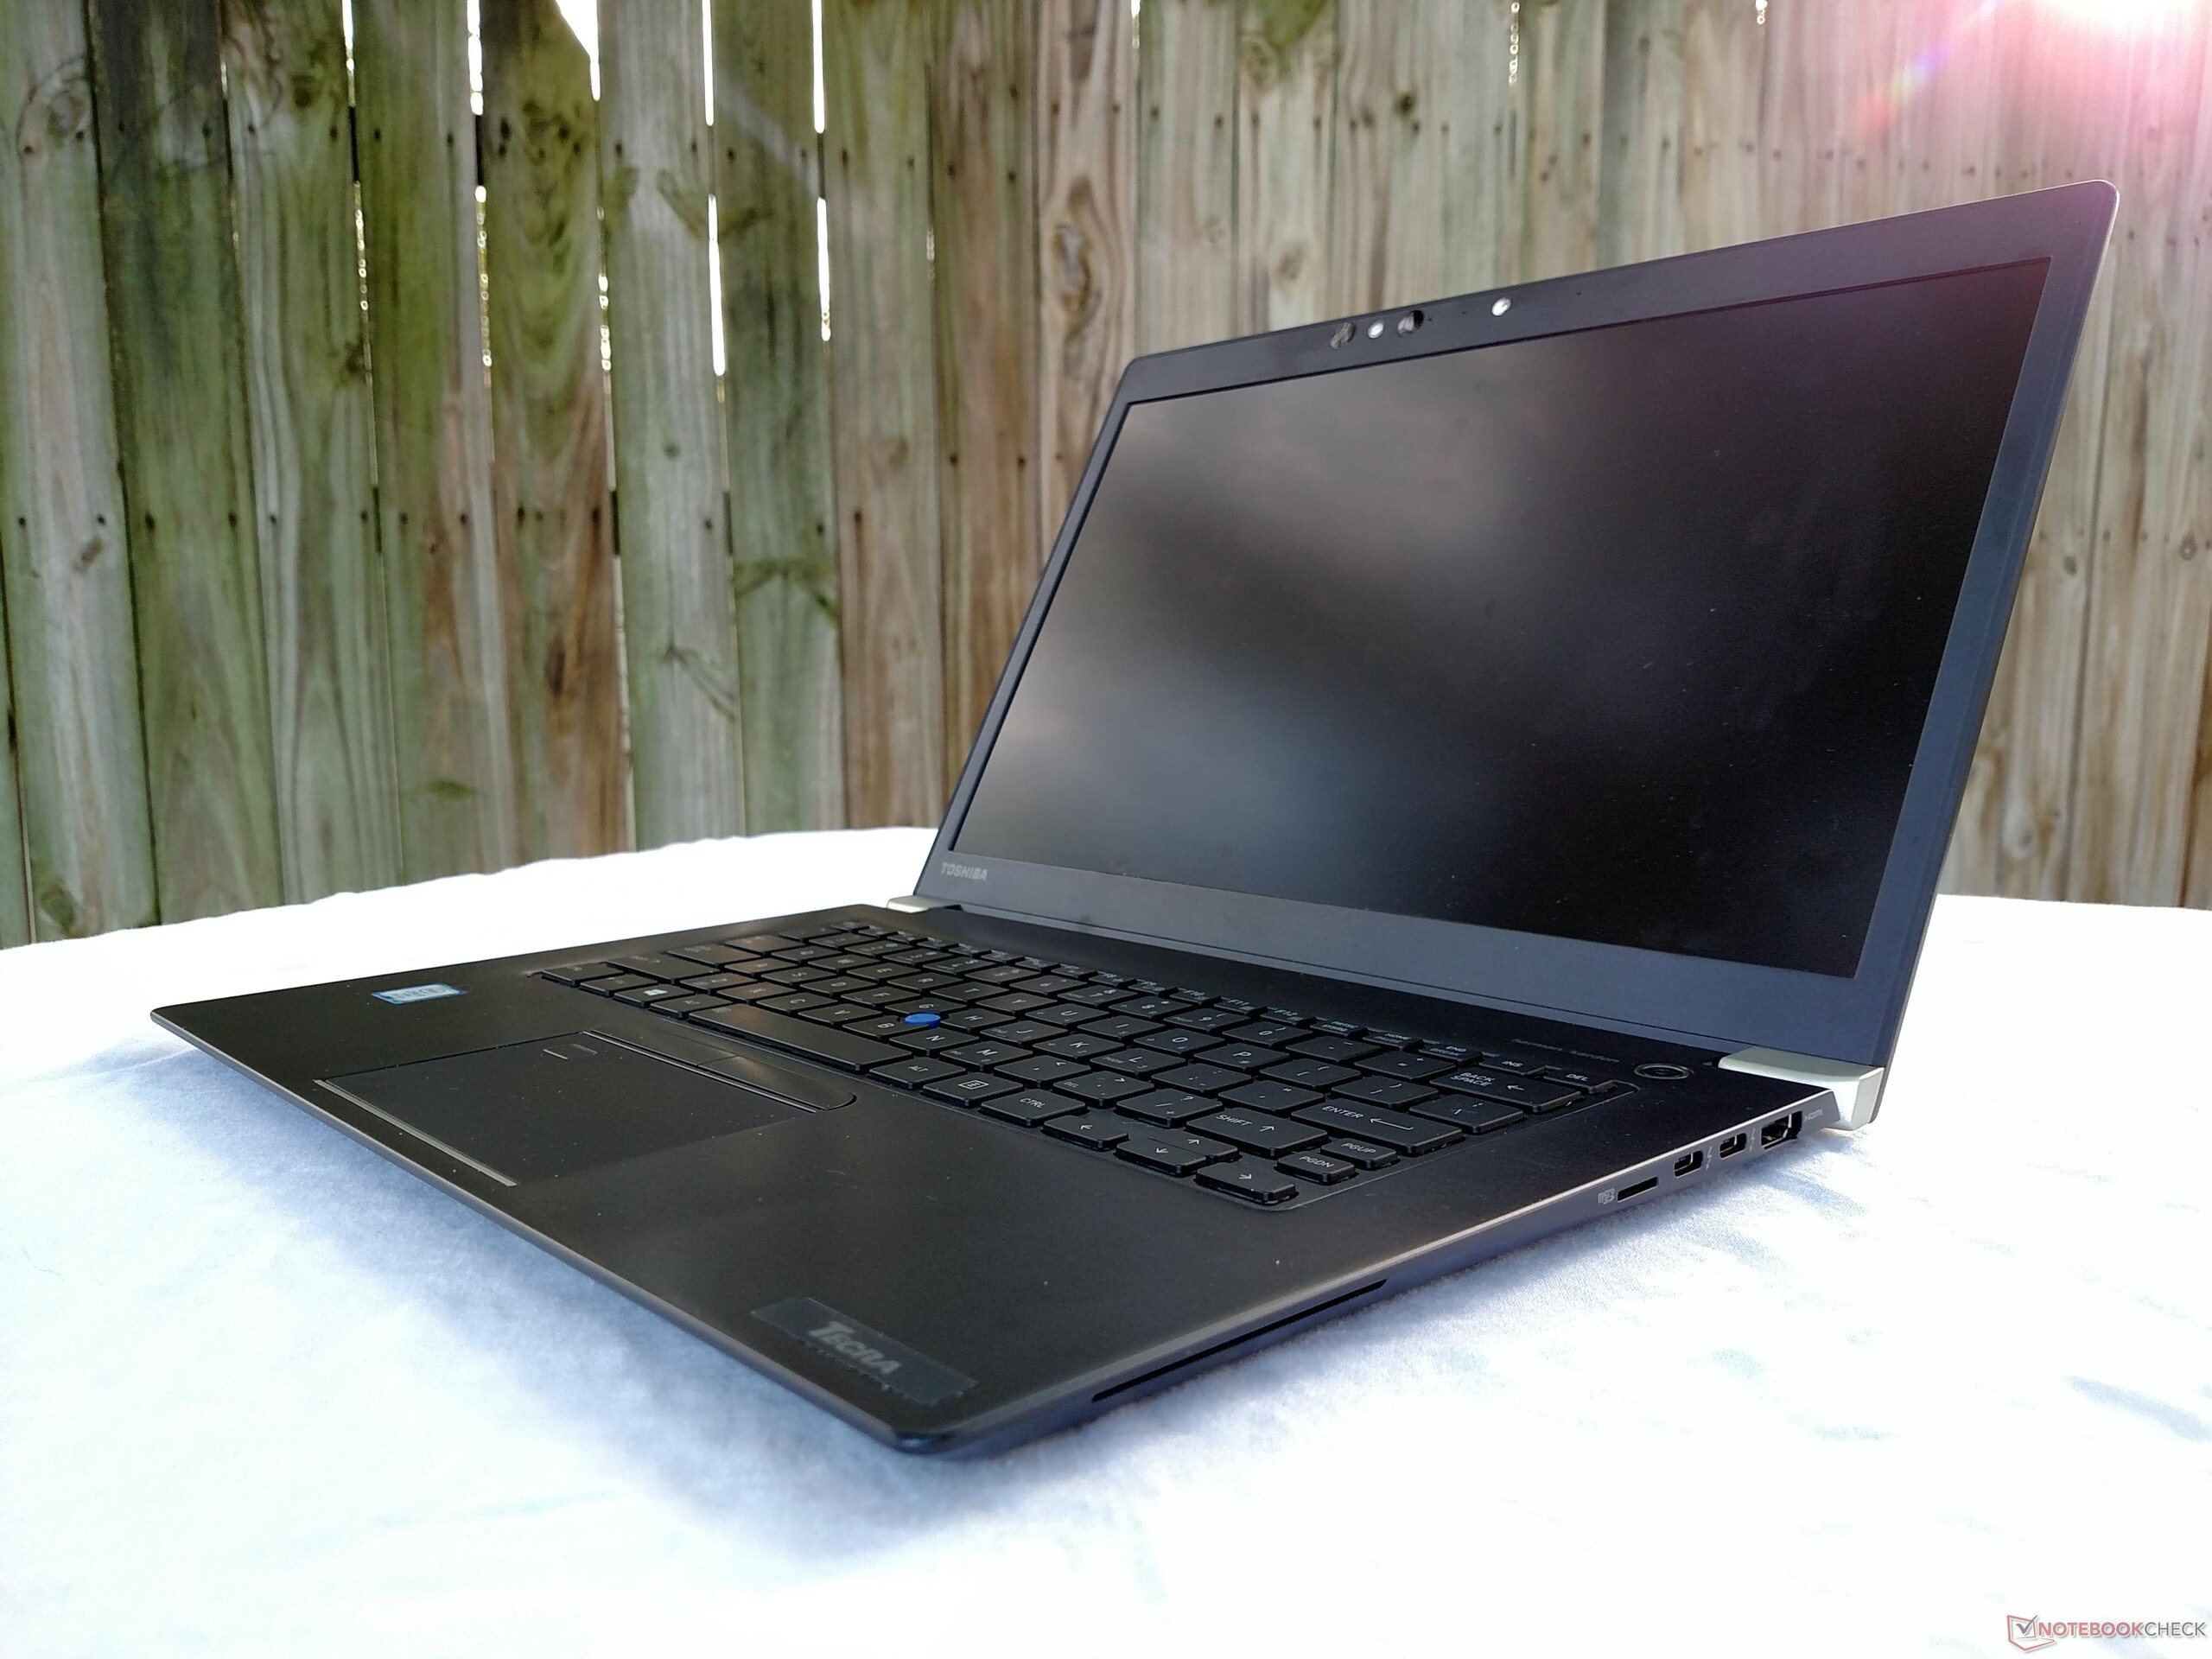
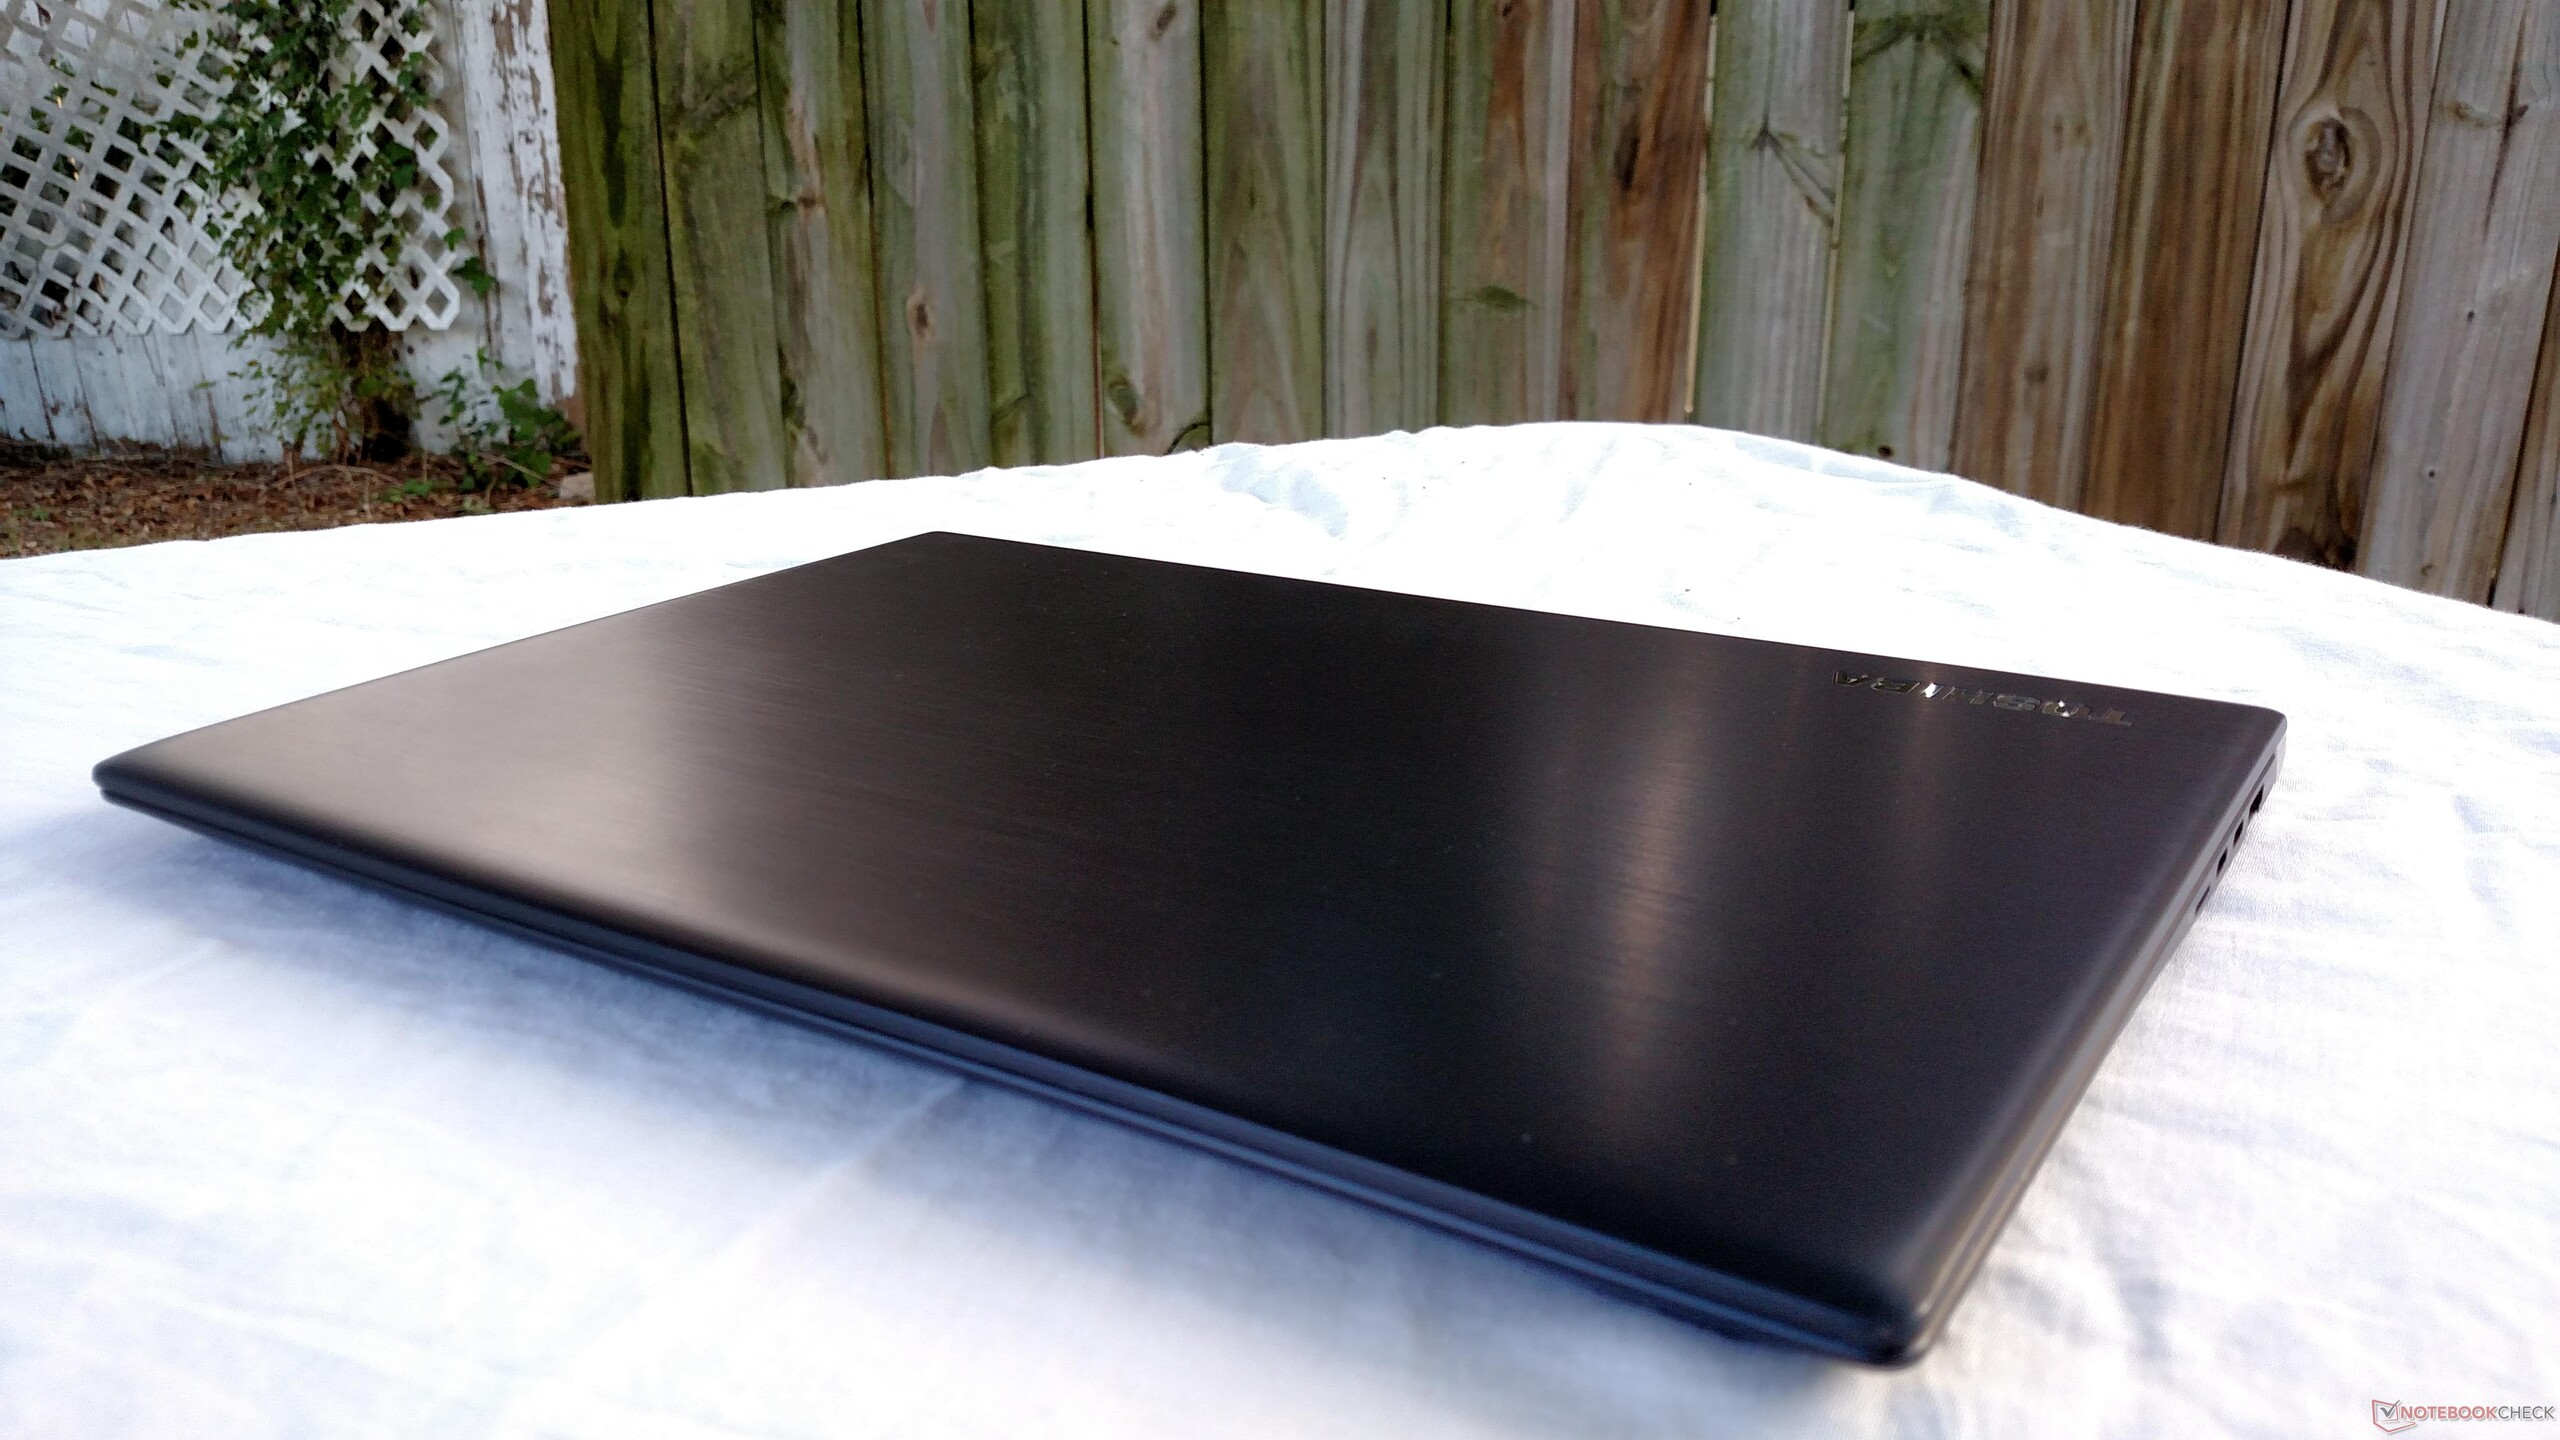
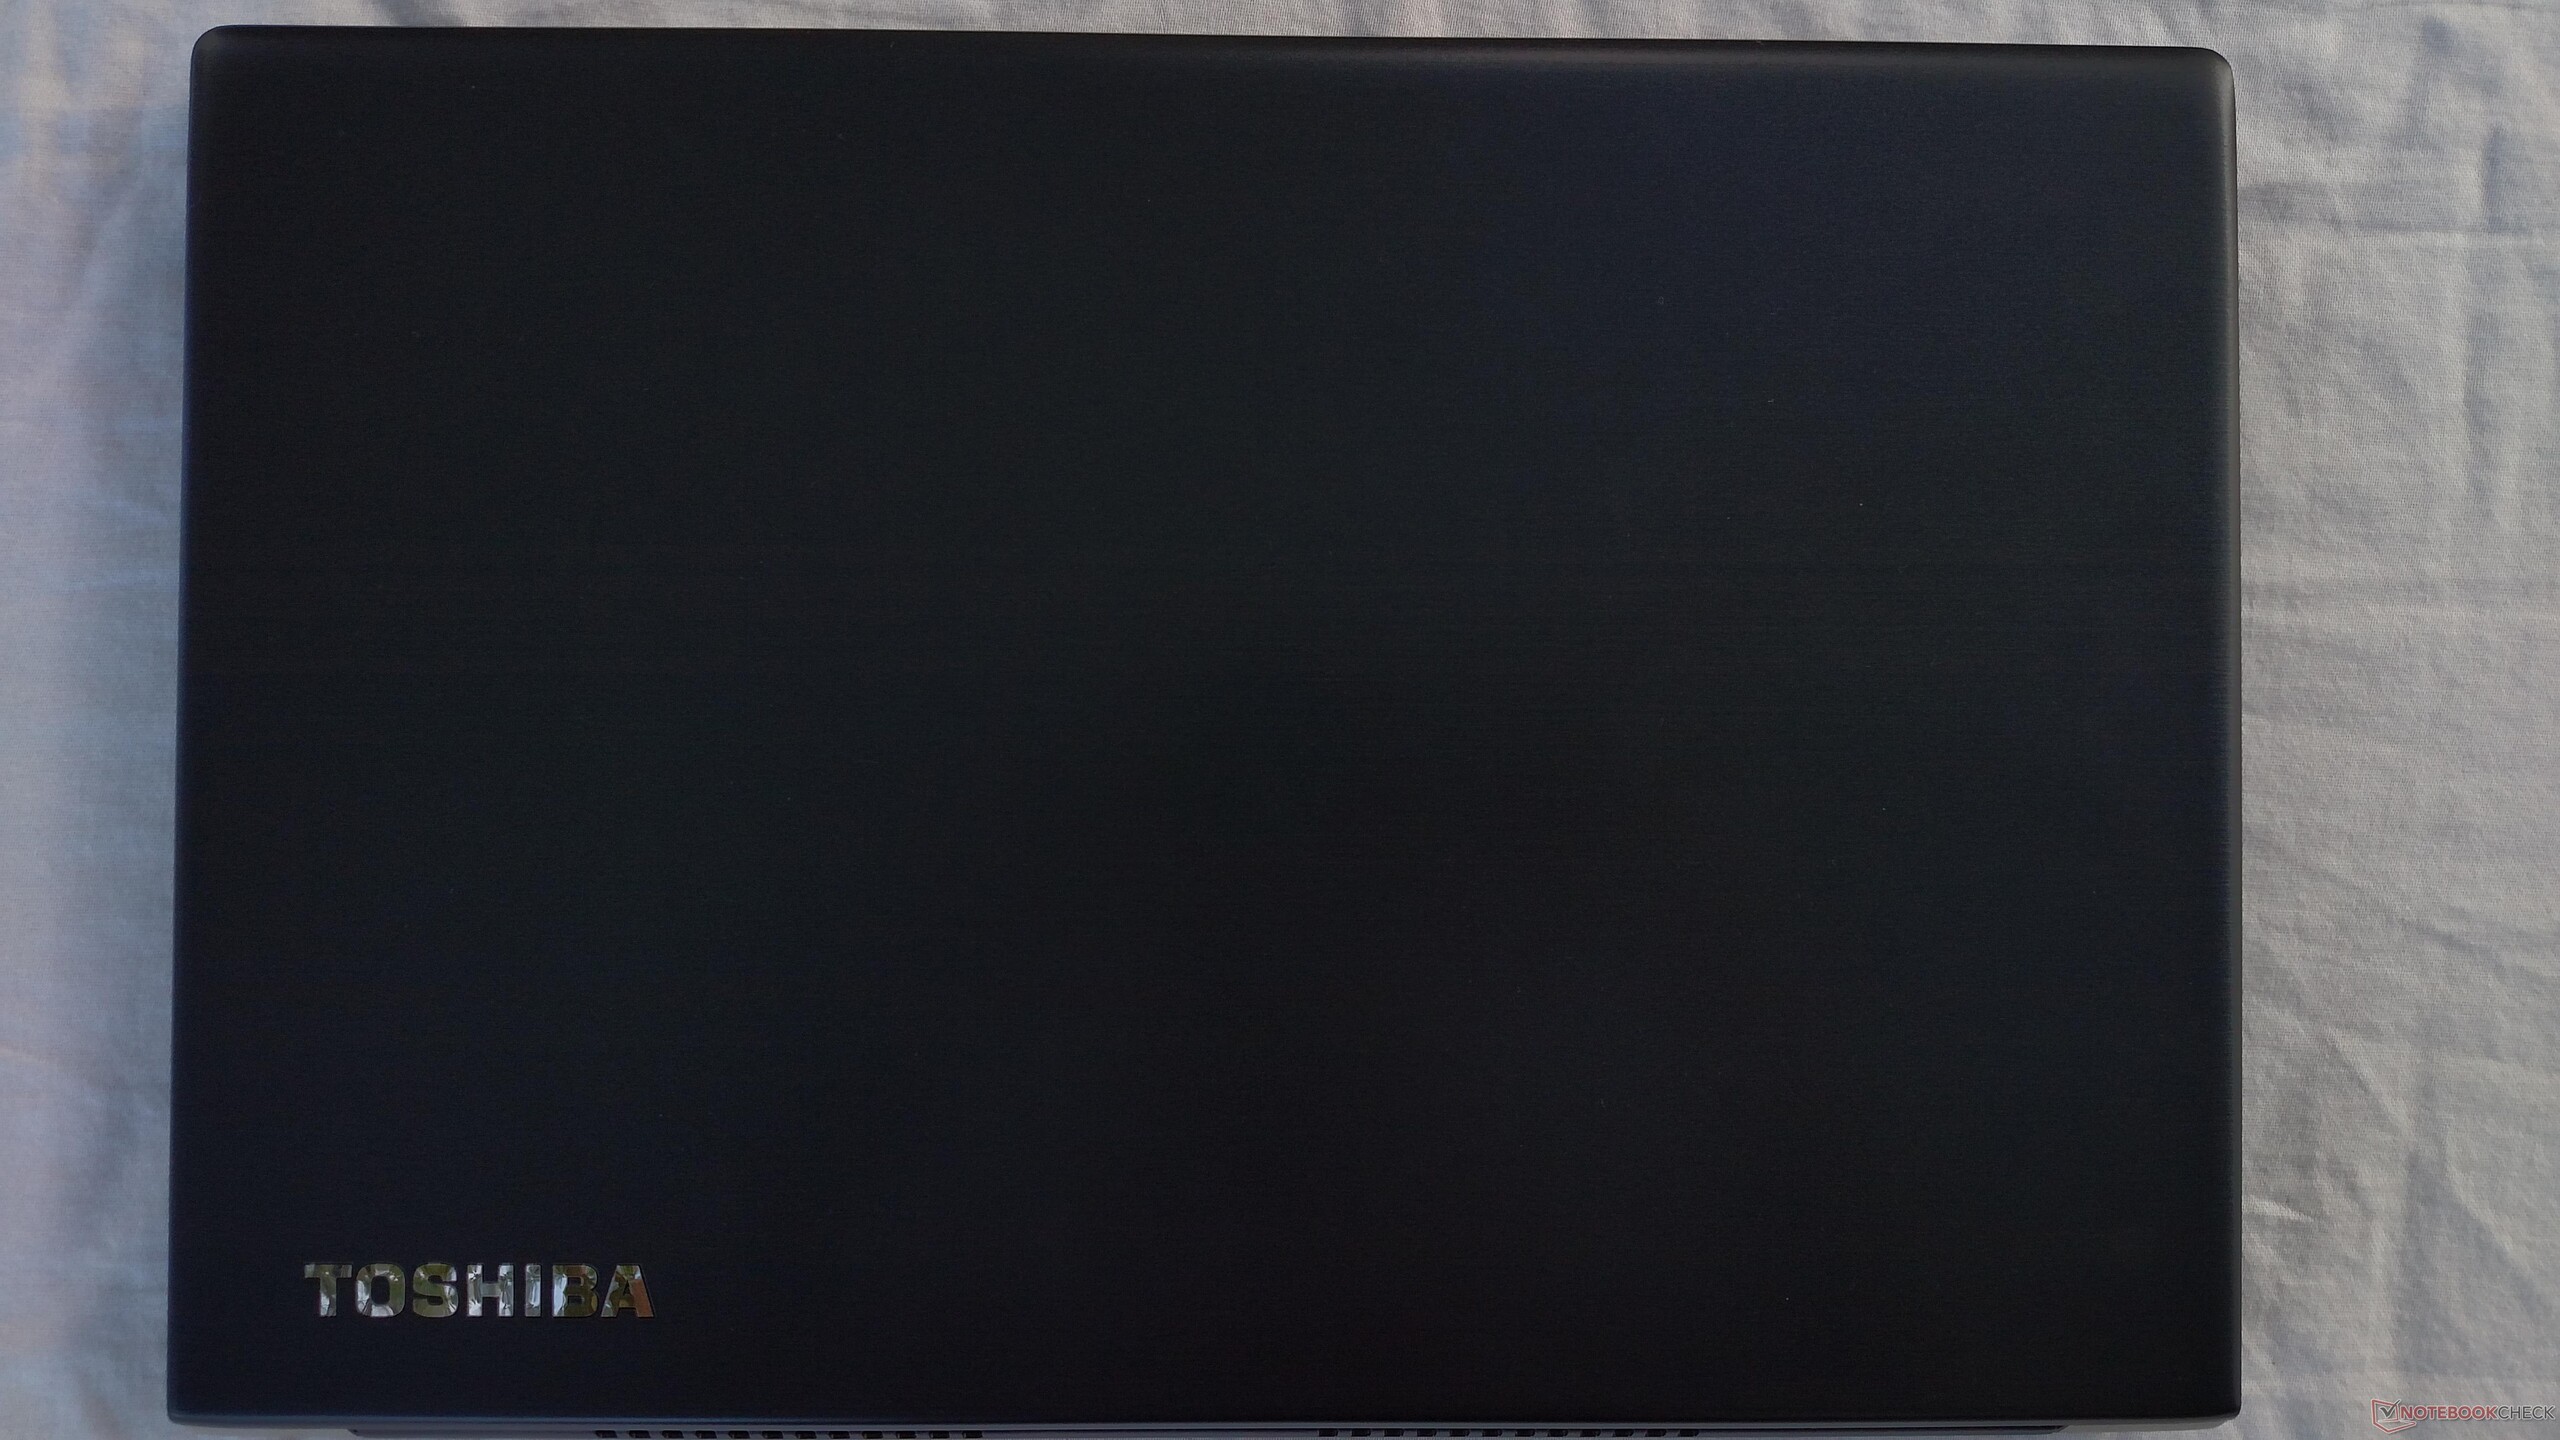
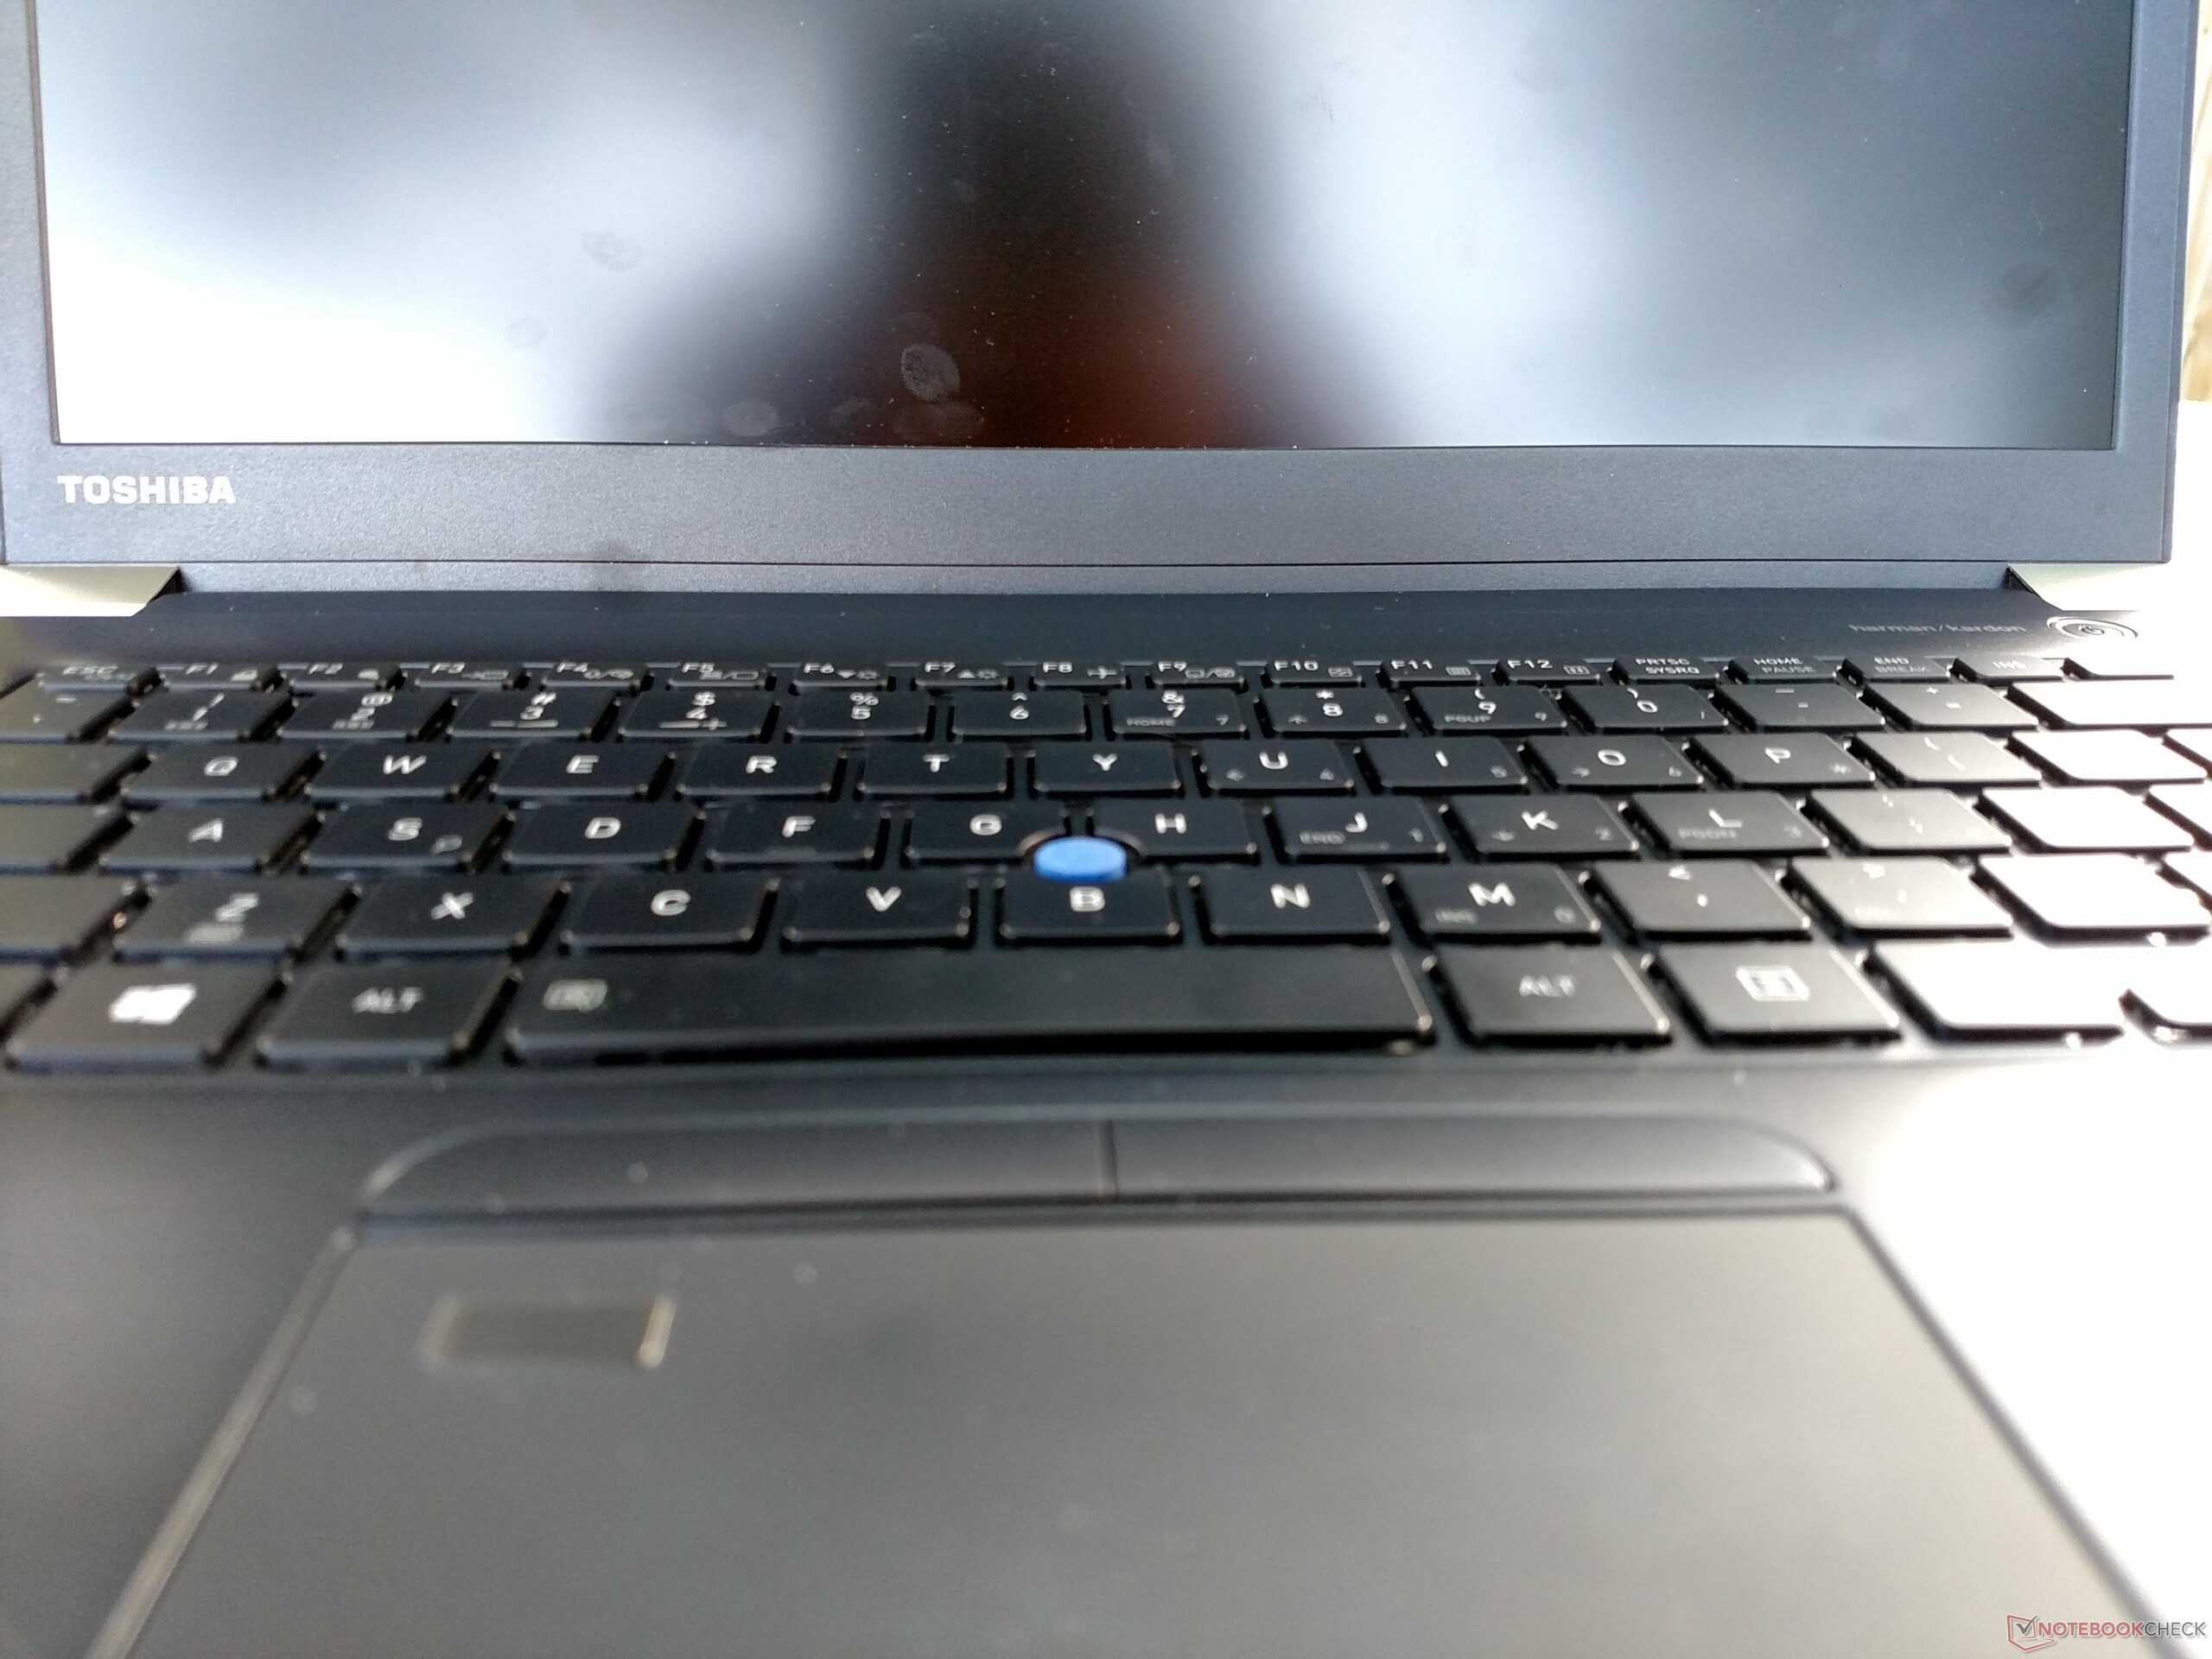
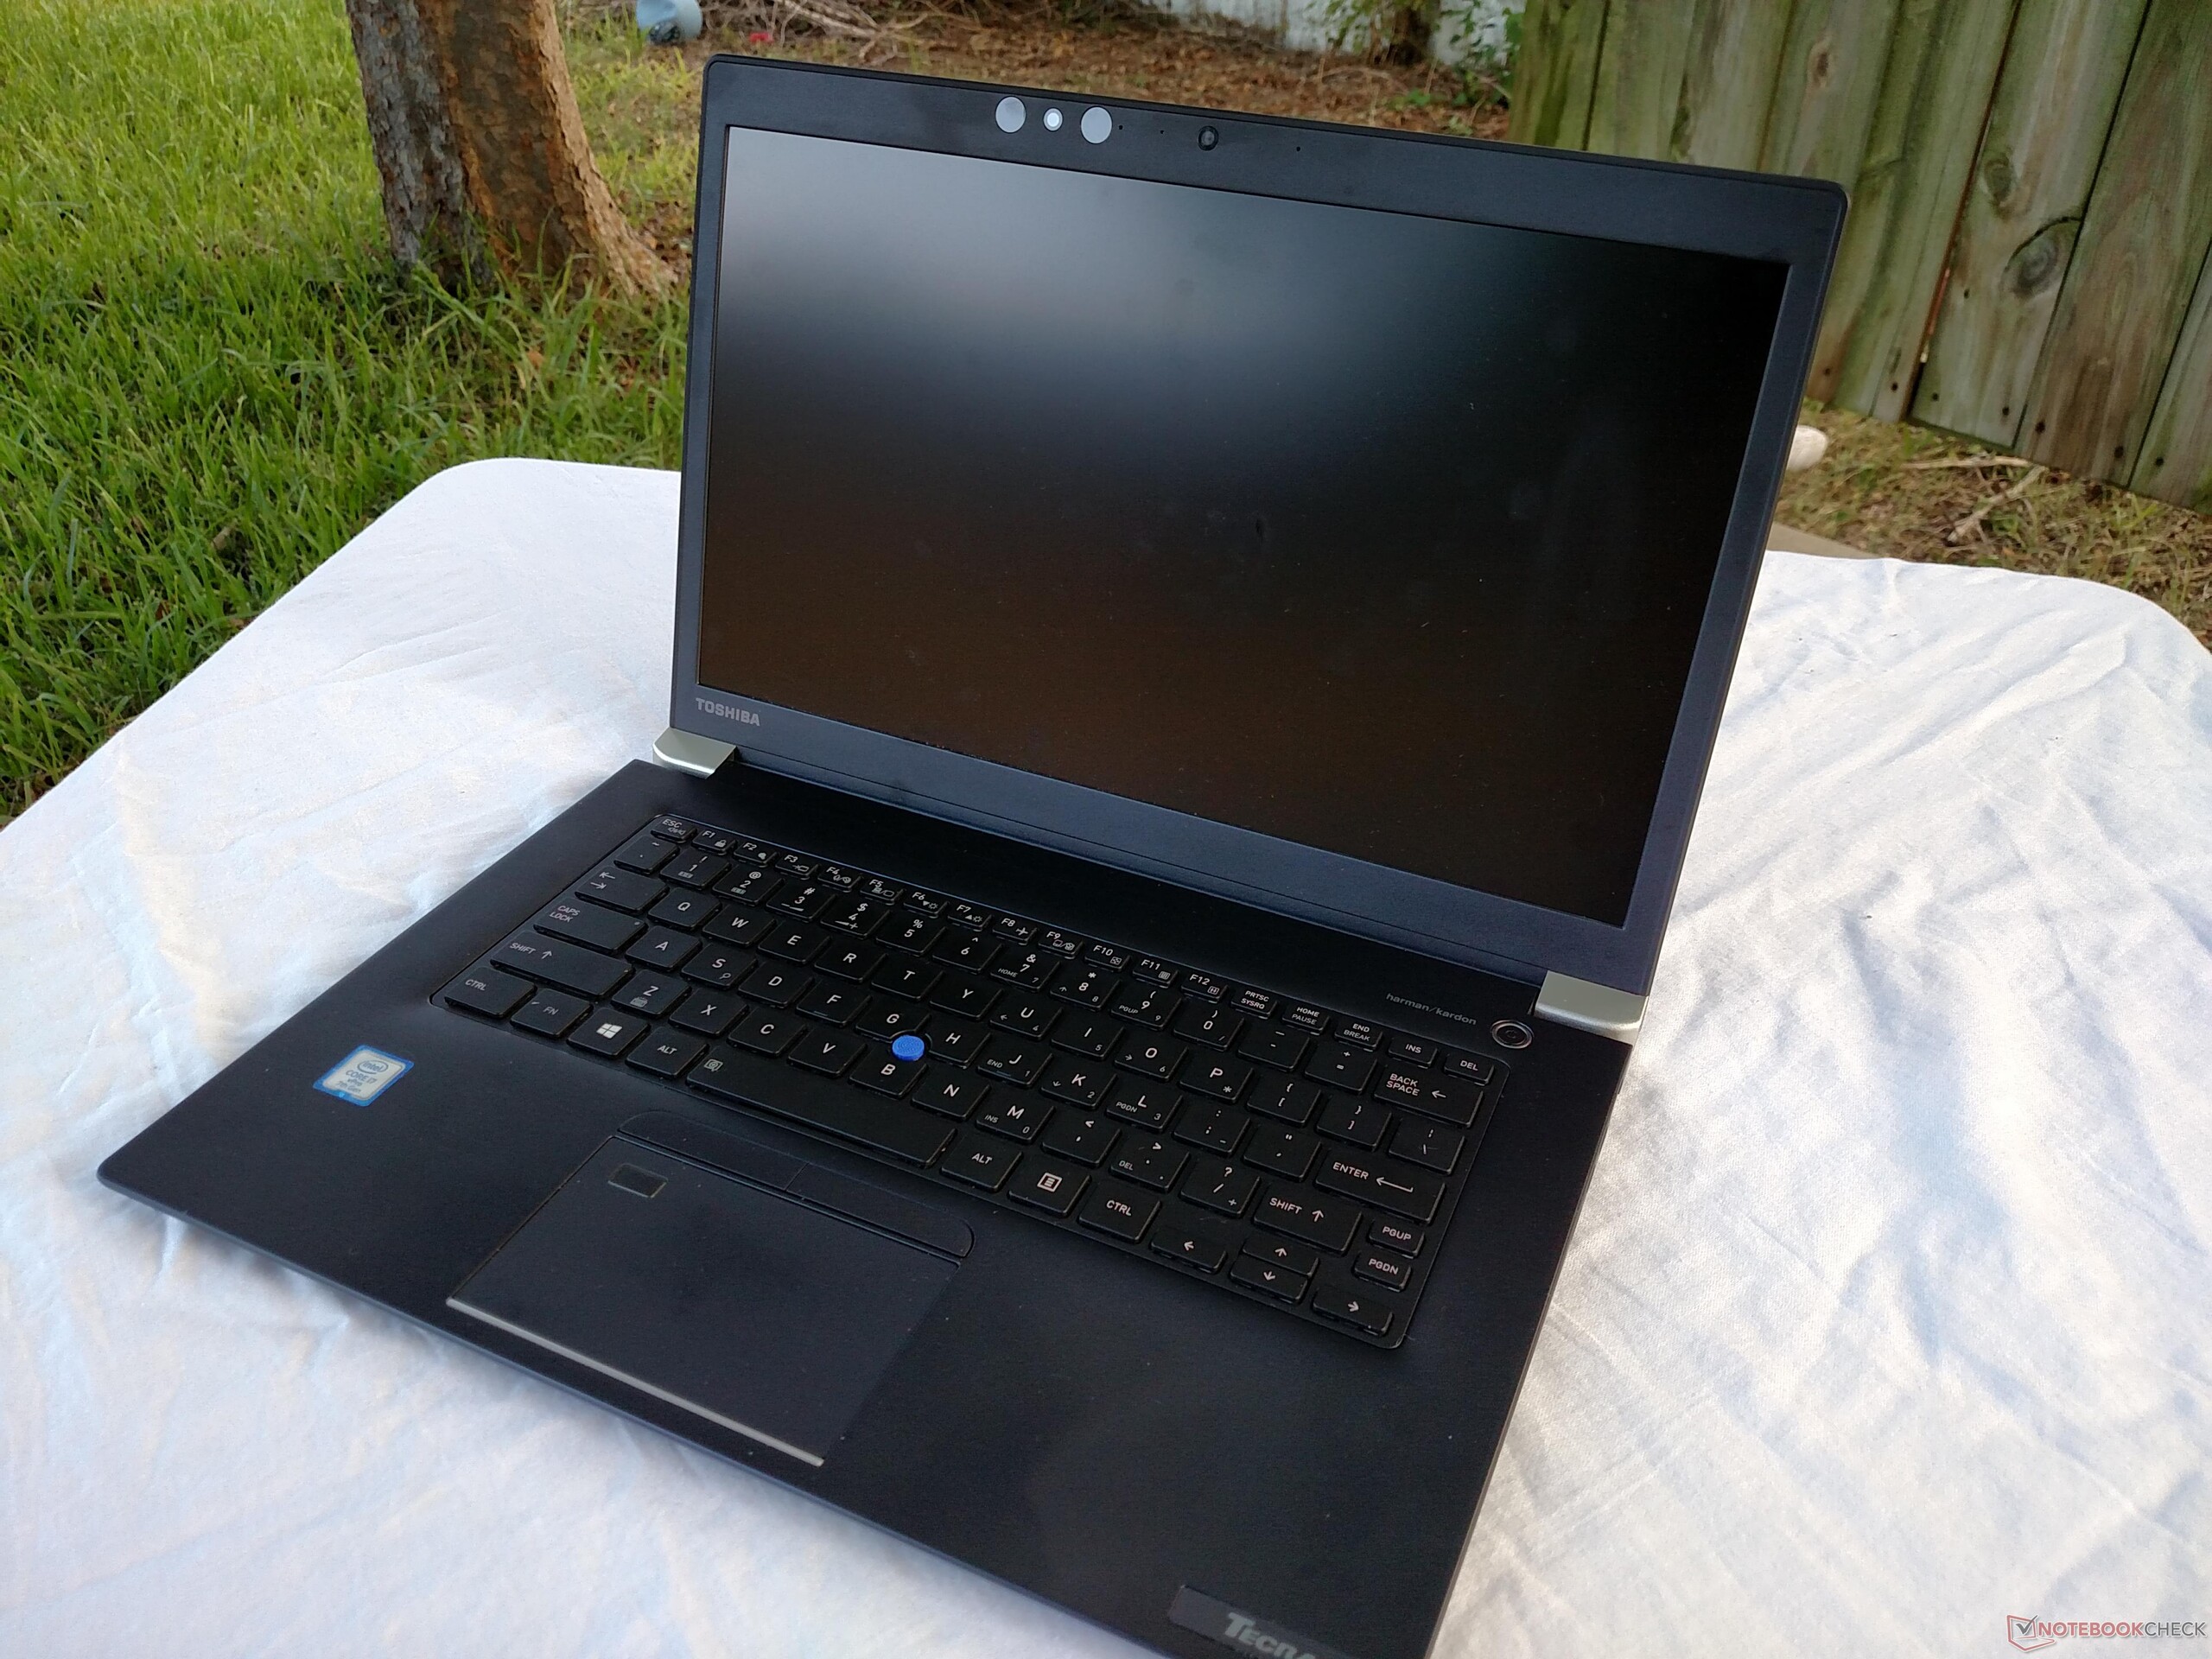
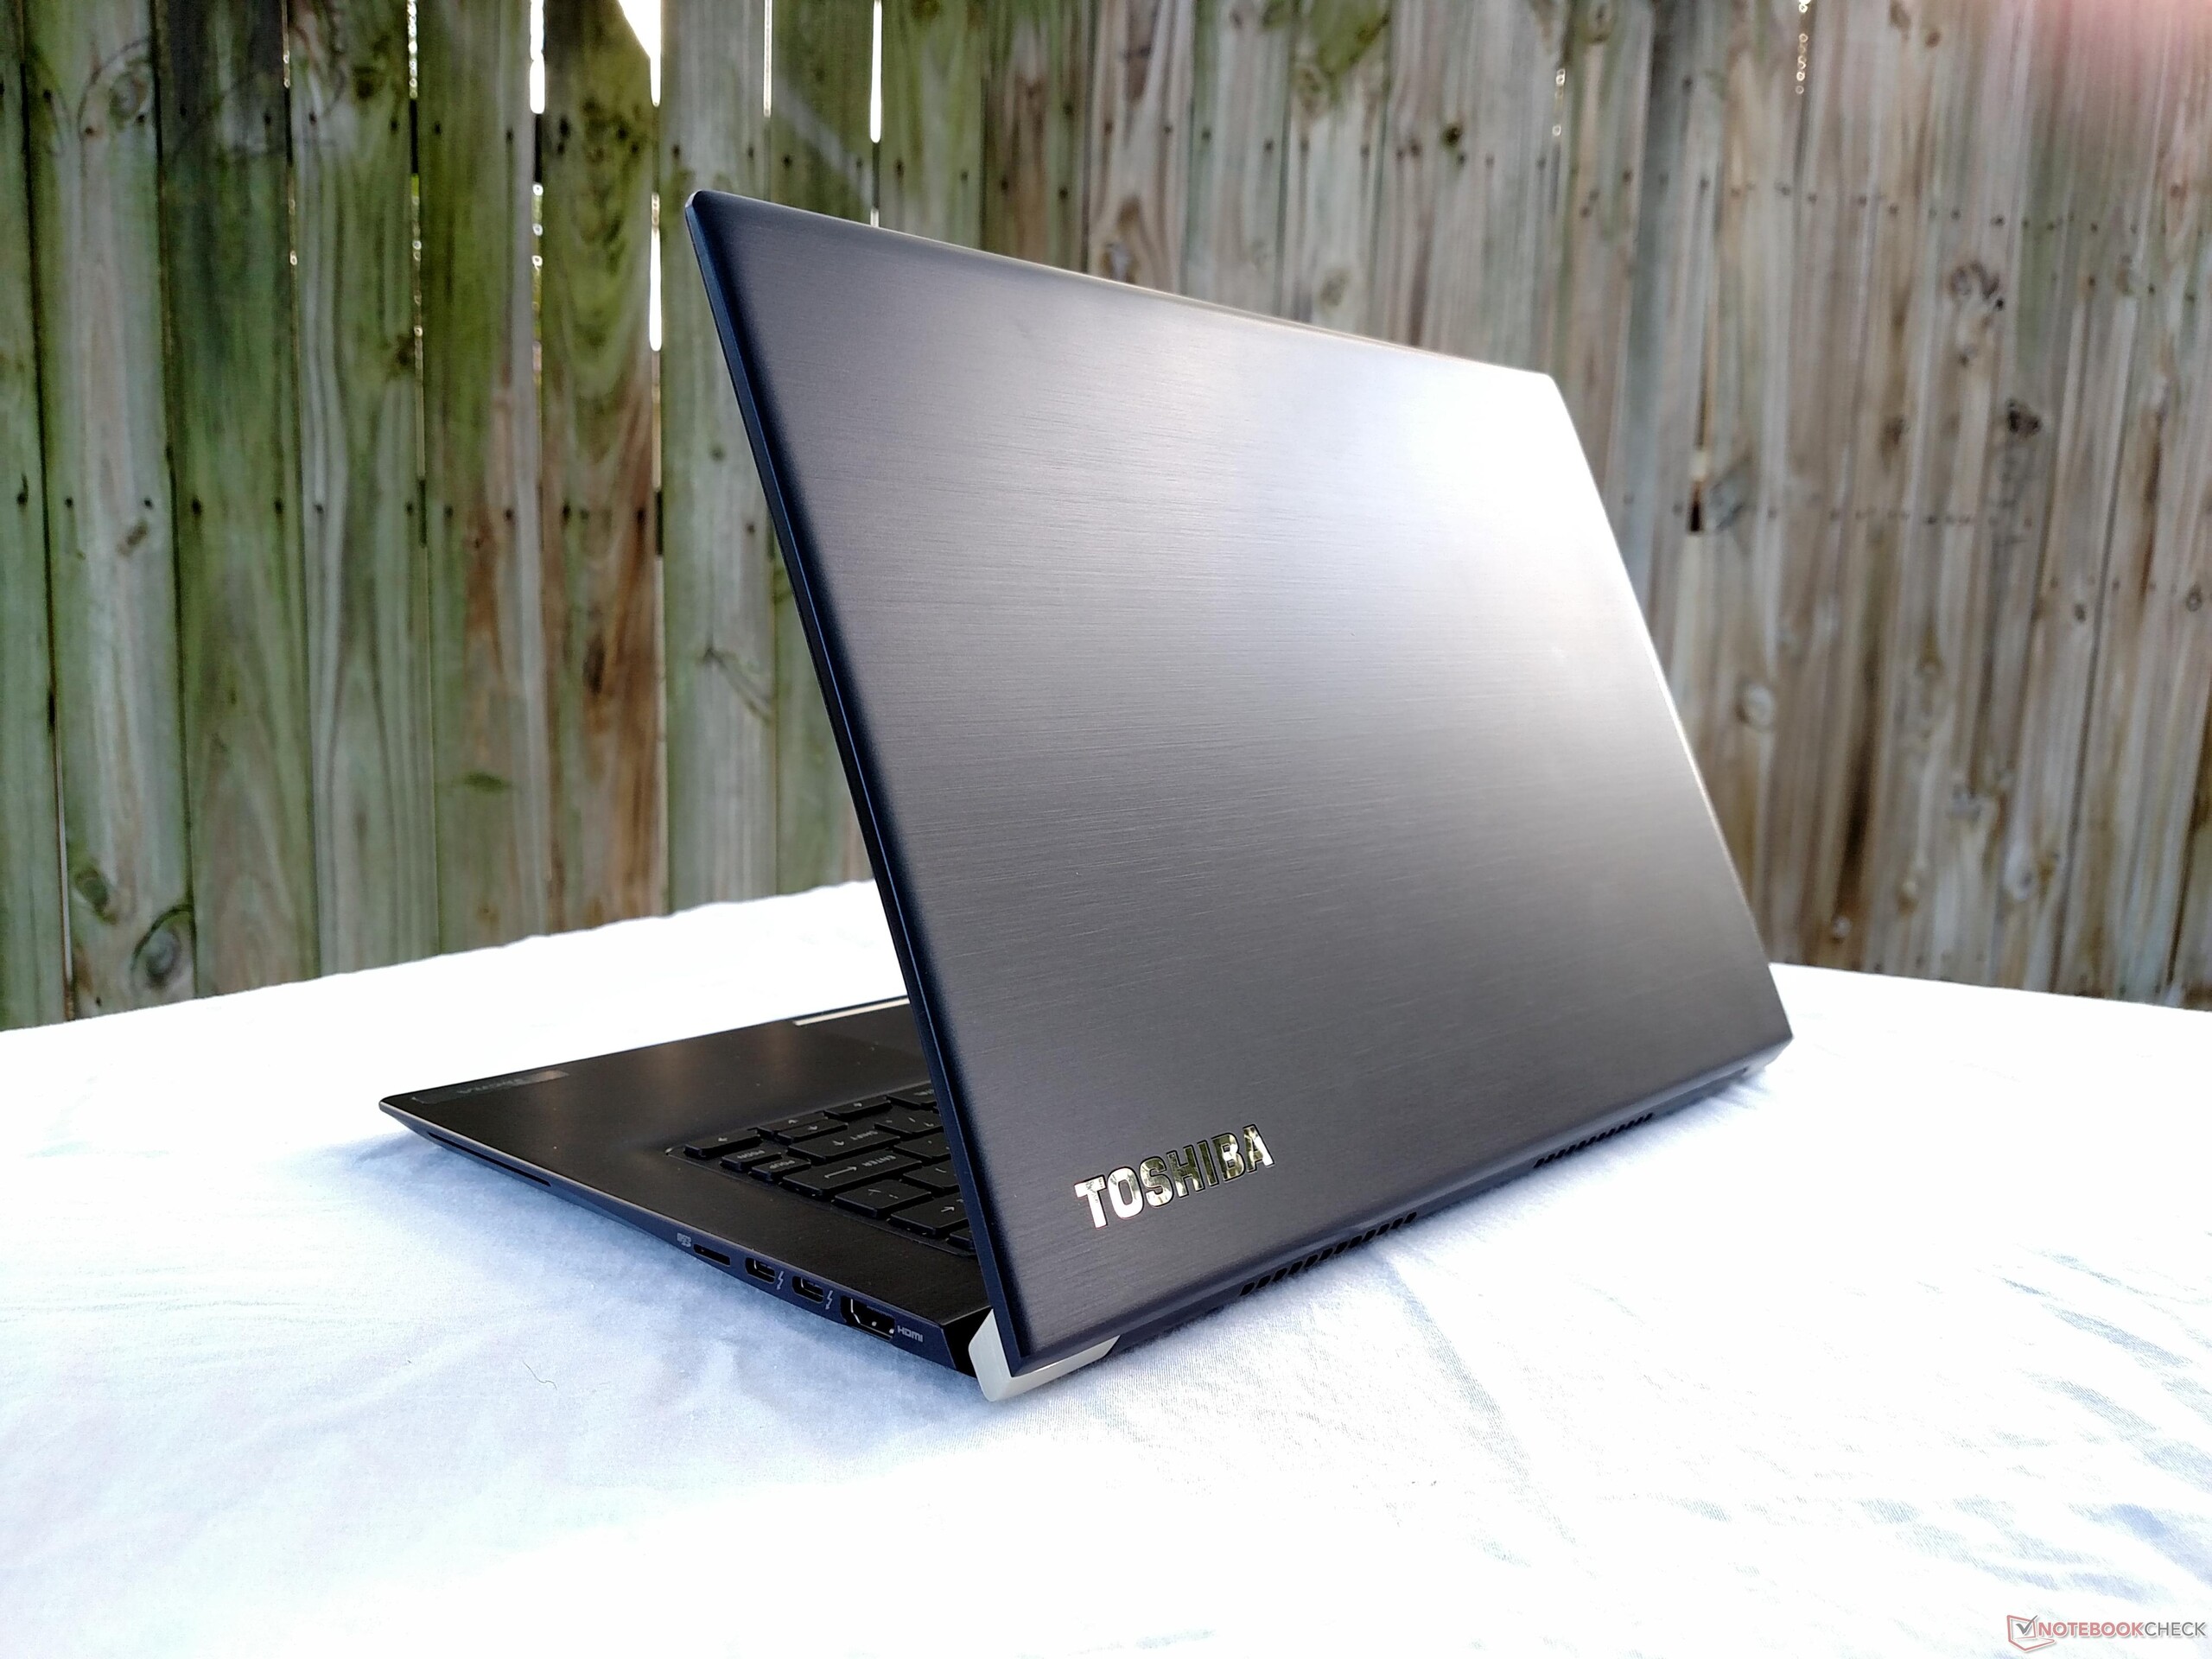
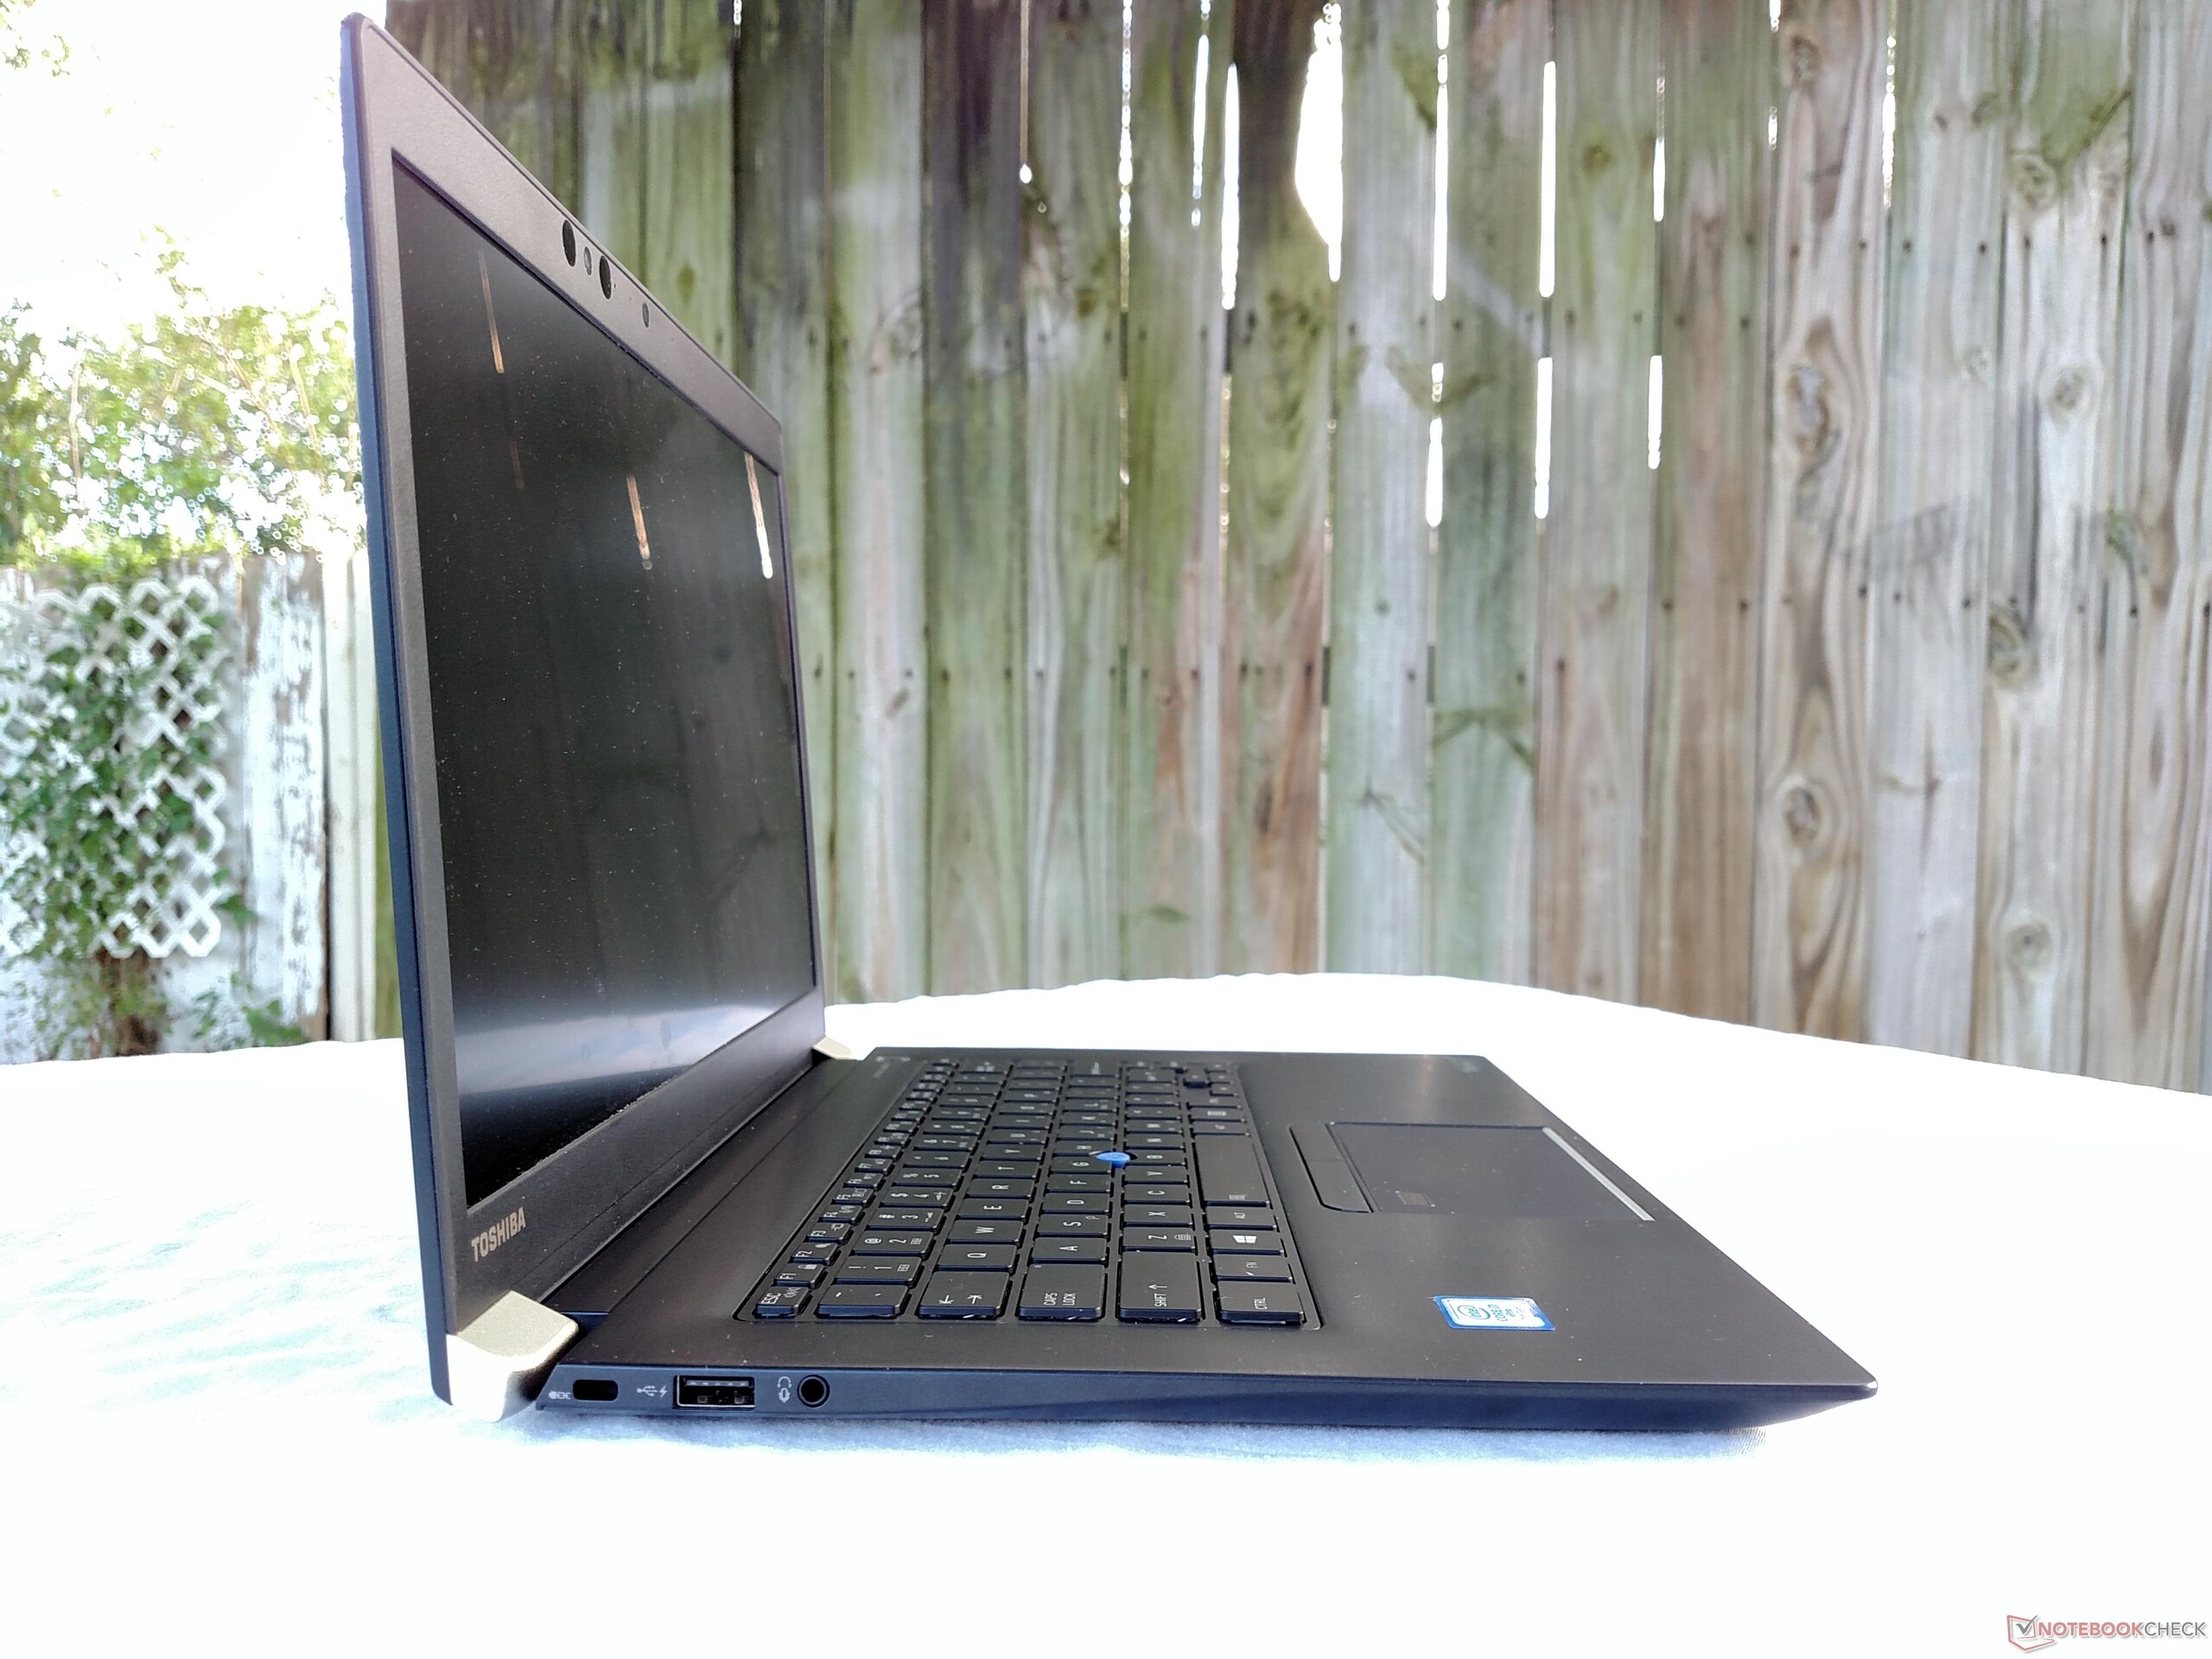
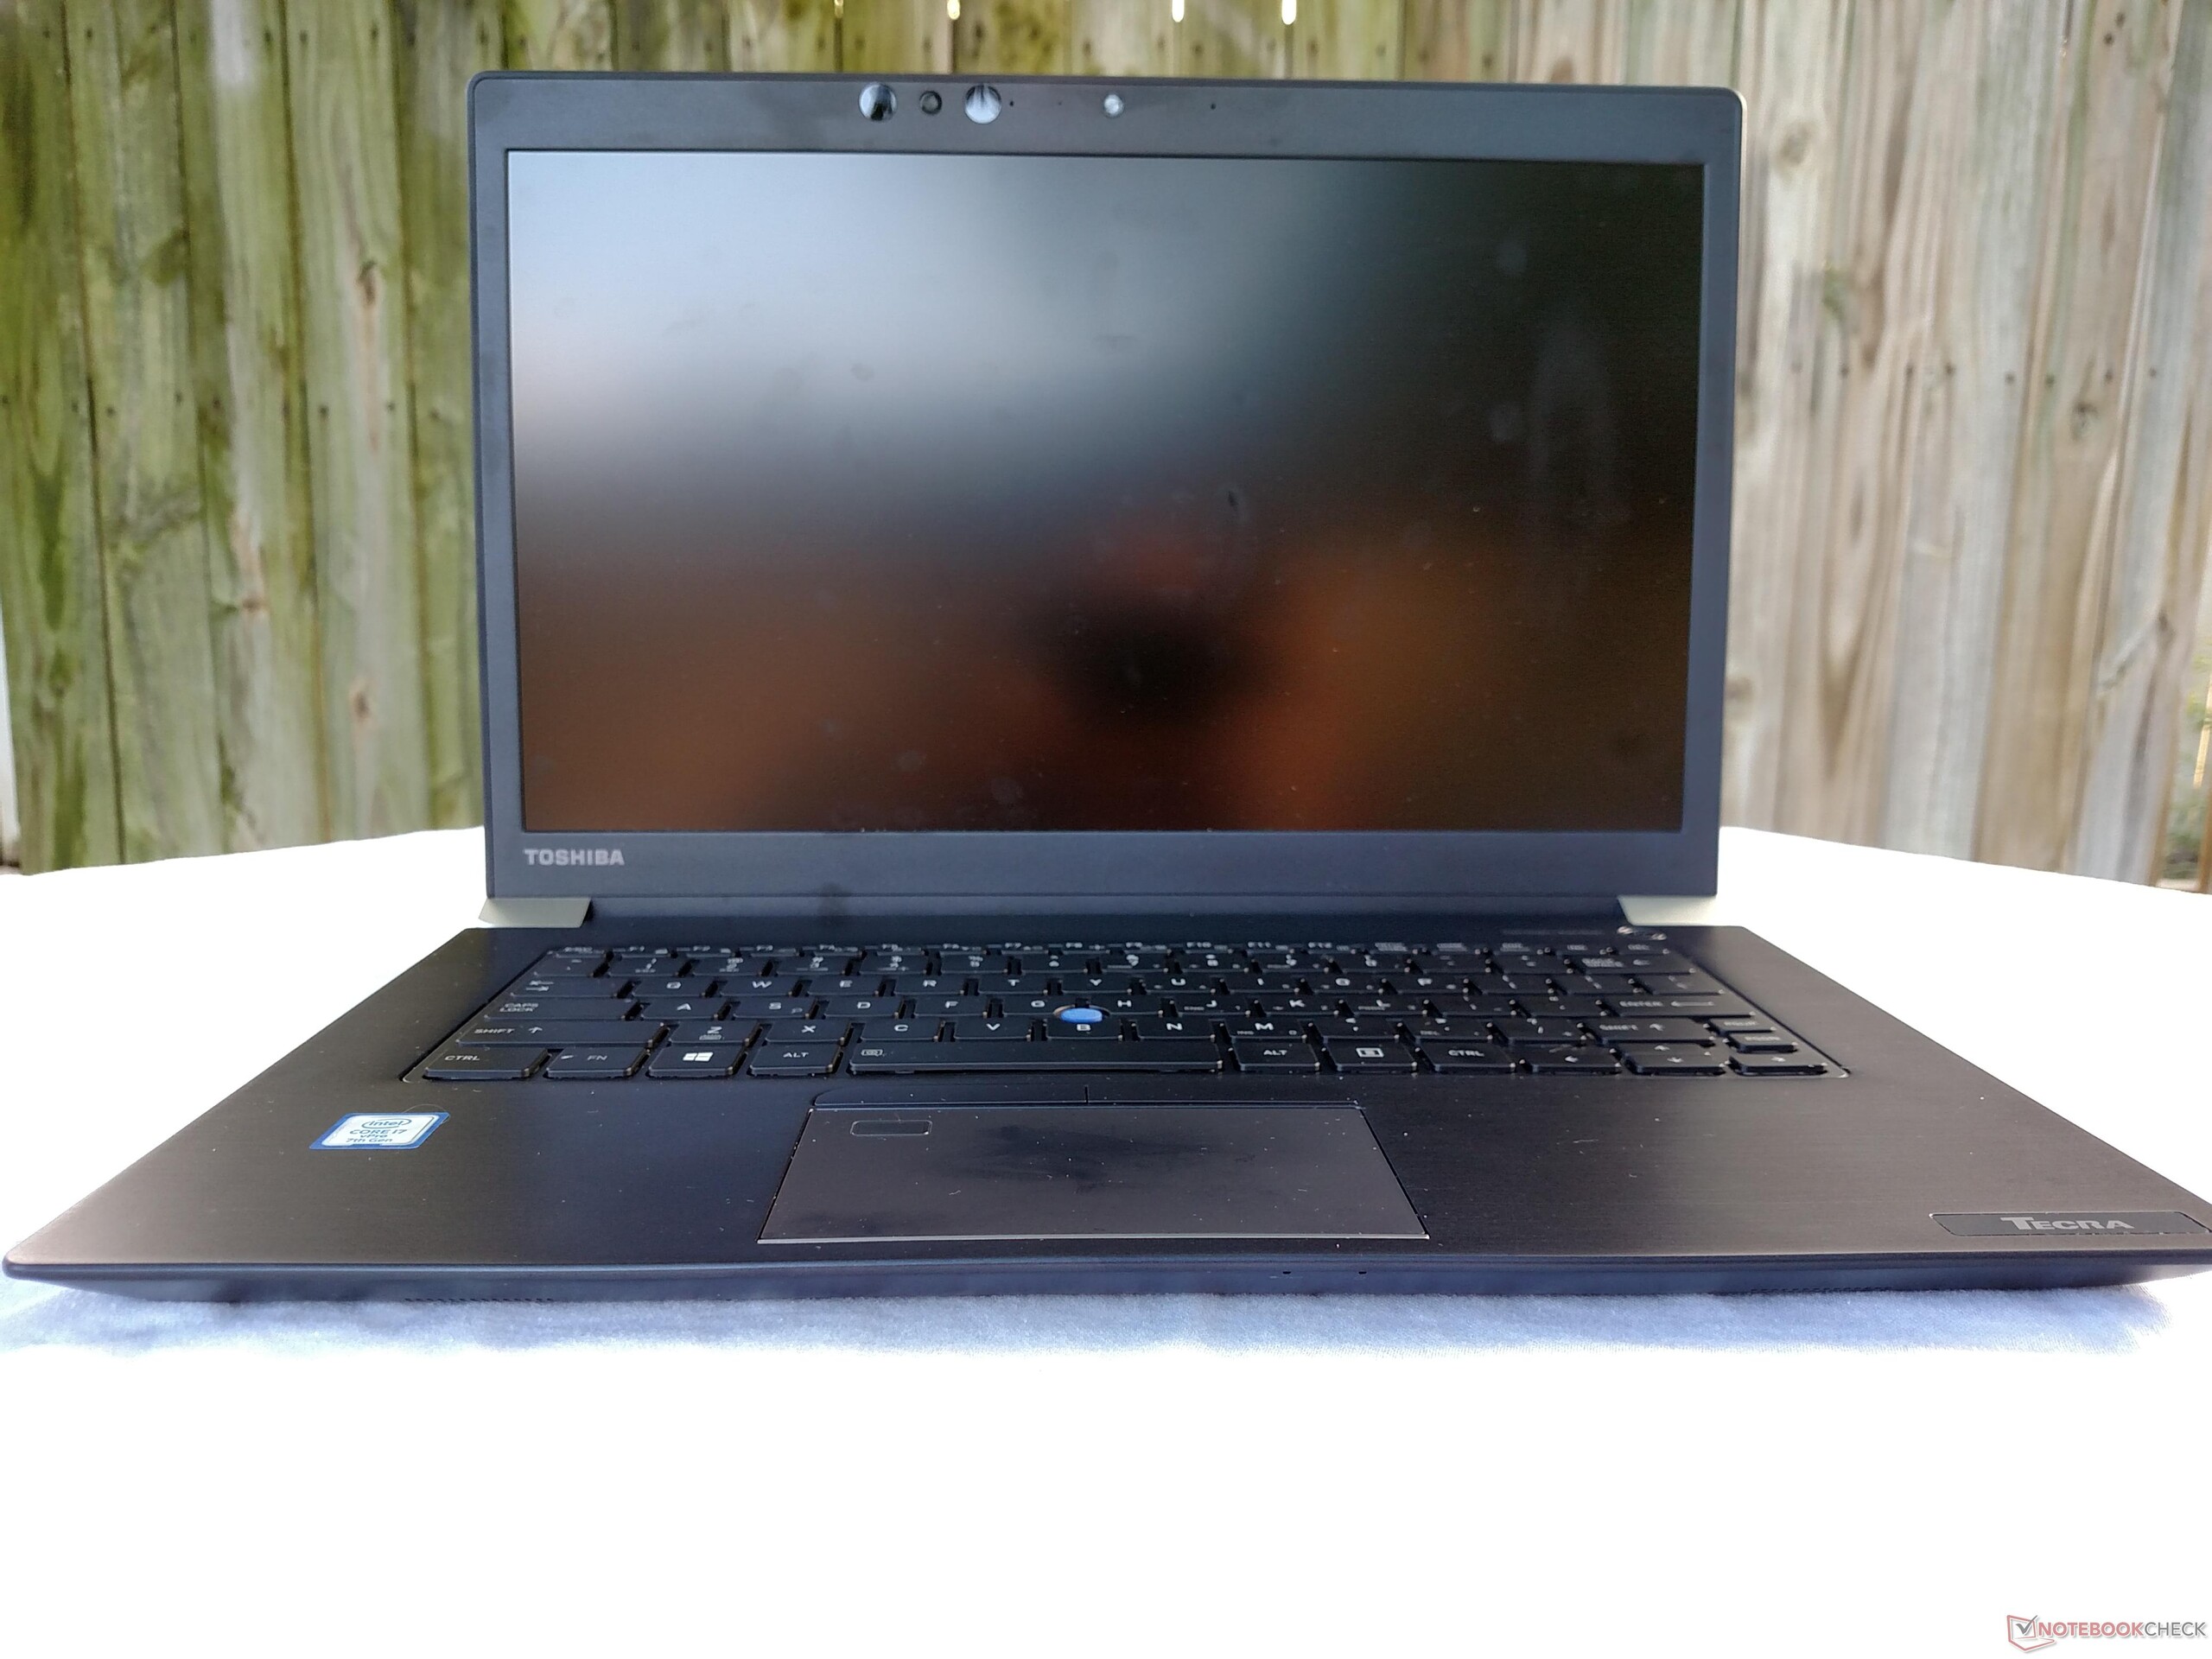
O Toshiba Tecra X40 é essencialmente o Portègè X30 com uma tela de 14 polegadas. Como tal, compartilha muitos dos mesmos pontos fortes e fracos de seu irmão menor. O belo chassi é bem projetado e muito robusto enquanto permanece bastante leve para um portátil de 14 polegadas. Os sensores biométricos são rápidos, confiáveis e fáceis de usar. O SSD do NVMe é incrivelmente rápido e faz um ótimo trabalho ao fazer com que o sistema como um todo se sinta muito receptivo e rápido. Juntamente com Core i7-7600U, o Tecra X40 é uma máquina de escritório rápida em um corpo esbelto e deslumbrante.
No entanto, a tampa se flexiona demais para o conforto e o teclado não é nosso favorito. As teclas ruidosas são distrativas, e a barra espaçadora desenvolveu um hábito desagradável de chiar quando pressionado durante nosso período de teste. A tela também não é tão vibrante ou rica quanto a de outros portáteis empresariais, mas é mais do que aceitável para uso diário.
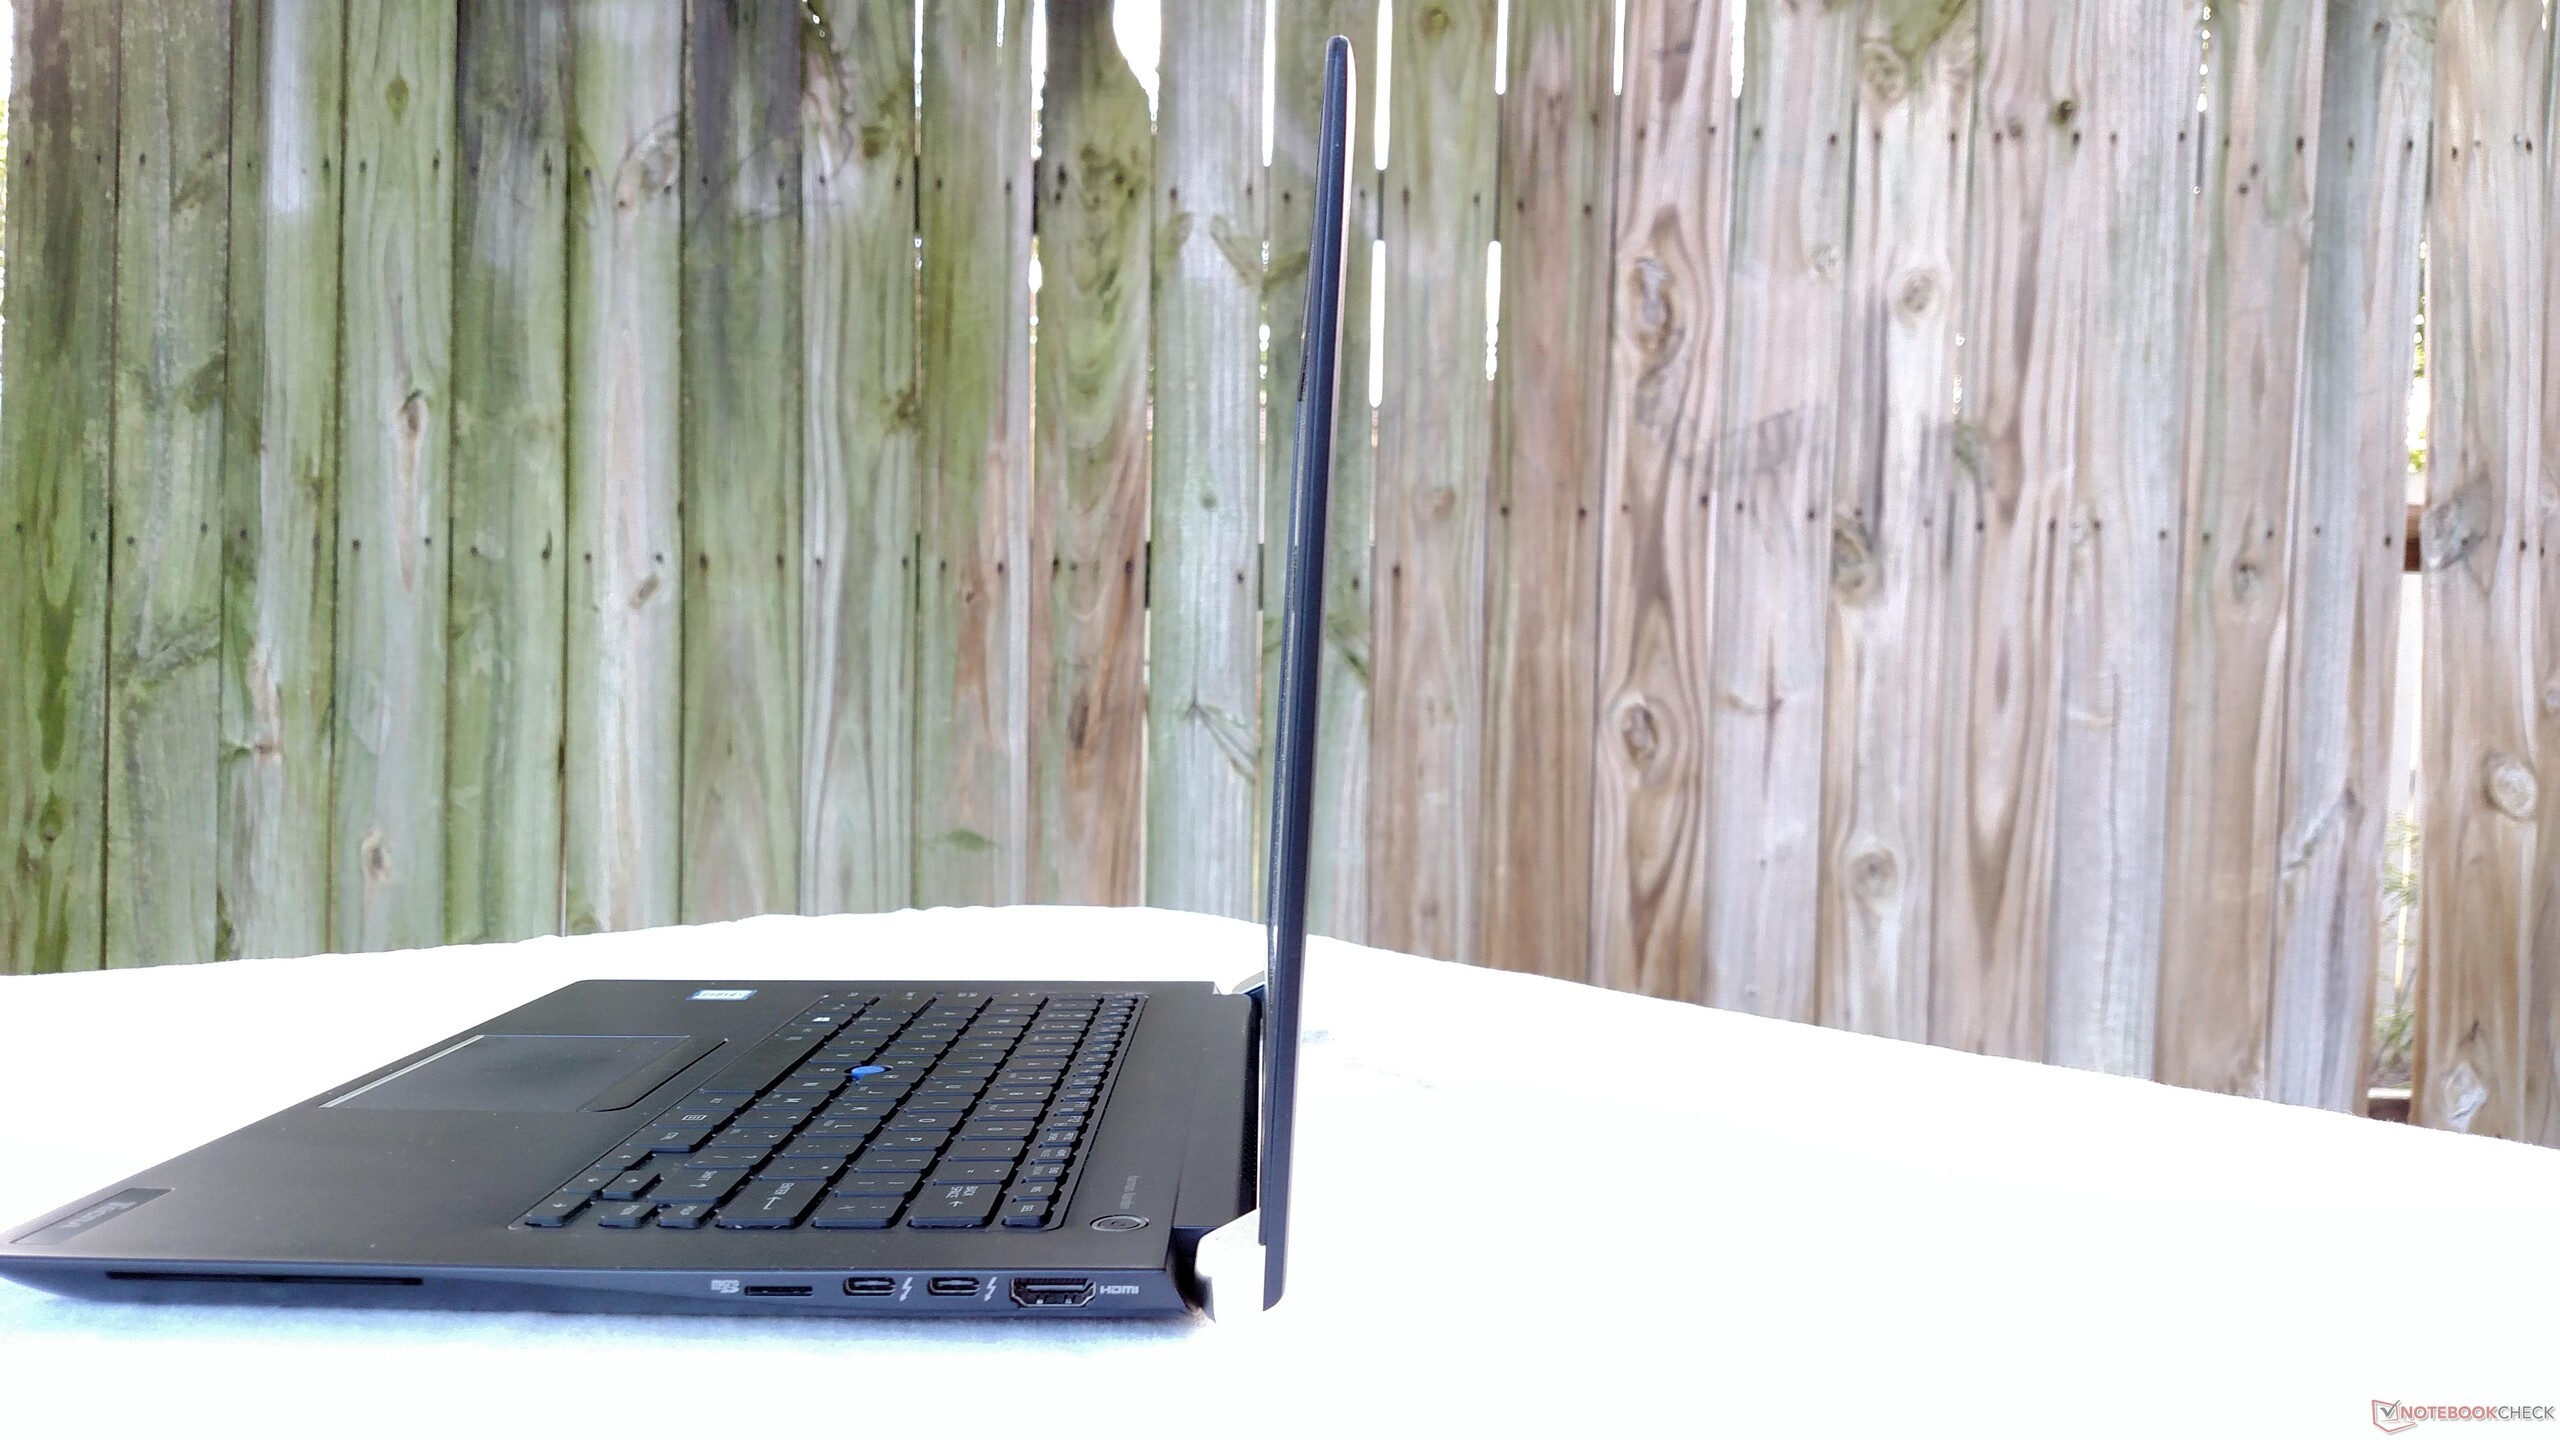
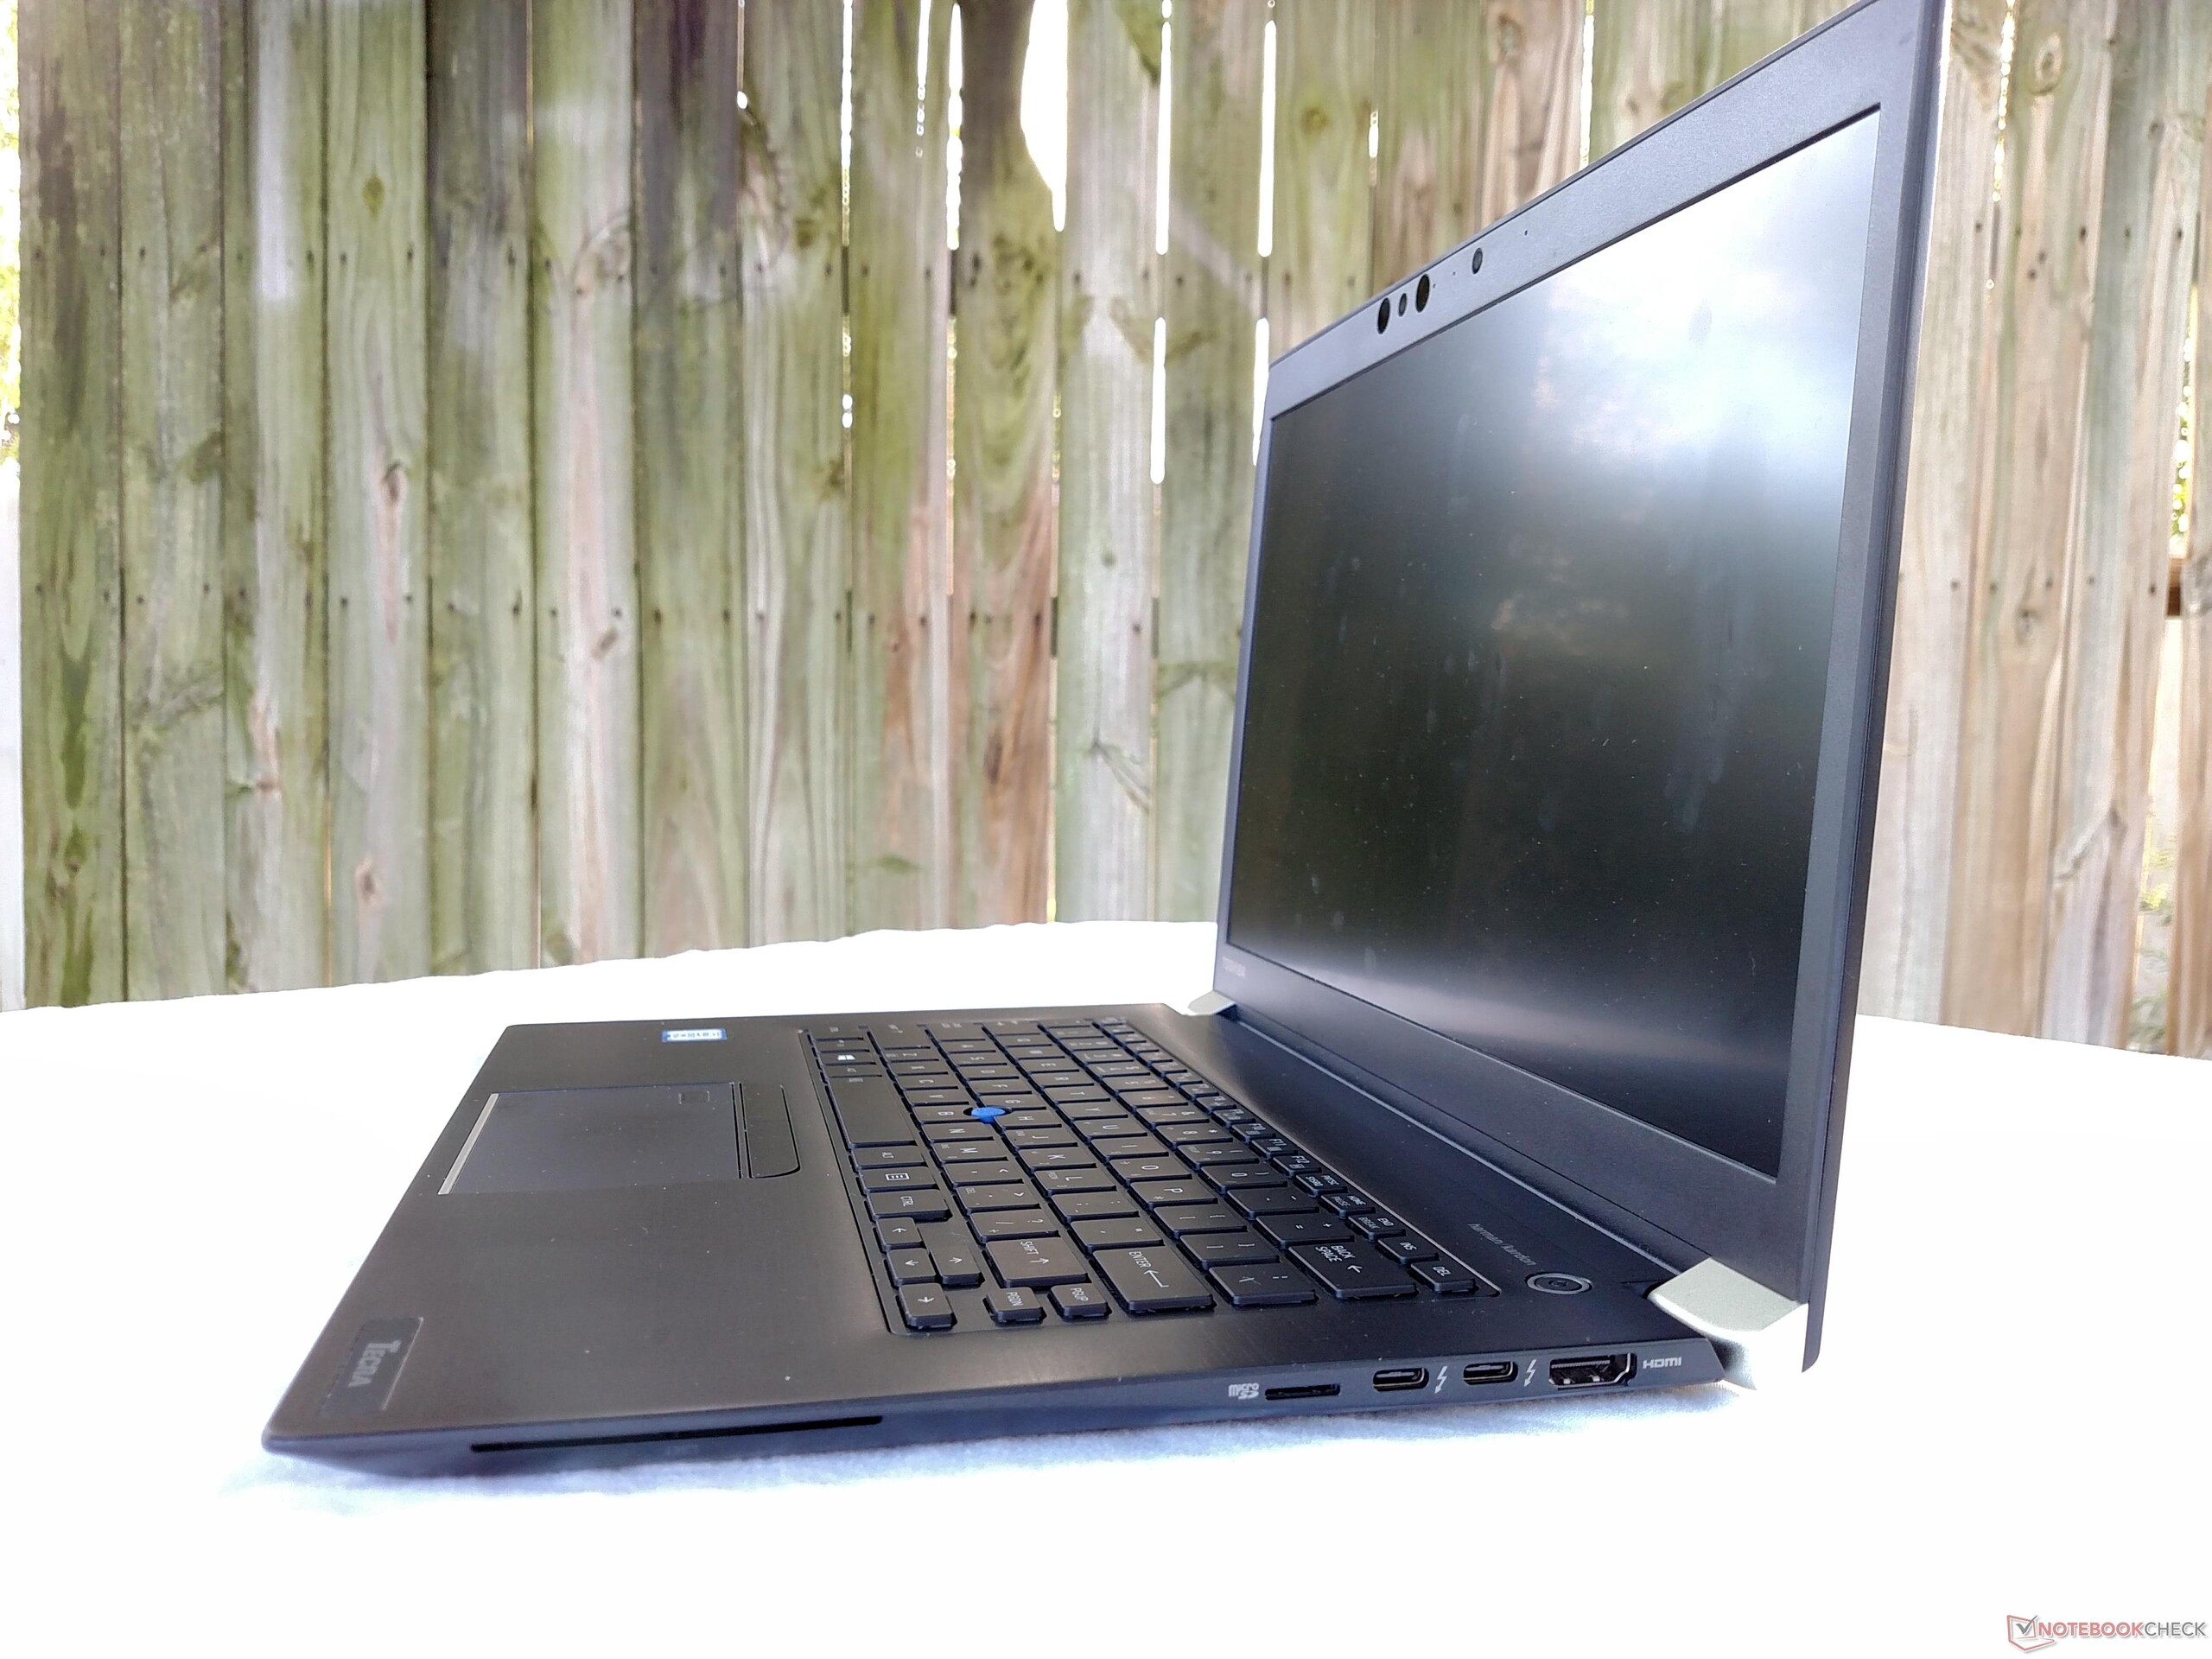
O Toshiba Tecra X40 é um portátil empresarial de tamanho médio competente. Não atinge exatamente o nível do excelente Lenovo X1 Carbono, mas aproxima-se o suficiente para que as compensações possam valer o menor custo. Se os usuários não se importarem em sacrificar alguns portos e podem lidar com um teclado de menor qualidade, definitivamente vale a pena dar uma olhada no Tecra X40. O fato de custar também várias centenas de dólares menos do que o carbono X1, somente adoça o negócio.
Toshiba Tecra X40-D
- 08/28/2017 v6 (old)
Sam Medley
Price comparison
