Breve Análise do Portátil Microsoft Surface (i5-7200U)
| Networking | |
| iperf3 transmit AX12 | |
| Microsoft Surface Book with Performance Base | |
| Dell XPS 13 9360 FHD i5 | |
| Microsoft Surface Laptop i5 | |
| iperf3 receive AX12 | |
| Microsoft Surface Laptop i5 | |
| Dell XPS 13 9360 FHD i5 | |
| Microsoft Surface Book with Performance Base | |
| |||||||||||||||||||||||||
iluminação: 90 %
iluminação com acumulador: 384.1 cd/m²
Contraste: 1067:1 (Preto: 0.36 cd/m²)
ΔE ColorChecker Calman: 1.8 | ∀{0.5-29.43 Ø4.71}
ΔE Greyscale Calman: 1.2 | ∀{0.09-98 Ø4.96}
94.2% sRGB (Argyll 1.6.3 3D)
63.7% AdobeRGB 1998 (Argyll 1.6.3 3D)
69.5% AdobeRGB 1998 (Argyll 3D)
94.3% sRGB (Argyll 3D)
67.8% Display P3 (Argyll 3D)
Gamma: 2.21
CCT: 6708 K
| Microsoft Surface Laptop i5 ID: MEI96A2, Name: Panasonic VVX14T092N00, IPS, 13.5", 2256x1504 | Microsoft Surface Book with Performance Base Panasonic MEI96A2, IPS, 13.5", 3000x2000 | Microsoft Surface Pro 4, Core i5, 128GB Samsung 123YL01-001 ID: SDC3853, IPS, 12.3", 2736x1824 | Apple MacBook Pro 13 2016 (2.9 GHz) APPA033, , 13.3", 2560x1600 | Dell XPS 13 9360 FHD i5 Sharp SHP1449 LQ133M1, IPS, 13.3", 1920x1080 | |
|---|---|---|---|---|---|
| Display | -1% | -2% | 26% | -26% | |
| Display P3 Coverage (%) | 67.8 | 66.4 -2% | 65 -4% | 99.2 46% | 48.94 -28% |
| sRGB Coverage (%) | 94.3 | 95.4 1% | 96.5 2% | 99.9 6% | 73.3 -22% |
| AdobeRGB 1998 Coverage (%) | 69.5 | 67.6 -3% | 67 -4% | 87.6 26% | 50.5 -27% |
| Response Times | -10% | 13% | -18% | 23% | |
| Response Time Grey 50% / Grey 80% * (ms) | 50.8 ? | 61 ? -20% | 46 ? 9% | 47.2 ? 7% | 32.8 ? 35% |
| Response Time Black / White * (ms) | 37.2 ? | 37 ? 1% | 31.2 ? 16% | 53 ? -42% | 33.2 ? 11% |
| PWM Frequency (Hz) | 50 ? | ||||
| Screen | -8% | -32% | 6% | -84% | |
| Brightness middle (cd/m²) | 384.2 | 459 19% | 413 7% | 569 48% | 351.2 -9% |
| Brightness (cd/m²) | 378 | 423 12% | 396 5% | 542 43% | 325 -14% |
| Brightness Distribution (%) | 90 | 86 -4% | 87 -3% | 90 0% | 89 -1% |
| Black Level * (cd/m²) | 0.36 | 0.37 -3% | 0.36 -0% | 0.56 -56% | 0.195 46% |
| Contrast (:1) | 1067 | 1241 16% | 1147 7% | 1016 -5% | 1801 69% |
| Colorchecker dE 2000 * | 1.8 | 2.28 -27% | 3.09 -72% | 1.4 22% | 7.4 -311% |
| Colorchecker dE 2000 max. * | 4.2 | 3.61 14% | 2.9 31% | 9.08 -116% | |
| Greyscale dE 2000 * | 1.2 | 2.48 -107% | 3.92 -227% | 1.8 -50% | 6.71 -459% |
| Gamma | 2.21 100% | 2.5 88% | 2.3 96% | 2.16 102% | 2.74 80% |
| CCT | 6708 97% | 8602 76% | 7333 89% | 6877 95% | 7222 90% |
| Color Space (Percent of AdobeRGB 1998) (%) | 63.7 | 62 -3% | 61 -4% | 78.4 23% | 50.48 -21% |
| Color Space (Percent of sRGB) (%) | 94.2 | 96 2% | 97 3% | 99.3 5% | 73.31 -22% |
| Média Total (Programa/Configurações) | -6% /
-7% | -7% /
-19% | 5% /
7% | -29% /
-58% |
* ... menor é melhor
Exibir tempos de resposta
| ↔ Tempo de resposta preto para branco | ||
|---|---|---|
| 37.2 ms ... ascensão ↗ e queda ↘ combinadas | ↗ 20 ms ascensão | 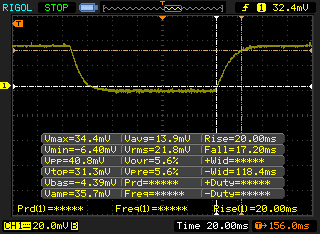 |
| ↘ 17.2 ms queda | ||
| A tela mostra taxas de resposta lentas em nossos testes e será insatisfatória para os jogadores. Em comparação, todos os dispositivos testados variam de 0.1 (mínimo) a 240 (máximo) ms. » 95 % de todos os dispositivos são melhores. Isso significa que o tempo de resposta medido é pior que a média de todos os dispositivos testados (19.8 ms). | ||
| ↔ Tempo de resposta 50% cinza a 80% cinza | ||
| 50.8 ms ... ascensão ↗ e queda ↘ combinadas | ↗ 25.6 ms ascensão | 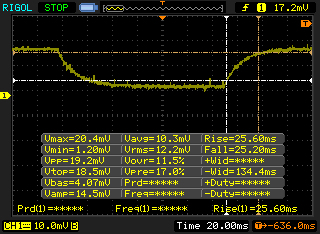 |
| ↘ 25.2 ms queda | ||
| A tela mostra taxas de resposta lentas em nossos testes e será insatisfatória para os jogadores. Em comparação, todos os dispositivos testados variam de 0.165 (mínimo) a 636 (máximo) ms. » 87 % de todos os dispositivos são melhores. Isso significa que o tempo de resposta medido é pior que a média de todos os dispositivos testados (31 ms). | ||
Cintilação da tela / PWM (modulação por largura de pulso)
| Tela tremeluzindo / PWM não detectado | 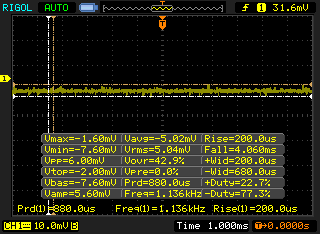 | ||
[pwm_comparison] Em comparação: 52 % de todos os dispositivos testados não usam PWM para escurecer a tela. Se PWM foi detectado, uma média de 7757 (mínimo: 5 - máximo: 343500) Hz foi medida. | |||
| wPrime 2.10 - 1024m | |
| Microsoft Surface Pro 4, Core m3 | |
| Lenovo Thinkpad 13-20J1001BUS | |
| Apple MacBook Pro 13 2016 | |
| Dell Latitude 5280 | |
| Microsoft Surface Laptop i5 | |
| Samsung Notebook 9 NP900X5N-X01US | |
* ... menor é melhor
| PCMark 8 | |
| Home Score Accelerated v2 | |
| Apple MacBook Pro 13 2016 | |
| Microsoft Surface Laptop i5 | |
| Microsoft Surface Book with Performance Base | |
| Work Score Accelerated v2 | |
| Microsoft Surface Laptop i5 | |
| Microsoft Surface Book with Performance Base | |
| Apple MacBook Pro 13 2016 | |
| Creative Score Accelerated v2 | |
| Apple MacBook Pro 13 2016 | |
| Microsoft Surface Book with Performance Base | |
| Microsoft Surface Laptop i5 | |
| PCMark 8 Home Score Accelerated v2 | 3071 pontos | |
| PCMark 8 Creative Score Accelerated v2 | 3962 pontos | |
| PCMark 8 Work Score Accelerated v2 | 4106 pontos | |
Ajuda | ||
| Microsoft Surface Laptop i5 Toshiba THNSN0128GTYA | Microsoft Surface Book with Performance Base Toshiba NVMe THNSN5256GPU7 | Microsoft Surface Pro 4, Core i5, 128GB Samsung MZFLV128 NVMe | Apple MacBook Pro 13 2016 (2.9 GHz) Apple SSD AP0256 | Dell XPS 13 9360 FHD i5 Toshiba NVMe THNSN5256GPUK | |
|---|---|---|---|---|---|
| CrystalDiskMark 3.0 | 328% | 115% | 527% | 294% | |
| Read Seq (MB/s) | 425.6 | 1017 139% | 666 56% | 1662 291% | 1233 190% |
| Write Seq (MB/s) | 128.2 | 861 572% | 154.2 20% | 1336 942% | 733 472% |
| Read 512 (MB/s) | 278.5 | 687 147% | 266.3 -4% | 1183 325% | 1036 272% |
| Write 512 (MB/s) | 126.7 | 698 451% | 154.2 22% | 1481 1069% | 439.9 247% |
| Read 4k (MB/s) | 22.15 | 40.91 85% | 28.51 29% | 16.1 -27% | 29.31 32% |
| Write 4k (MB/s) | 40.45 | 108.6 168% | 101.5 151% | 23.5 -42% | 116.9 189% |
| Read 4k QD32 (MB/s) | 77.8 | 326.9 320% | 368.3 373% | 657 744% | 479.2 516% |
| Write 4k QD32 (MB/s) | 41.18 | 347.1 743% | 153.6 273% | 419 917% | 218.3 430% |

| 3DMark 11 Performance | 1586 pontos | |
| 3DMark Ice Storm Standard Score | 48984 pontos | |
| 3DMark Cloud Gate Standard Score | 5454 pontos | |
| 3DMark Fire Strike Score | 743 pontos | |
Ajuda | ||
| baixo | média | alto | ultra | |
|---|---|---|---|---|
| BioShock Infinite (2013) | 45.8 | 27.4 | 22.7 | 7 |
| Rise of the Tomb Raider (2016) | 18.5 |
Barulho
| Ocioso |
| 28.2 / 28.2 / 29 dB |
| Carga |
| 30.3 / 39.3 dB |
 | ||
30 dB silencioso 40 dB(A) audível 50 dB(A) ruidosamente alto |
||
min: | ||
| Microsoft Surface Laptop i5 HD Graphics 620, i5-7200U, Toshiba THNSN0128GTYA | Microsoft Surface Book with Performance Base GeForce GTX 965M, 6600U, Toshiba NVMe THNSN5256GPU7 | Microsoft Surface Pro 4, Core i5, 128GB HD Graphics 520, 6300U, Samsung MZFLV128 NVMe | Apple MacBook Pro 13 2016 (2.9 GHz) Iris Graphics 550, 6267U, Apple SSD AP0256 | Dell XPS 13 9360 FHD i5 HD Graphics 620, i5-7200U, Toshiba NVMe THNSN5256GPUK | |
|---|---|---|---|---|---|
| Noise | -8% | -14% | -4% | 2% | |
| desligado / ambiente * (dB) | 28.2 | 29.4 -4% | 30.2 -7% | ||
| Idle Minimum * (dB) | 28.2 | 29.4 -4% | 31.5 -12% | 30.2 -7% | 28.9 -2% |
| Idle Average * (dB) | 28.2 | 29.4 -4% | 31.5 -12% | 30.2 -7% | 28.9 -2% |
| Idle Maximum * (dB) | 29 | 29.7 -2% | 31.5 -9% | 30.2 -4% | 28.9 -0% |
| Load Average * (dB) | 30.3 | 39 -29% | 40.5 -34% | 33 -9% | 30.9 -2% |
| Load Maximum * (dB) | 39.3 | 40.2 -2% | 40.7 -4% | 36.2 8% | 33.5 15% |
| Witcher 3 ultra * (dB) | 39.5 |
* ... menor é melhor
(+) A temperatura máxima no lado superior é 36.4 °C / 98 F, em comparação com a média de 35.9 °C / 97 F , variando de 21.4 a 59 °C para a classe Subnotebook.
(-) A parte inferior aquece até um máximo de 45.2 °C / 113 F, em comparação com a média de 39.2 °C / 103 F
(+) Em uso inativo, a temperatura média para o lado superior é 26.7 °C / 80 F, em comparação com a média do dispositivo de 30.8 °C / ### class_avg_f### F.
(+) Os apoios para as mãos e o touchpad são mais frios que a temperatura da pele, com um máximo de 26.4 °C / 79.5 F e, portanto, são frios ao toque.
(±) A temperatura média da área do apoio para as mãos de dispositivos semelhantes foi 28.2 °C / 82.8 F (+1.8 °C / 3.3 F).
Microsoft Surface Laptop i5 análise de áudio
(-) | alto-falantes não muito altos (###valor### dB)
Graves 100 - 315Hz
(±) | graves reduzidos - em média 7.1% menor que a mediana
(±) | a linearidade dos graves é média (11.8% delta para a frequência anterior)
Médios 400 - 2.000 Hz
(+) | médios equilibrados - apenas 4.1% longe da mediana
(+) | médios são lineares (5.6% delta para frequência anterior)
Altos 2 - 16 kHz
(+) | agudos equilibrados - apenas 1.2% longe da mediana
(+) | os máximos são lineares (4.7% delta da frequência anterior)
Geral 100 - 16.000 Hz
(±) | a linearidade do som geral é média (15.6% diferença em relação à mediana)
Comparado com a mesma classe
» 36% de todos os dispositivos testados nesta classe foram melhores, 5% semelhantes, 58% piores
» O melhor teve um delta de 5%, a média foi 18%, o pior foi 53%
Comparado com todos os dispositivos testados
» 23% de todos os dispositivos testados foram melhores, 5% semelhantes, 72% piores
» O melhor teve um delta de 4%, a média foi 23%, o pior foi 134%
Apple MacBook 12 (Early 2016) 1.1 GHz análise de áudio
(+) | os alto-falantes podem tocar relativamente alto (###valor### dB)
Graves 100 - 315Hz
(±) | graves reduzidos - em média 11.3% menor que a mediana
(±) | a linearidade dos graves é média (14.2% delta para a frequência anterior)
Médios 400 - 2.000 Hz
(+) | médios equilibrados - apenas 2.4% longe da mediana
(+) | médios são lineares (5.5% delta para frequência anterior)
Altos 2 - 16 kHz
(+) | agudos equilibrados - apenas 2% longe da mediana
(+) | os máximos são lineares (4.5% delta da frequência anterior)
Geral 100 - 16.000 Hz
(+) | o som geral é linear (10.2% diferença em relação à mediana)
Comparado com a mesma classe
» 7% de todos os dispositivos testados nesta classe foram melhores, 2% semelhantes, 90% piores
» O melhor teve um delta de 5%, a média foi 18%, o pior foi 53%
Comparado com todos os dispositivos testados
» 5% de todos os dispositivos testados foram melhores, 1% semelhantes, 94% piores
» O melhor teve um delta de 4%, a média foi 23%, o pior foi 134%
| desligado | |
| Ocioso | |
| Carga |
|
Key:
min: | |
| Microsoft Surface Laptop i5 i5-7200U, HD Graphics 620, Toshiba THNSN0128GTYA, IPS, 2256x1504, 13.5" | Microsoft Surface Book with Performance Base 6600U, GeForce GTX 965M, Toshiba NVMe THNSN5256GPU7, IPS, 3000x2000, 13.5" | Microsoft Surface Pro 4, Core i5, 128GB 6300U, HD Graphics 520, Samsung MZFLV128 NVMe, IPS, 2736x1824, 12.3" | Apple MacBook Pro 13 2016 (2.9 GHz) 6267U, Iris Graphics 550, Apple SSD AP0256, , 2560x1600, 13.3" | Dell XPS 13 9360 FHD i5 i5-7200U, HD Graphics 620, Toshiba NVMe THNSN5256GPUK, IPS, 1920x1080, 13.3" | |
|---|---|---|---|---|---|
| Power Consumption | -75% | -12% | -34% | 14% | |
| Idle Minimum * (Watt) | 3.2 | 4.15 -30% | 4.4 -38% | 2.1 34% | 4.1 -28% |
| Idle Average * (Watt) | 6.5 | 8 -23% | 9 -38% | 7.6 -17% | 4.2 35% |
| Idle Maximum * (Watt) | 6.8 | 11.9 -75% | 10.7 -57% | 8.2 -21% | 5.1 25% |
| Load Average * (Watt) | 28.2 | 67 -138% | 19.6 30% | 56.4 -100% | 22.1 22% |
| Load Maximum * (Watt) | 36 | 76 -111% | 19.9 45% | 59.8 -66% | 29.4 18% |
| Witcher 3 ultra * (Watt) | 58 |
* ... menor é melhor
| Microsoft Surface Laptop i5 i5-7200U, HD Graphics 620, 45 Wh | Microsoft Surface Book with Performance Base 6600U, GeForce GTX 965M, 78 Wh | Microsoft Surface Pro 4, Core i5, 128GB 6300U, HD Graphics 520, 38 Wh | Apple MacBook Pro 13 2016 (2.9 GHz) 6267U, Iris Graphics 550, 49.2 Wh | Dell XPS 13 9360 FHD i5 i5-7200U, HD Graphics 620, 60 Wh | Asus Zenbook UX3410UQ-GV077T i7-7500U, GeForce 940MX, 48 Wh | |
|---|---|---|---|---|---|---|
| Duração da bateria | -7% | -24% | -27% | 11% | -15% | |
| Reader / Idle (h) | 22.5 | 25.5 13% | 15 -33% | 21.6 -4% | ||
| WiFi v1.3 (h) | 10 | 9.6 -4% | 7.1 -29% | 9.4 -6% | 11.3 13% | 8.5 -15% |
| Load (h) | 2.1 | 1.5 -29% | 1.9 -10% | 1.1 -48% | 2.6 24% |
Pro
Contra
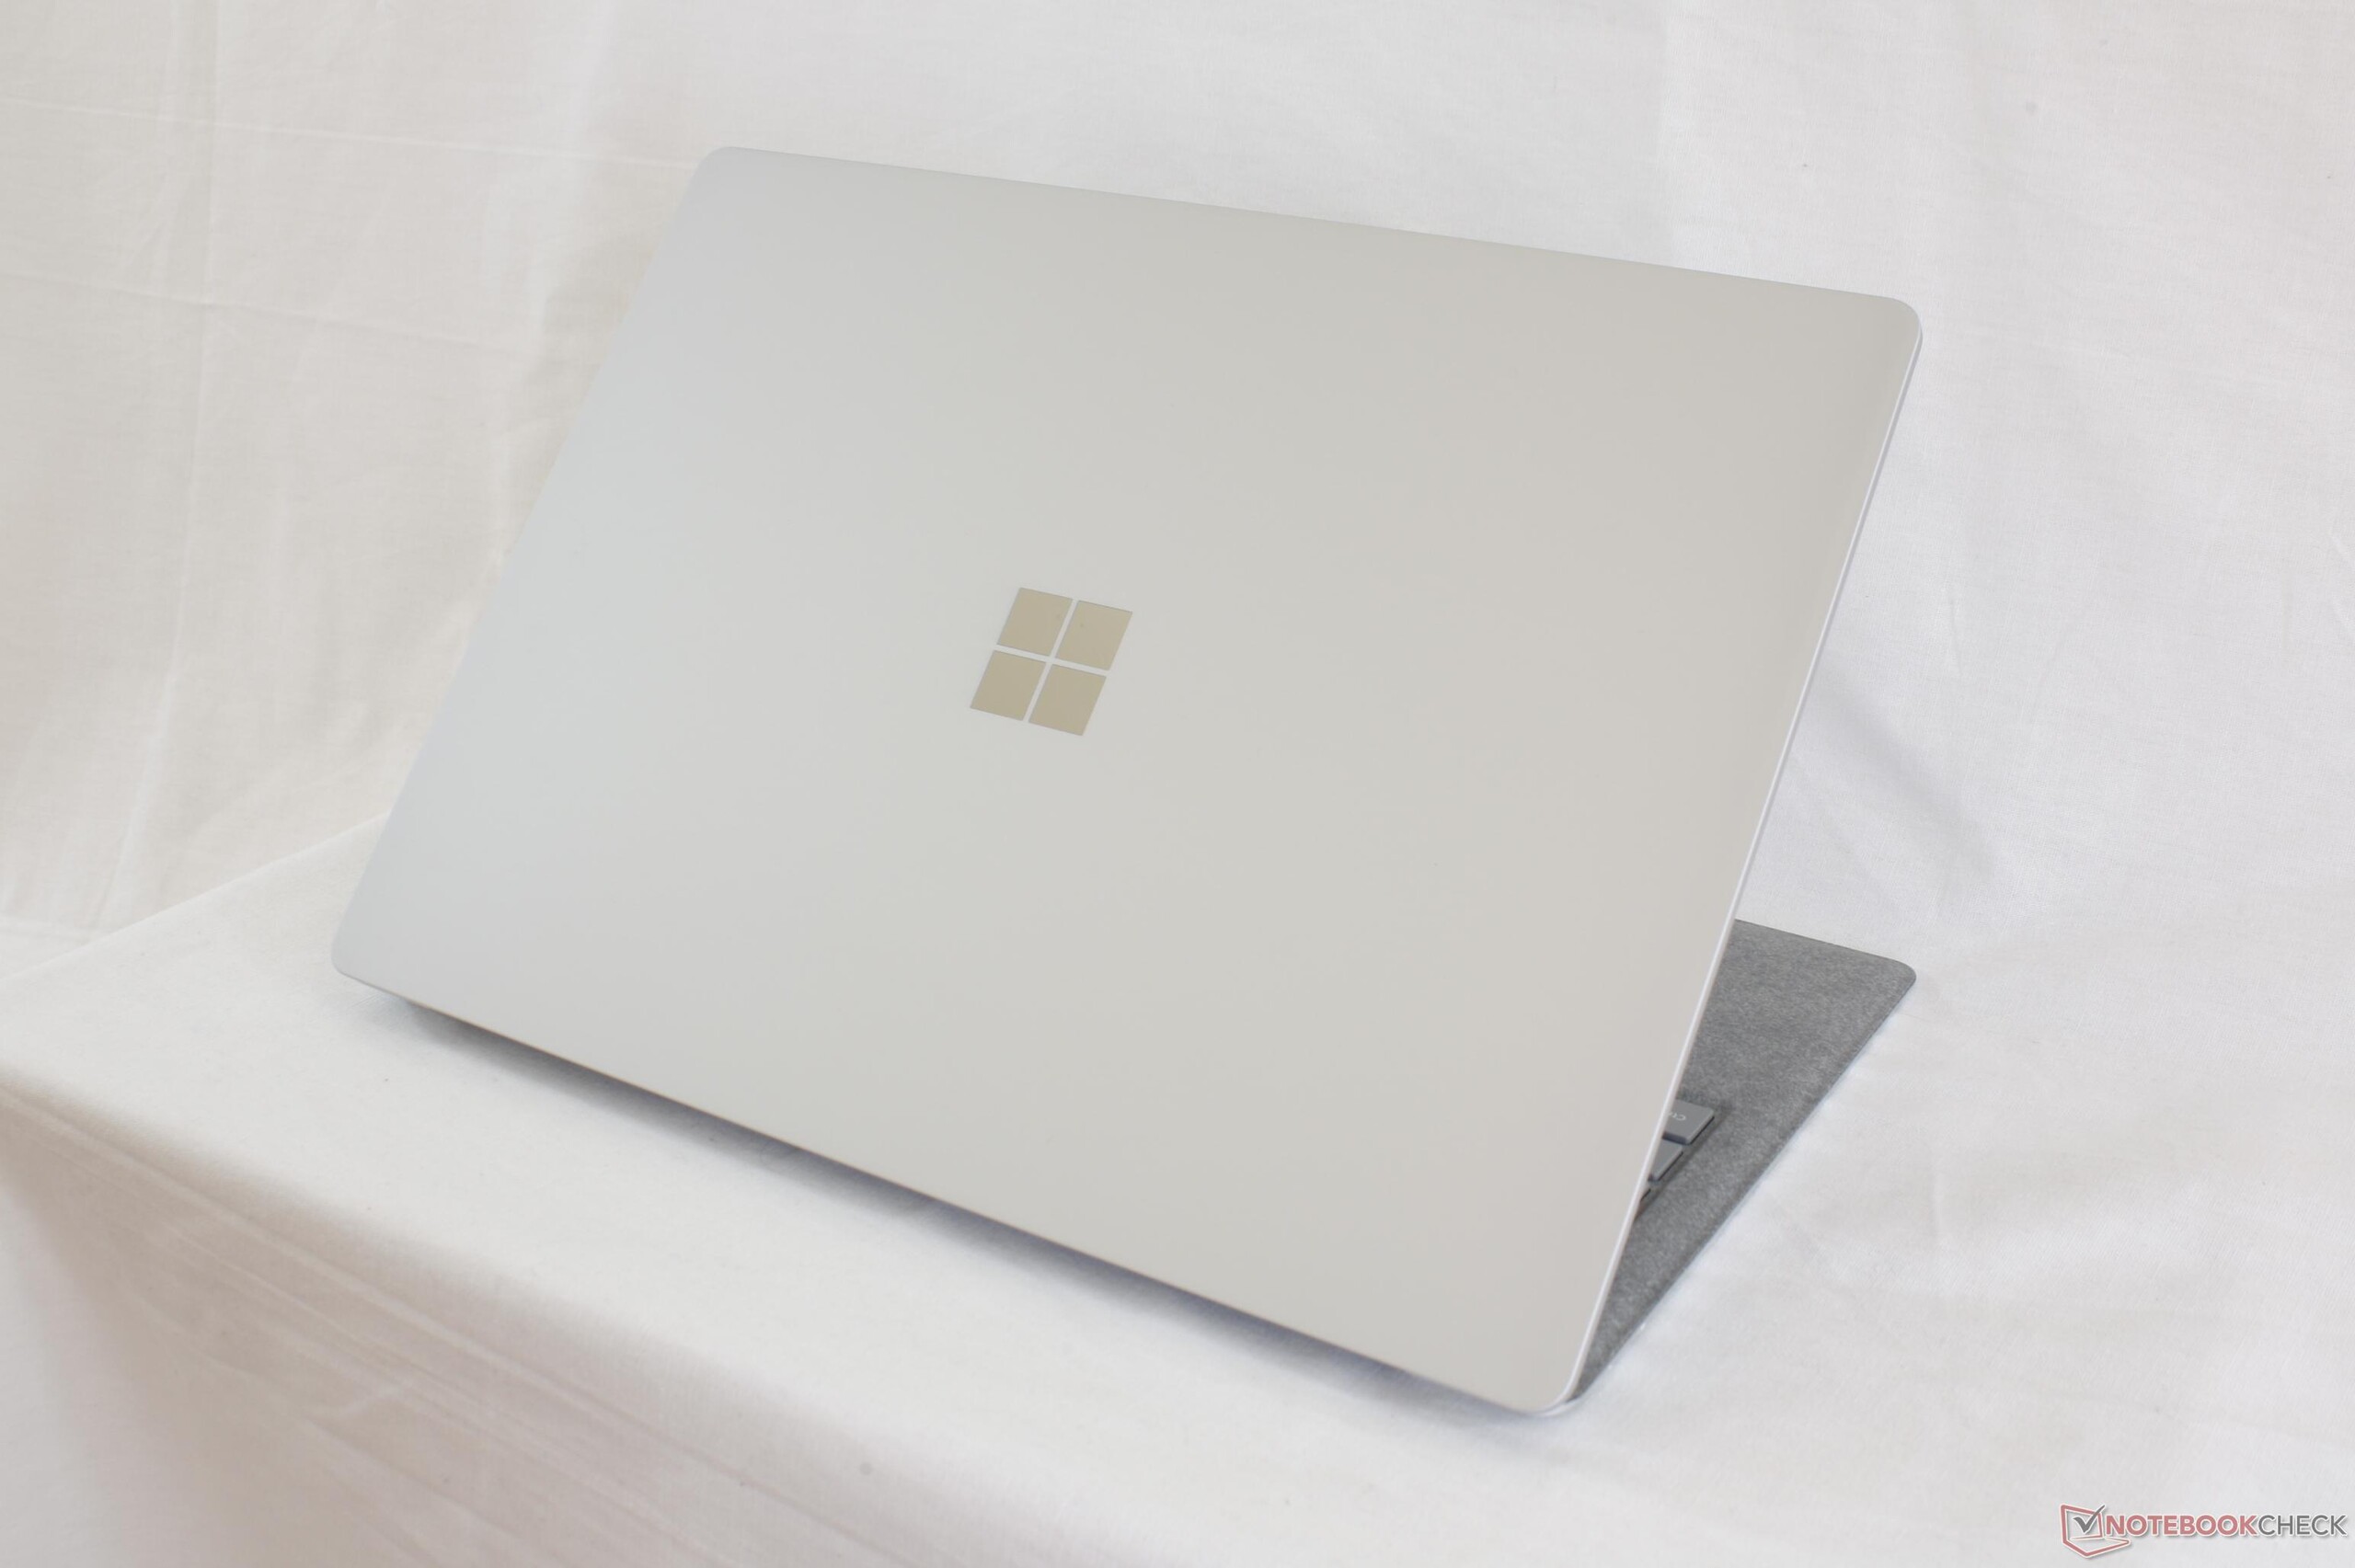
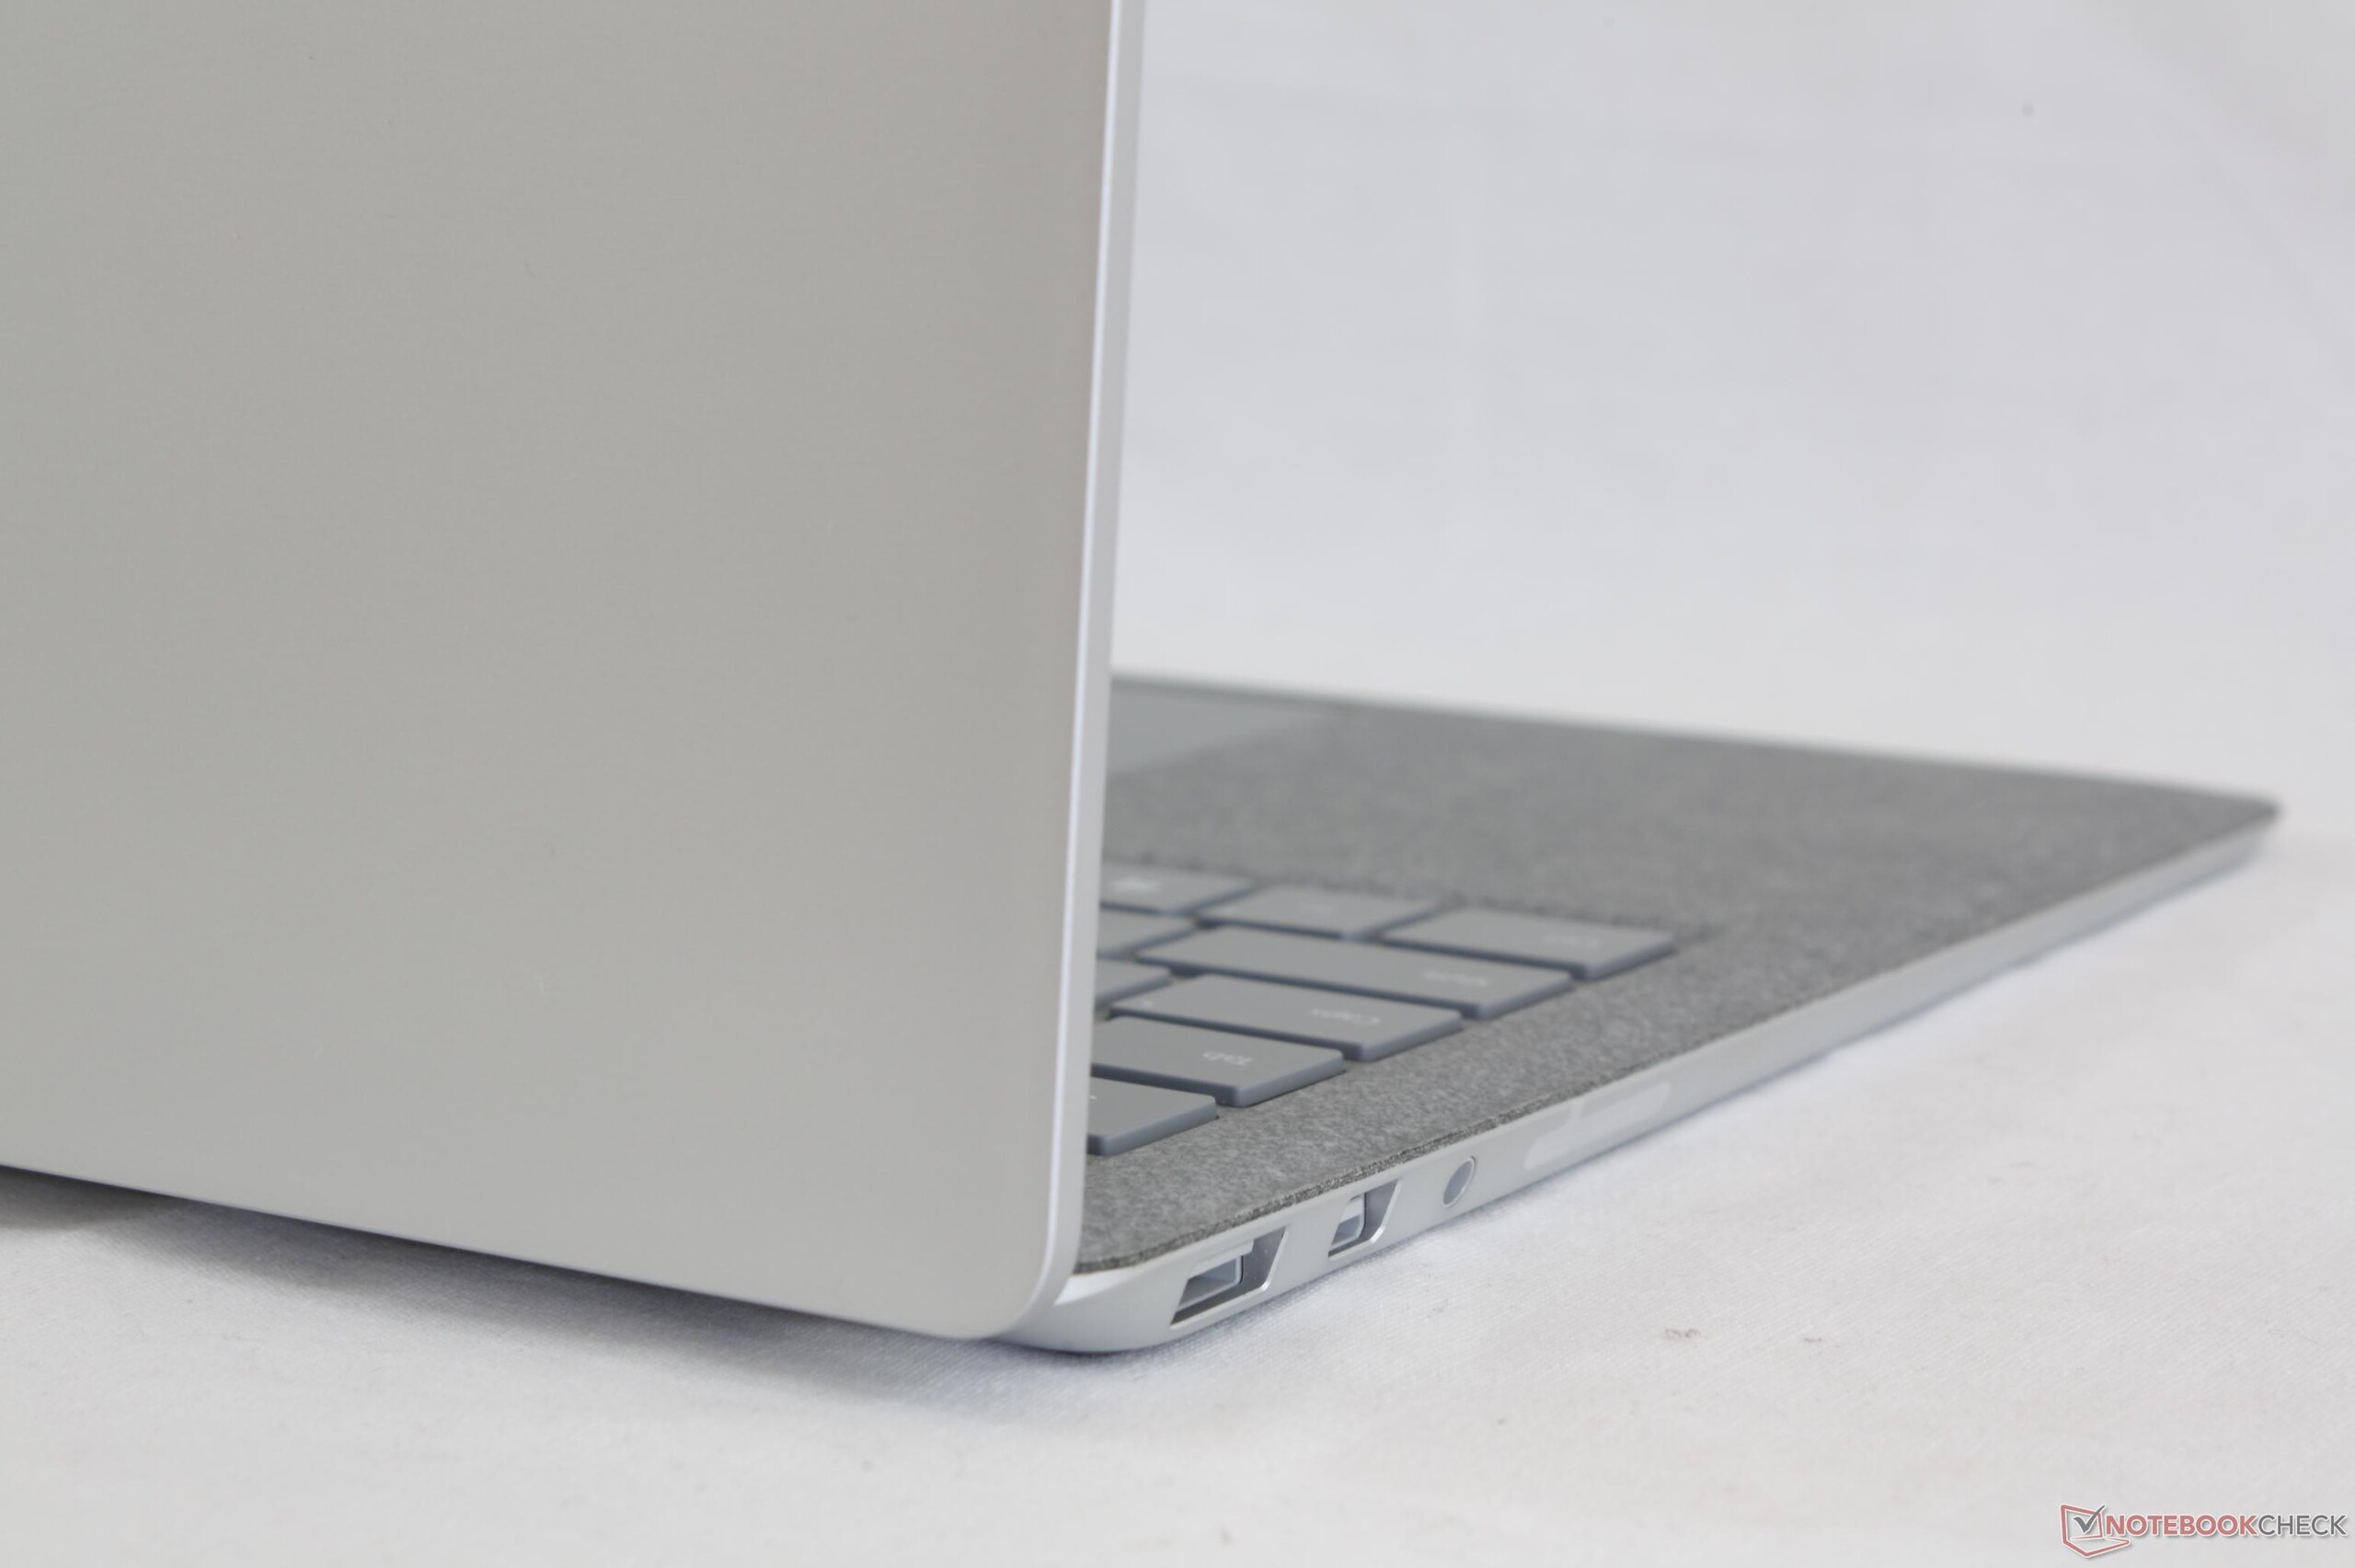
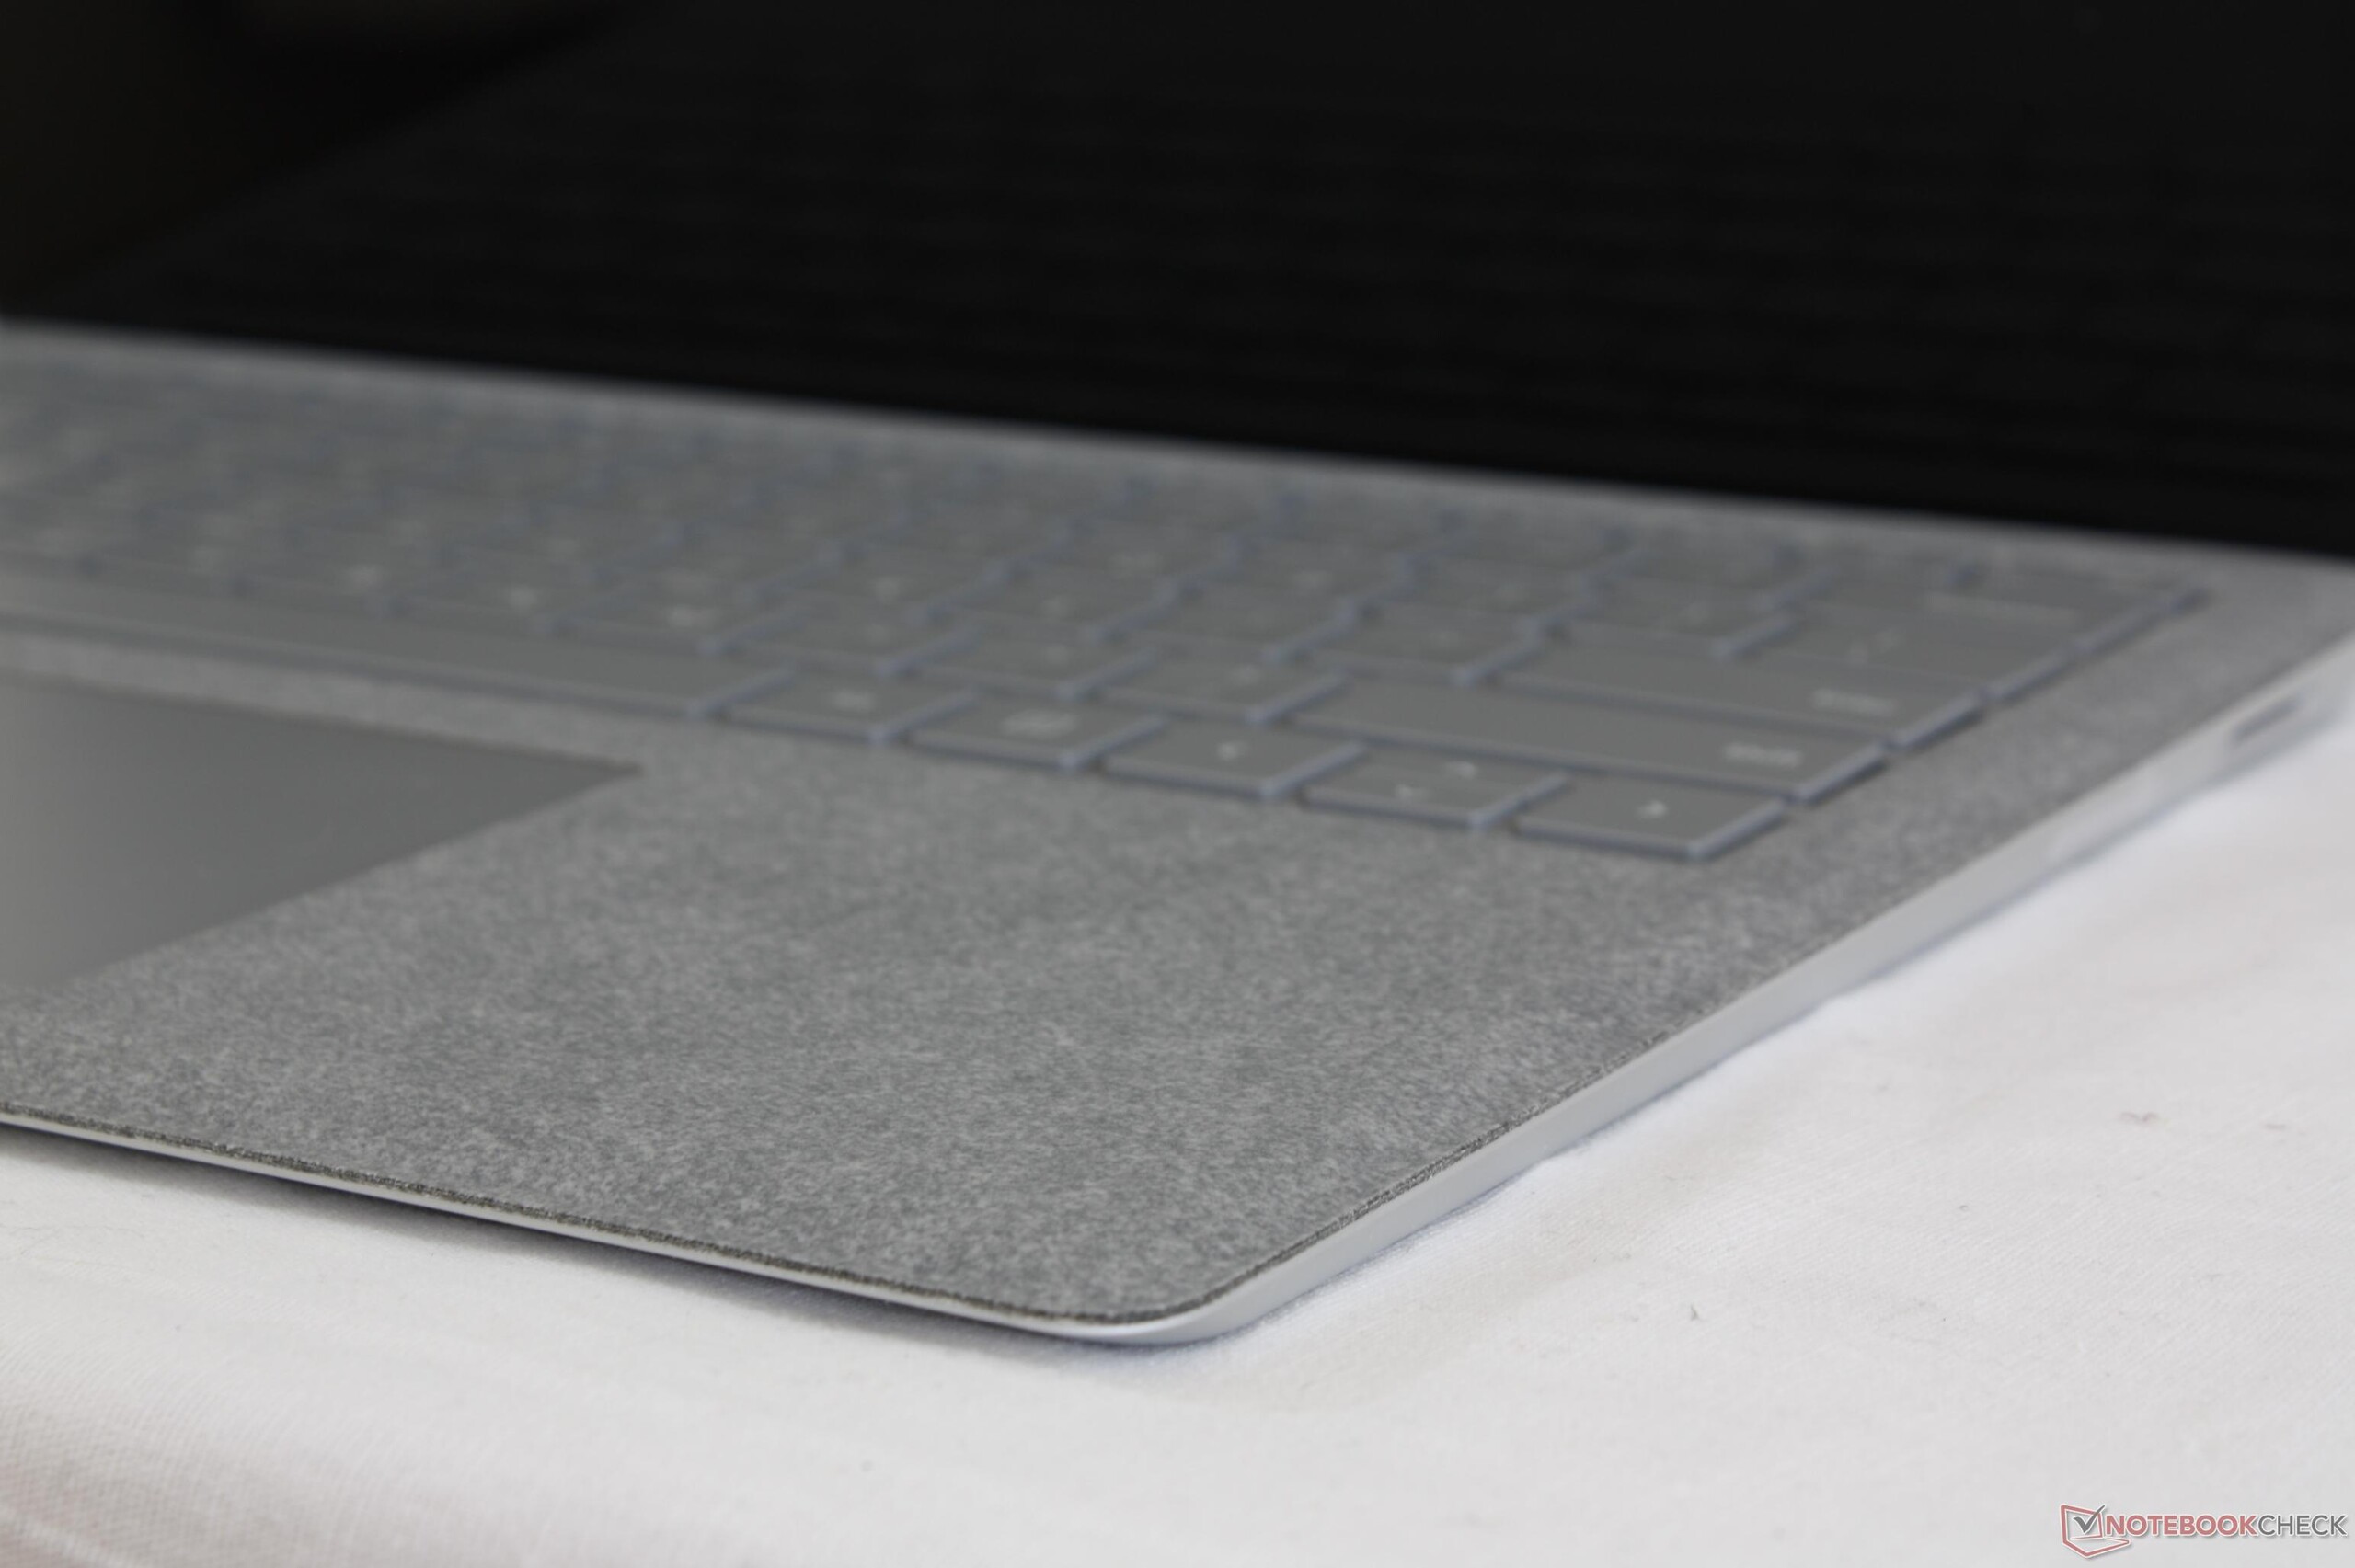
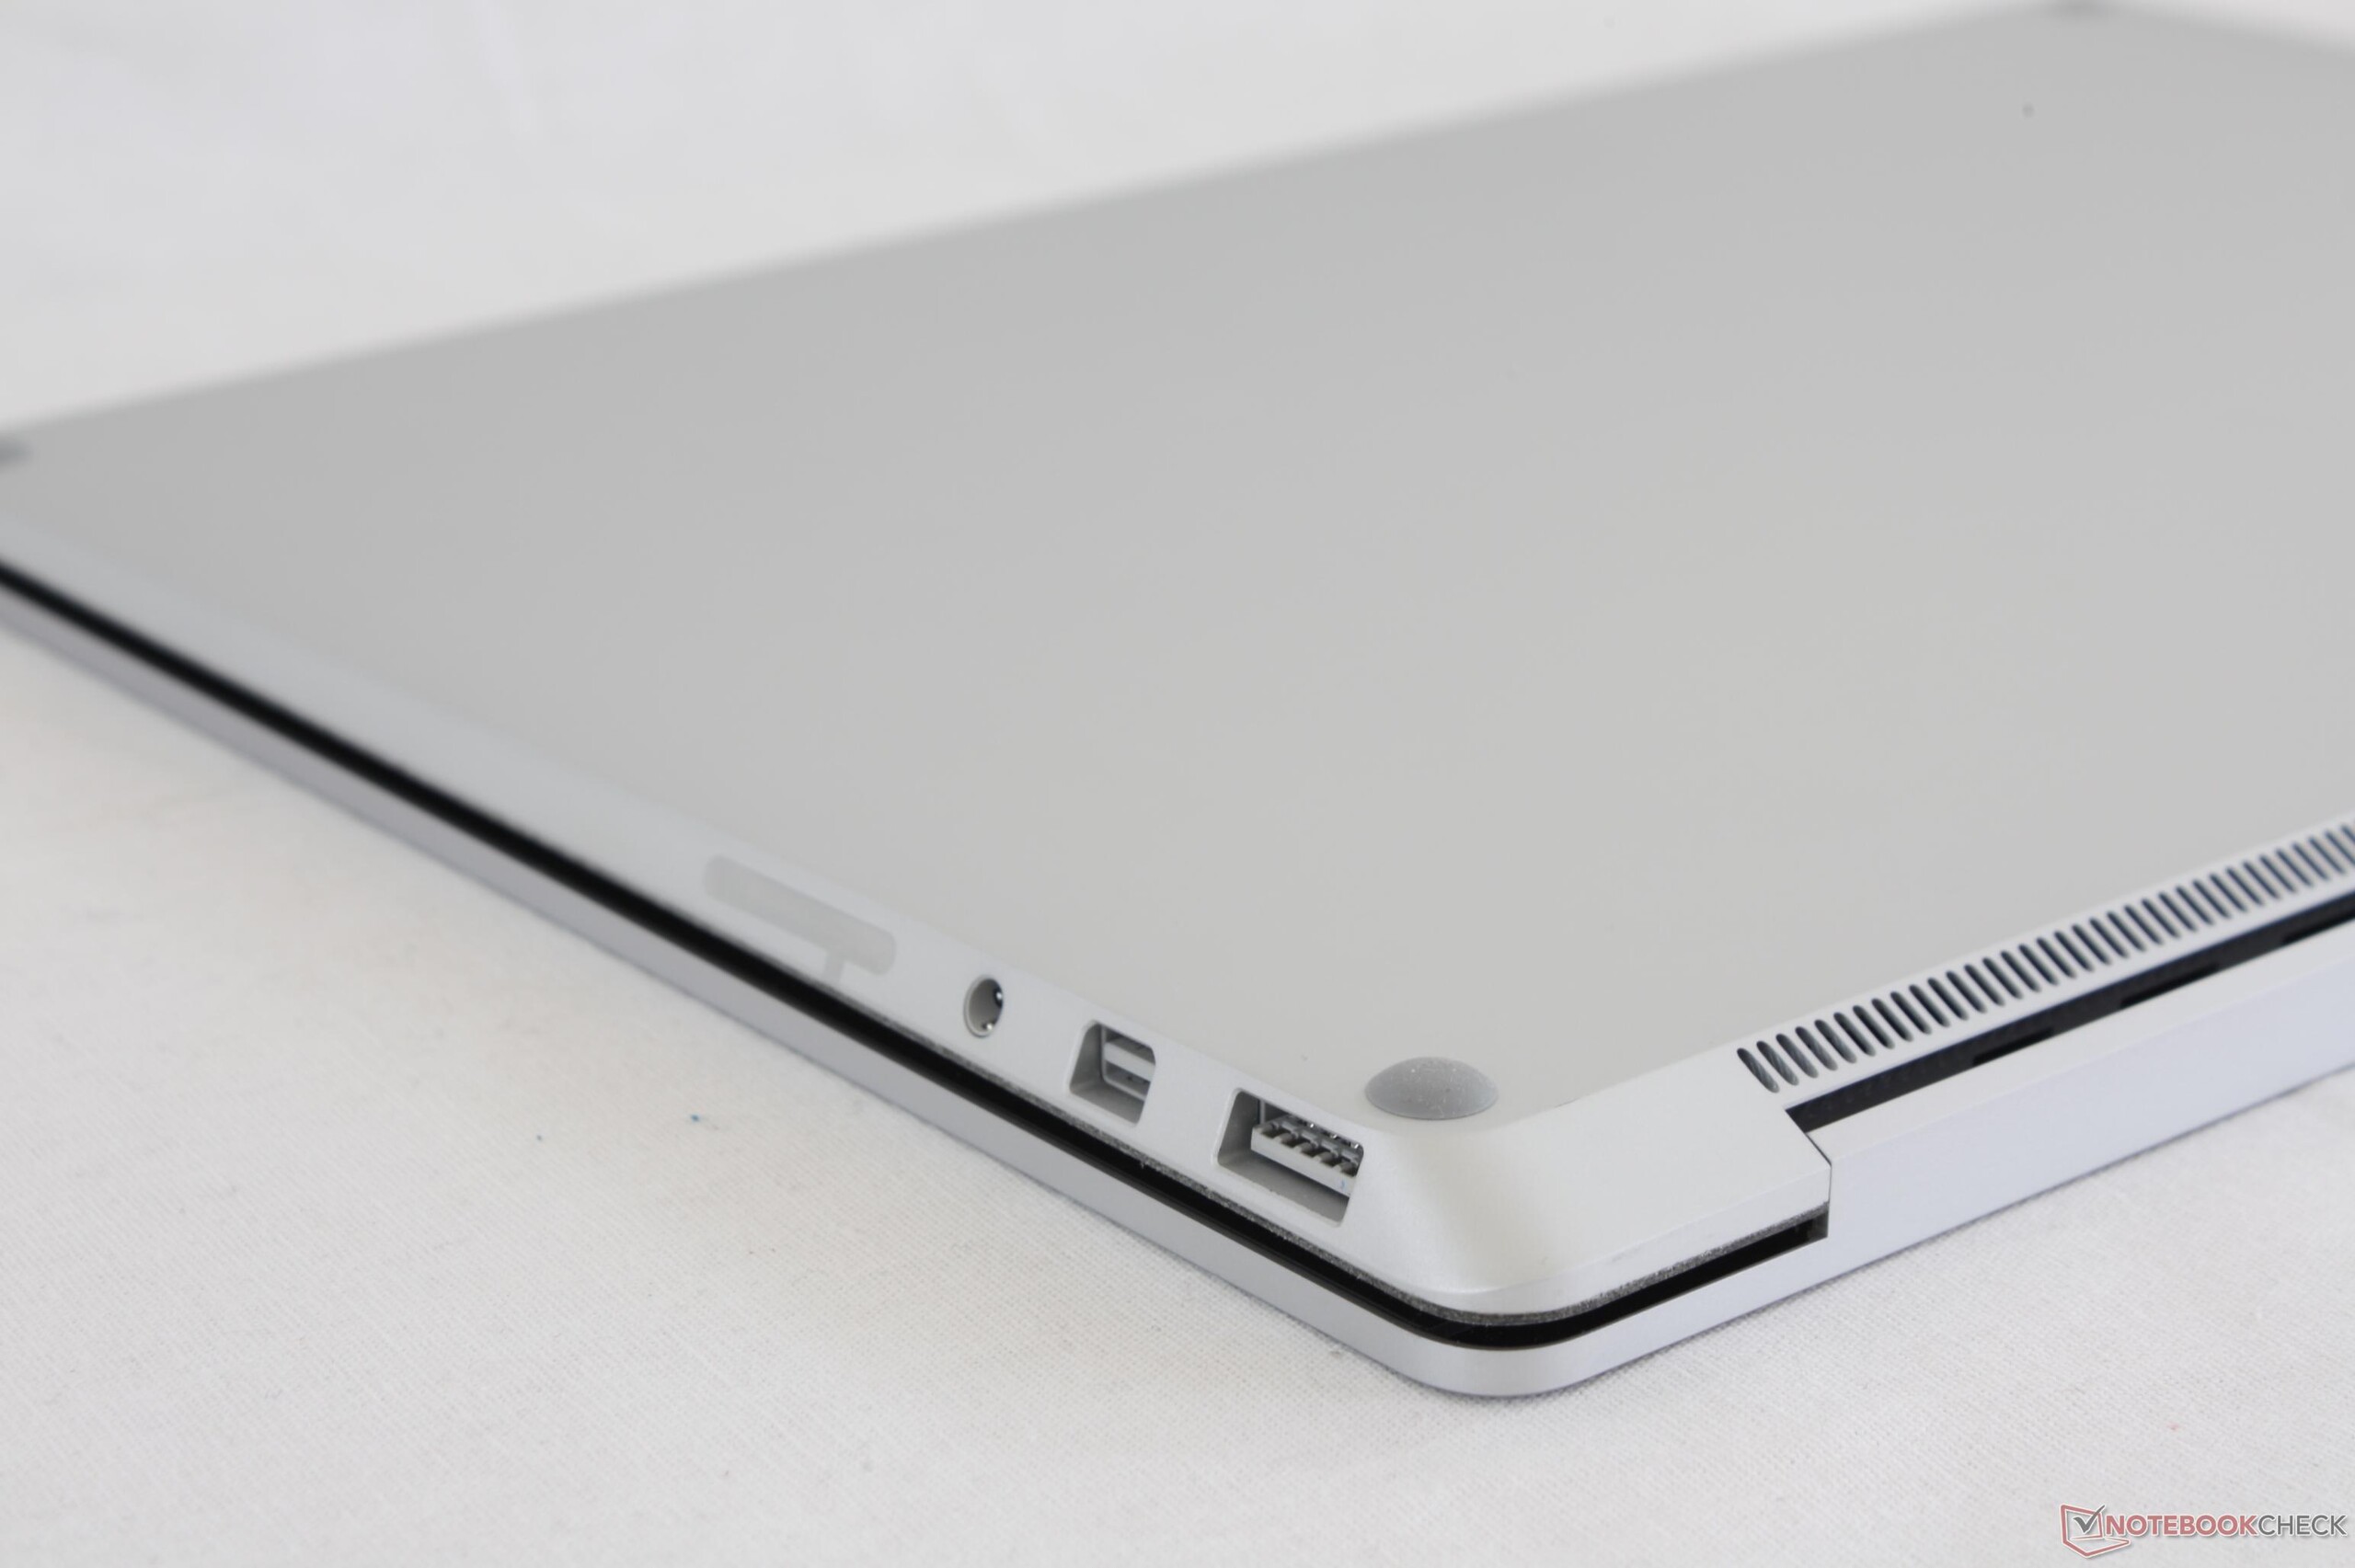
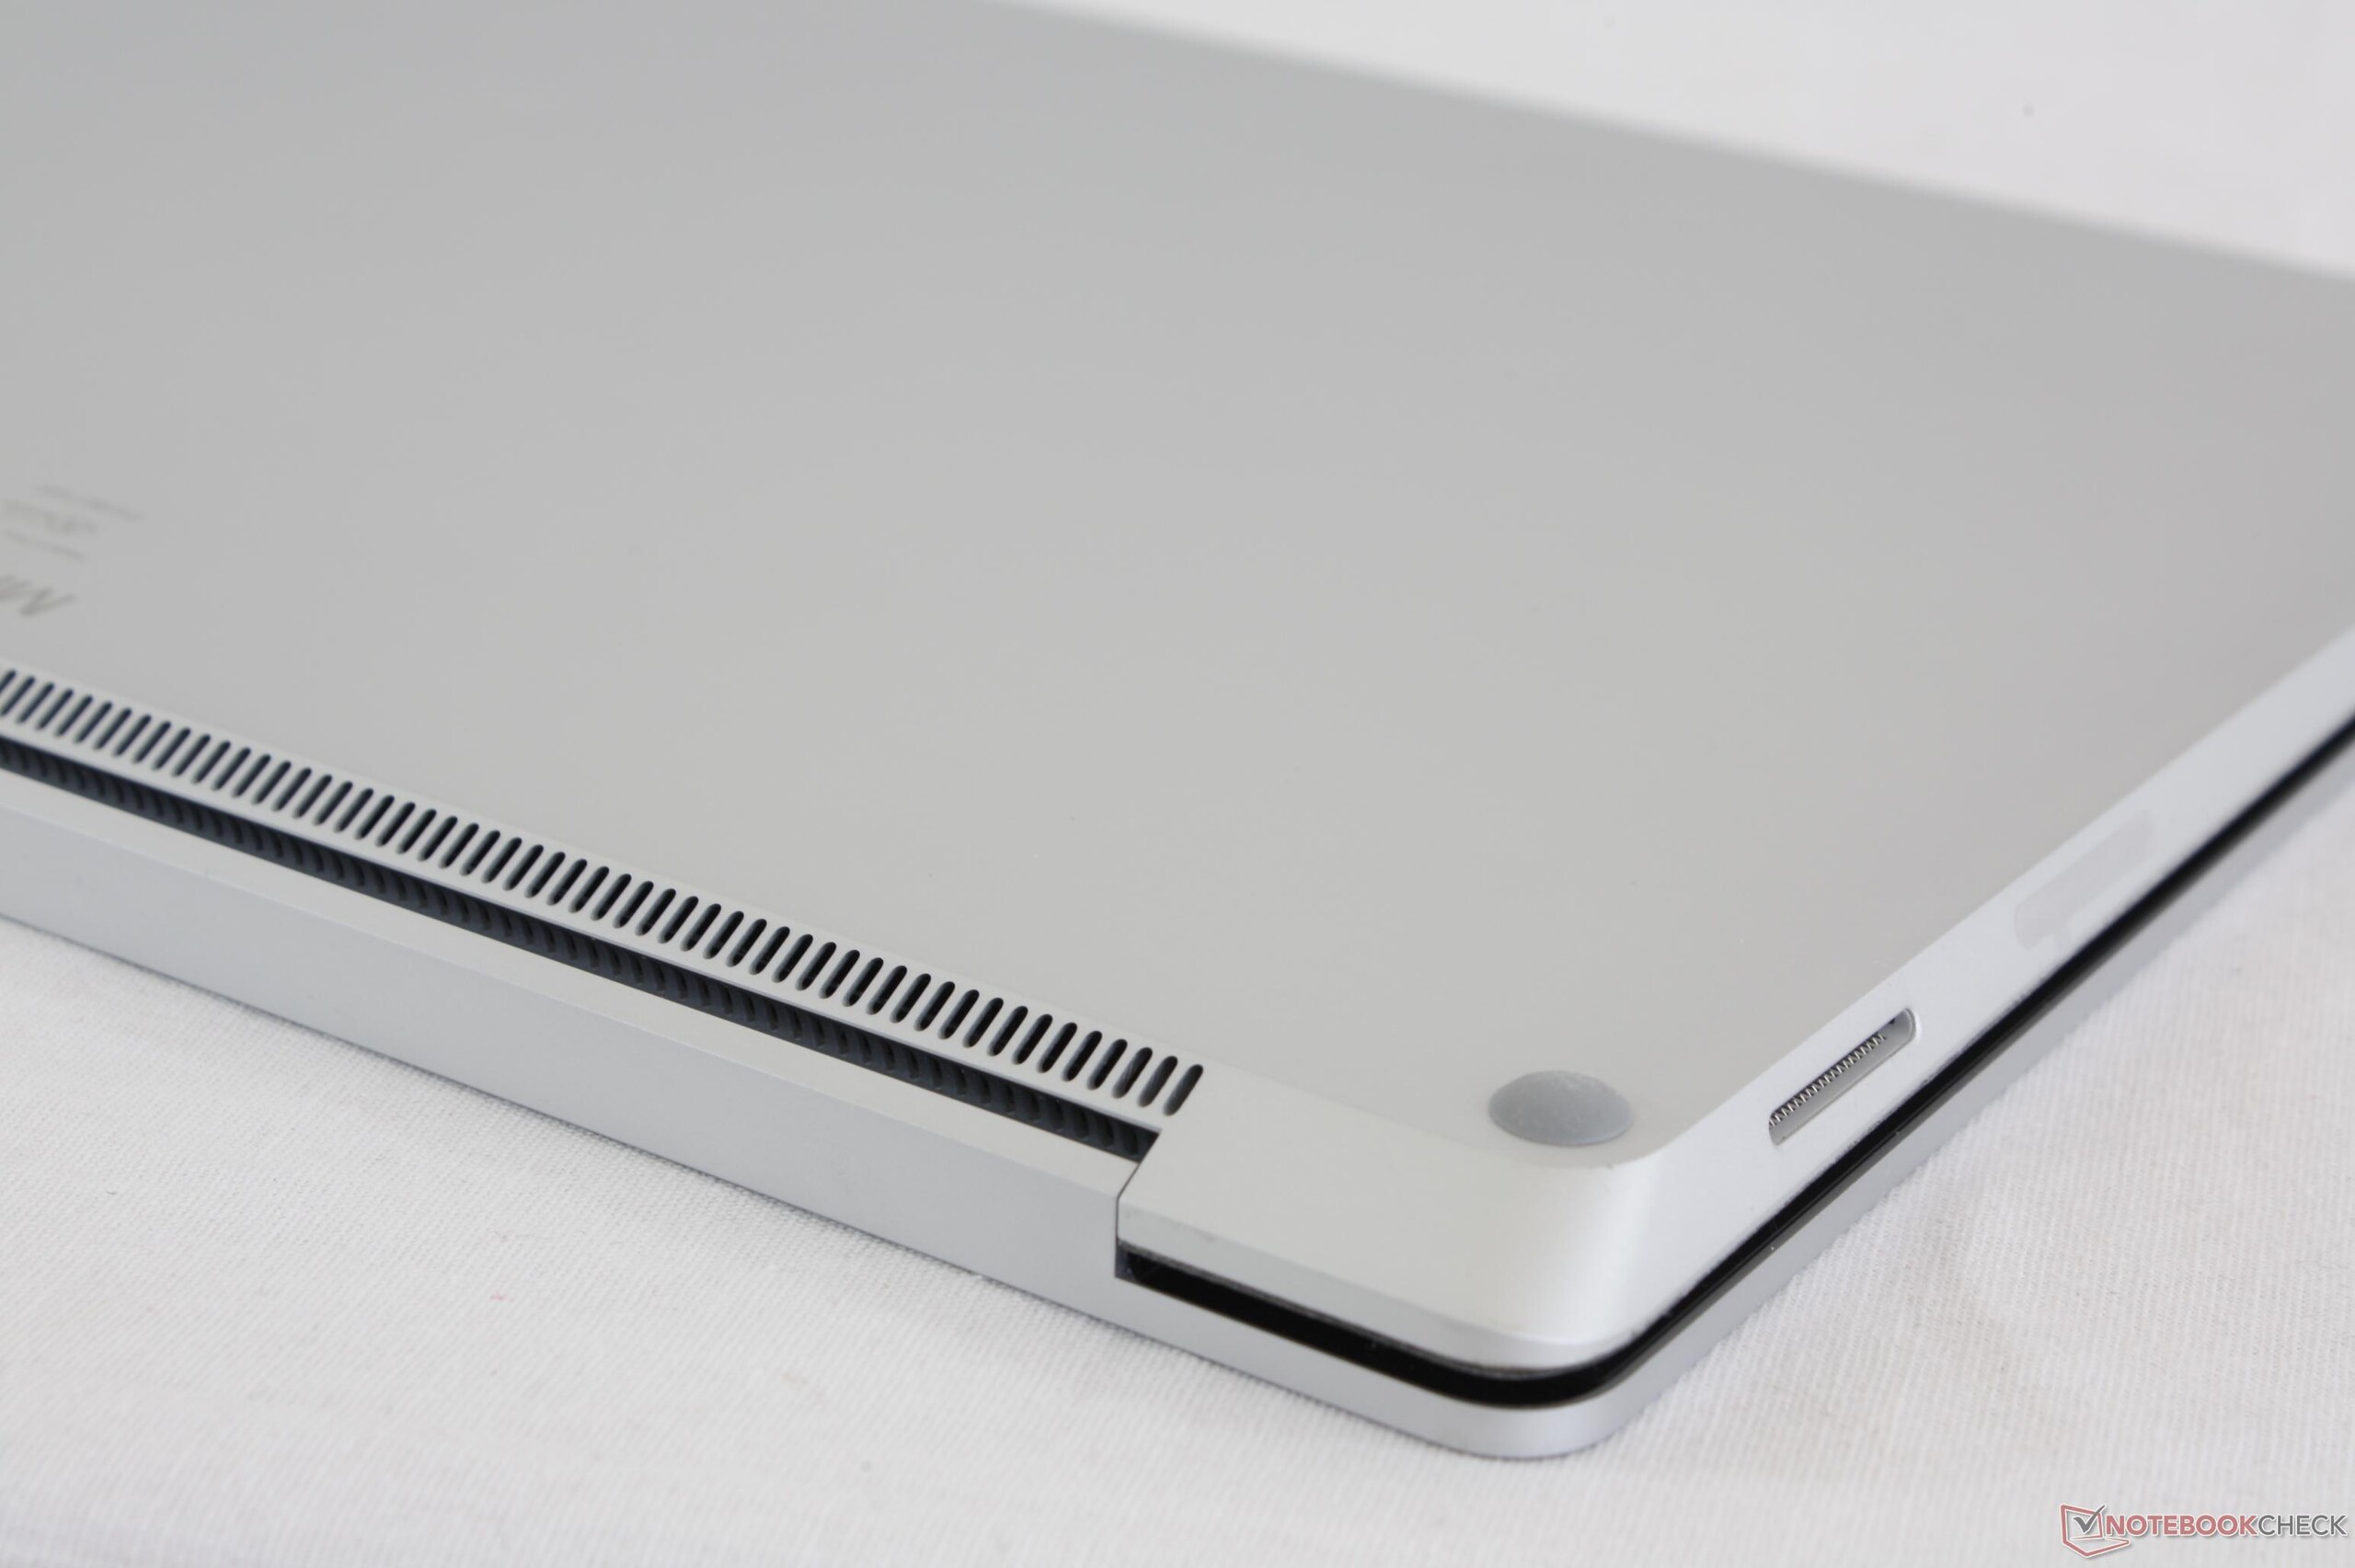
A Microsoft anuncia o portátil Surface como "mais que um portátil tradicional", mas nossa experiência foi o oposto. Se recursos como USB Type-C, leitores de cartões SD, e NVMe são mais importantes, então os atuais Ultrabooks carros-chefes da Lenovo, HP, e Dell oferecem mais do que o mais recente Surface da Microsoft pode oferecer. A base Alcantara certamente é diferente e o torna um excelente ponto de destaque para o marketing, mas sua conclusão se sente superficial sem vantagens significantes para o usuário final.
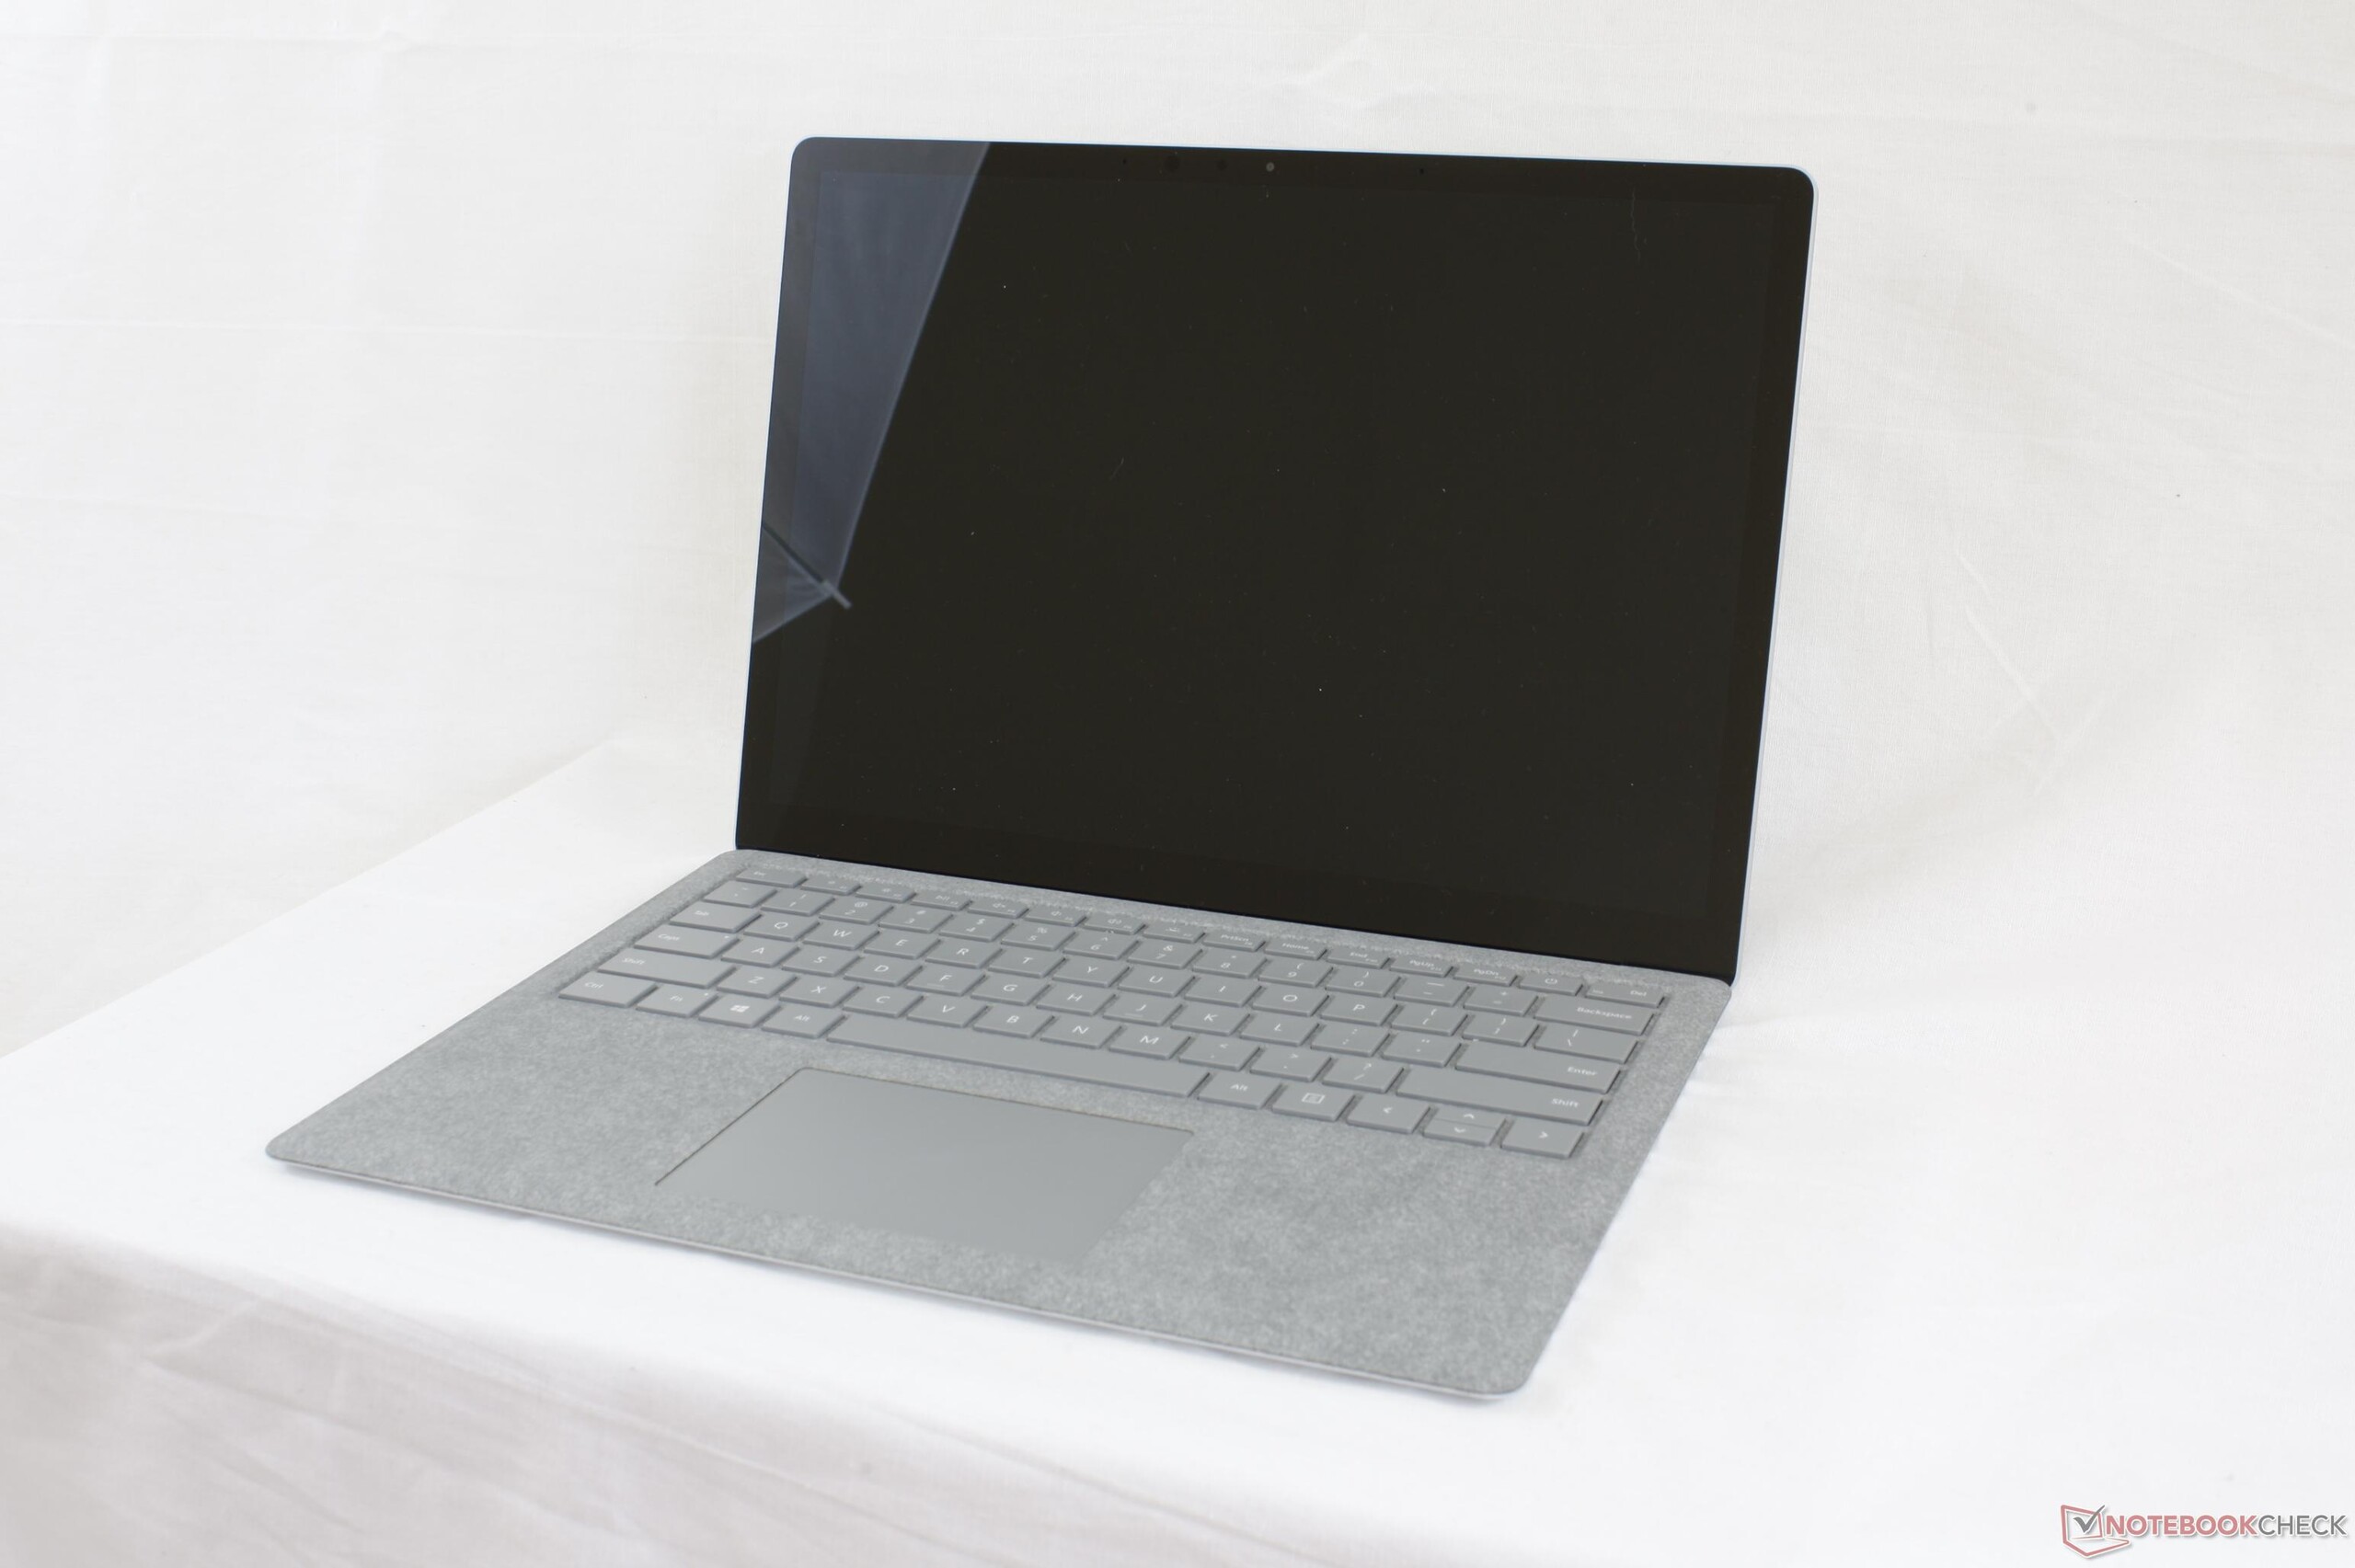
O maior motivo para adquirir um portátil Surface é a sua tela de 13,5 polegadas, já que todo o resto do portátil está abaixo do esperado. Se o painel 3:2 ou o SKU Iris Graphics não forem indispensáveis, então portátil se torna ainda menos atraente, em comparação com a pletora de alternativas de 13 e 14 polegadas, disponíveis atualmente. A longa duração da bateria, o baixo ruído da ventoinha, e a ampla gama de cores do portátil Microsoft pode ser encontrado em concorrentes como o XPS 13 9360 QHD ou o Notebook 9.
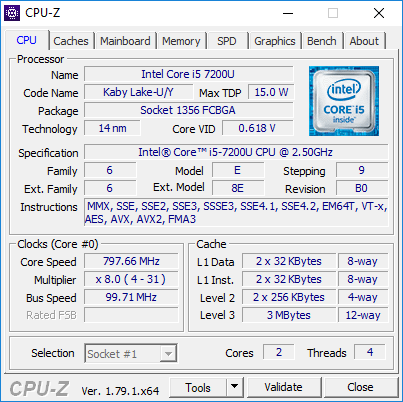
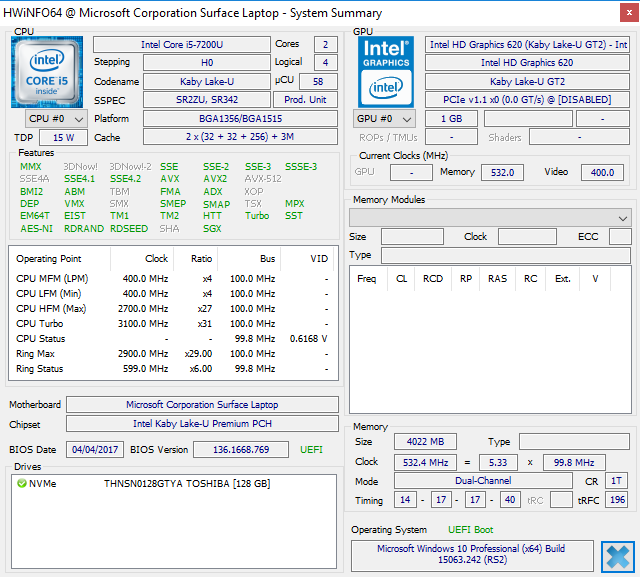
Como o SKU Core i7 se desempenhará sob estresse será interessante para ver na futura análise. Se nossa configuração Core i5 apenas consegue manter as velocidades Turbo Boost na faixa dos 2,7 a 2,8 GHz, então questionamos como o mais exigente SKU Core i7 pode manter sua velocidade Turbo Boost máxima de 4,0 GHz. Também estam,os preocupados se a RAM DDR3 conseguira manter todo o potencial da GPU Iris Plus Graphics 640 similar a como a nossa GPU HD Graphics 620 se desempenha de forma inferior para a nossa configuração Core i5.
A Microsoft está ofertando o seu portátil para estudantes e assim podemos apreciar que a qualidade do aparelho não sofre de recortes aparentes. Com isso dito, sua longa lista de recursos ausentes limita severamente a versatilidade do portátil Surface e dificulta a nossa recomendação, tanto para estudantes como para usuários em geral.
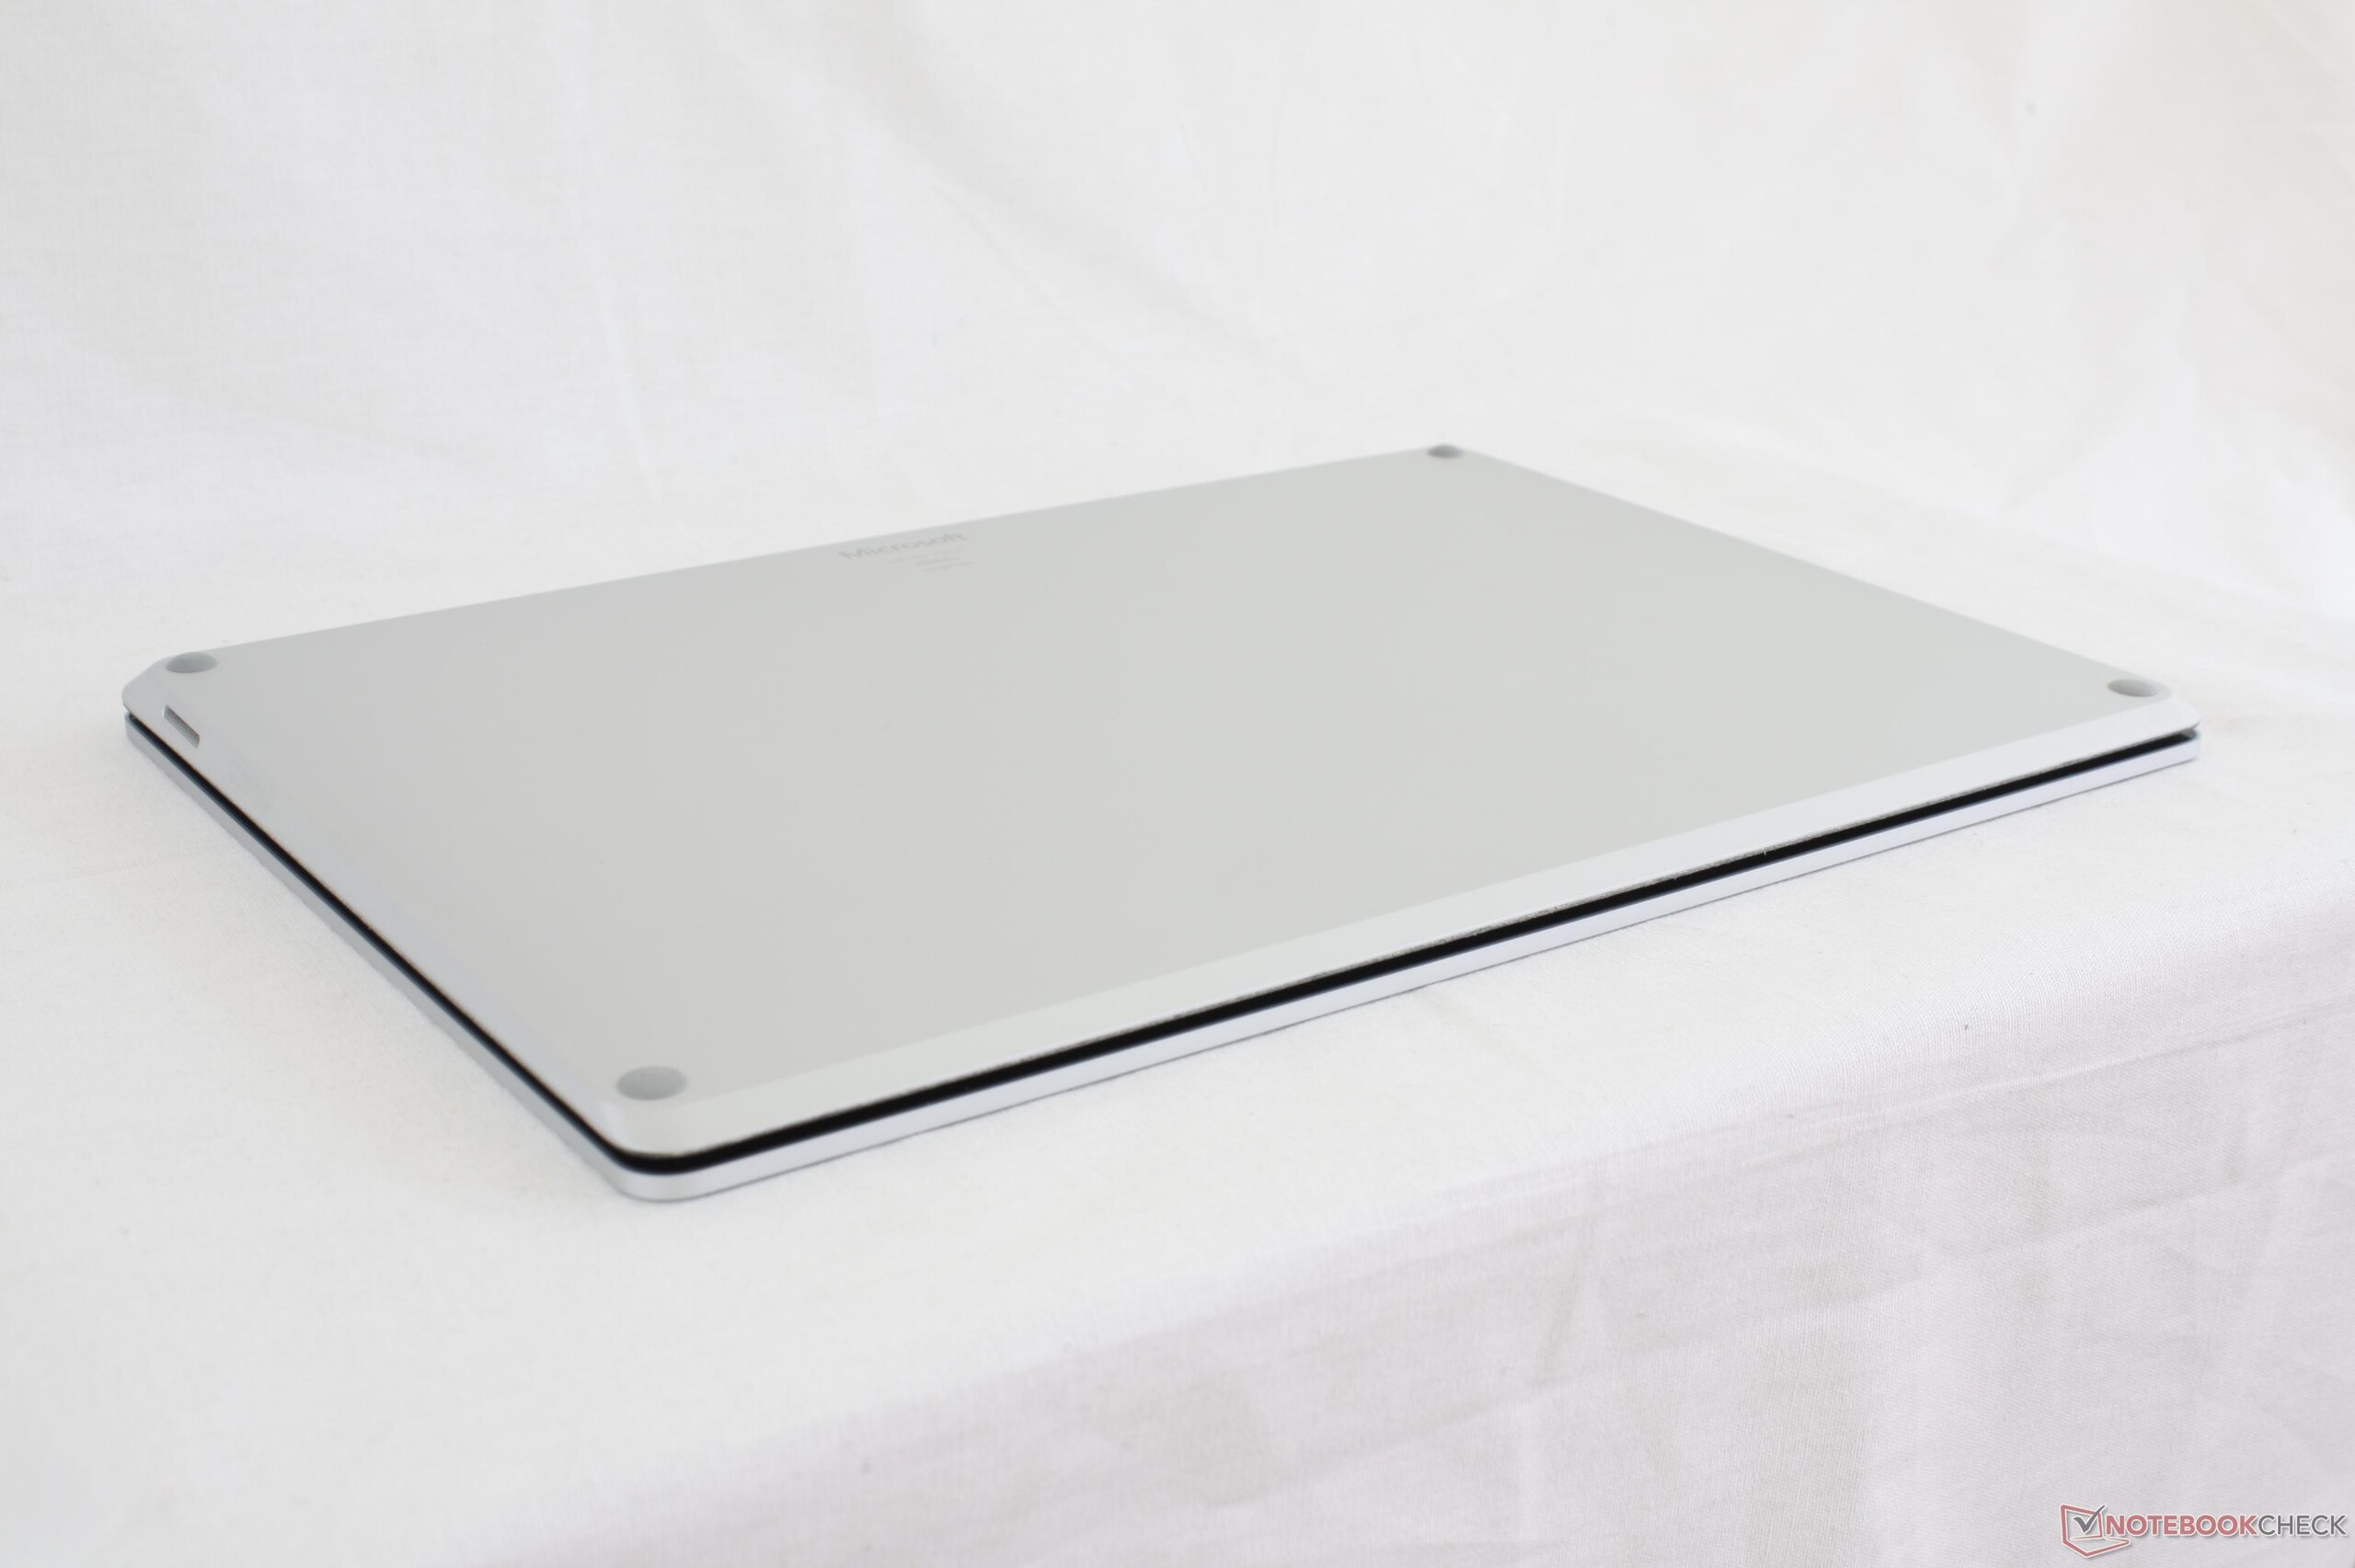
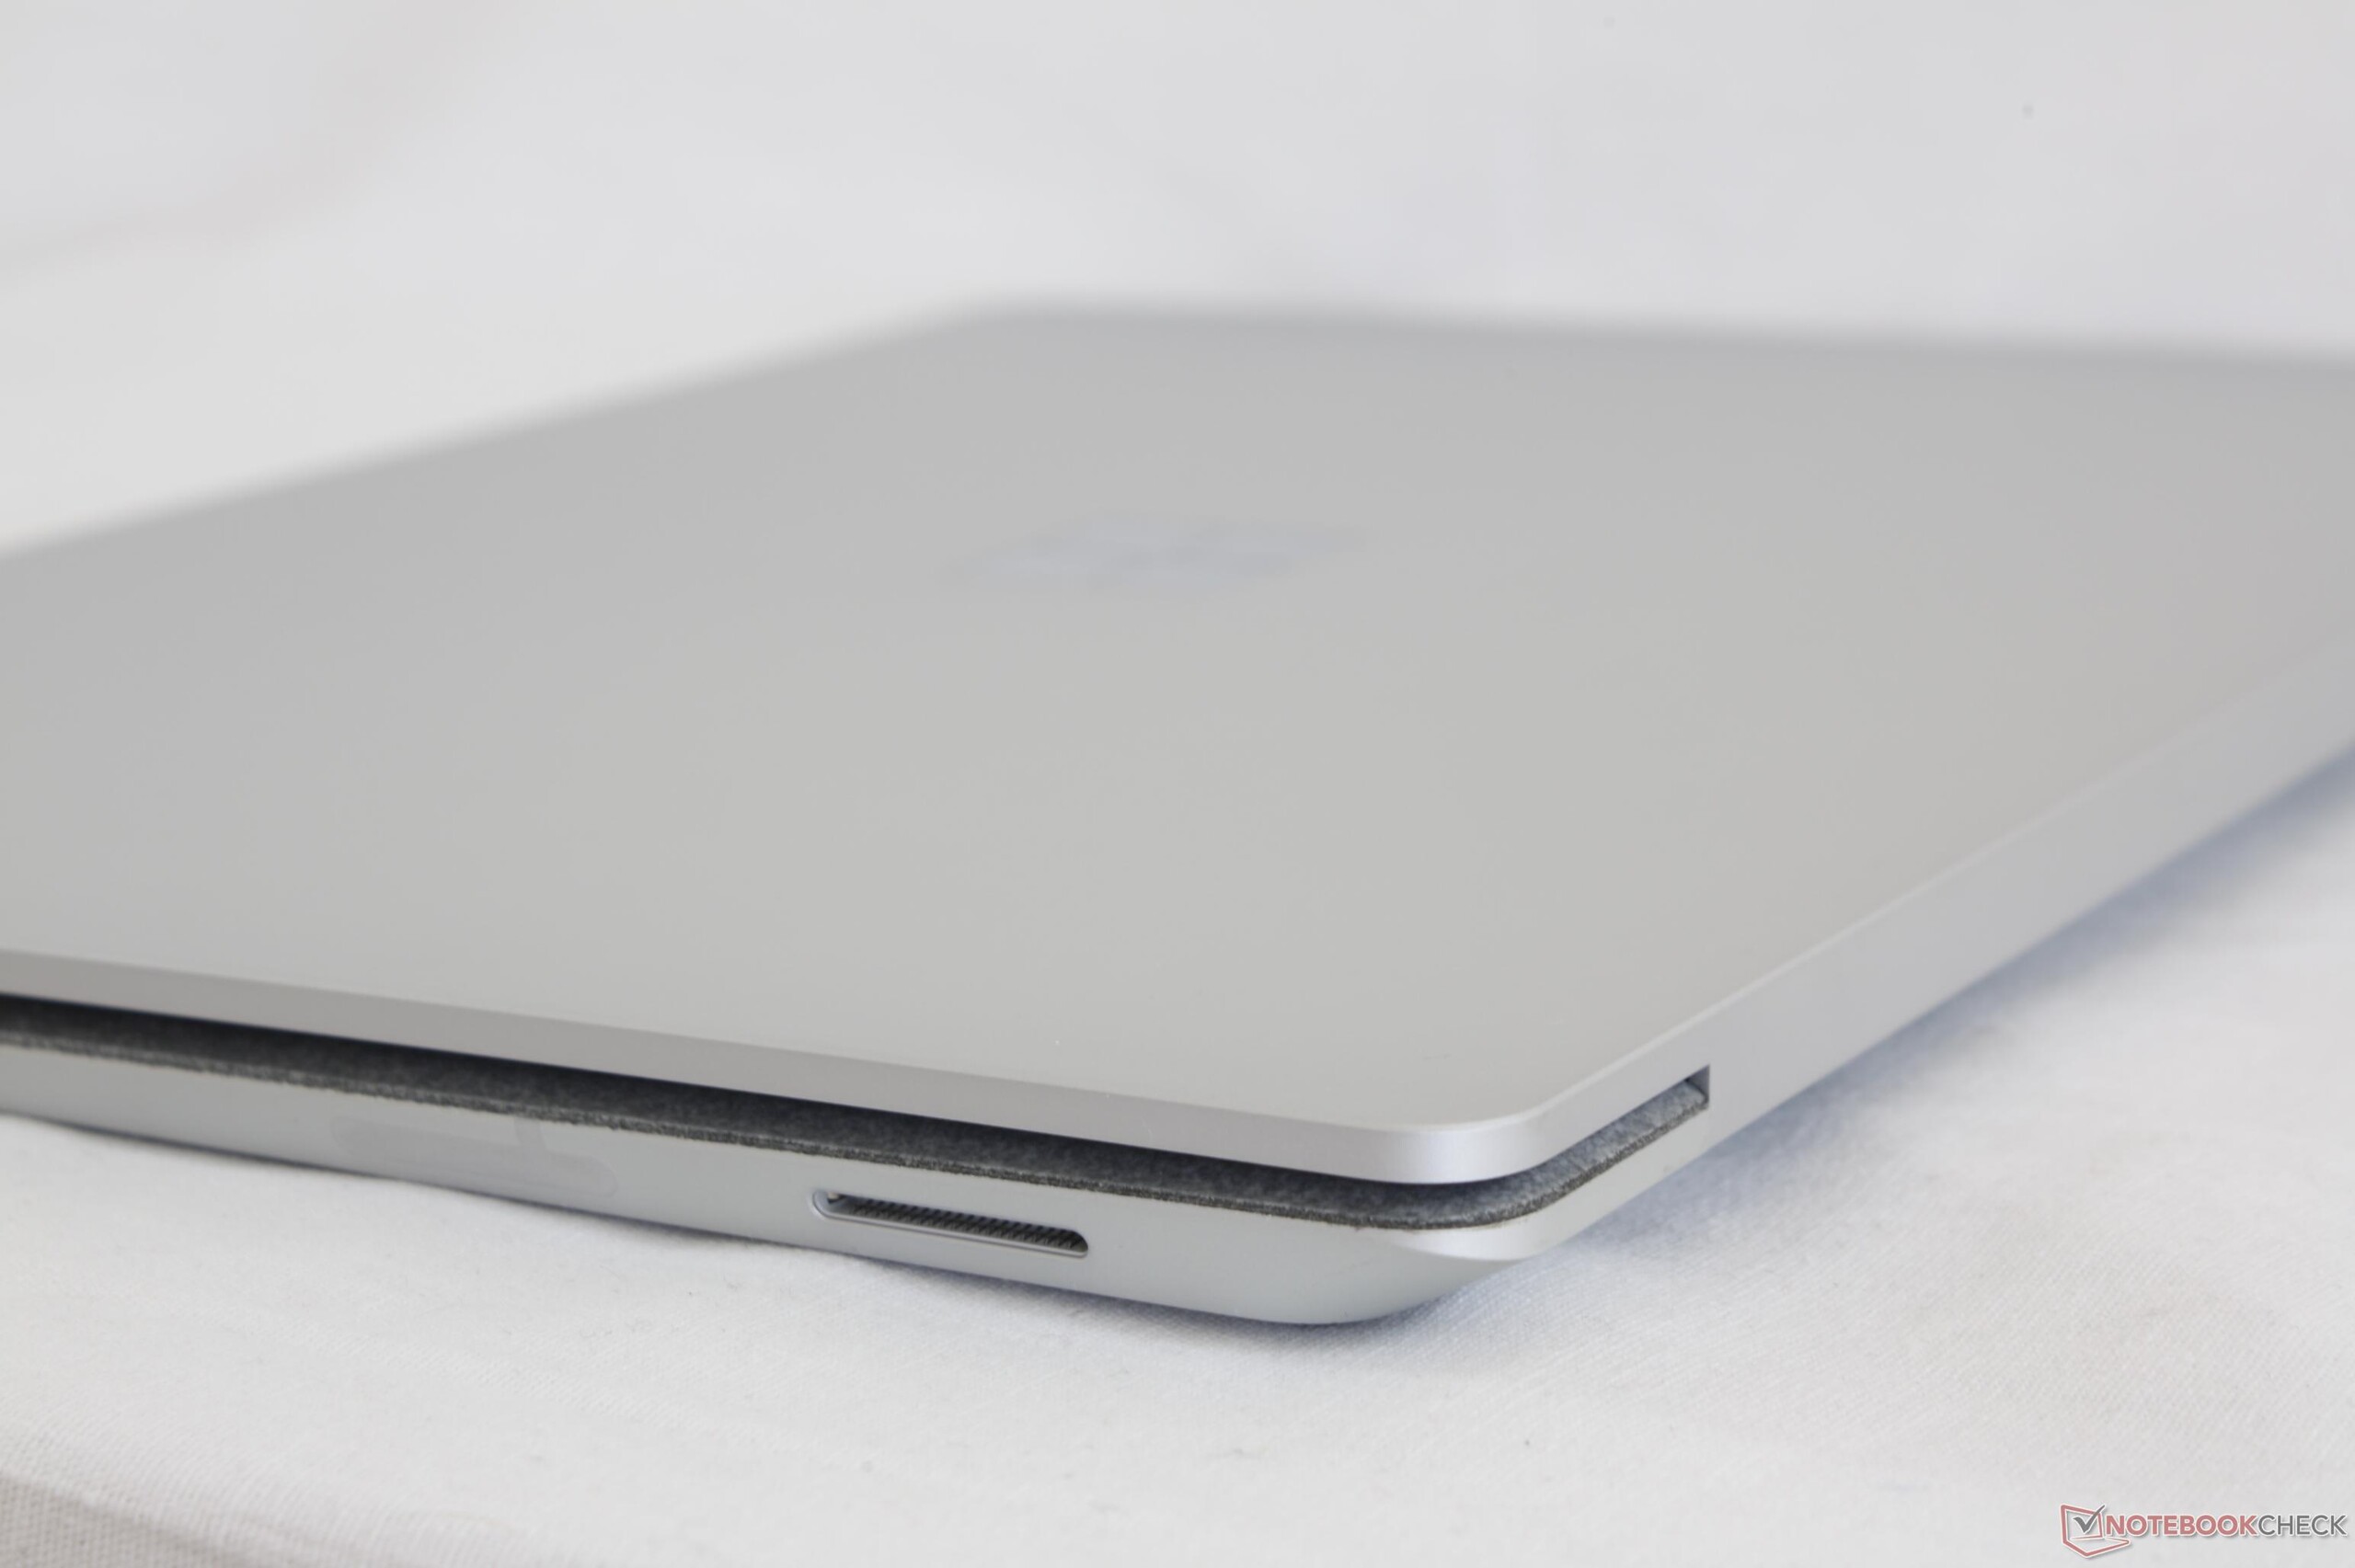
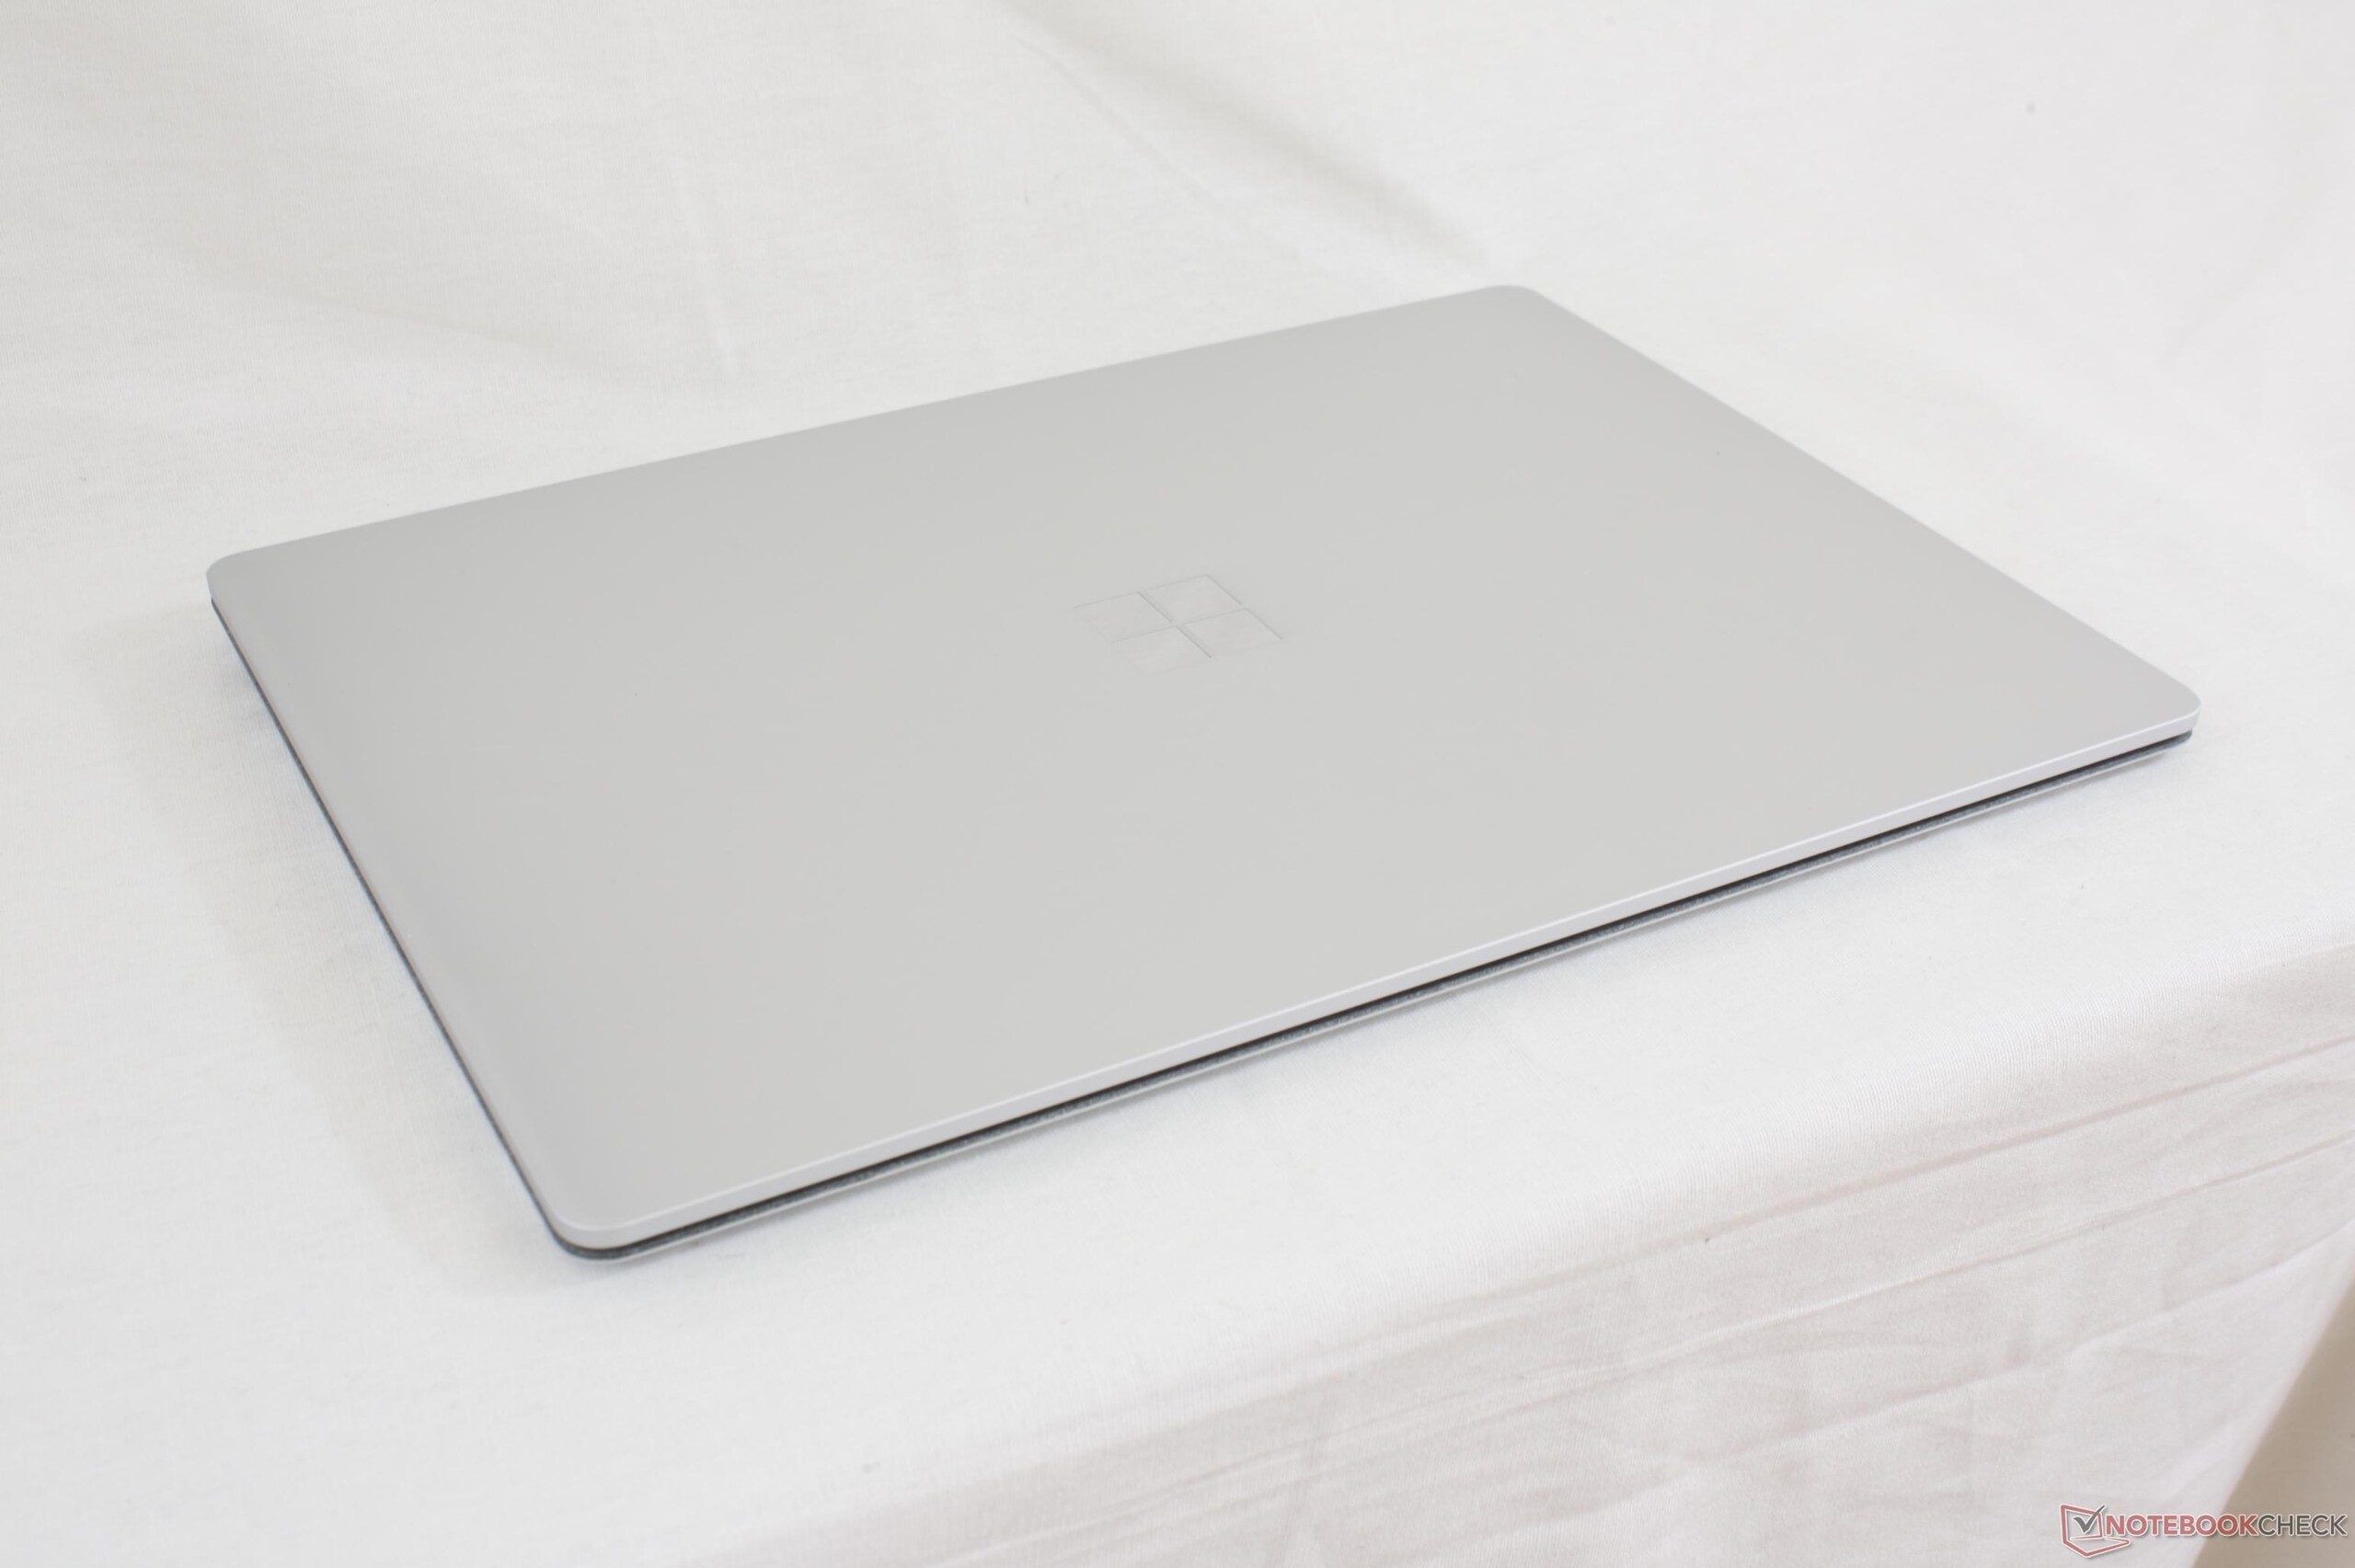
Muito pouco, muito tarde. O portátil Surface é um portátil solidamente construído e sem frescuras, com uma bela tela. Infelizmente, não oferece muito mais e não chega nem perto da versatilidade do Surface Pro 4 ou da maioria dos Ultrabooks atualmente disponíveis no mercado.
Microsoft Surface Laptop i5
- 06/18/2017 v6 (old)
Allen Ngo
Price comparison
