Breve Análise do Portátil Dell Inspiron 17-5770-0357 (8250U, SSD, HDD, FHD)

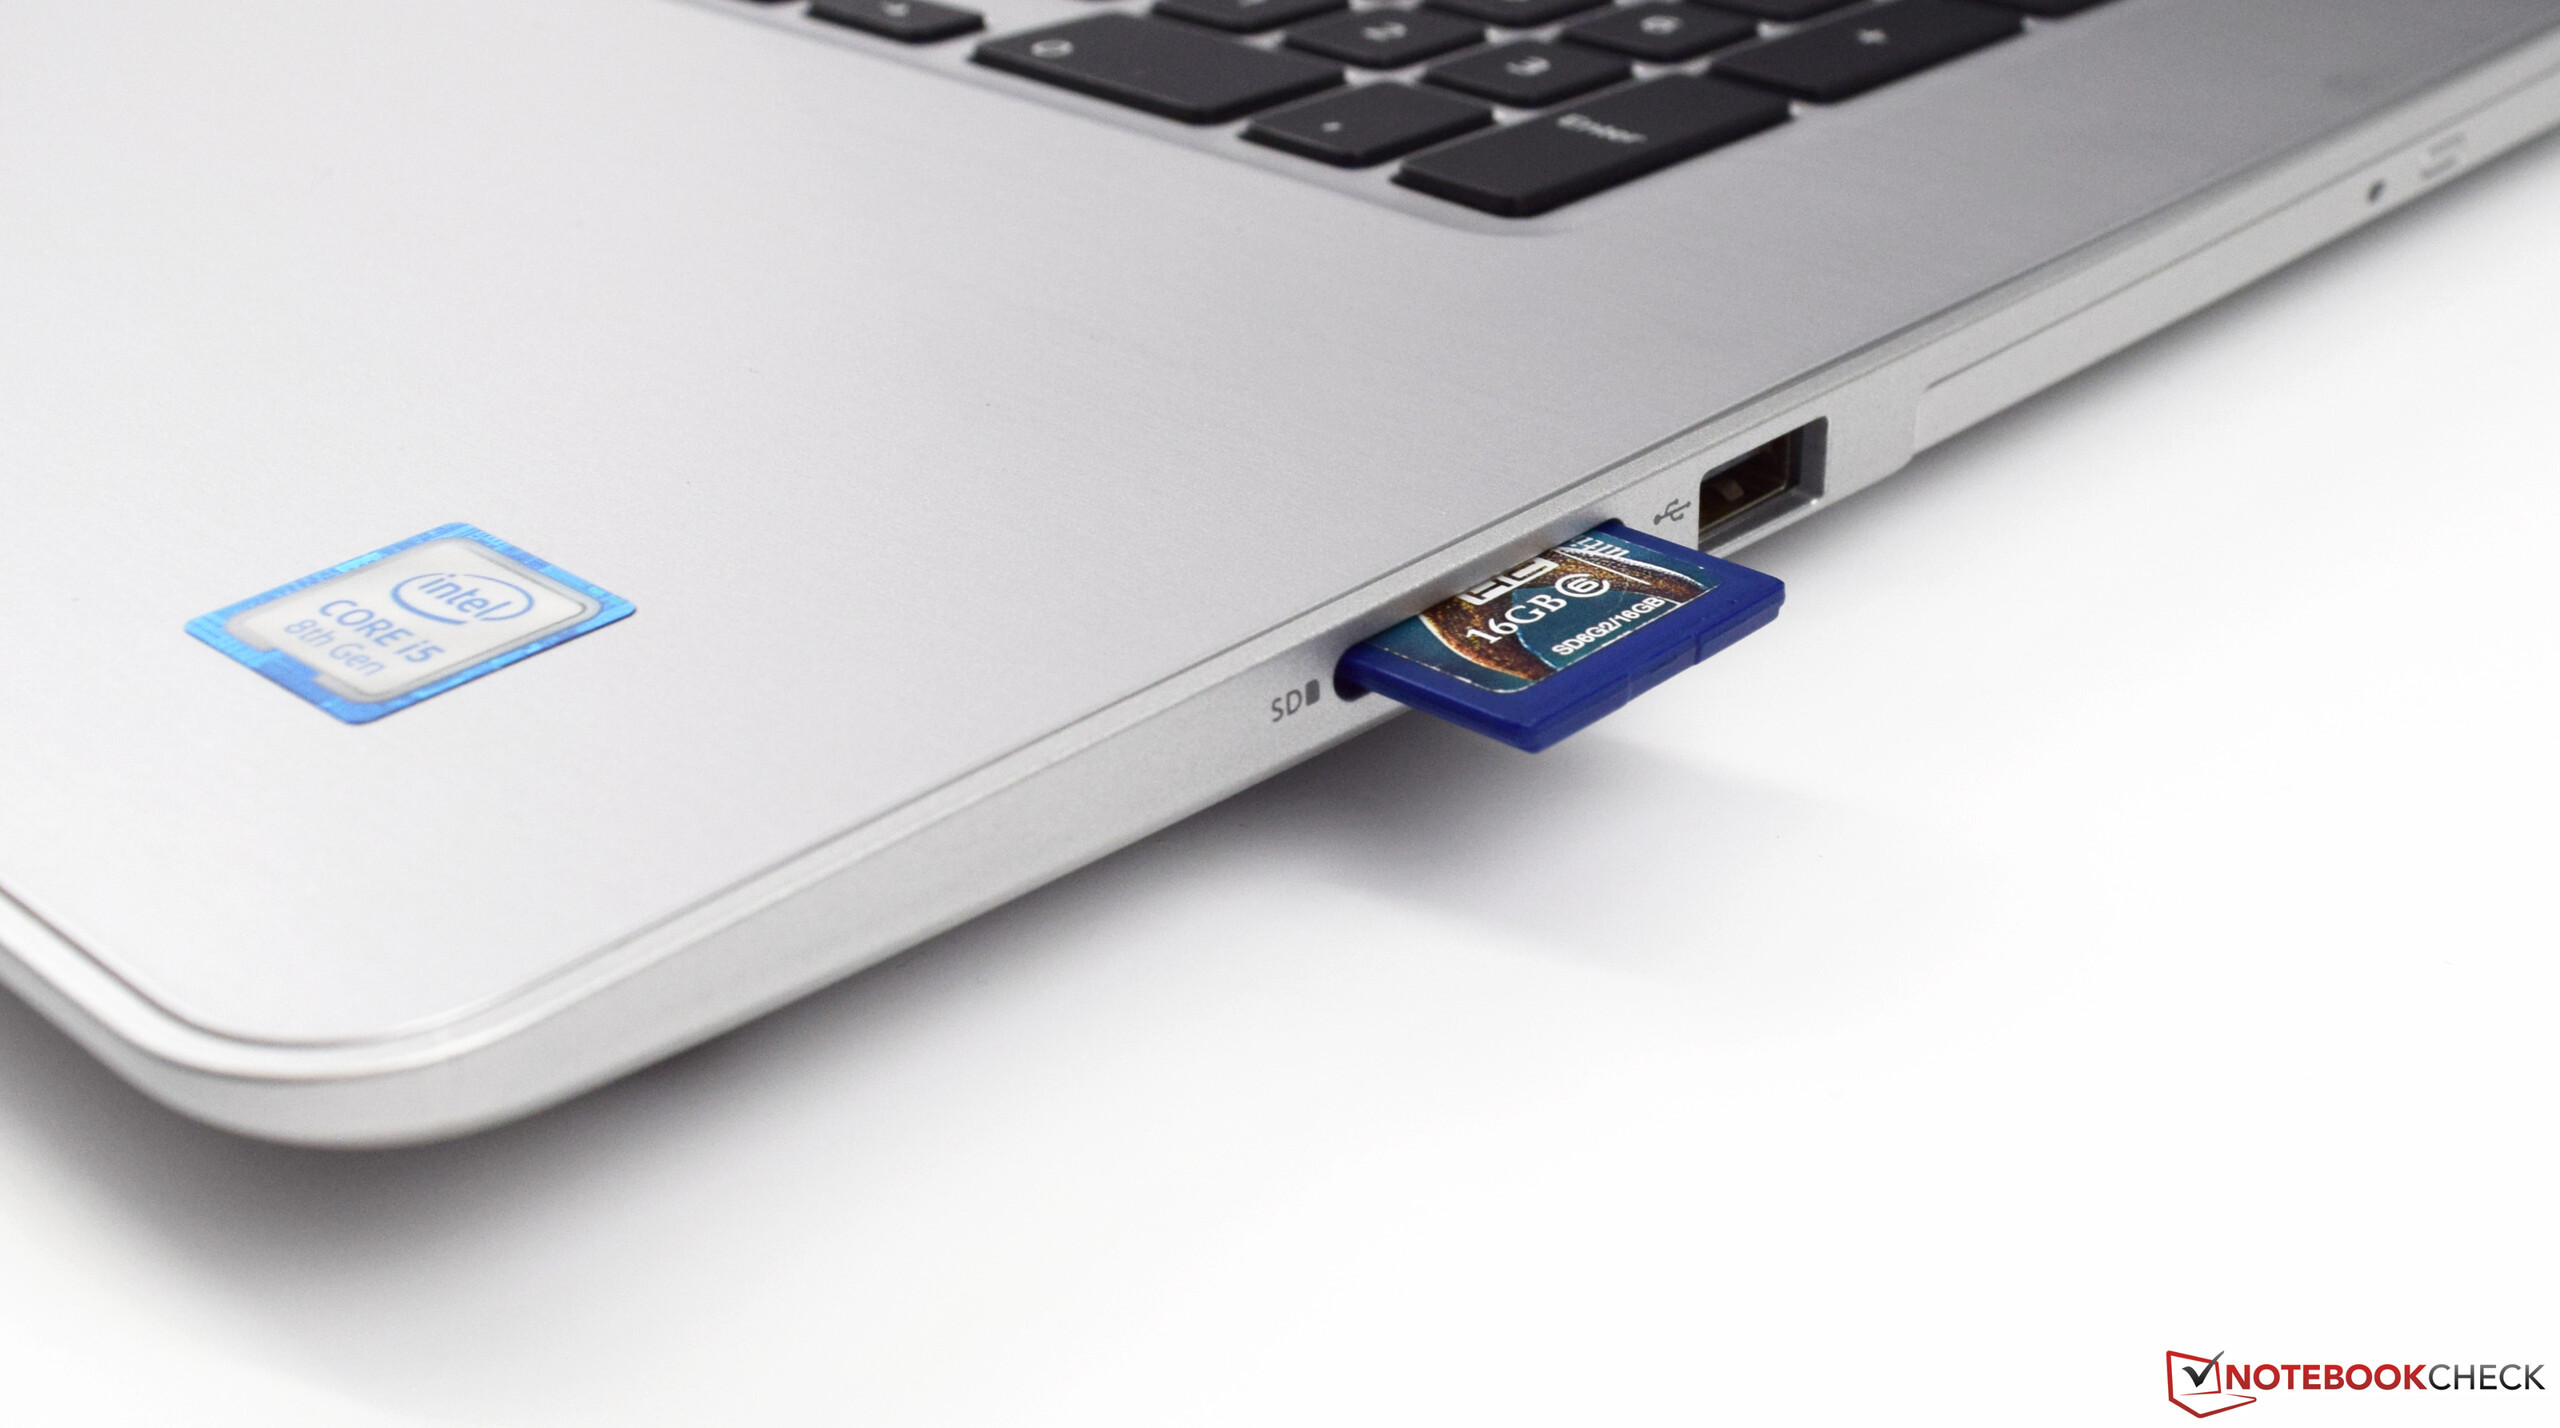
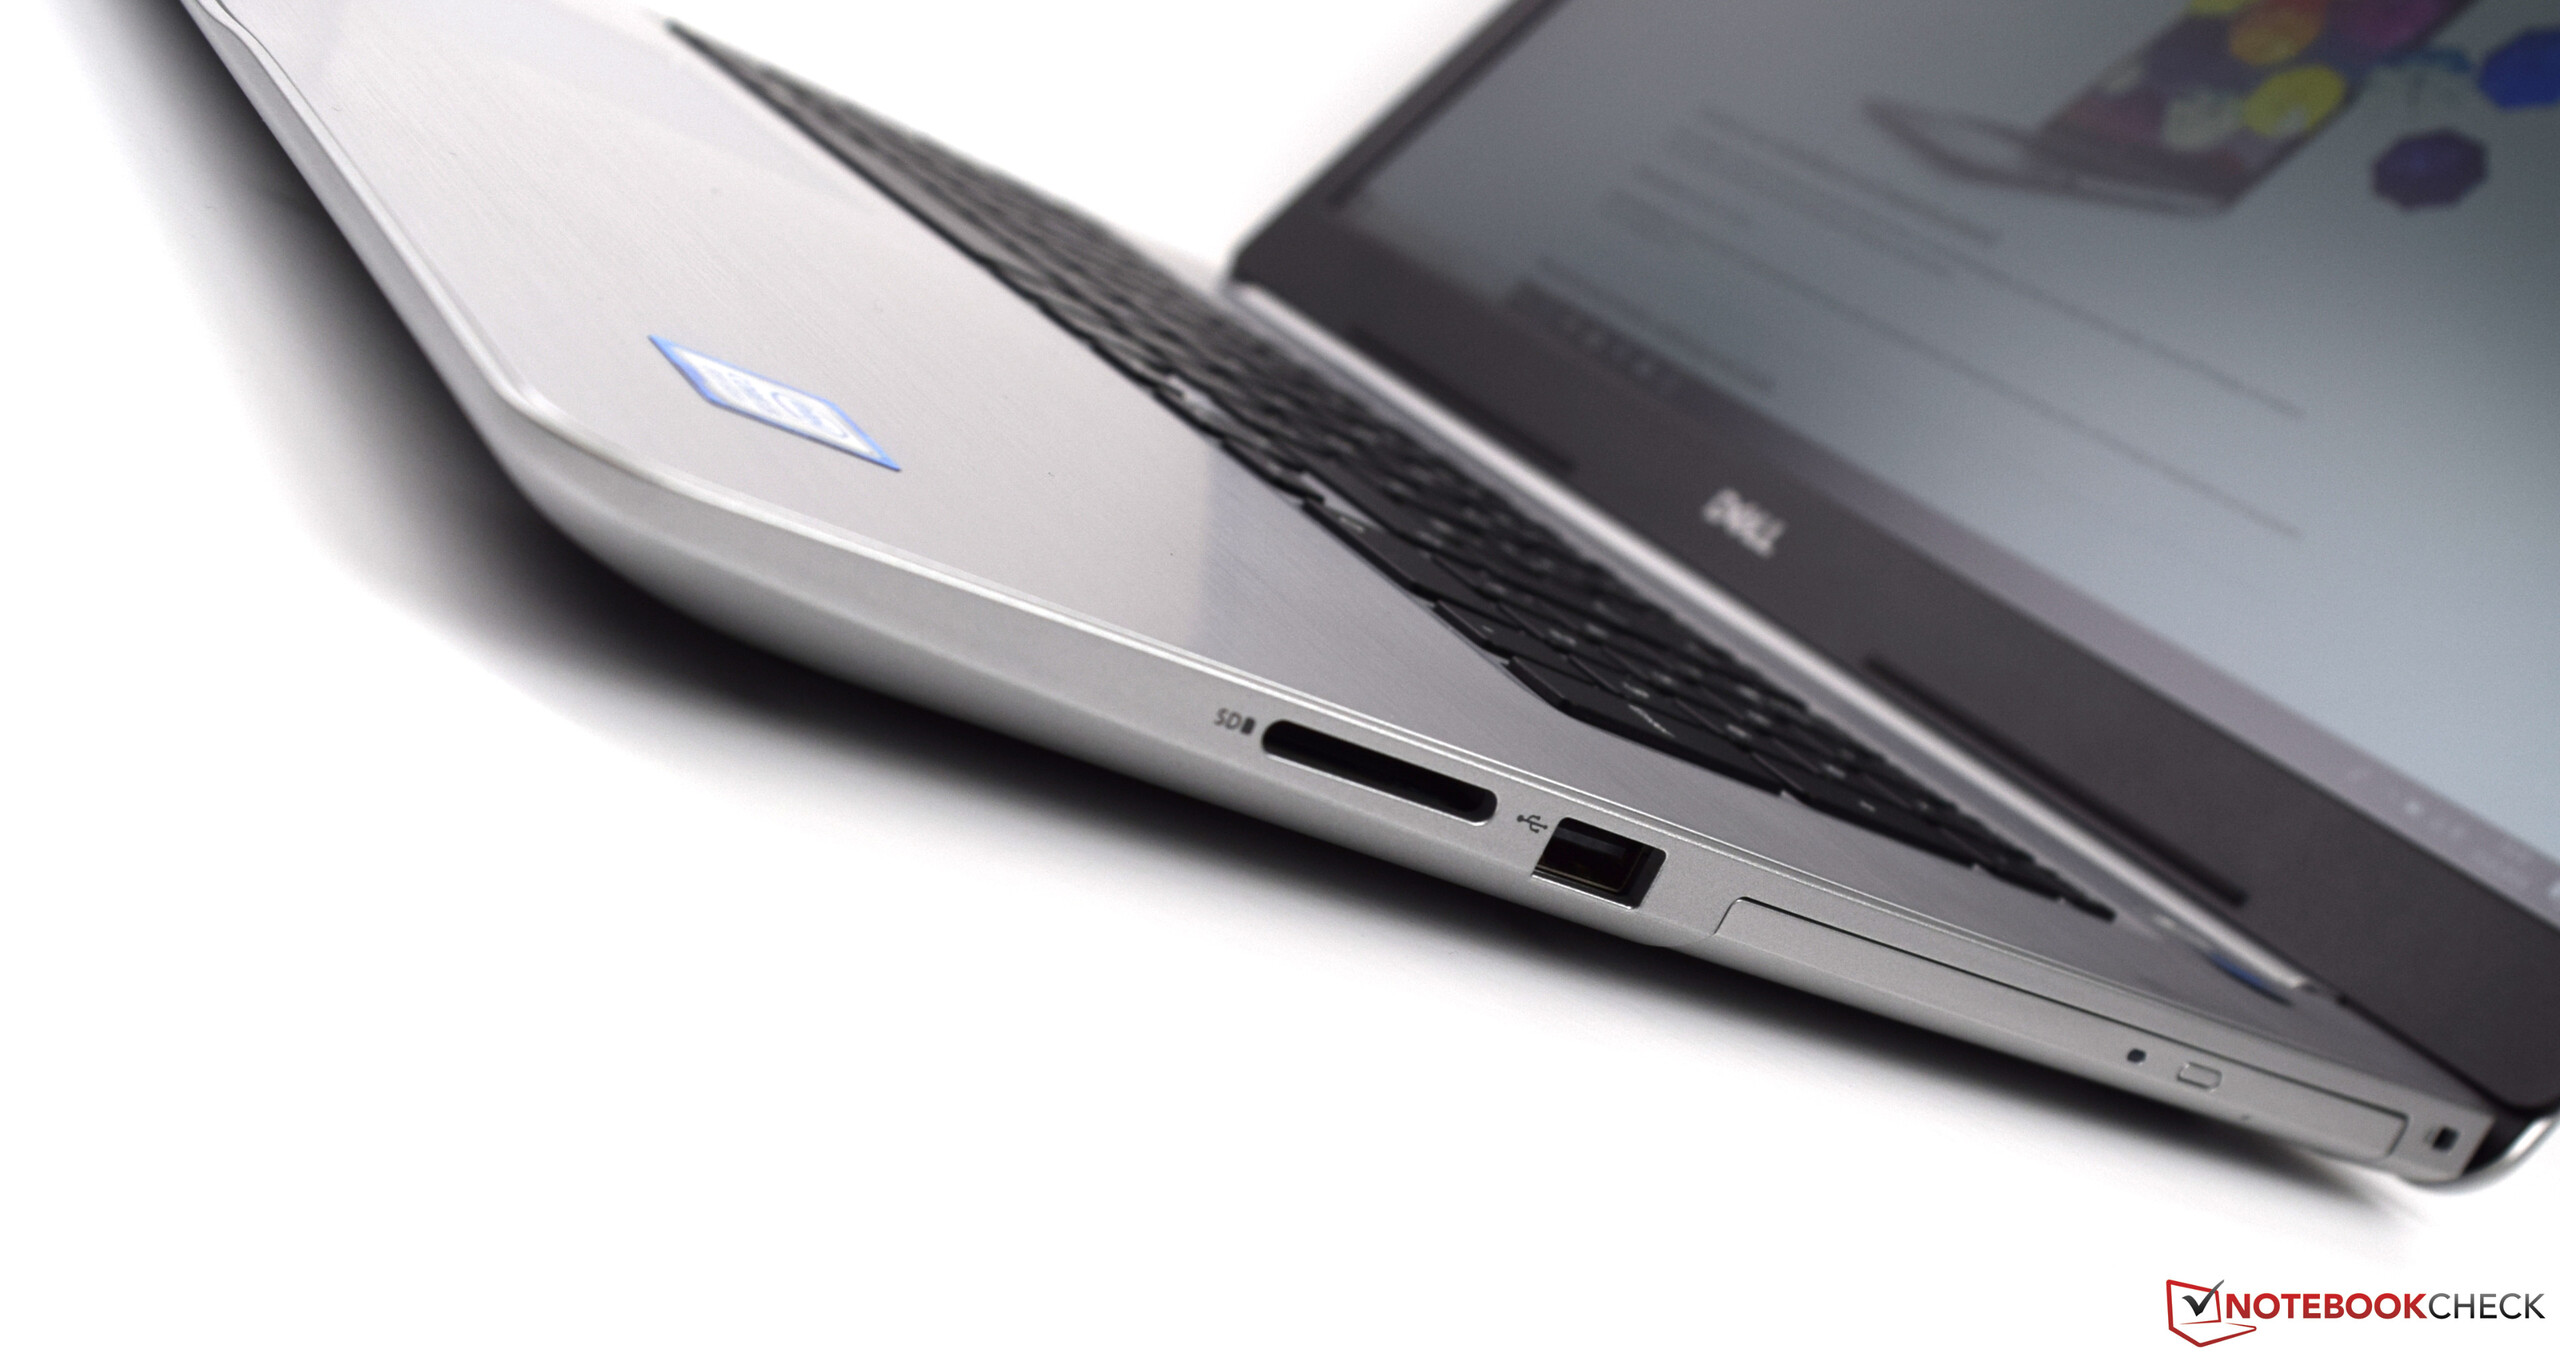
| SD Card Reader | |
| average JPG Copy Test (av. of 3 runs) | |
| HP Omen 17-w206ng (Toshiba Exceria Pro SDXC 64 GB UHS-II) | |
| Acer Aspire 5 A517-51G-80L (Toshiba Exceria Pro SDXC 64 GB UHS-II) | |
| Acer Aspire F5-771G-50RD (Toshiba Exceria Pro SDXC 64 GB UHS-II) | |
| Acer Swift 3 SF315-41-R4W1 | |
| HP Pavilion 17z 1EX13AV (Toshiba Exceria Pro SDXC 64 GB UHS-II) | |
| Dell Inspiron 17-7773-0043 (Toshiba Exceria Pro SDXC 64 GB UHS-II) | |
| Dell Inspiron 17-5770-0357 (Toshiba Exceria Pro SDXC 64 GB UHS-II) | |
| maximum AS SSD Seq Read Test (1GB) | |
| Acer Aspire F5-771G-50RD (Toshiba Exceria Pro SDXC 64 GB UHS-II) | |
| HP Omen 17-w206ng (Toshiba Exceria Pro SDXC 64 GB UHS-II) | |
| Acer Aspire 5 A517-51G-80L (Toshiba Exceria Pro SDXC 64 GB UHS-II) | |
| HP Pavilion 17z 1EX13AV (Toshiba Exceria Pro SDXC 64 GB UHS-II) | |
| Acer Swift 3 SF315-41-R4W1 | |
| Dell Inspiron 17-7773-0043 (Toshiba Exceria Pro SDXC 64 GB UHS-II) | |
| Dell Inspiron 17-5770-0357 (Toshiba Exceria Pro SDXC 64 GB UHS-II) | |
| |||||||||||||||||||||||||
iluminação: 85 %
iluminação com acumulador: 279 cd/m²
Contraste: 1550:1 (Preto: 0.18 cd/m²)
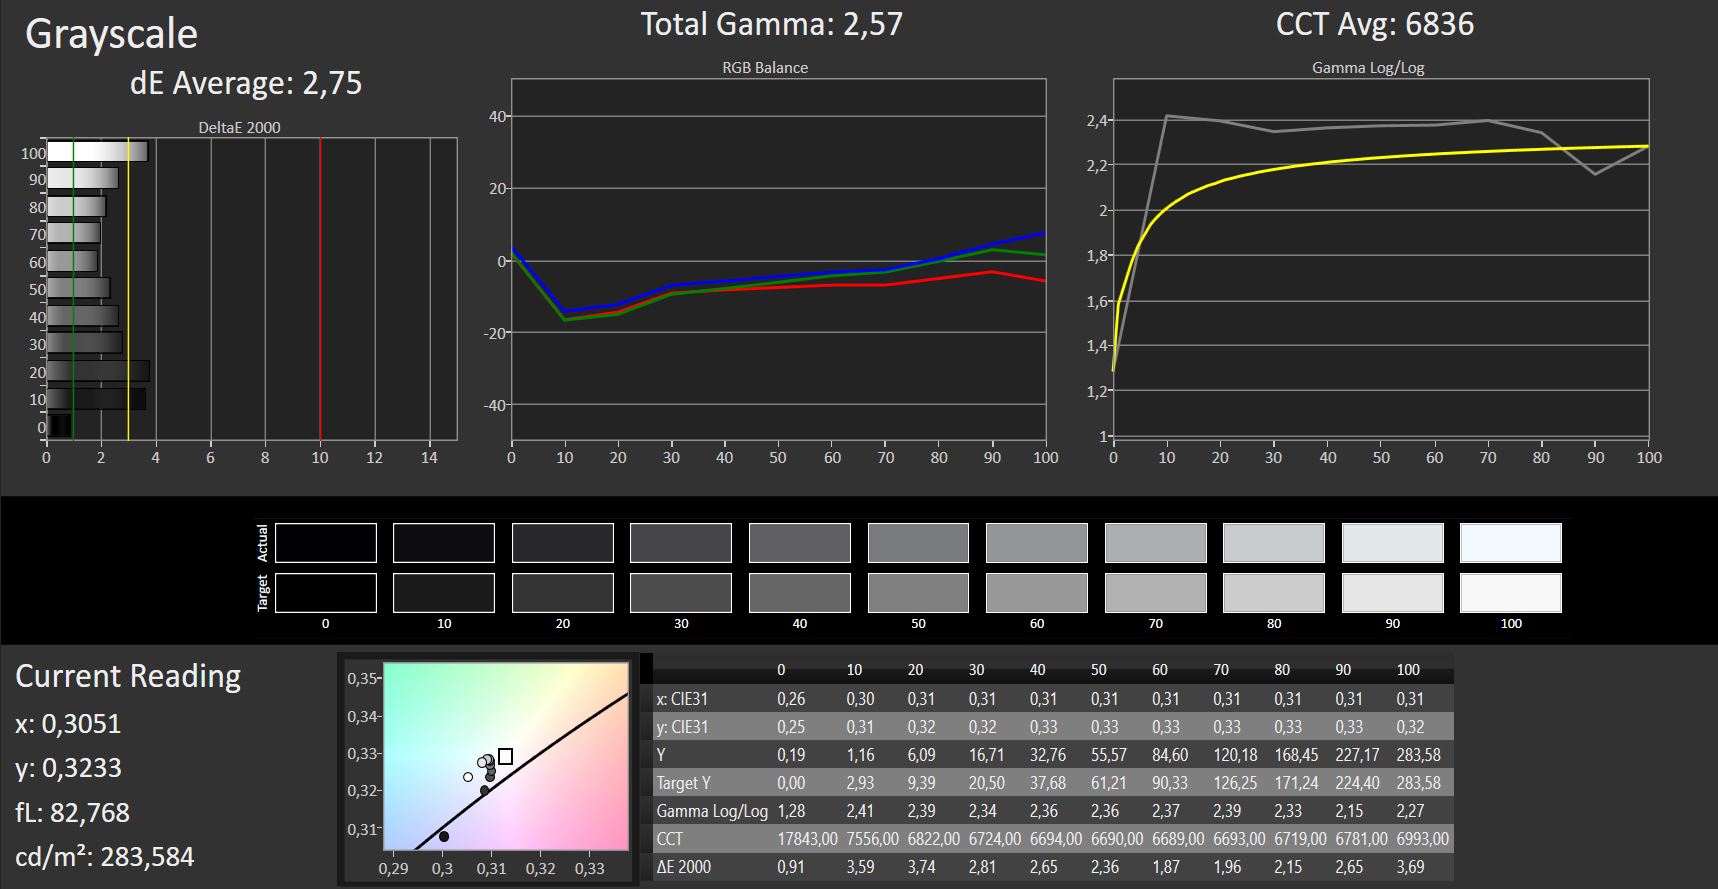
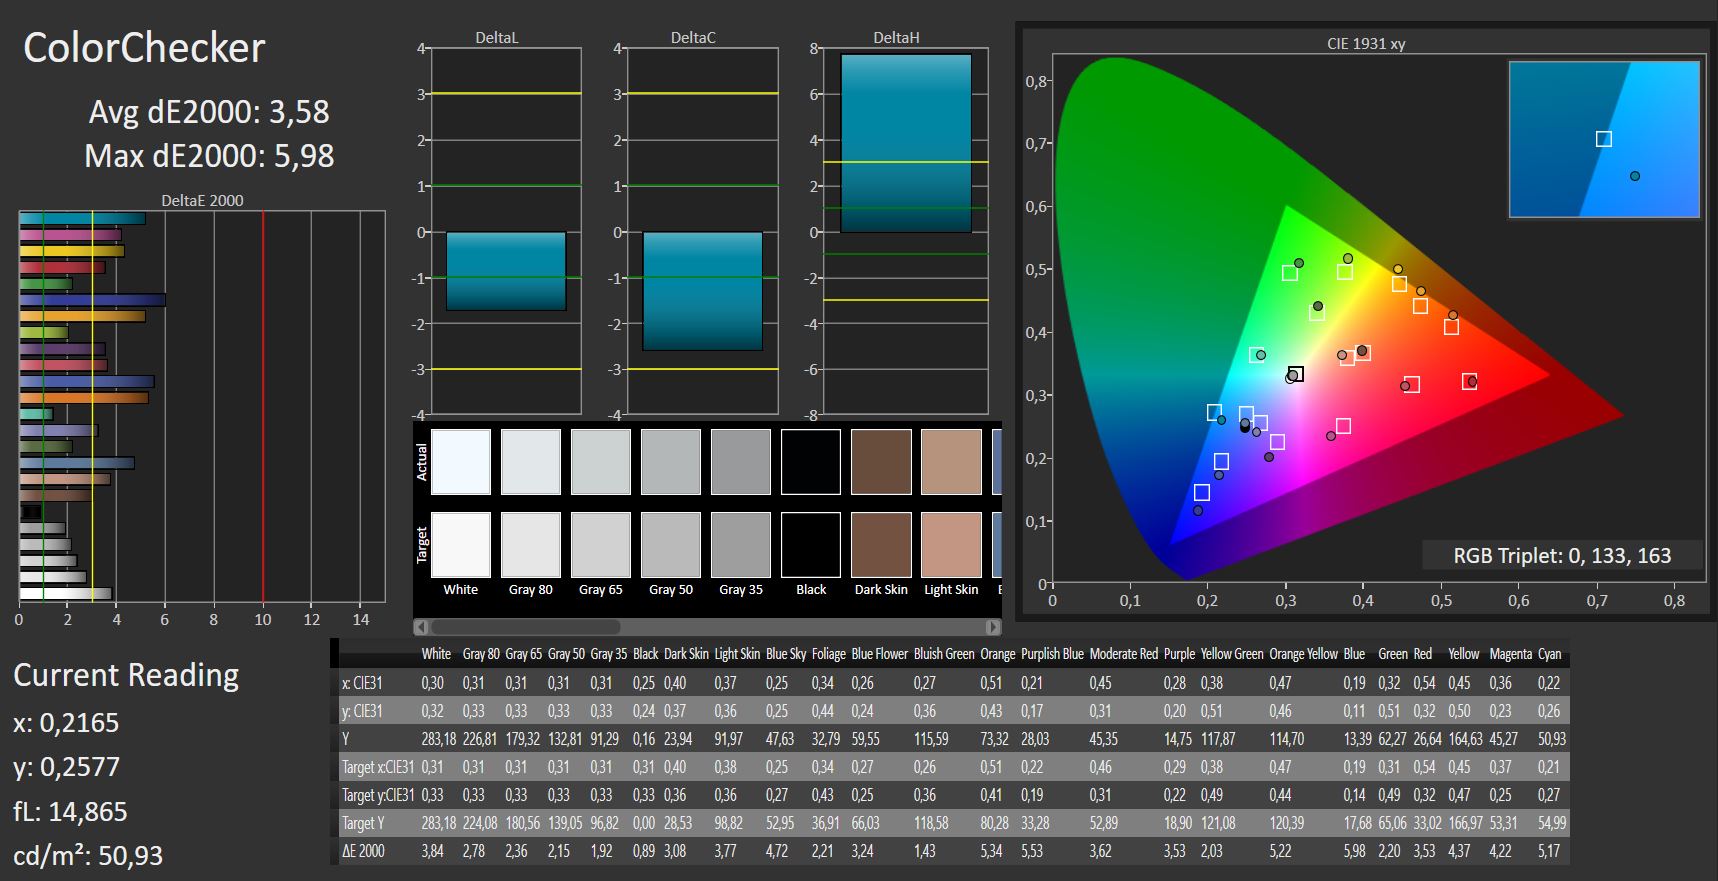
ΔE ColorChecker Calman: 3.58 | ∀{0.5-29.43 Ø4.71}
ΔE Greyscale Calman: 2.75 | ∀{0.09-98 Ø4.96}
88% sRGB (Argyll 1.6.3 3D)
58% AdobeRGB 1998 (Argyll 1.6.3 3D)
64.8% AdobeRGB 1998 (Argyll 3D)
88.7% sRGB (Argyll 3D)
63.9% Display P3 (Argyll 3D)
Gamma: 2.57
CCT: 6836 K
| Dell Inspiron 17-5770-0357 AUO109D (AU Optronics), 1920x1080, 17.3" | Dell Inspiron 17-7773-0043 Chi Mei CMN1738, 1920x1080, 17.3" | Acer Aspire 5 A517-51G-80L LG Display, LP173WF4-SPF5, 1920x1080, 17.3" | HP Pavilion 17z 1EX13AV ID: AUO109D, Name: AU Optronics B173HW01 V0, 1920x1080, 17.3" | HP Omen 17-w206ng Chi Mei CMN1738, 1920x1080, 17.3" | Acer Aspire F5-771G-50RD AU Optronics B173HTN01.1, 1920x1080, 17.3" | |
|---|---|---|---|---|---|---|
| Display | 4% | -2% | 0% | 5% | 5% | |
| Display P3 Coverage (%) | 63.9 | 67.4 5% | 66.3 4% | 64.3 1% | 67.2 5% | 69.7 9% |
| sRGB Coverage (%) | 88.7 | 91.9 4% | 84.2 -5% | 88.5 0% | 93.1 5% | 91.2 3% |
| AdobeRGB 1998 Coverage (%) | 64.8 | 67.2 4% | 61.6 -5% | 64.6 0% | 67.4 4% | 66.8 3% |
| Response Times | -9% | -16% | -7% | -2% | 2% | |
| Response Time Grey 50% / Grey 80% * (ms) | 38 ? | 40 ? -5% | 41 ? -8% | 40.8 ? -7% | 38 ? -0% | 43 ? -13% |
| Response Time Black / White * (ms) | 25 ? | 28 ? -12% | 31 ? -24% | 26.4 ? -6% | 26 ? -4% | 21 ? 16% |
| PWM Frequency (Hz) | 1000 ? | 122000 ? | 200 ? | 1000 ? | ||
| Screen | -20% | -6% | -15% | -19% | -77% | |
| Brightness middle (cd/m²) | 279 | 323 16% | 397 42% | 333.5 20% | 318 14% | 339 22% |
| Brightness (cd/m²) | 262 | 290 11% | 364 39% | 323 23% | 295 13% | 315 20% |
| Brightness Distribution (%) | 85 | 77 -9% | 84 -1% | 91 7% | 79 -7% | 84 -1% |
| Black Level * (cd/m²) | 0.18 | 0.21 -17% | 0.29 -61% | 0.32 -78% | 0.25 -39% | 0.35 -94% |
| Contrast (:1) | 1550 | 1538 -1% | 1369 -12% | 1042 -33% | 1272 -18% | 969 -37% |
| Colorchecker dE 2000 * | 3.58 | 4.88 -36% | 3.88 -8% | 4 -12% | 4.7 -31% | 10.4 -191% |
| Colorchecker dE 2000 max. * | 5.98 | 8.86 -48% | 8.22 -37% | 6.9 -15% | 8.8 -47% | 15.96 -167% |
| Greyscale dE 2000 * | 2.75 | 6.21 -126% | 3.1 -13% | 4.5 -64% | 5 -82% | 11.67 -324% |
| Gamma | 2.57 86% | 2.36 93% | 2.59 85% | 2.19 100% | 2.28 96% | 2.32 95% |
| CCT | 6836 95% | 6620 98% | 6570 99% | 6386 102% | 7374 88% | 13081 50% |
| Color Space (Percent of AdobeRGB 1998) (%) | 58 | 60 3% | 55 -5% | 57.5 -1% | 61 5% | 60 3% |
| Color Space (Percent of sRGB) (%) | 88 | 92 5% | 84 -5% | 88.1 0% | 93 6% | 91 3% |
| Média Total (Programa/Configurações) | -8% /
-14% | -8% /
-7% | -7% /
-11% | -5% /
-12% | -23% /
-50% |
* ... menor é melhor
Exibir tempos de resposta
| ↔ Tempo de resposta preto para branco | ||
|---|---|---|
| 25 ms ... ascensão ↗ e queda ↘ combinadas | ↗ 14 ms ascensão | 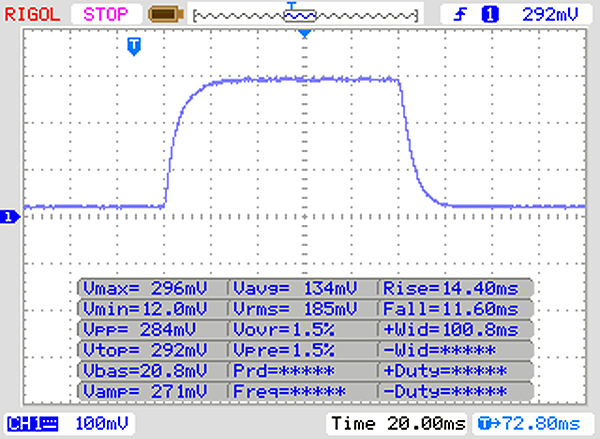 |
| ↘ 11 ms queda | ||
| A tela mostra taxas de resposta relativamente lentas em nossos testes e pode ser muito lenta para os jogadores. Em comparação, todos os dispositivos testados variam de 0.1 (mínimo) a 240 (máximo) ms. » 59 % de todos os dispositivos são melhores. Isso significa que o tempo de resposta medido é pior que a média de todos os dispositivos testados (19.8 ms). | ||
| ↔ Tempo de resposta 50% cinza a 80% cinza | ||
| 38 ms ... ascensão ↗ e queda ↘ combinadas | ↗ 20 ms ascensão | 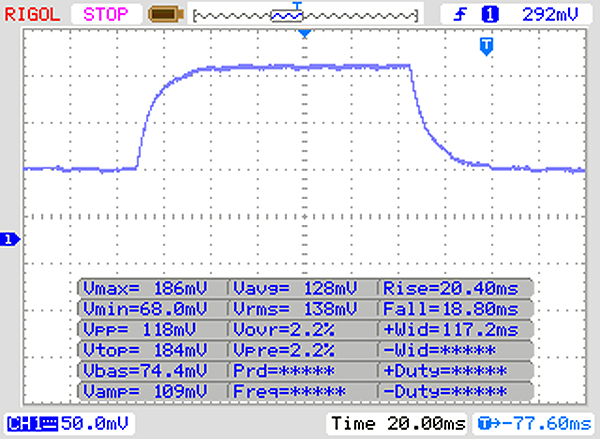 |
| ↘ 18 ms queda | ||
| A tela mostra taxas de resposta lentas em nossos testes e será insatisfatória para os jogadores. Em comparação, todos os dispositivos testados variam de 0.165 (mínimo) a 636 (máximo) ms. » 55 % de todos os dispositivos são melhores. Isso significa que o tempo de resposta medido é pior que a média de todos os dispositivos testados (31 ms). | ||
Cintilação da tela / PWM (modulação por largura de pulso)
| Tela tremeluzindo / PWM não detectado | ||
[pwm_comparison] Em comparação: 52 % de todos os dispositivos testados não usam PWM para escurecer a tela. Se PWM foi detectado, uma média de 7754 (mínimo: 5 - máximo: 343500) Hz foi medida. | ||
| JetStream 1.1 - 1.1 Total | |
| Acer Aspire 5 A517-51G-80L | |
| HP Omen 17-w206ng | |
| Acer Swift 3 SF315-41-R4W1 | |
| Acer Aspire F5-771G-50RD | |
| HP Pavilion 17z 1EX13AV | |
| Octane V2 - Total Score | |
| Acer Aspire 5 A517-51G-80L | |
| Acer Aspire F5-771G-50RD | |
| Acer Swift 3 SF315-41-R4W1 | |
| HP Pavilion 17z 1EX13AV | |
| Mozilla Kraken 1.1 - Total | |
| Acer Aspire F5-771G-50RD | |
| Acer Aspire 5 A517-51G-80L | |
* ... menor é melhor
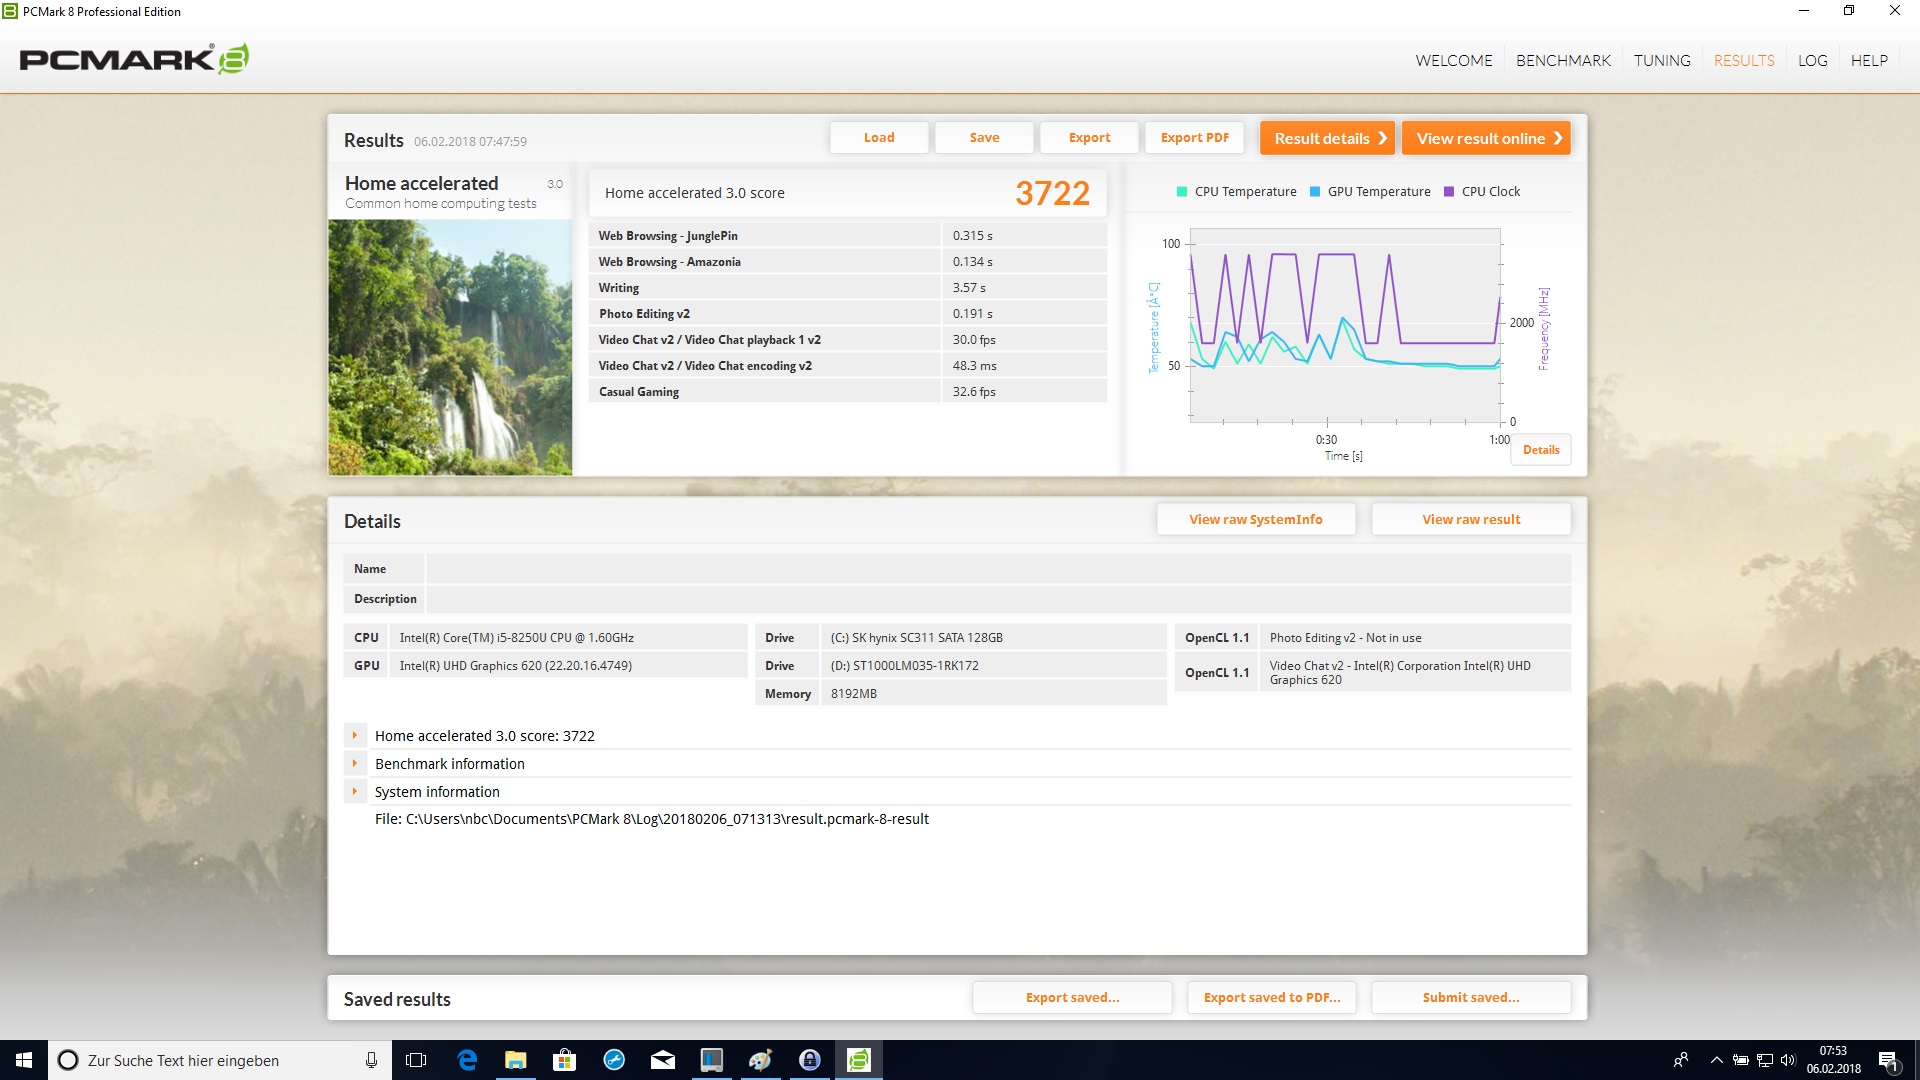
| PCMark 8 Home Score Accelerated v2 | 3722 pontos | |
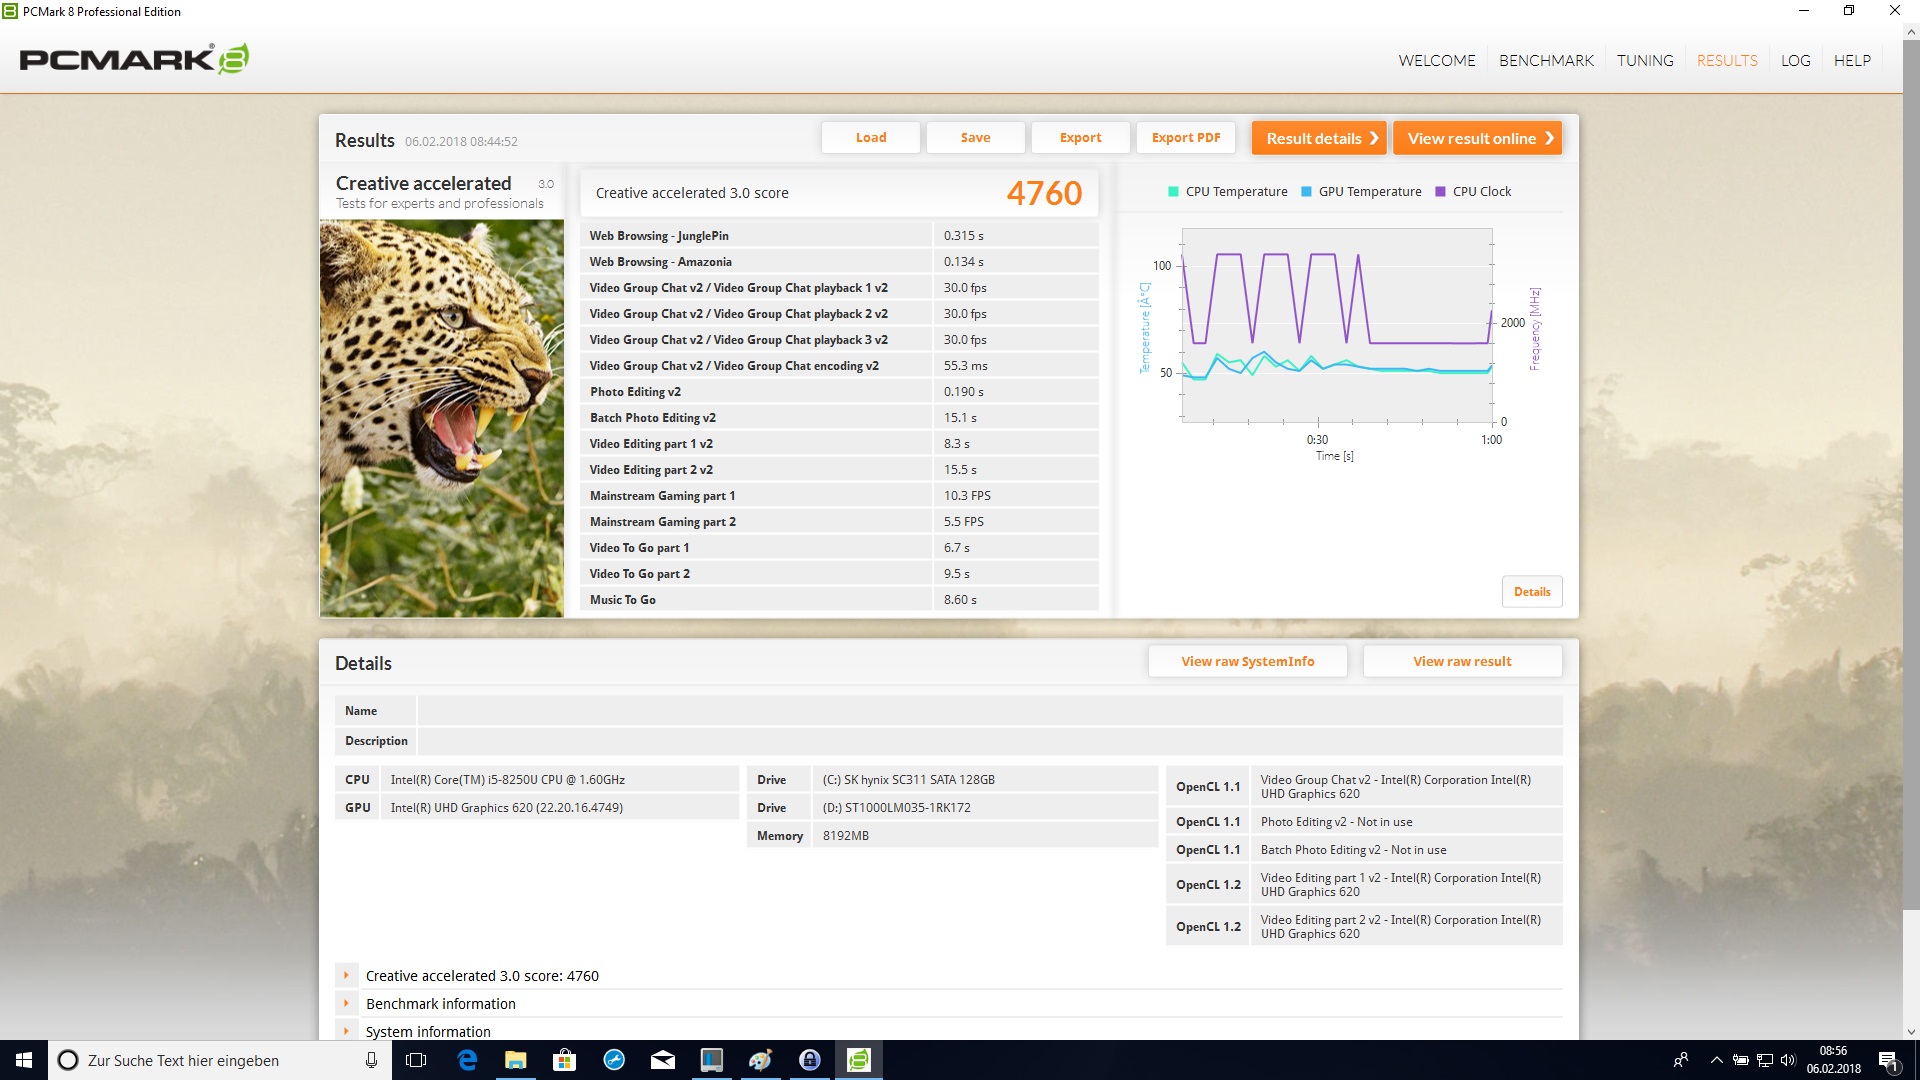
| PCMark 8 Creative Score Accelerated v2 | 4760 pontos | |
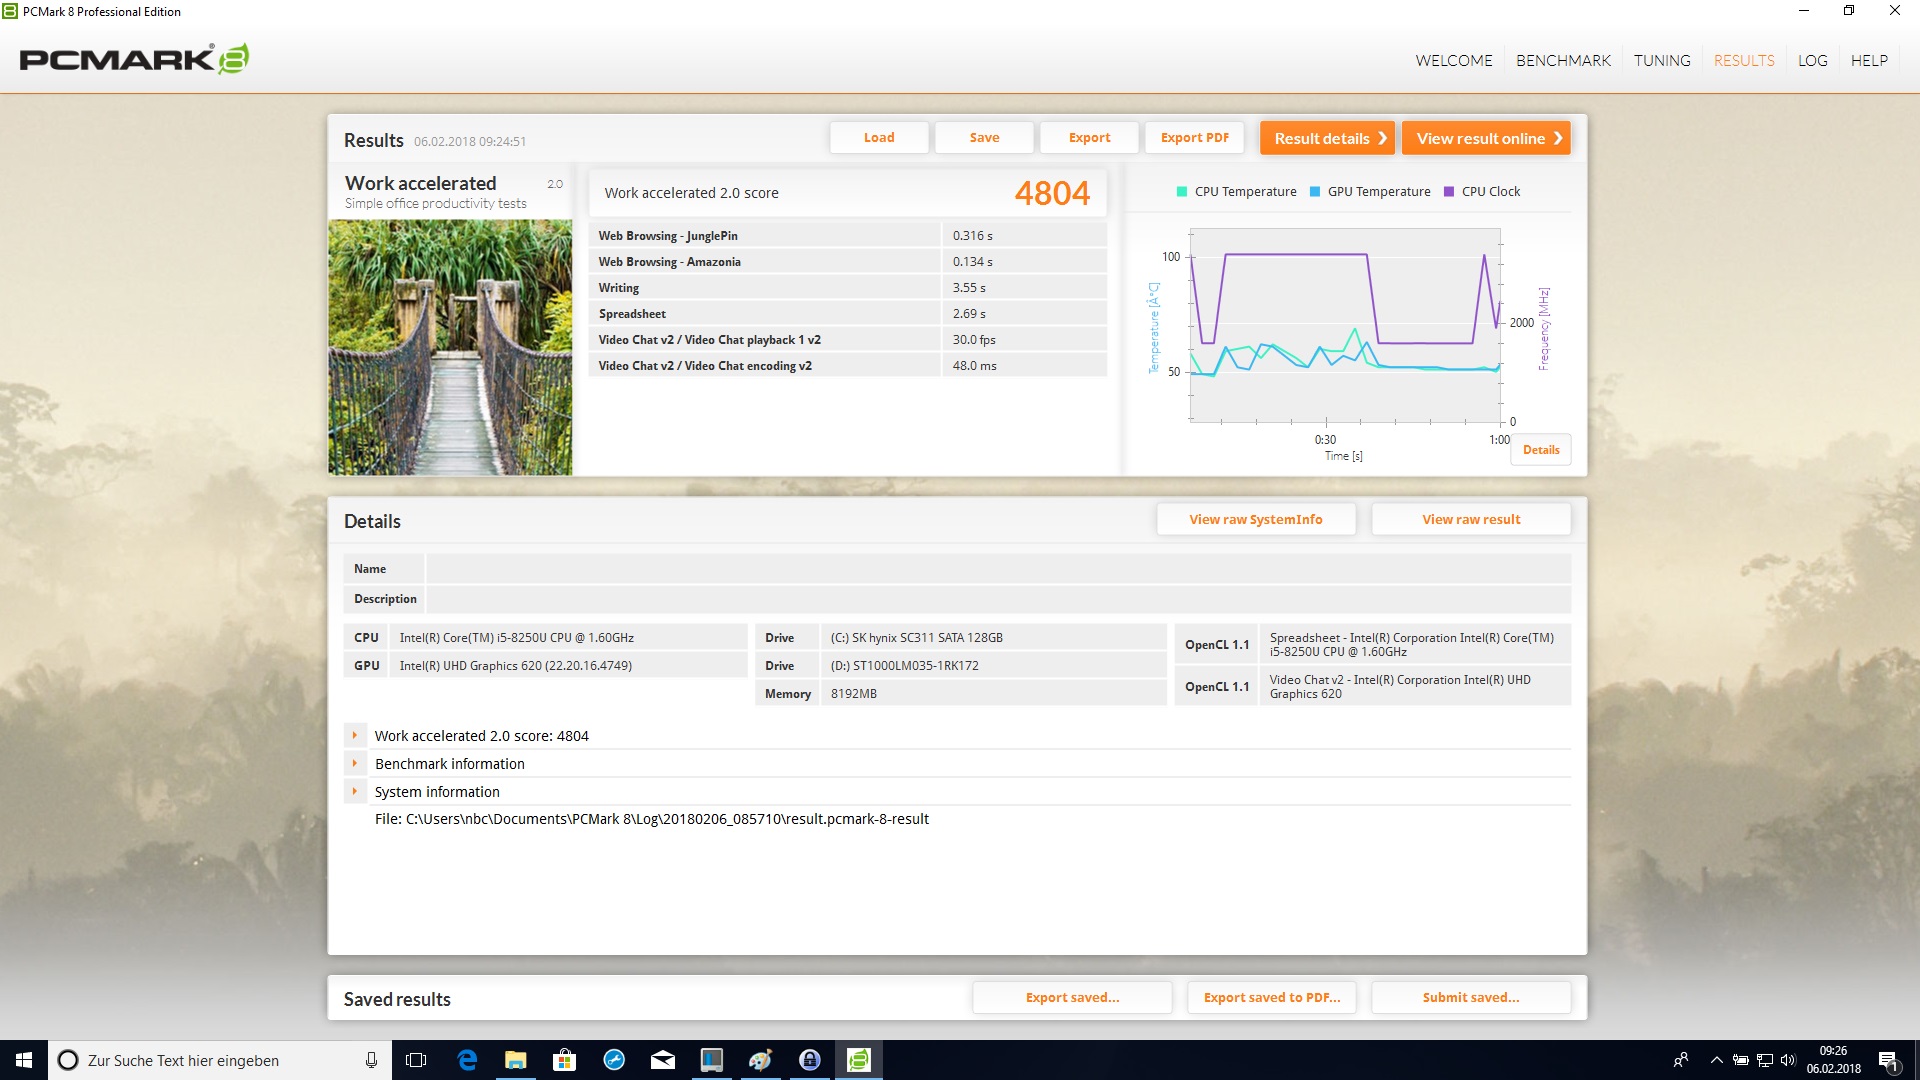
| PCMark 8 Work Score Accelerated v2 | 4804 pontos | |
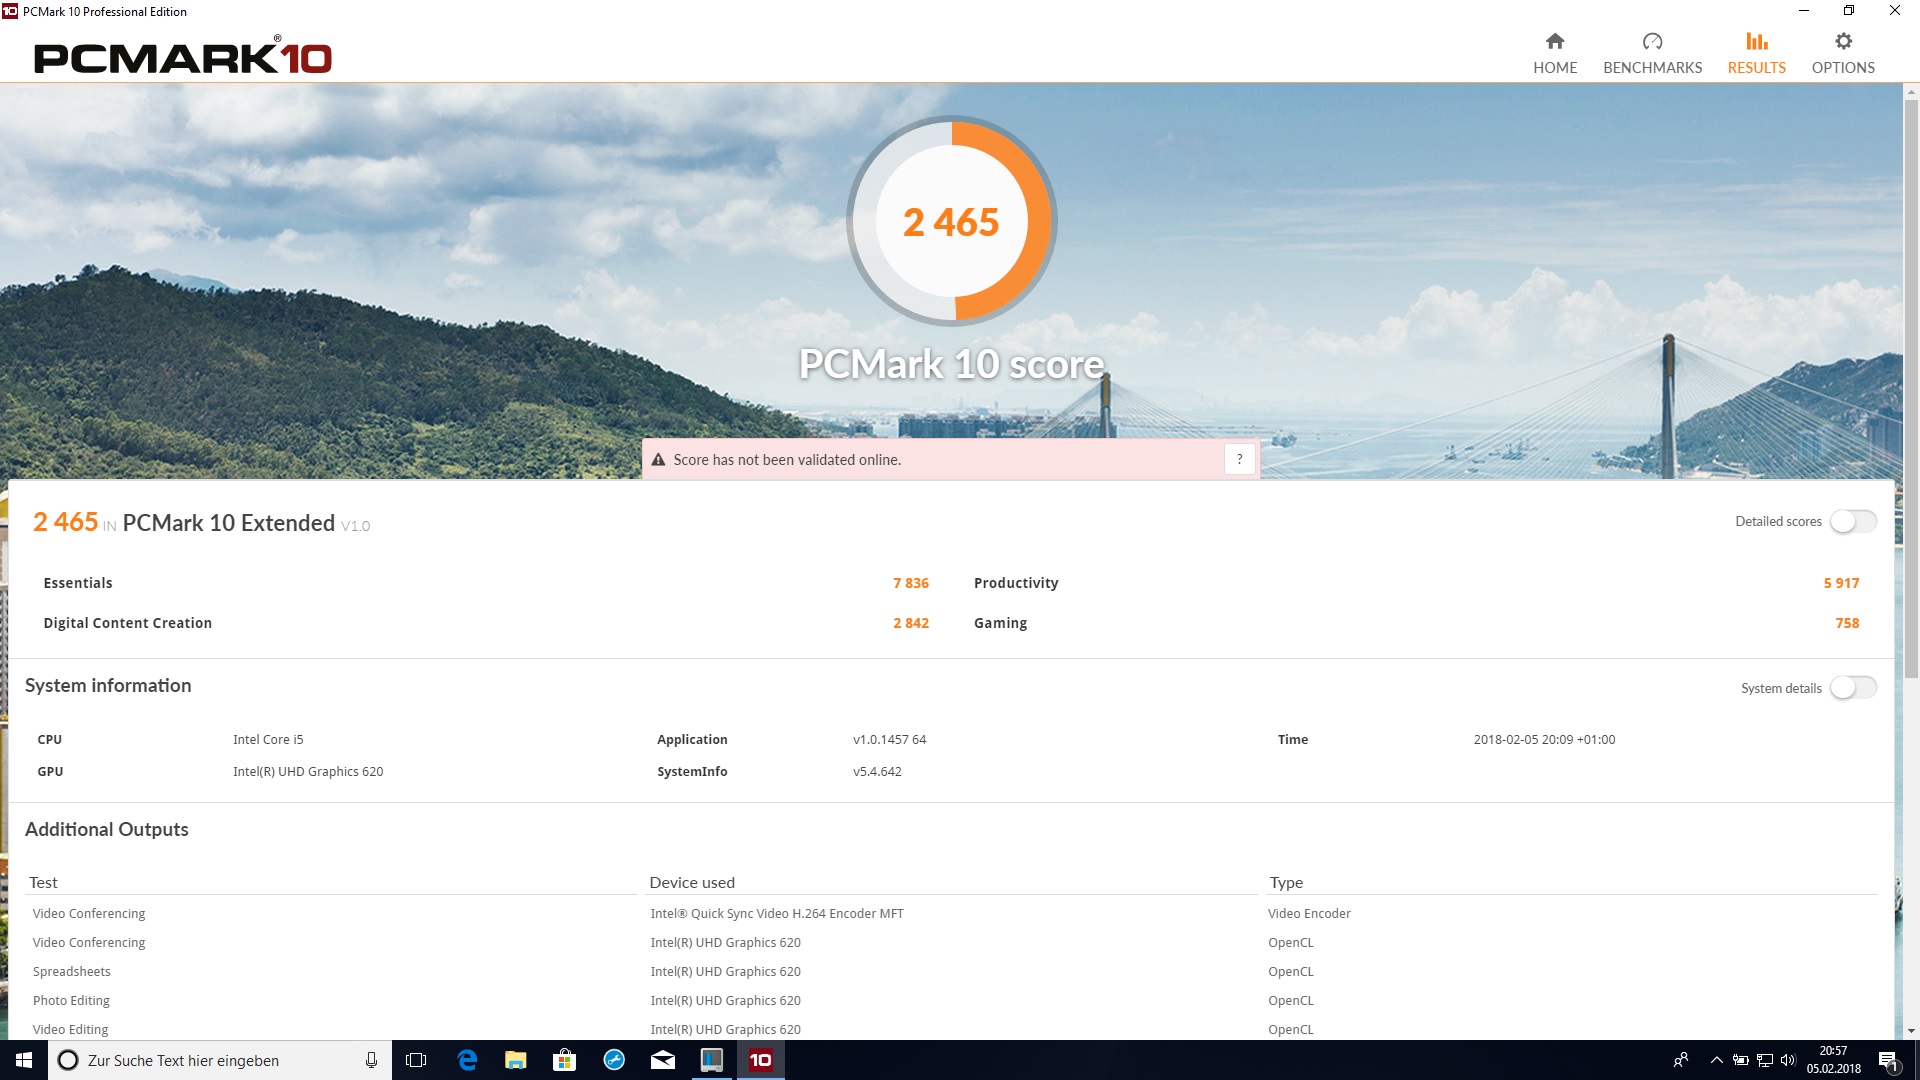
| PCMark 10 Score | 2465 pontos | |
Ajuda | ||
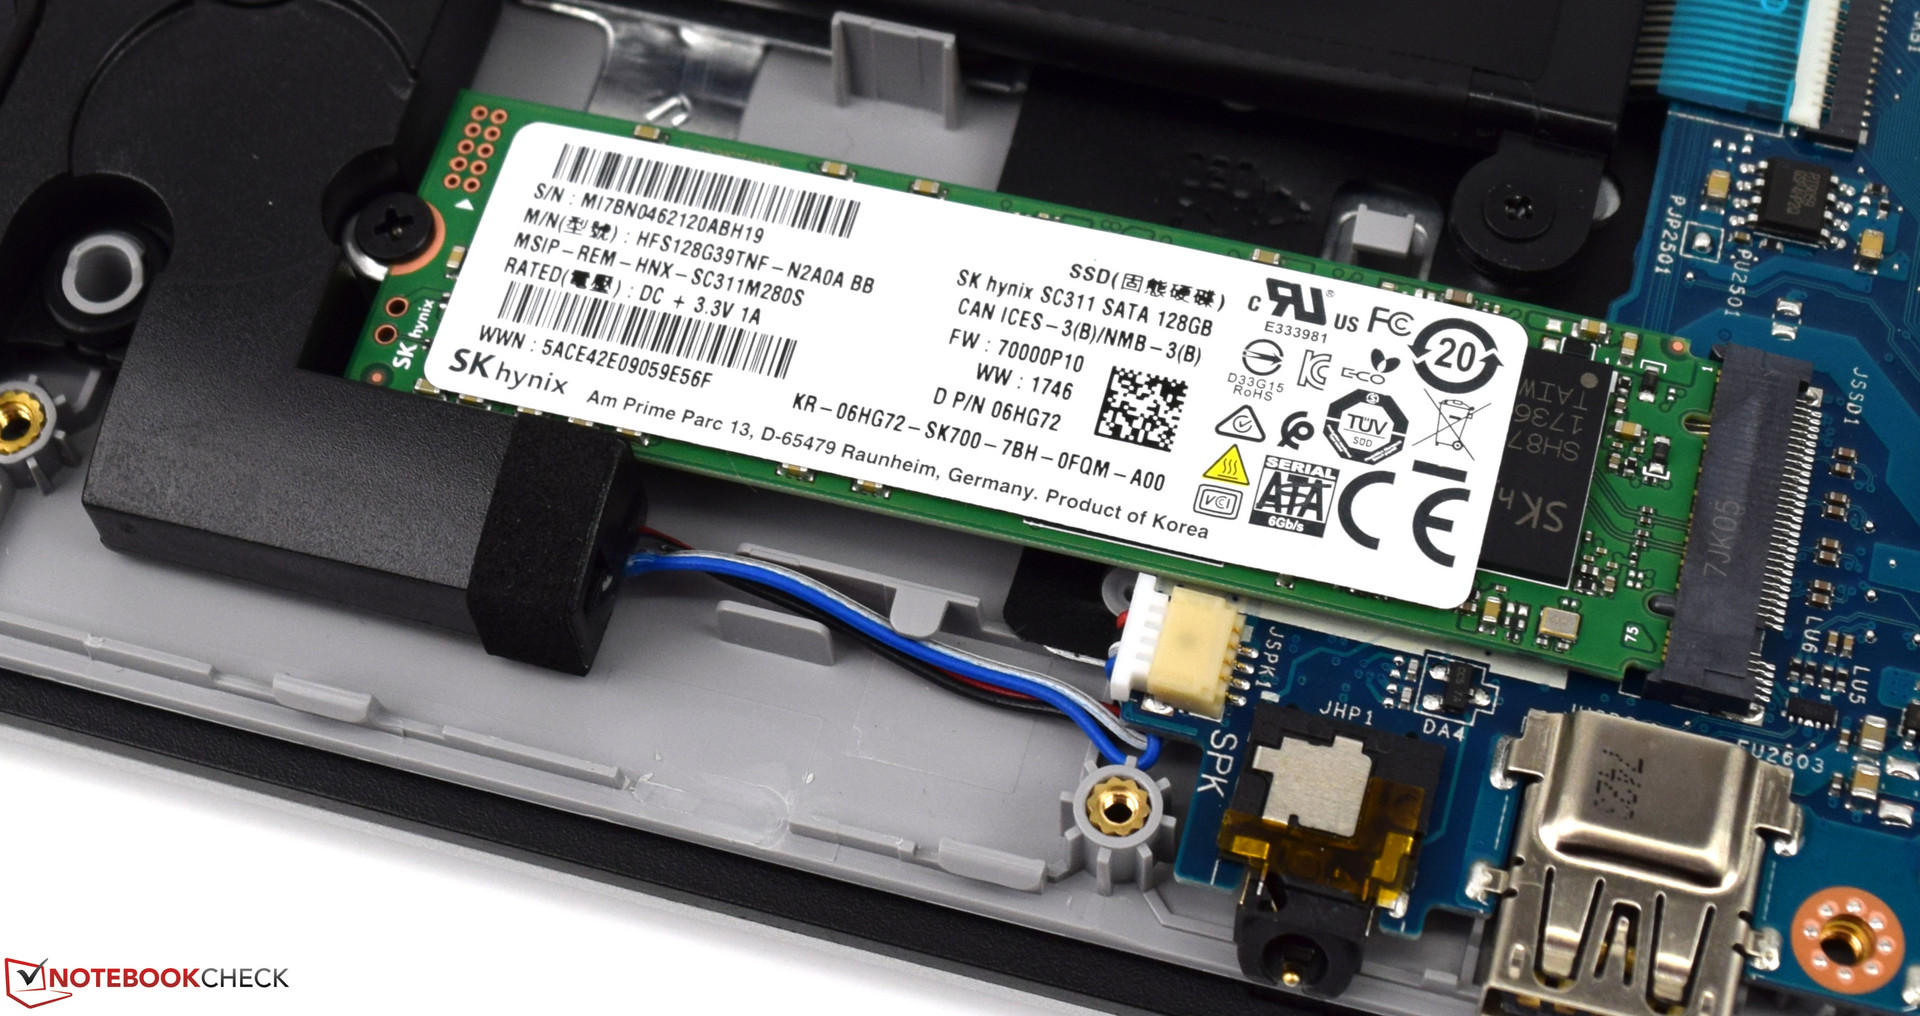
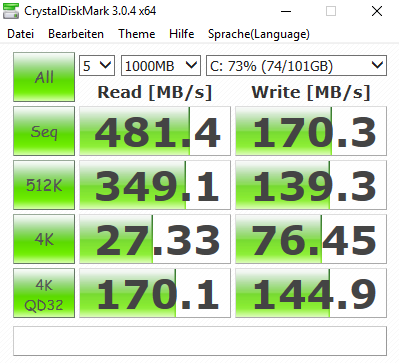
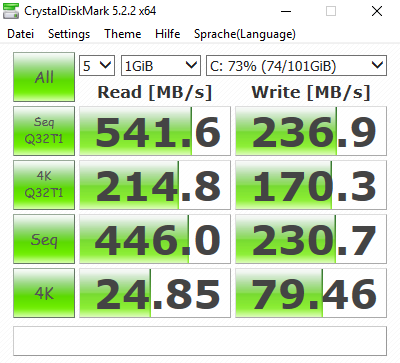
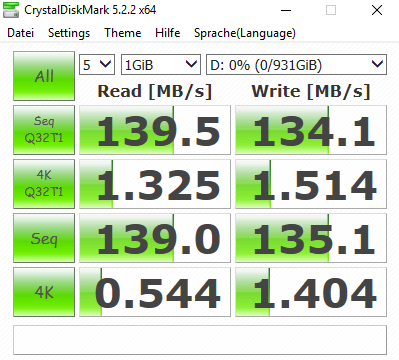
| Dell Inspiron 17-5770-0357 SK hynix SC311 M.2 | Acer Aspire 5 A517-51G-80L Micron 1100 MTFDDAV256TBN | HP Pavilion 17z 1EX13AV WDC Scorpio Blue WD10JPVX-60JC3T1 | HP Omen 17-w206ng Samsung PM961 MZVLW256HEHP | Acer Aspire F5-771G-50RD Toshiba MQ01ABD100 | Acer Swift 3 SF315-41-R4W1 Intel SSD 600p SSDPEKKW256G7 | |
|---|---|---|---|---|---|---|
| CrystalDiskMark 3.0 | 43% | -85% | 270% | -86% | 111% | |
| Read Seq (MB/s) | 481.4 | 480.1 0% | 90 -81% | 1606 234% | 107.1 -78% | 1130 135% |
| Write Seq (MB/s) | 170.3 | 385.6 126% | 90.3 -47% | 1176 591% | 103.1 -39% | 601 253% |
| Read 512 (MB/s) | 349.1 | 295.6 -15% | 28.47 -92% | 846 142% | 28.89 -92% | 837 140% |
| Write 512 (MB/s) | 139.3 | 302.5 117% | 47.07 -66% | 805 478% | 27.34 -80% | 606 335% |
| Read 4k (MB/s) | 27.33 | 27.58 1% | 0.31 -99% | 59.9 119% | 0.331 -99% | 20.46 -25% |
| Write 4k (MB/s) | 76.4 | 81.4 7% | 0.3997 -99% | 155.6 104% | 0.831 -99% | 81.7 7% |
| Read 4k QD32 (MB/s) | 170.1 | 247.4 45% | 1.021 -99% | 588 246% | 0.666 -100% | 235.5 38% |
| Write 4k QD32 (MB/s) | 144.9 | 237.7 64% | 1.076 -99% | 505 249% | 0.828 -99% | 155 7% |

| 3DMark | |
| 1280x720 Cloud Gate Standard Graphics | |
| Acer Aspire F5-771G-50RD | |
| Acer Aspire 5 A517-51G-80L | |
| Acer Swift 3 SF315-41-R4W1 | |
| HP Pavilion 17z 1EX13AV | |
| Dell Inspiron 17-5770-0357 | |
| 1920x1080 Fire Strike Graphics | |
| Acer Aspire 5 A517-51G-80L | |
| Acer Aspire F5-771G-50RD | |
| Acer Swift 3 SF315-41-R4W1 | |
| HP Pavilion 17z 1EX13AV | |
| Dell Inspiron 17-5770-0357 | |
| 3DMark 11 - 1280x720 Performance GPU | |
| HP Omen 17-w206ng | |
| Acer Aspire 5 A517-51G-80L | |
| Acer Aspire F5-771G-50RD | |
| HP Pavilion 17z 1EX13AV | |
| Acer Swift 3 SF315-41-R4W1 | |
| Dell Inspiron 17-5770-0357 | |
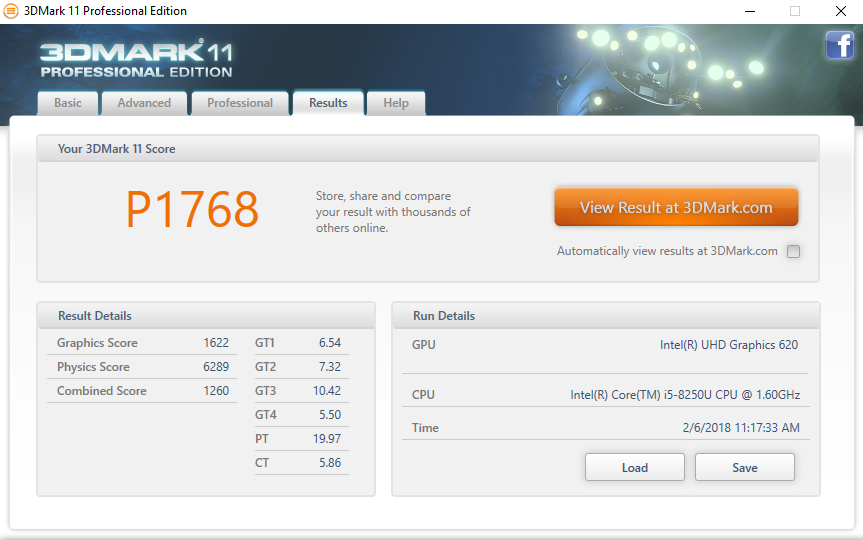
| 3DMark 11 Performance | 1768 pontos | |
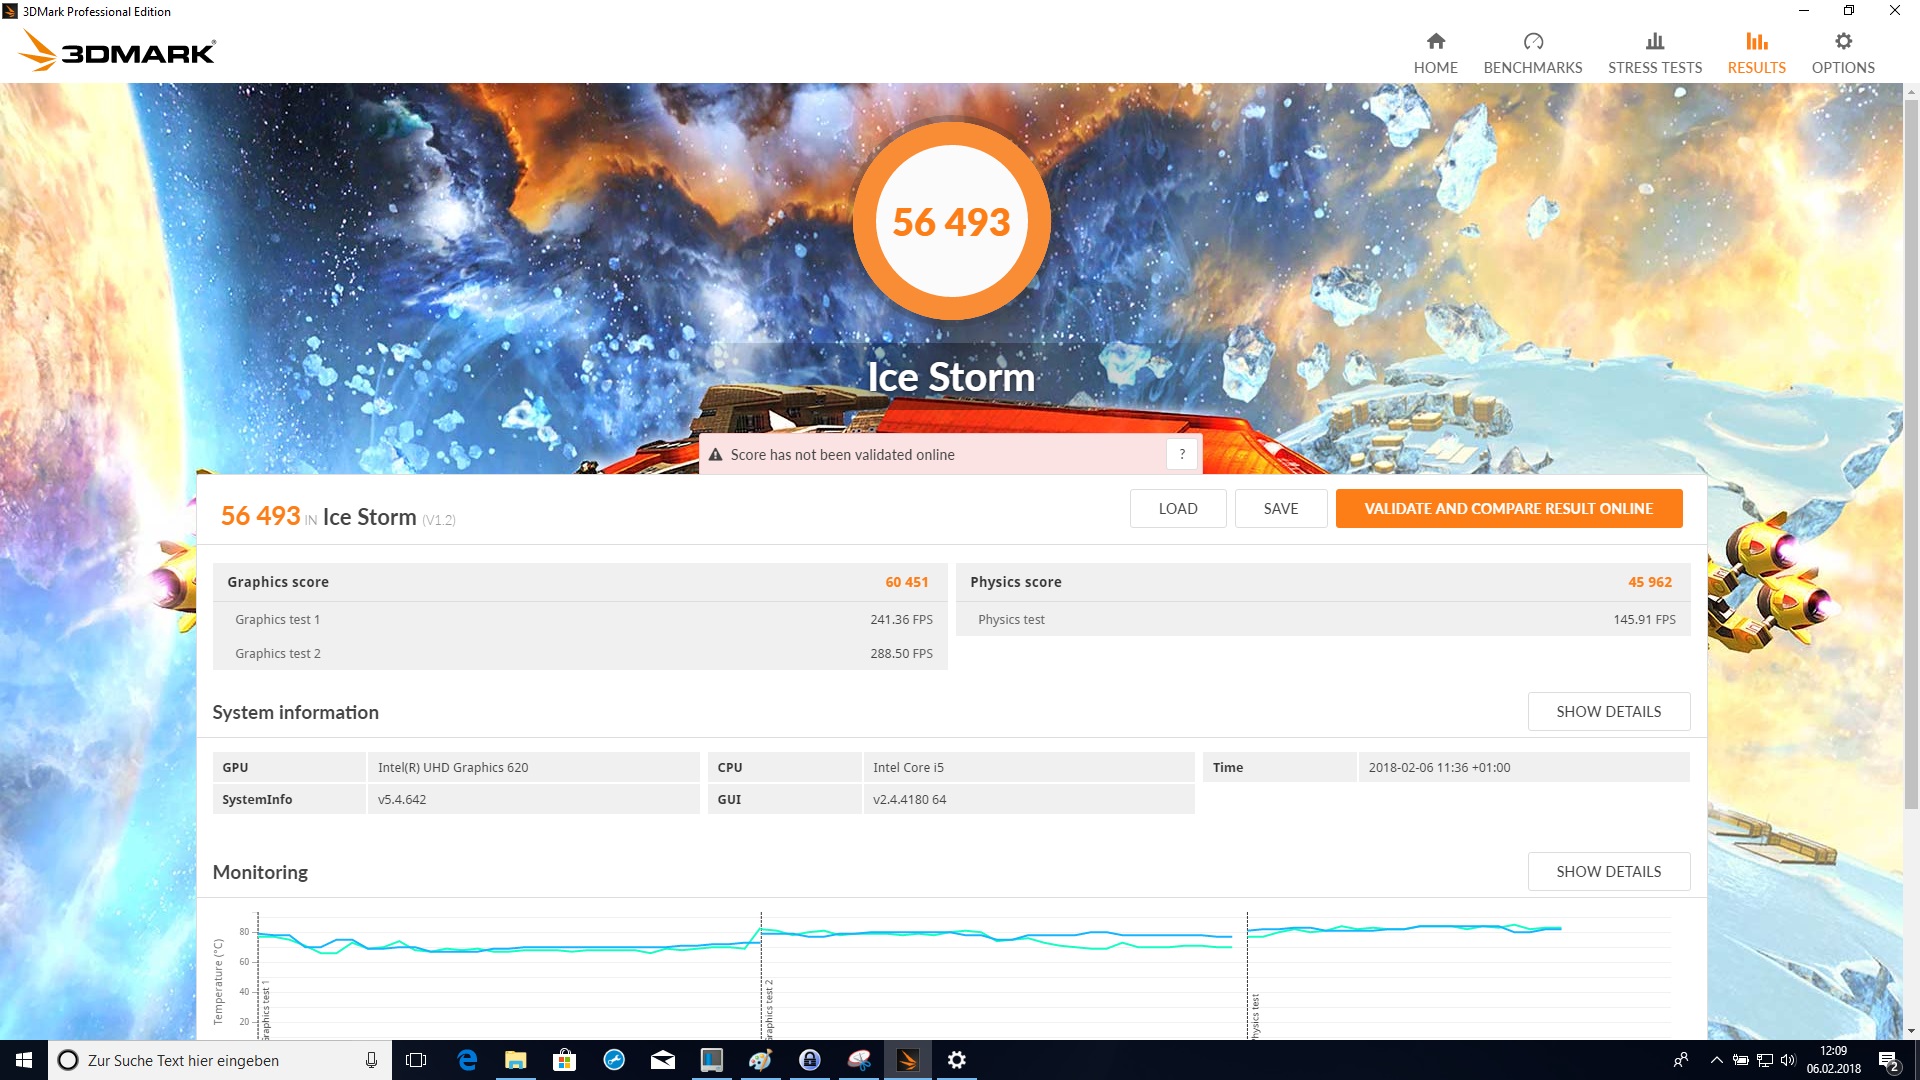
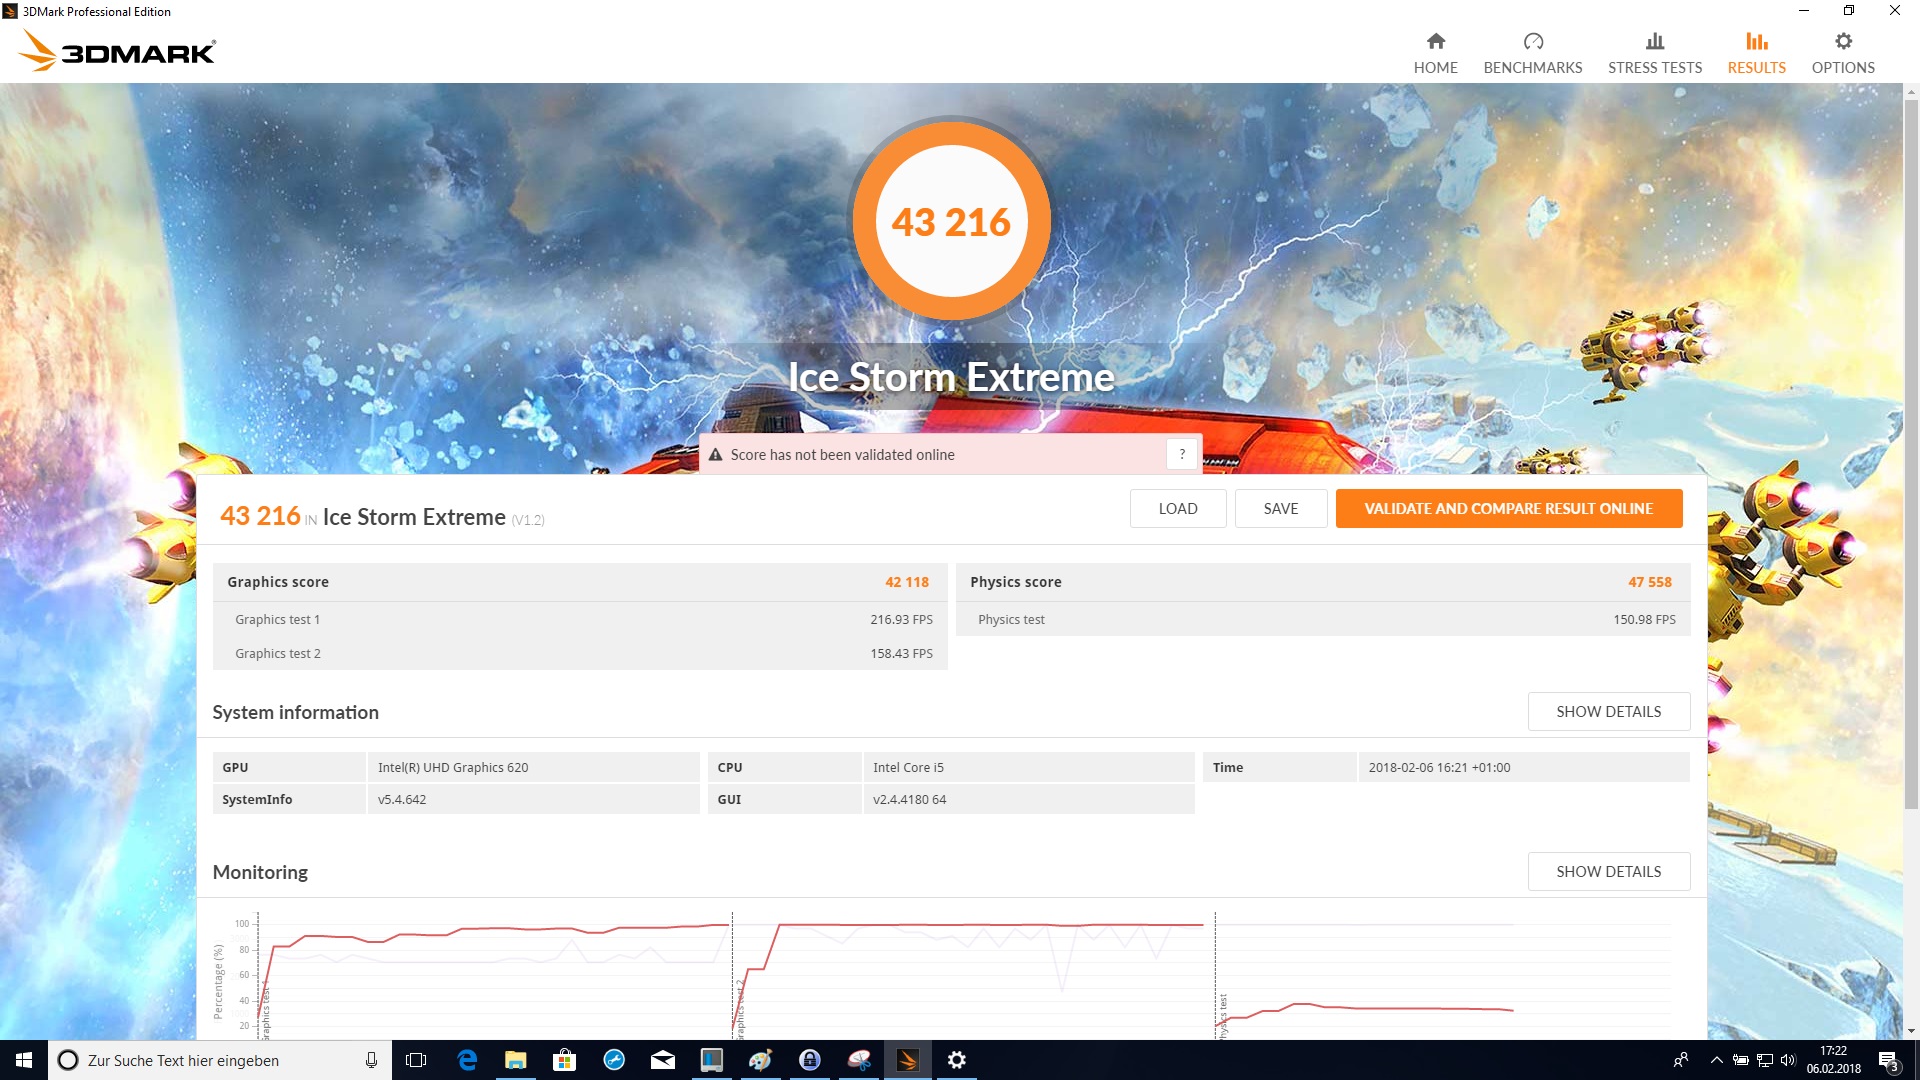
| 3DMark Ice Storm Standard Score | 56493 pontos | |
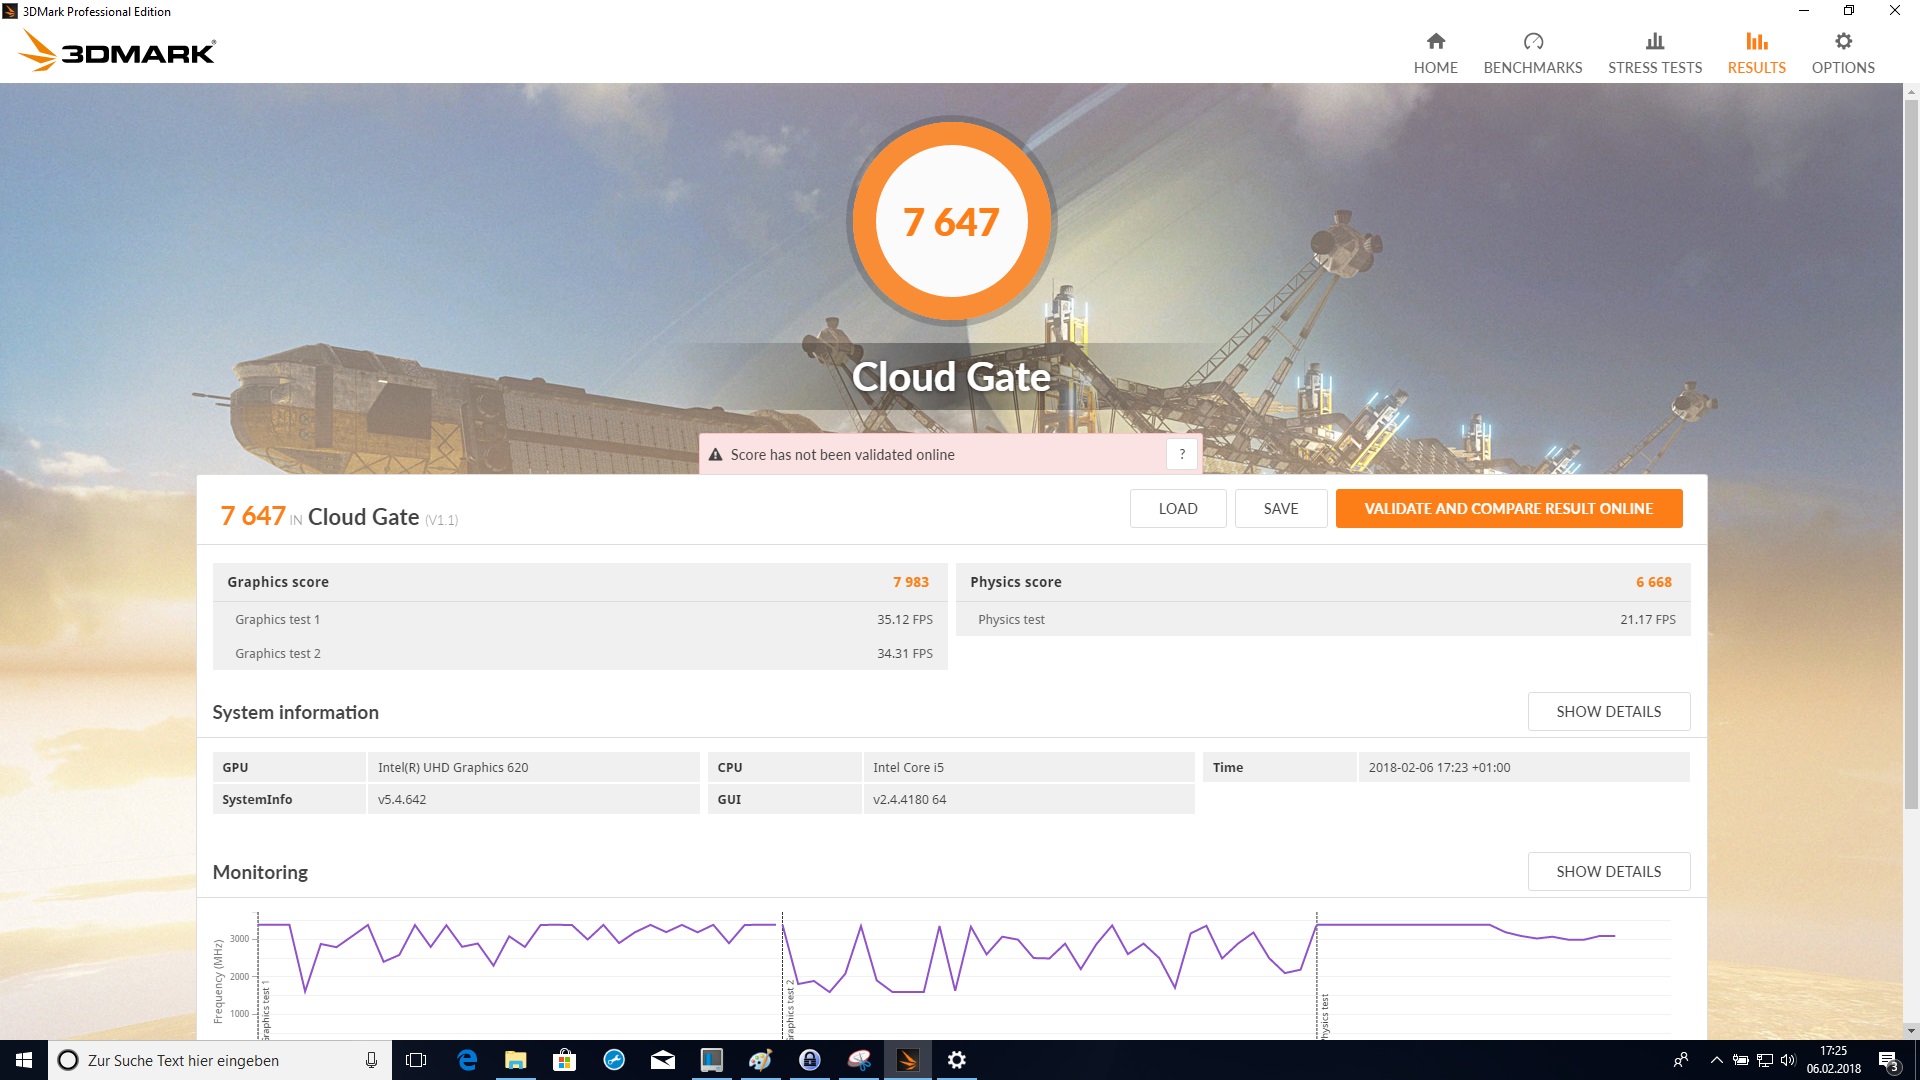
| 3DMark Cloud Gate Standard Score | 7647 pontos | |
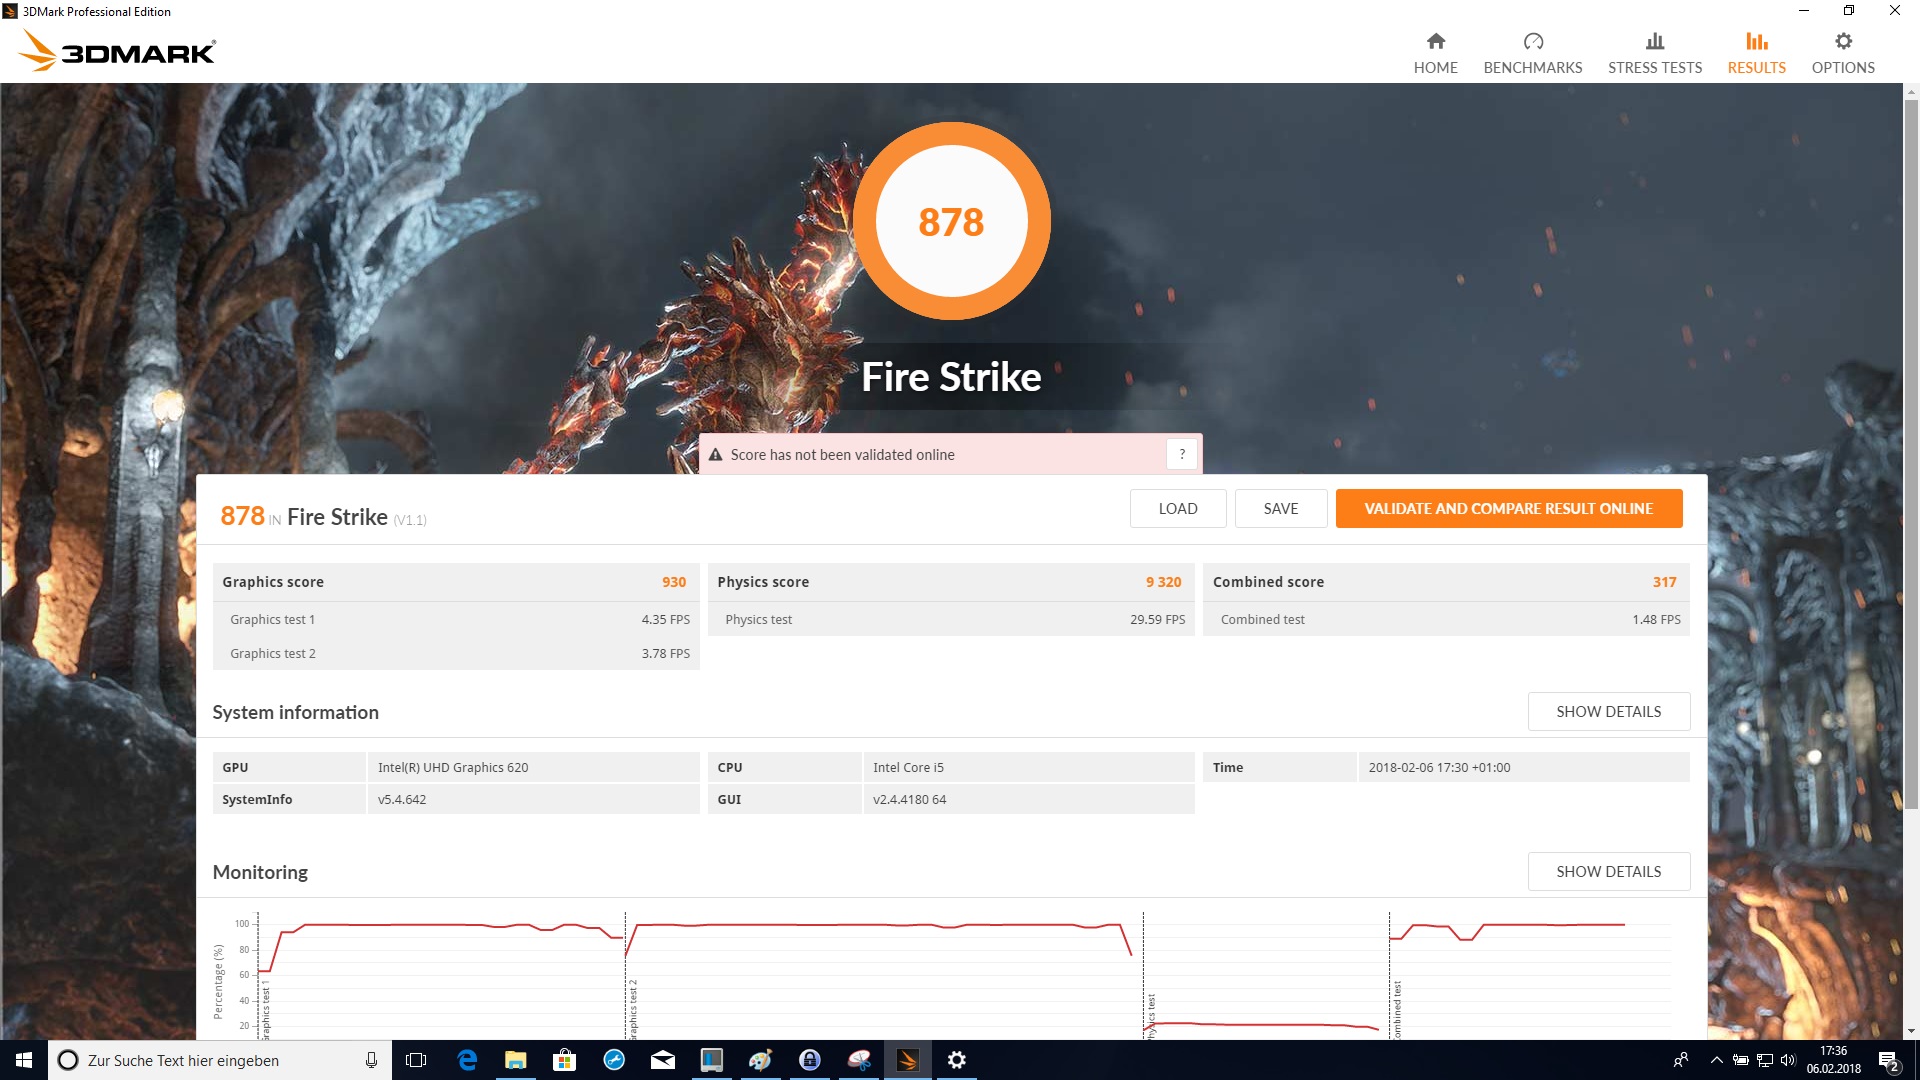
| 3DMark Fire Strike Score | 878 pontos | |
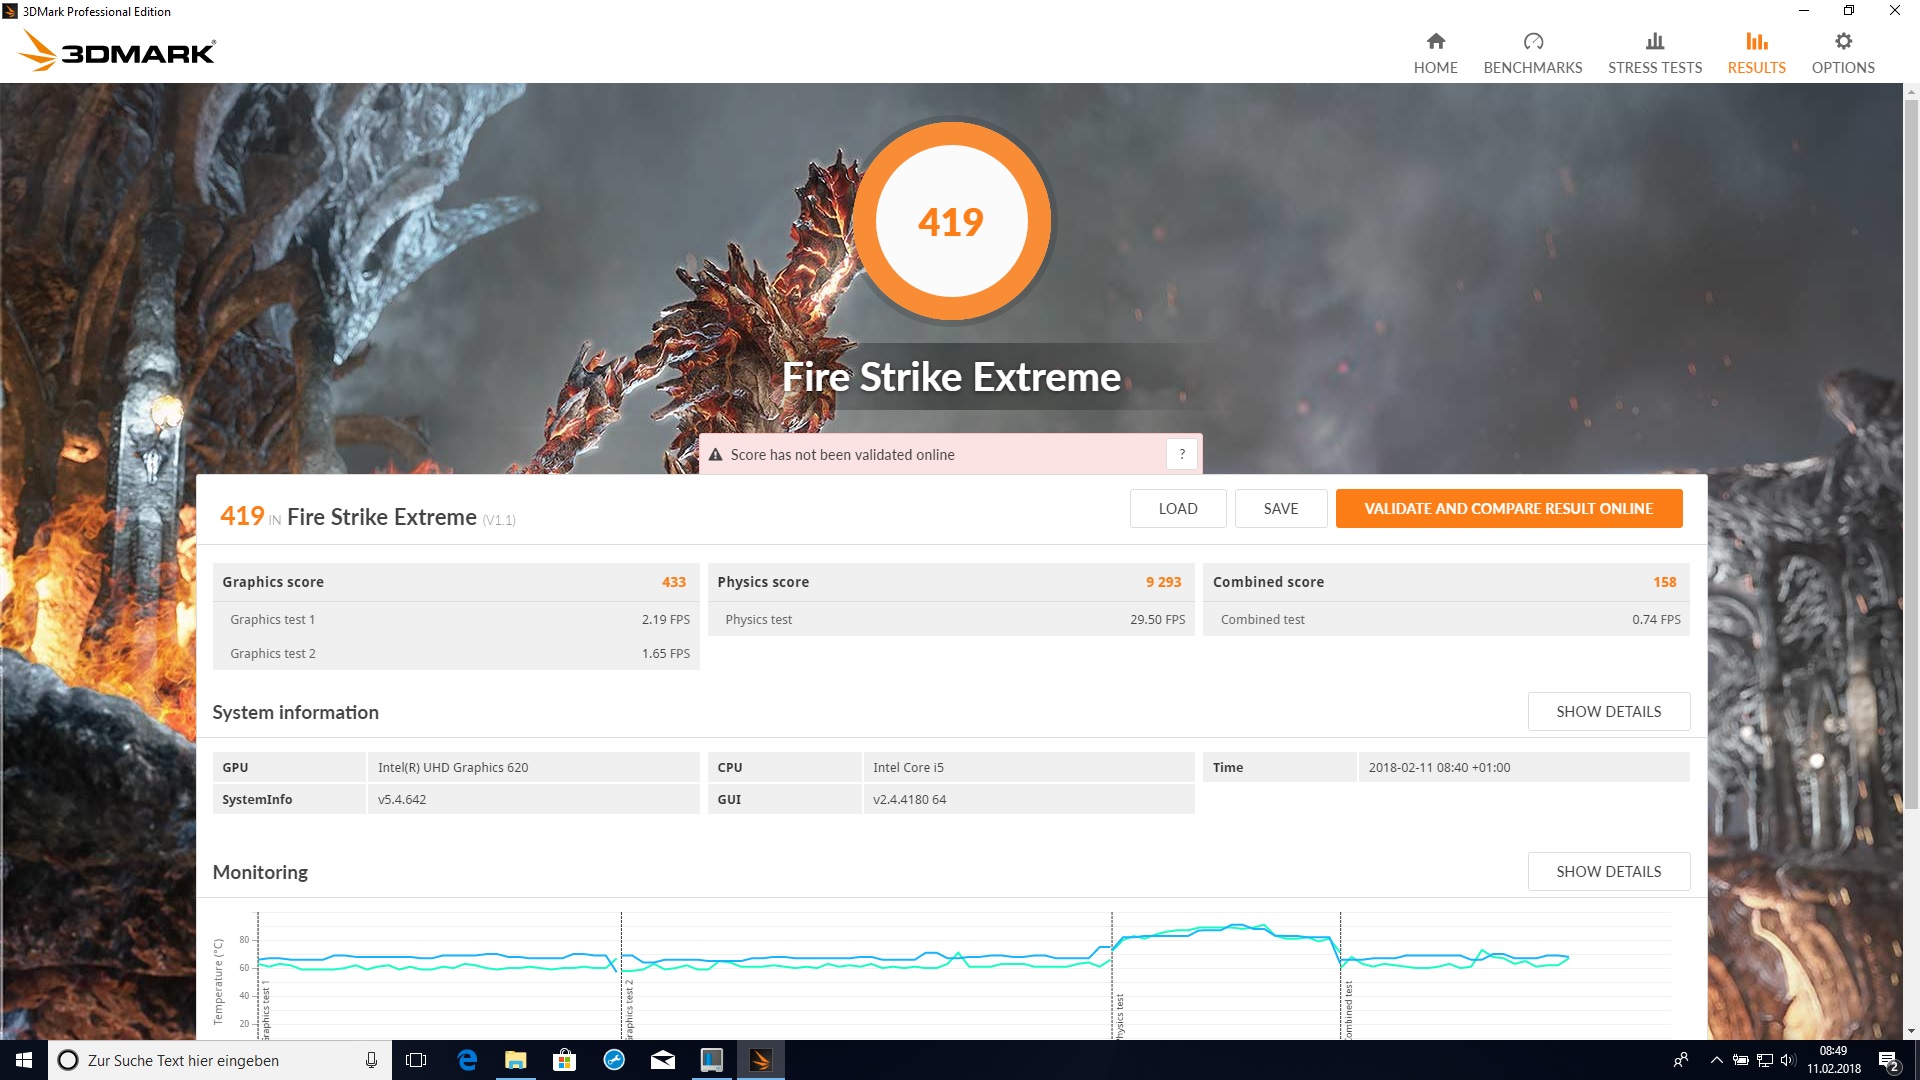
| 3DMark Fire Strike Extreme Score | 419 pontos | |
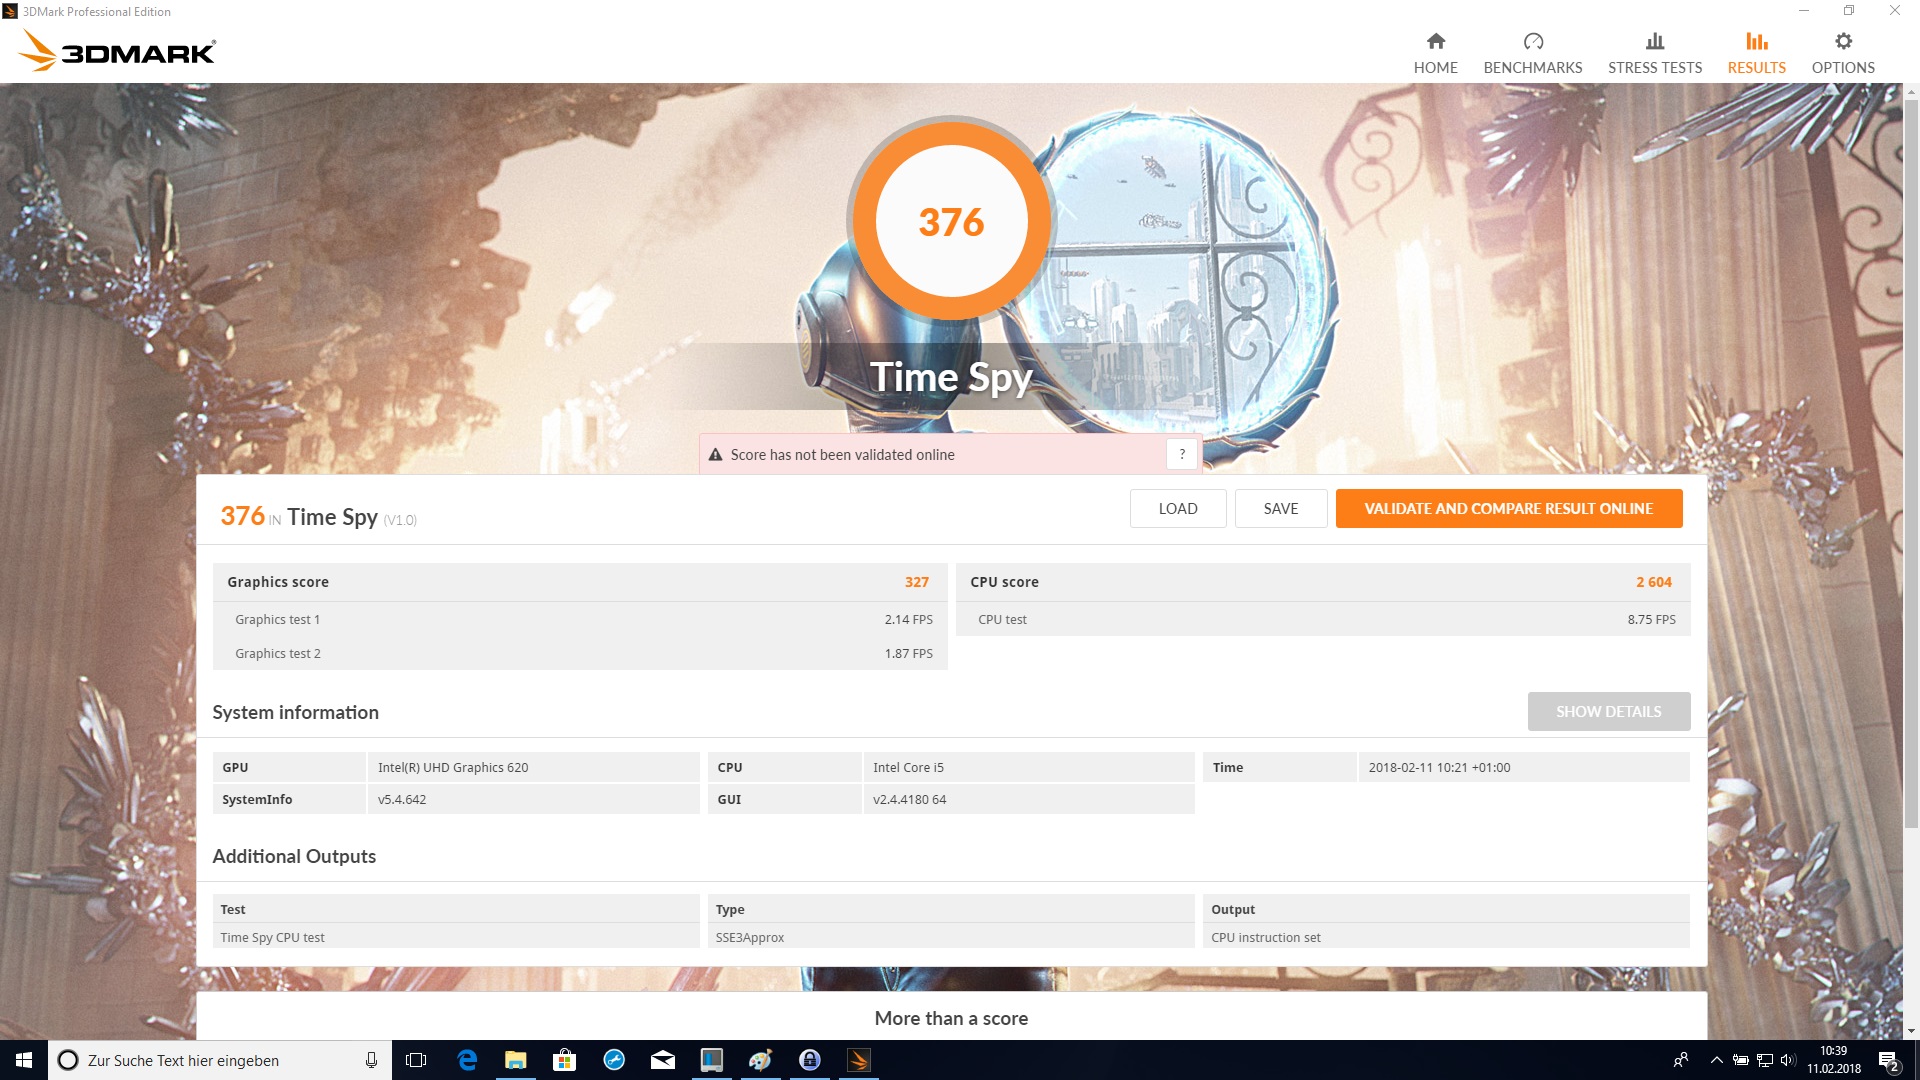
| 3DMark Time Spy Score | 376 pontos | |
Ajuda | ||
| baixo | média | alto | ultra | |
|---|---|---|---|---|
| BioShock Infinite (2013) | 52.6 | 27.6 | 22.8 | 7.6 |
| The Witcher 3 (2015) | 15.6 | 9.9 | ||
| Rise of the Tomb Raider (2016) | 17.1 | 11.8 | 6.8 |
Barulho
| Ocioso |
| 31.1 / 31.1 / 31.1 dB |
| HDD |
| 31.8 dB |
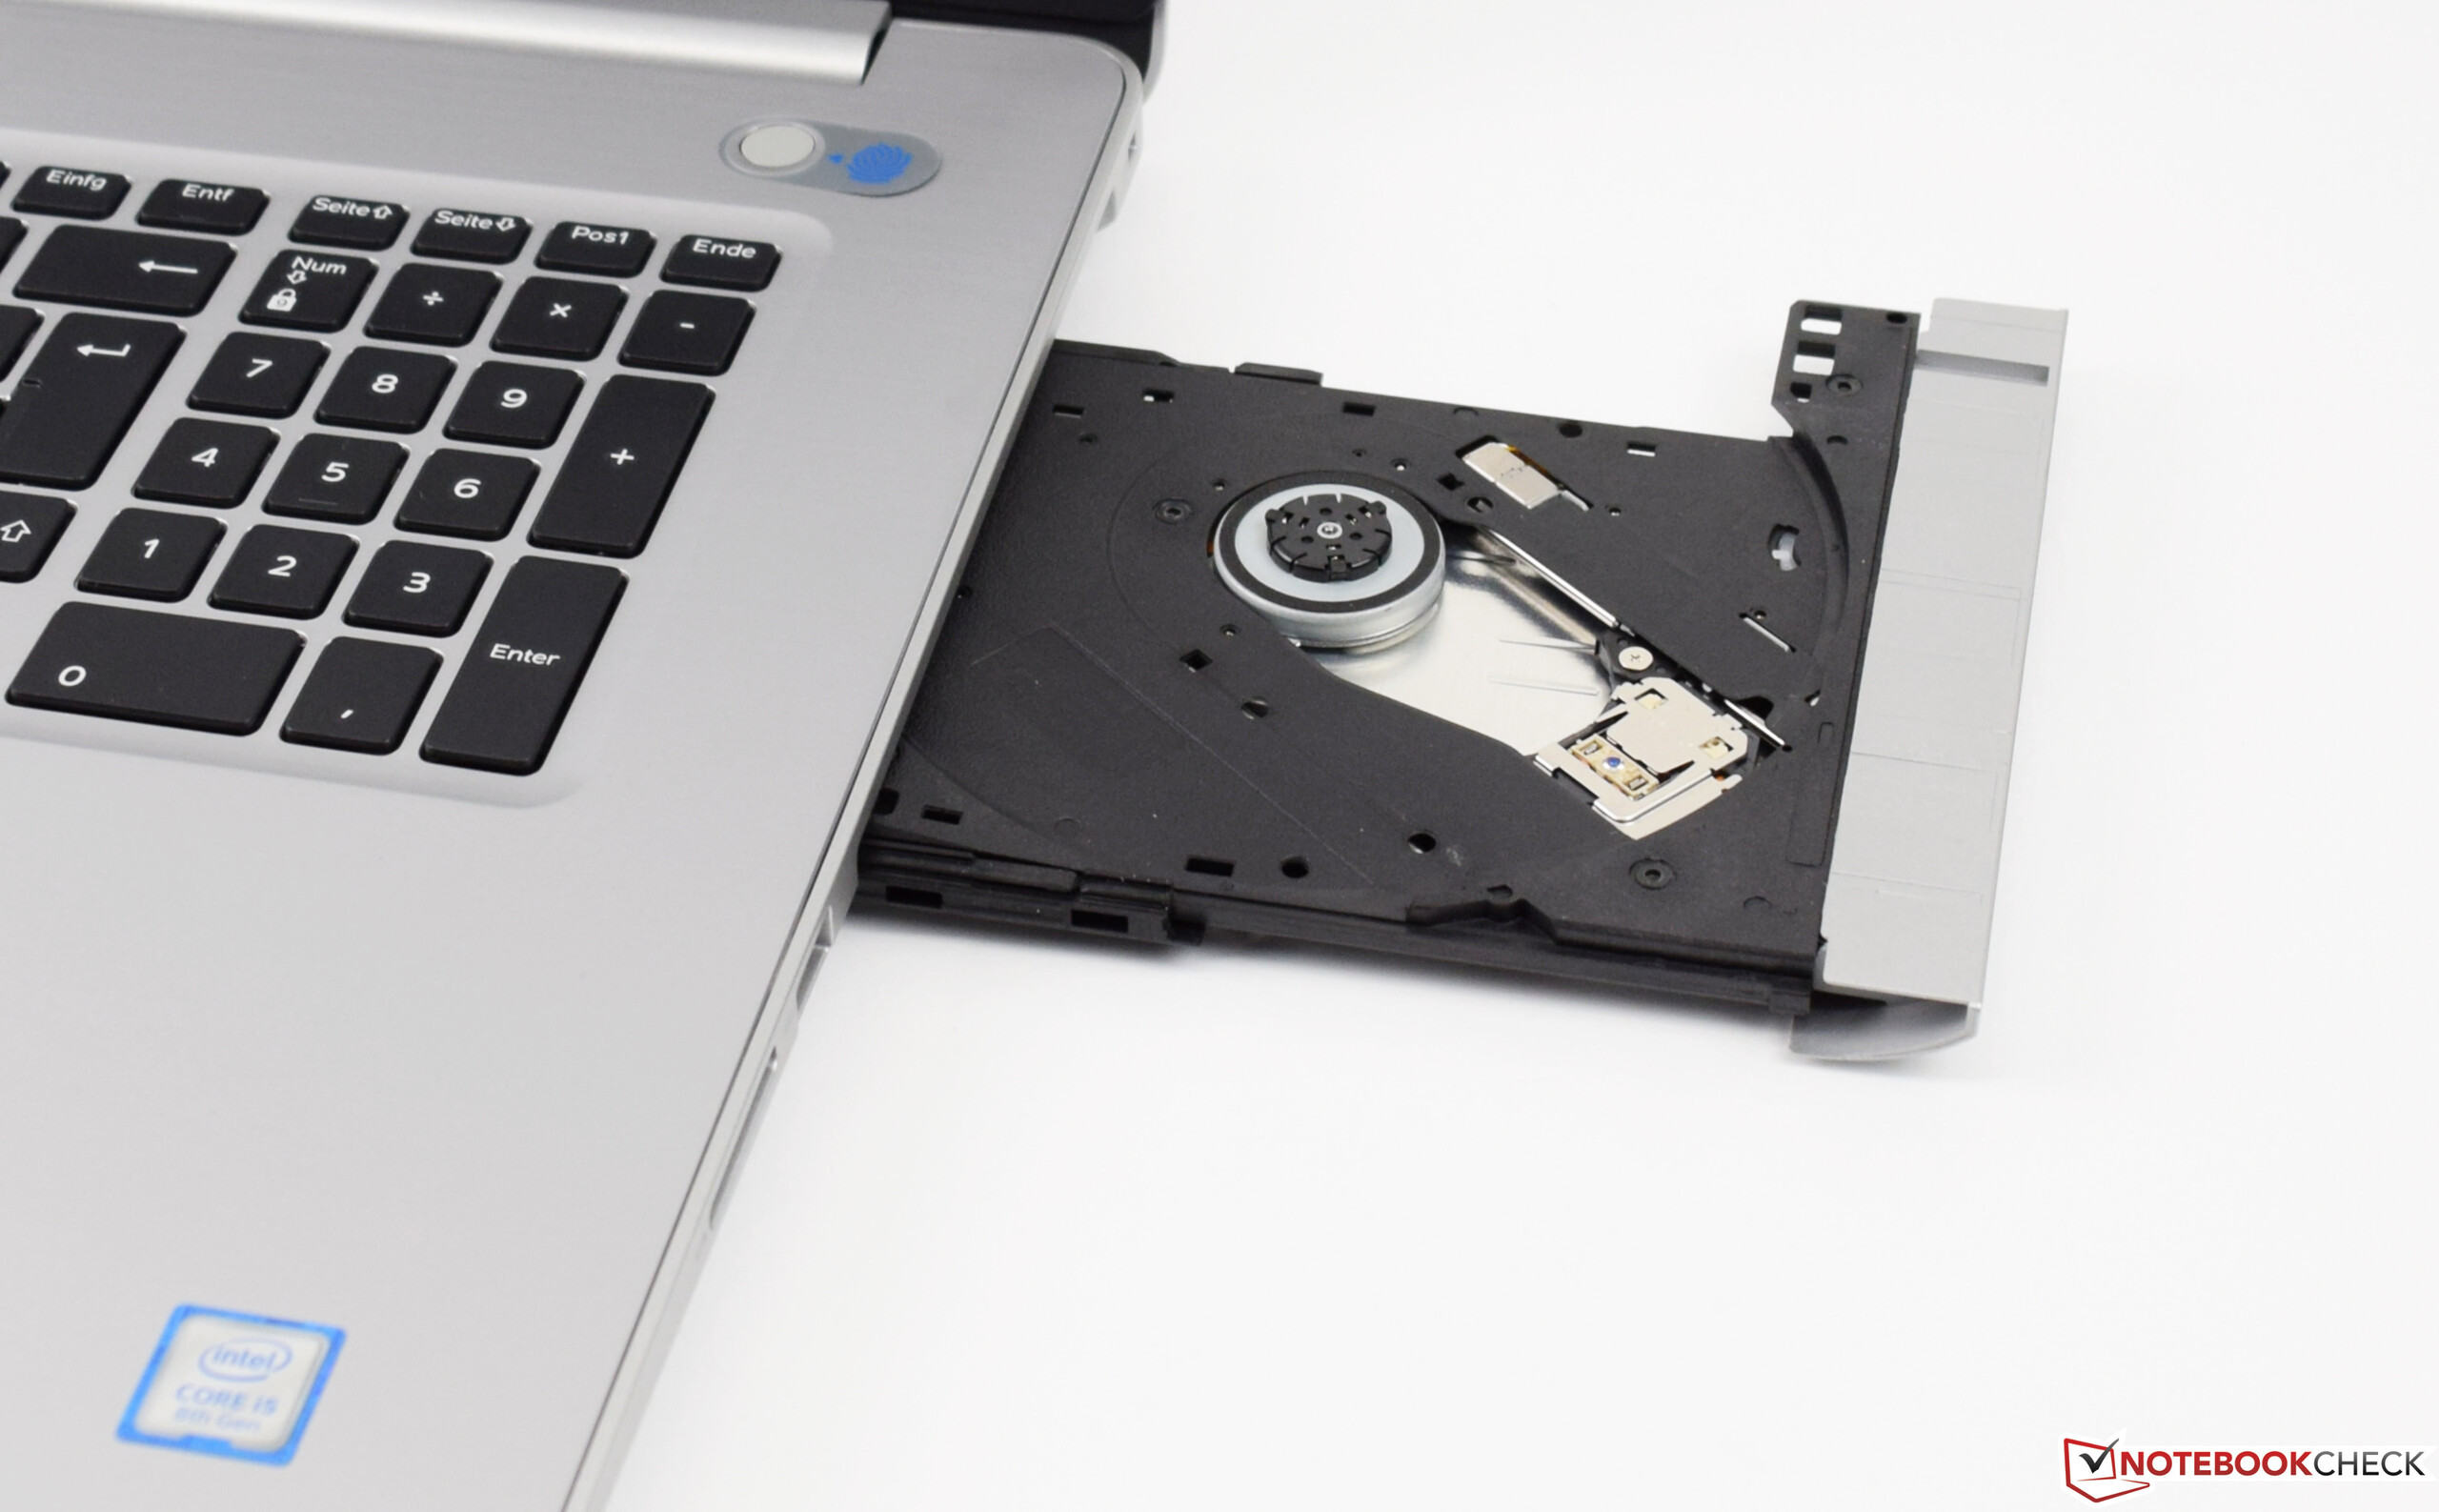
| DVD |
| 34.7 / dB |
| Carga |
| 44.4 / 41.7 dB |
 | ||
30 dB silencioso 40 dB(A) audível 50 dB(A) ruidosamente alto |
||
min: | ||
| Dell Inspiron 17-5770-0357 UHD Graphics 620, i5-8250U, SK hynix SC311 M.2 | Acer Aspire 5 A517-51G-80L GeForce MX150, i5-8550U, Micron 1100 MTFDDAV256TBN | HP Pavilion 17z 1EX13AV Radeon R7 M340, A12-9720P, WDC Scorpio Blue WD10JPVX-60JC3T1 | HP Omen 17-w206ng GeForce GTX 1050 Ti Mobile, i7-7700HQ, Samsung PM961 MZVLW256HEHP | Acer Aspire F5-771G-50RD GeForce GTX 950M, i5-7200U, Toshiba MQ01ABD100 | Acer Swift 3 SF315-41-R4W1 Vega 8, R5 2500U, Intel SSD 600p SSDPEKKW256G7 | |
|---|---|---|---|---|---|---|
| Noise | 9% | 1% | -12% | 7% | 5% | |
| desligado / ambiente * (dB) | 30.1 | 29.4 2% | 28 7% | 30 -0% | 30 -0% | 31.8 -6% |
| Idle Minimum * (dB) | 31.1 | 30.1 3% | 30.4 2% | 34 -9% | 31.5 -1% | 31.8 -2% |
| Idle Average * (dB) | 31.1 | 30.1 3% | 30.5 2% | 35 -13% | 31.5 -1% | 32.1 -3% |
| Idle Maximum * (dB) | 31.1 | 29.7 5% | 30.5 2% | 36 -16% | 31.6 -2% | 32.1 -3% |
| Load Average * (dB) | 44.4 | 34.4 23% | 41.5 7% | 47 -6% | 31.7 29% | 33 26% |
| Load Maximum * (dB) | 41.7 | 34.4 18% | 48.2 -16% | 52 -25% | 34.5 17% | 34.8 17% |
| Witcher 3 ultra * (dB) | 41.8 | 48 | 31.4 |
* ... menor é melhor
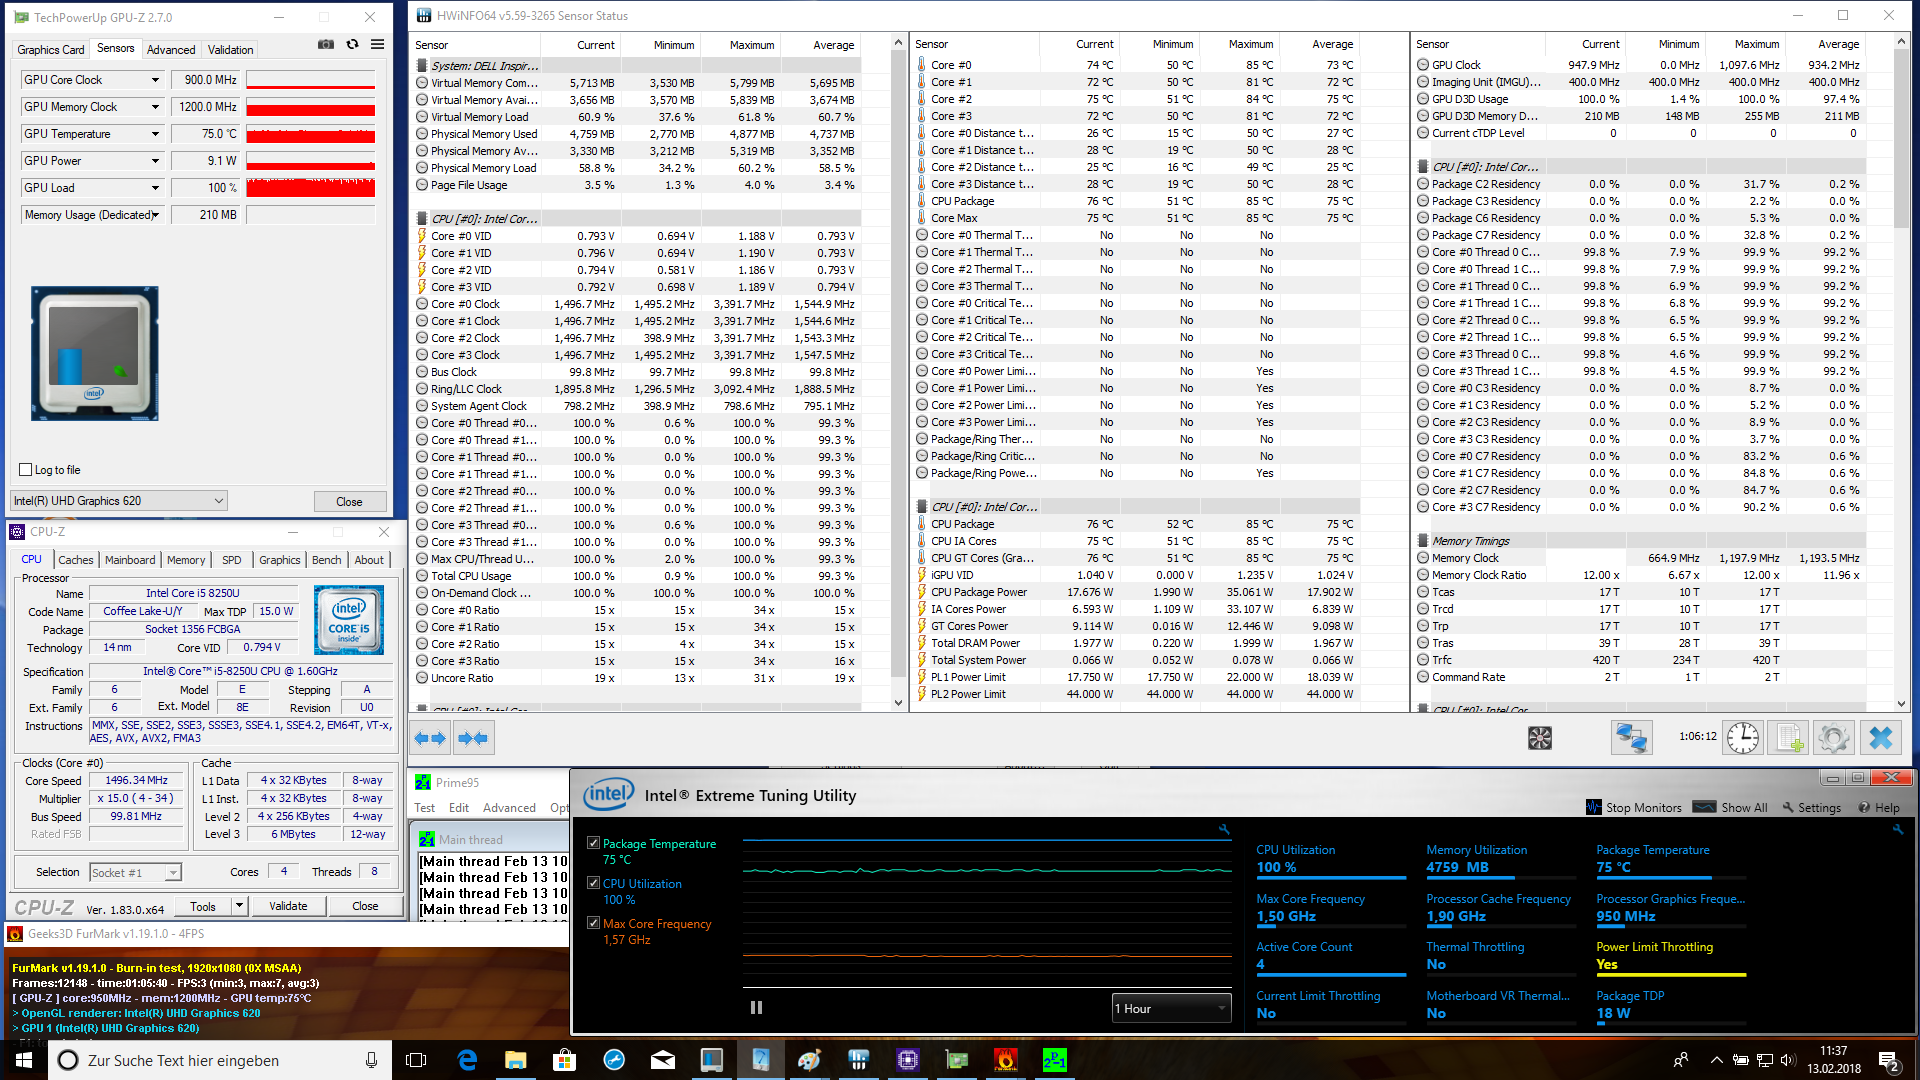
(+) A temperatura máxima no lado superior é 32.6 °C / 91 F, em comparação com a média de 36.8 °C / 98 F , variando de 21 a 71 °C para a classe Multimedia.
(+) A parte inferior aquece até um máximo de 37 °C / 99 F, em comparação com a média de 39.1 °C / 102 F
(+) Em uso inativo, a temperatura média para o lado superior é 26.8 °C / 80 F, em comparação com a média do dispositivo de 31.3 °C / ### class_avg_f### F.
(+) Os apoios para as mãos e o touchpad são mais frios que a temperatura da pele, com um máximo de 26.5 °C / 79.7 F e, portanto, são frios ao toque.
(+) A temperatura média da área do apoio para as mãos de dispositivos semelhantes foi 28.7 °C / 83.7 F (+2.2 °C / 4 F).
| Dell Inspiron 17-5770-0357 UHD Graphics 620, i5-8250U, SK hynix SC311 M.2 | Acer Aspire 5 A517-51G-80L GeForce MX150, i5-8550U, Micron 1100 MTFDDAV256TBN | HP Pavilion 17z 1EX13AV Radeon R7 M340, A12-9720P, WDC Scorpio Blue WD10JPVX-60JC3T1 | HP Omen 17-w206ng GeForce GTX 1050 Ti Mobile, i7-7700HQ, Samsung PM961 MZVLW256HEHP | Acer Aspire F5-771G-50RD GeForce GTX 950M, i5-7200U, Toshiba MQ01ABD100 | Acer Swift 3 SF315-41-R4W1 Vega 8, R5 2500U, Intel SSD 600p SSDPEKKW256G7 | |
|---|---|---|---|---|---|---|
| Heat | -2% | -17% | -36% | -23% | -15% | |
| Maximum Upper Side * (°C) | 32.6 | 40.4 -24% | 40.8 -25% | 55.6 -71% | 41.9 -29% | 41 -26% |
| Maximum Bottom * (°C) | 37 | 37 -0% | 41.6 -12% | 57.7 -56% | 55.8 -51% | 41.1 -11% |
| Idle Upper Side * (°C) | 28 | 25.3 10% | 26.4 6% | 32.2 -15% | 33.4 -19% | 29.9 -7% |
| Idle Bottom * (°C) | 26.9 | 24.7 8% | 37 -38% | 27.2 -1% | 25.1 7% | 30.9 -15% |
* ... menor é melhor
Dell Inspiron 17-5770-0357 análise de áudio
(-) | alto-falantes não muito altos (###valor### dB)
Graves 100 - 315Hz
(-) | quase nenhum baixo - em média 15.9% menor que a mediana
(+) | o baixo é linear (5.4% delta para a frequência anterior)
Médios 400 - 2.000 Hz
(+) | médios equilibrados - apenas 3.4% longe da mediana
(+) | médios são lineares (6.8% delta para frequência anterior)
Altos 2 - 16 kHz
(+) | agudos equilibrados - apenas 2.1% longe da mediana
(+) | os máximos são lineares (6.7% delta da frequência anterior)
Geral 100 - 16.000 Hz
(±) | a linearidade do som geral é média (16.8% diferença em relação à mediana)
Comparado com a mesma classe
» 45% de todos os dispositivos testados nesta classe foram melhores, 8% semelhantes, 47% piores
» O melhor teve um delta de 5%, a média foi 17%, o pior foi 45%
Comparado com todos os dispositivos testados
» 30% de todos os dispositivos testados foram melhores, 8% semelhantes, 63% piores
» O melhor teve um delta de 4%, a média foi 23%, o pior foi 134%
Acer Aspire 5 A517-51G-80L análise de áudio
(-) | alto-falantes não muito altos (###valor### dB)
Graves 100 - 315Hz
(-) | quase nenhum baixo - em média 15.8% menor que a mediana
(+) | o baixo é linear (5% delta para a frequência anterior)
Médios 400 - 2.000 Hz
(+) | médios equilibrados - apenas 3.5% longe da mediana
(±) | a linearidade dos médios é média (7.6% delta para frequência anterior)
Altos 2 - 16 kHz
(+) | agudos equilibrados - apenas 3.6% longe da mediana
(+) | os máximos são lineares (6.9% delta da frequência anterior)
Geral 100 - 16.000 Hz
(±) | a linearidade do som geral é média (16.3% diferença em relação à mediana)
Comparado com a mesma classe
» 41% de todos os dispositivos testados nesta classe foram melhores, 8% semelhantes, 51% piores
» O melhor teve um delta de 5%, a média foi 17%, o pior foi 45%
Comparado com todos os dispositivos testados
» 27% de todos os dispositivos testados foram melhores, 6% semelhantes, 68% piores
» O melhor teve um delta de 4%, a média foi 23%, o pior foi 134%
| desligado | |
| Ocioso | |
| Carga |
|
Key:
min: | |
| Dell Inspiron 17-5770-0357 i5-8250U, UHD Graphics 620, SK hynix SC311 M.2, IPS, 1920x1080, 17.3" | Acer Aspire 5 A517-51G-80L i5-8550U, GeForce MX150, Micron 1100 MTFDDAV256TBN, aSi TFT, IPS, 1920x1080, 17.3" | HP Pavilion 17z 1EX13AV A12-9720P, Radeon R7 M340, WDC Scorpio Blue WD10JPVX-60JC3T1, IPS, 1920x1080, 17.3" | HP Omen 17-w206ng i7-7700HQ, GeForce GTX 1050 Ti Mobile, Samsung PM961 MZVLW256HEHP, IPS, 1920x1080, 17.3" | Acer Aspire F5-771G-50RD i5-7200U, GeForce GTX 950M, Toshiba MQ01ABD100, TN, 1920x1080, 17.3" | Acer Swift 3 SF315-41-R4W1 R5 2500U, Vega 8, Intel SSD 600p SSDPEKKW256G7, IPS, 1920x1080, 15.6" | |
|---|---|---|---|---|---|---|
| Power Consumption | -26% | -57% | -159% | -53% | -26% | |
| Idle Minimum * (Watt) | 4.08 | 4.1 -0% | 7.8 -91% | 11 -170% | 6.9 -69% | 7.3 -79% |
| Idle Average * (Watt) | 8.45 | 9.3 -10% | 11.7 -38% | 18 -113% | 13.6 -61% | 9.7 -15% |
| Idle Maximum * (Watt) | 9.6 | 9.8 -2% | 15.7 -64% | 24 -150% | 14.8 -54% | 13 -35% |
| Load Average * (Watt) | 40.2 | 64 -59% | 57.4 -43% | 84 -109% | 41 -2% | 40.4 -0% |
| Load Maximum * (Watt) | 41.4 | 66.4 -60% | 62.3 -50% | 146 -253% | 75 -81% | 42.2 -2% |
| Witcher 3 ultra * (Watt) | 53.3 | 101 | 33 |
* ... menor é melhor
| Dell Inspiron 17-5770-0357 i5-8250U, UHD Graphics 620, 42 Wh | Acer Aspire 5 A517-51G-80L i5-8550U, GeForce MX150, 48 Wh | HP Pavilion 17z 1EX13AV A12-9720P, Radeon R7 M340, 41.6 Wh | HP Omen 17-w206ng i7-7700HQ, GeForce GTX 1050 Ti Mobile, 62 Wh | Acer Aspire F5-771G-50RD i5-7200U, GeForce GTX 950M, 40 Wh | Acer Swift 3 SF315-41-R4W1 R5 2500U, Vega 8, 48 Wh | |
|---|---|---|---|---|---|---|
| Duração da bateria | -4% | -33% | 8% | -21% | -6% | |
| Reader / Idle (h) | 11.7 | 9.3 -21% | 6.8 -42% | 13.3 14% | 7.2 -38% | 12.2 4% |
| H.264 (h) | 5.3 | 5.4 2% | ||||
| WiFi v1.3 (h) | 6.1 | 6.3 3% | 3.9 -36% | 6.3 3% | 4.5 -26% | 5.2 -15% |
| Load (h) | 1.5 | 1.5 0% | 1.2 -20% | 1.6 7% | 1.5 0% | 1.4 -7% |
Pro
Contra
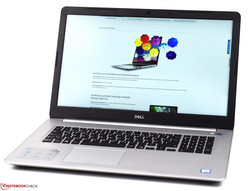
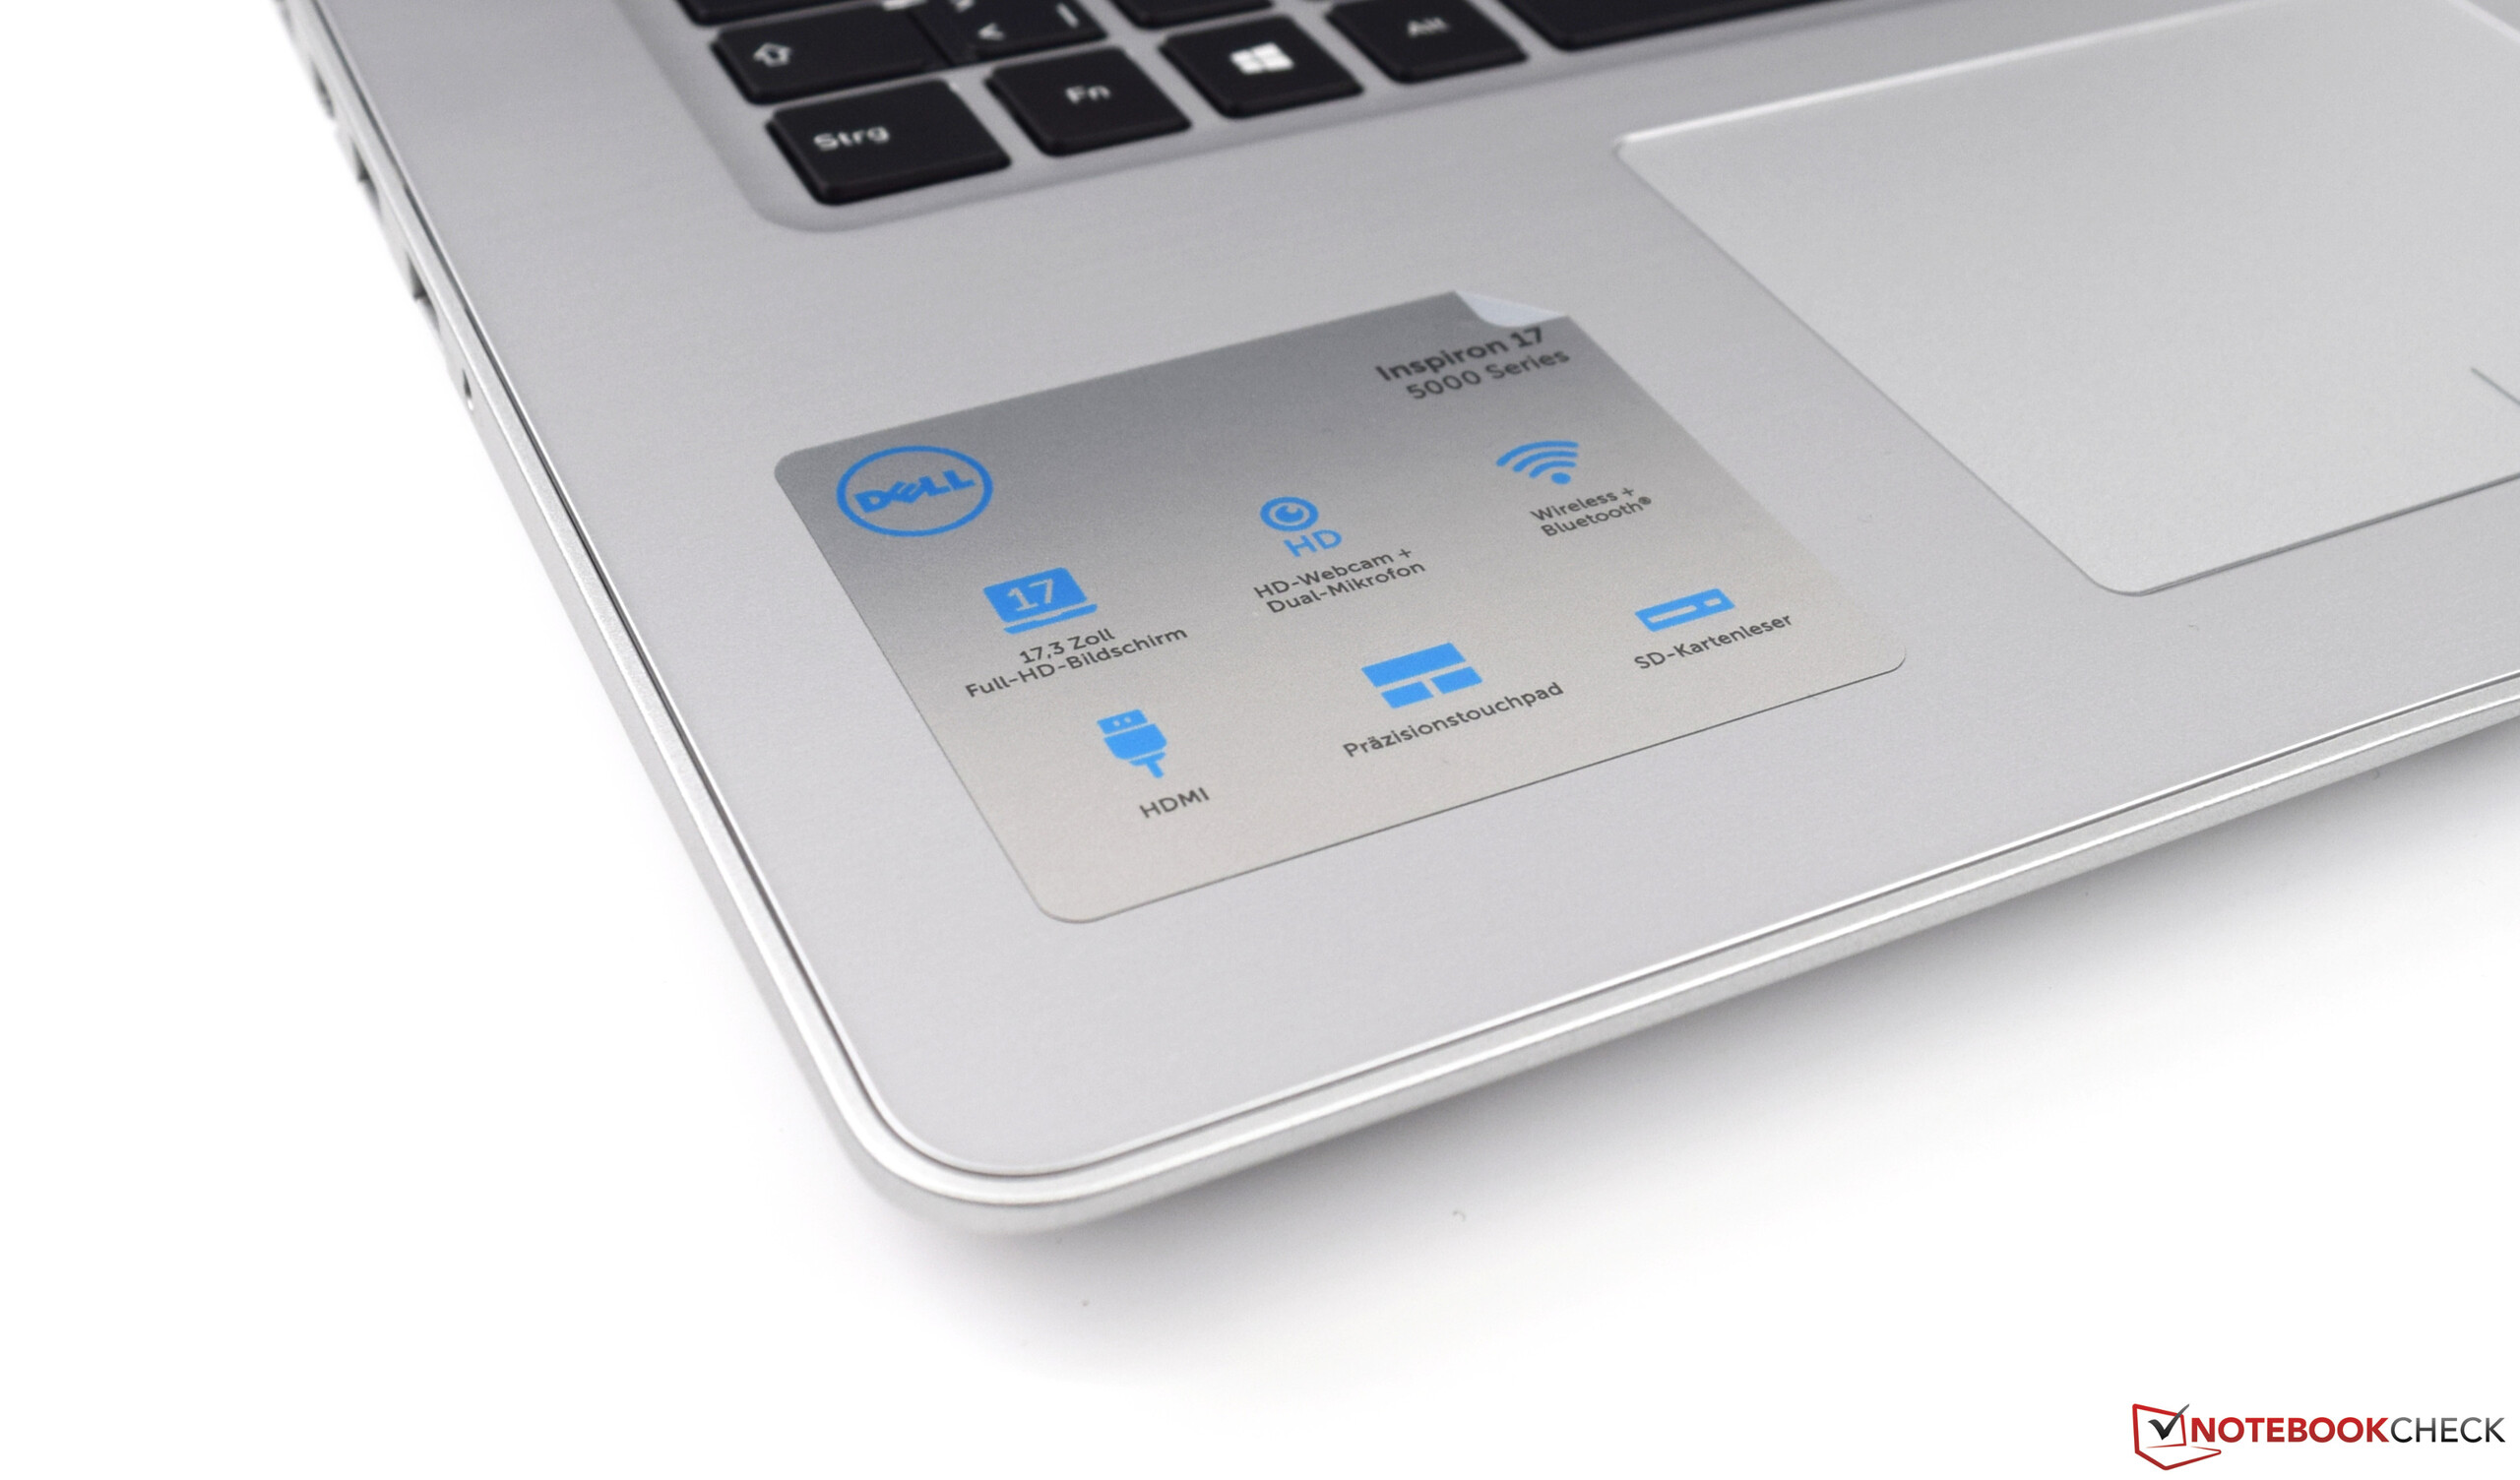
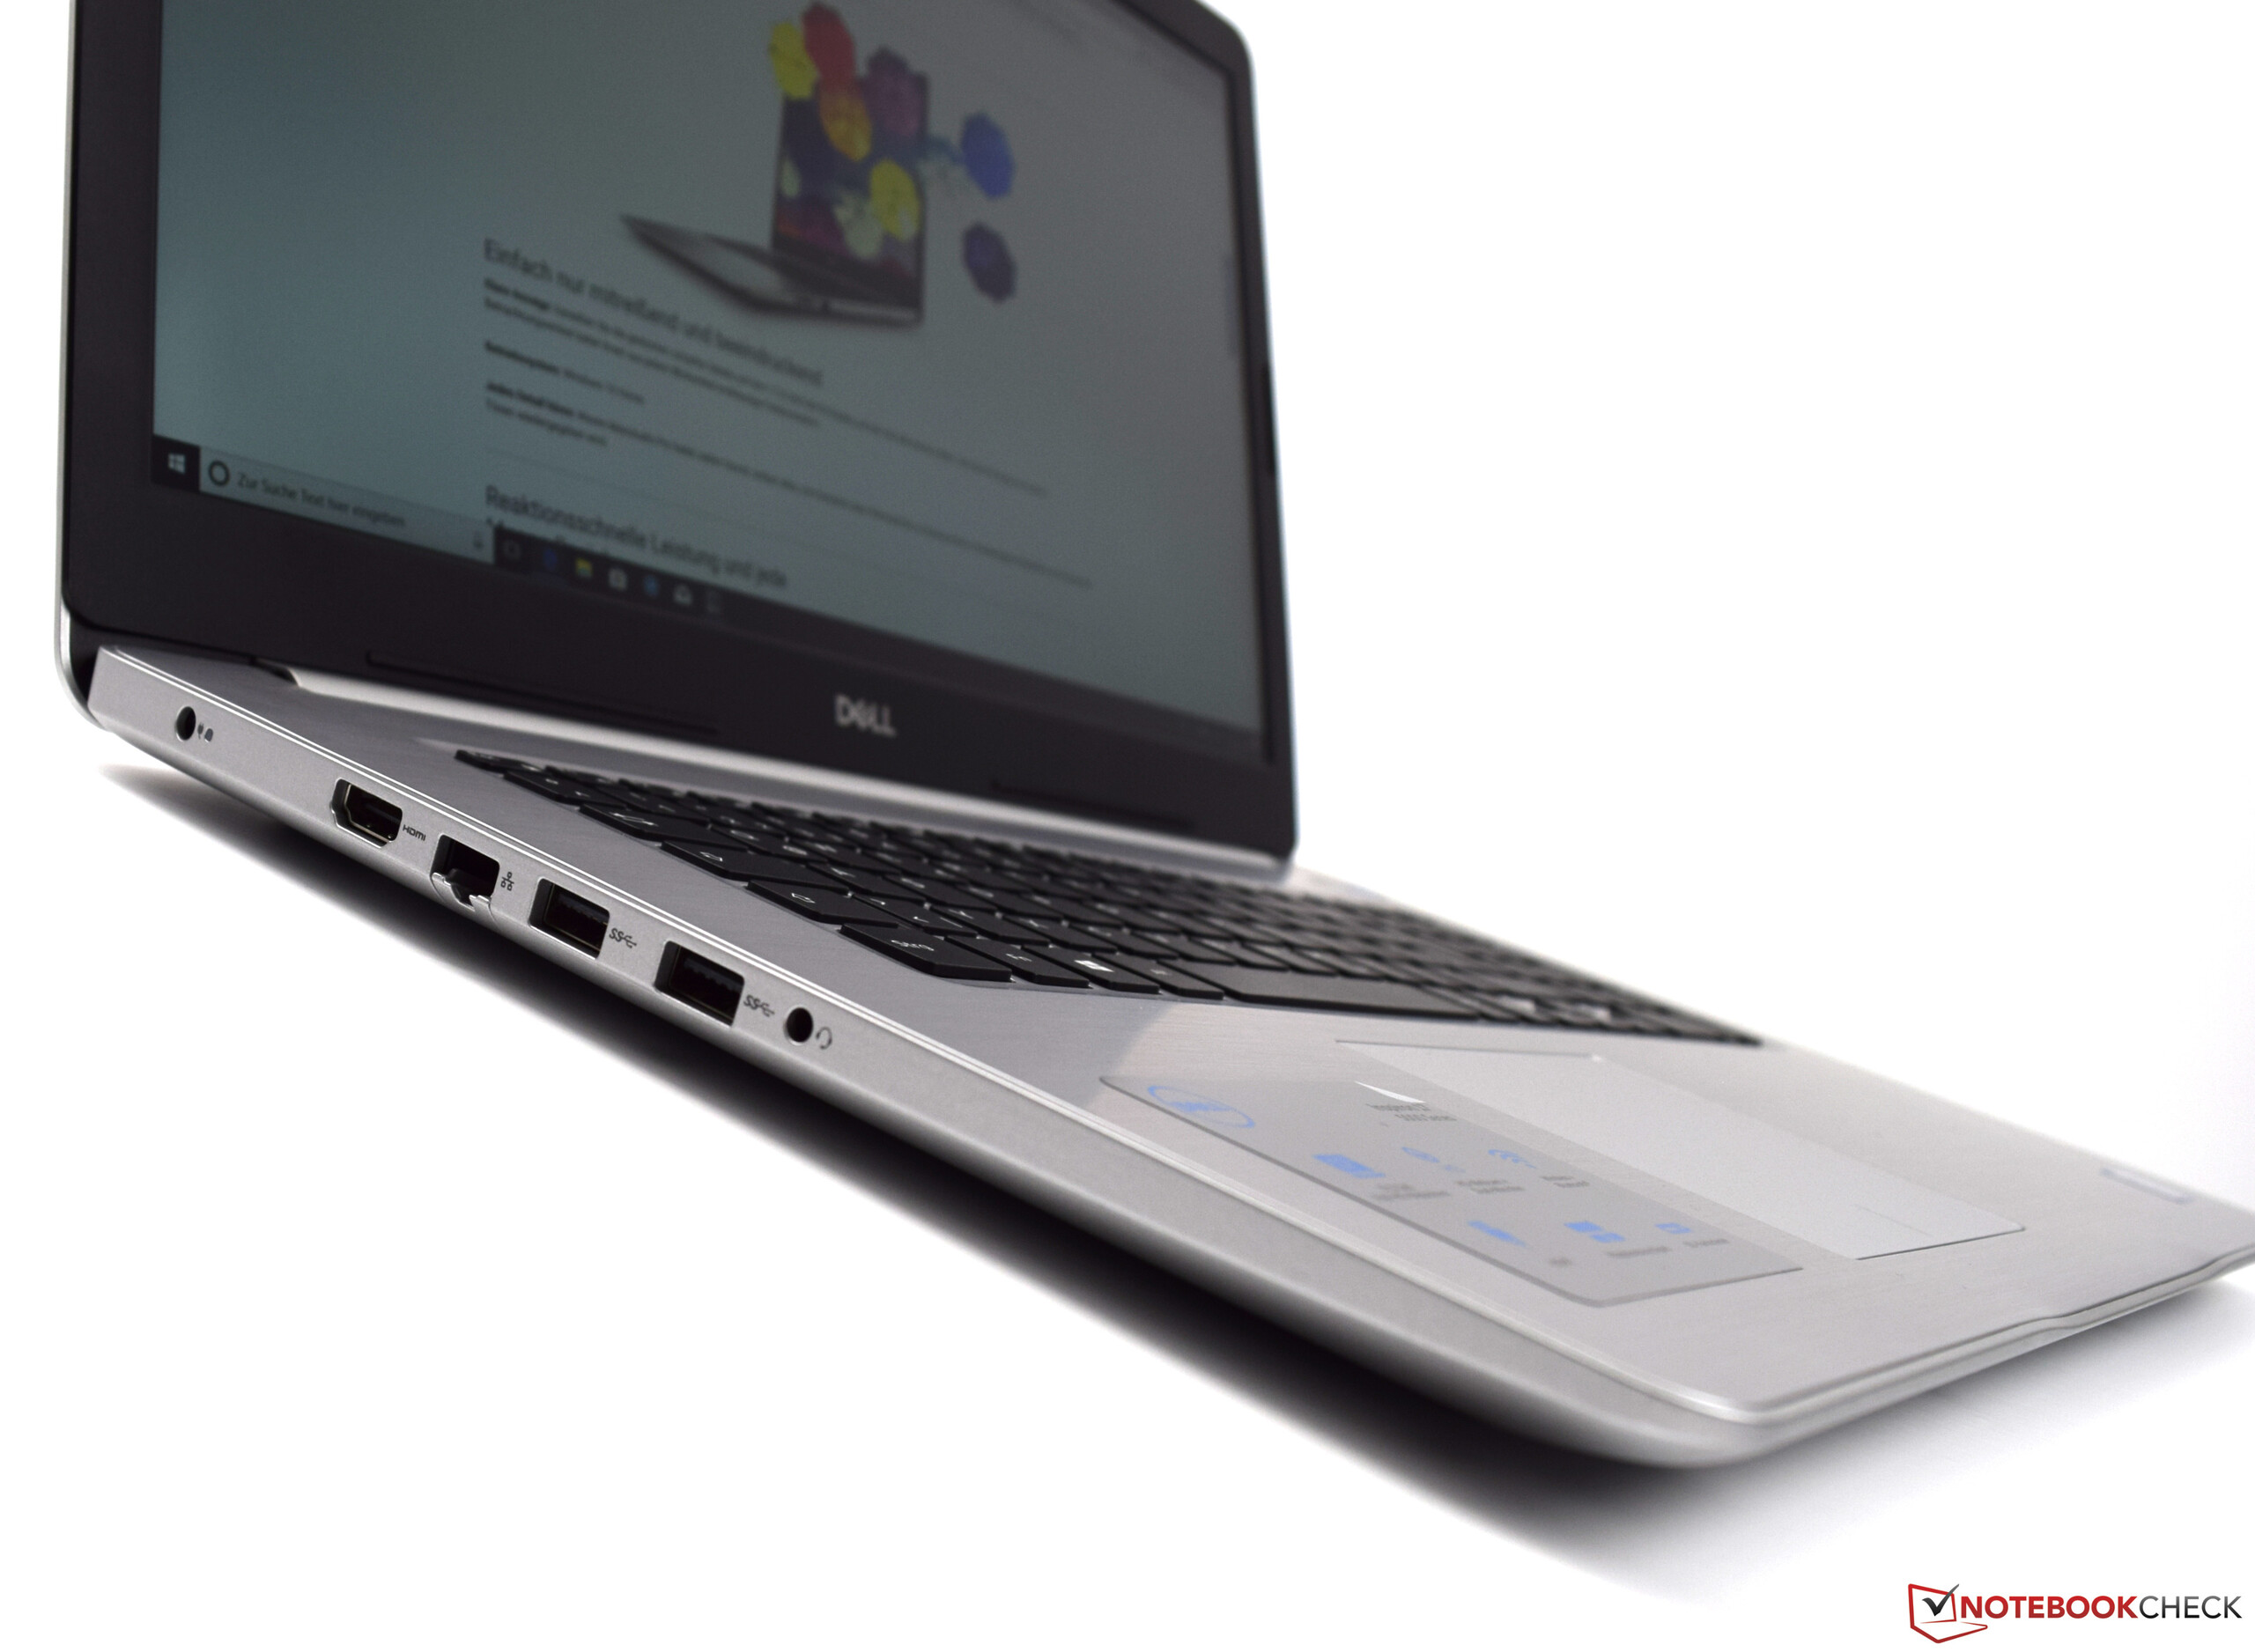
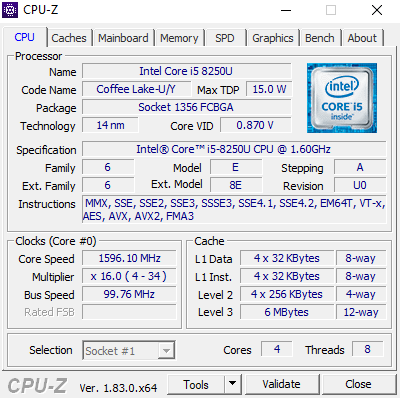
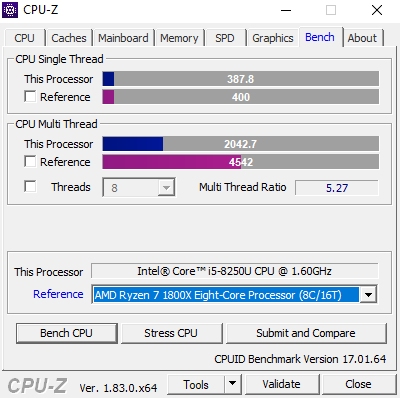
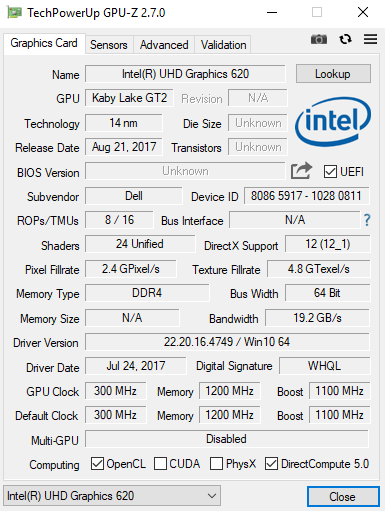
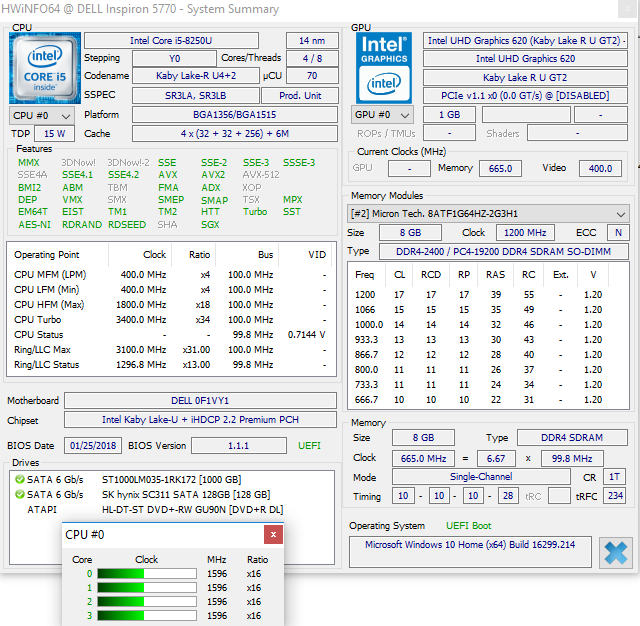
O Dell Inspiron 17-5770 é um dispositivo multimídia de 17 polegadas com uma CPU quad-core atualizada. O Intel Core i5-8250U oferece uma base sólida para tarefas diárias. Com 8 GB de RAM, o portátil está equipado com uma quantidade suficiente de RAM e os dois dispositivos de armazenamento funcionam bem juntos. Com um preço de 749 Euros (~$922), os clientes obtêm um dispositivo elegante e estável. Os bons dispositivos de entrada e um sensor de digitais são recursos adicionais.
O Dell Inspiron 17-5770 é um dispositivo multimídia com pequenas falhas em termos de desempenho 3D. O usuário que não atribui grande importância a esse fato não pode errar comprando o dispositivo de 17 polegadas em nossa configuração de teste.
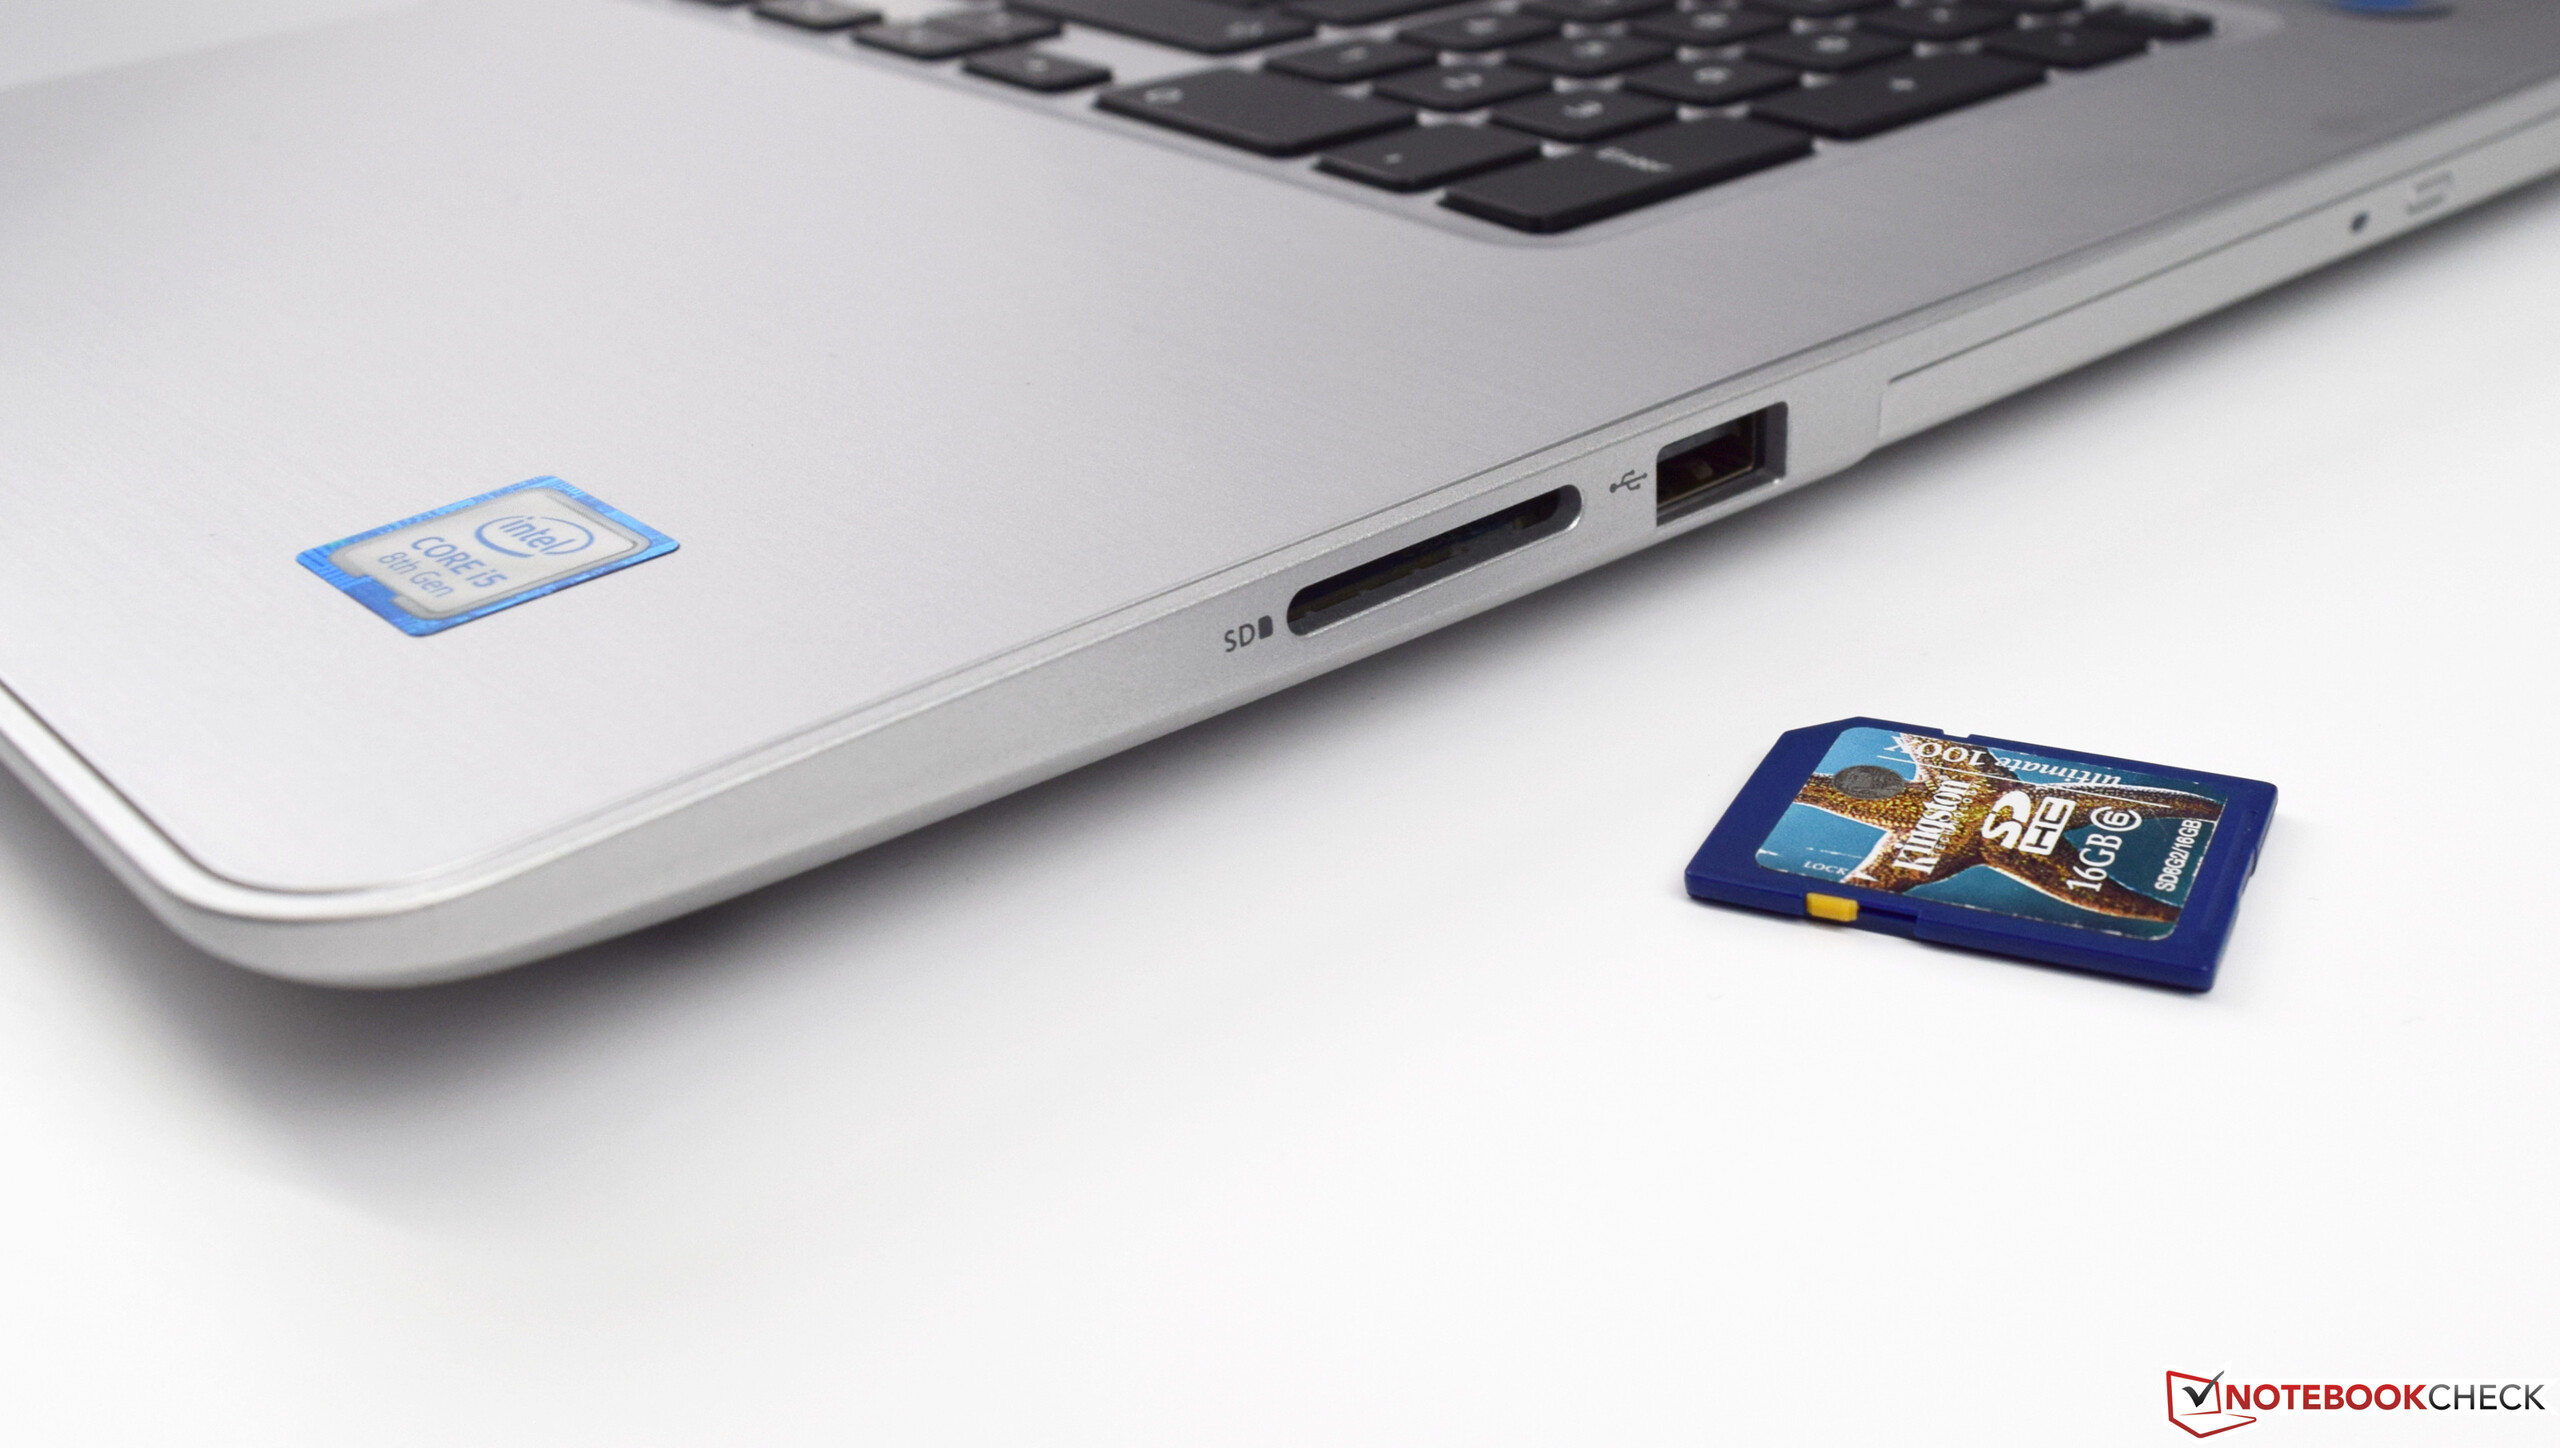
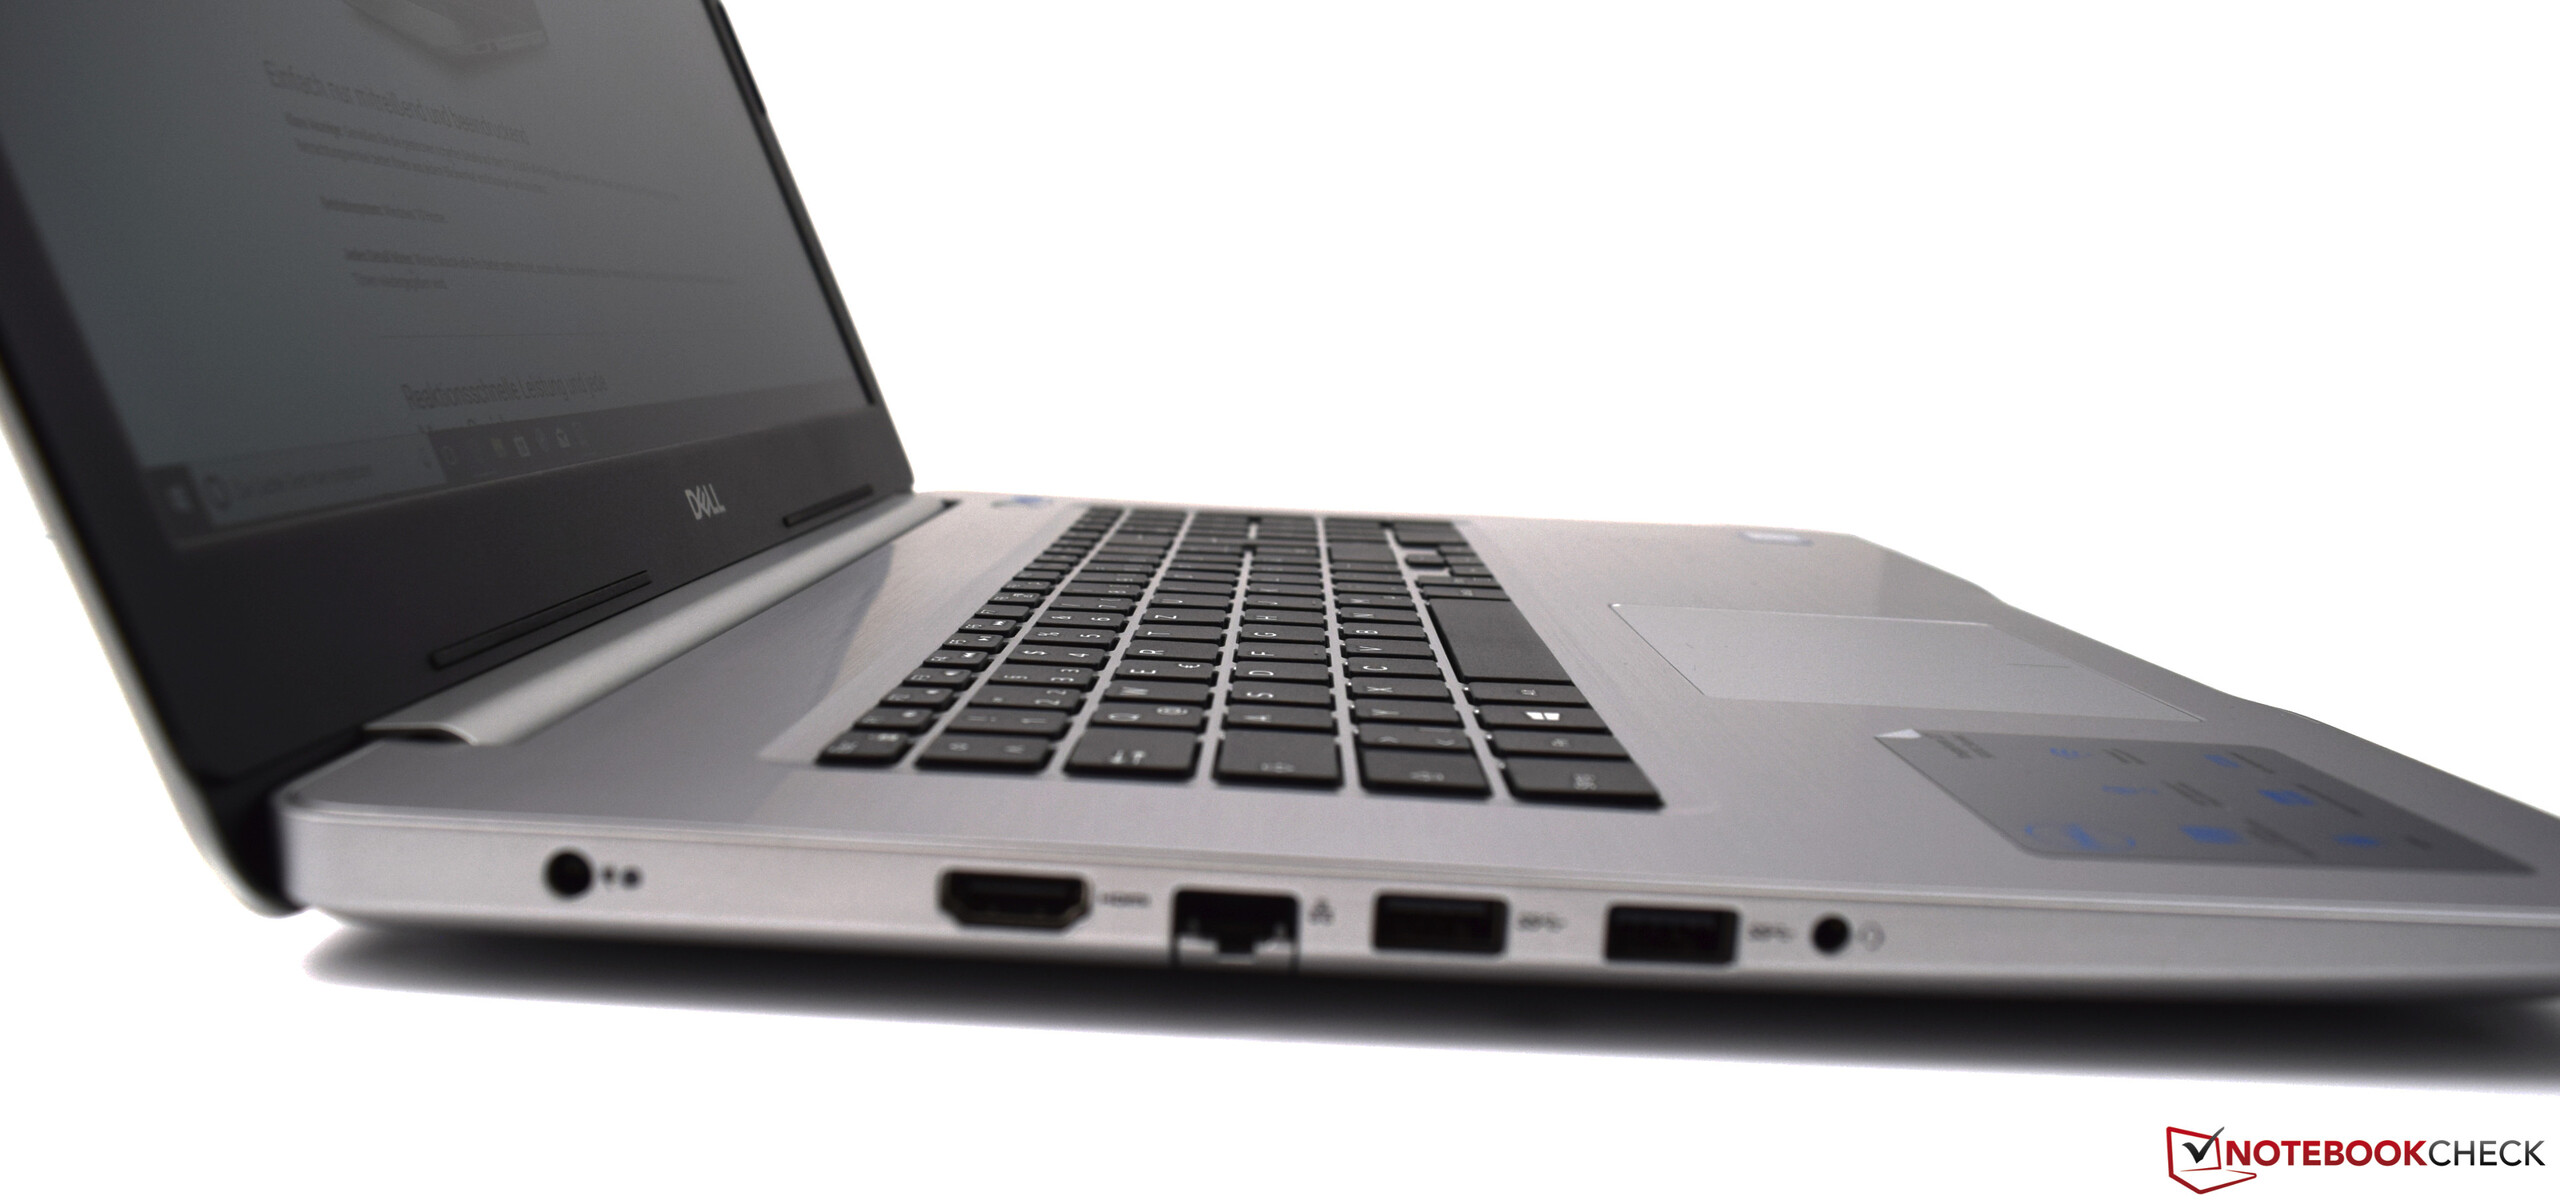
O desempenho terrível do cartão de memória é um ponto claro de crítica para o Dell Inspiron 17-5770. Também não conseguimos compreender como uma porta Ethernet poderia funcionar em apenas 100 MBit/s. Os dispositivos equipados com um conector RJ45 devem oferecer velocidades na faixa GBit. As opiniões diferem sobre a questão da tela IPS, que pode ganhar pontos com uma alta estabilidade dos ângulos de visão e um bom contraste. No entanto, o brilho médio da tela não inspira muito entusiasmo e o forte efeito de nublação é realmente irritante durante a reprodução de vídeo. O que nos deixou perplexos foi o fato de que a porta USB 3.1 Gen 1 Type-C foi retirada. Somente as variantes de gama alta com uma GPU dedicada estão equipadas com esta porta atualizada, mas a razão de por que essa porta foi retirada i5 continua sendo um mistério para os usuários. Pode ter sentido do ponto de vista do marketing para motivar mais clientes a escolherem a variante i7 mais cara, mas essa abordagem certamente não é favorável para o cliente.
Dell Inspiron 17-5770-0357
- 02/19/2018 v6 (old)
Sebastian Bade