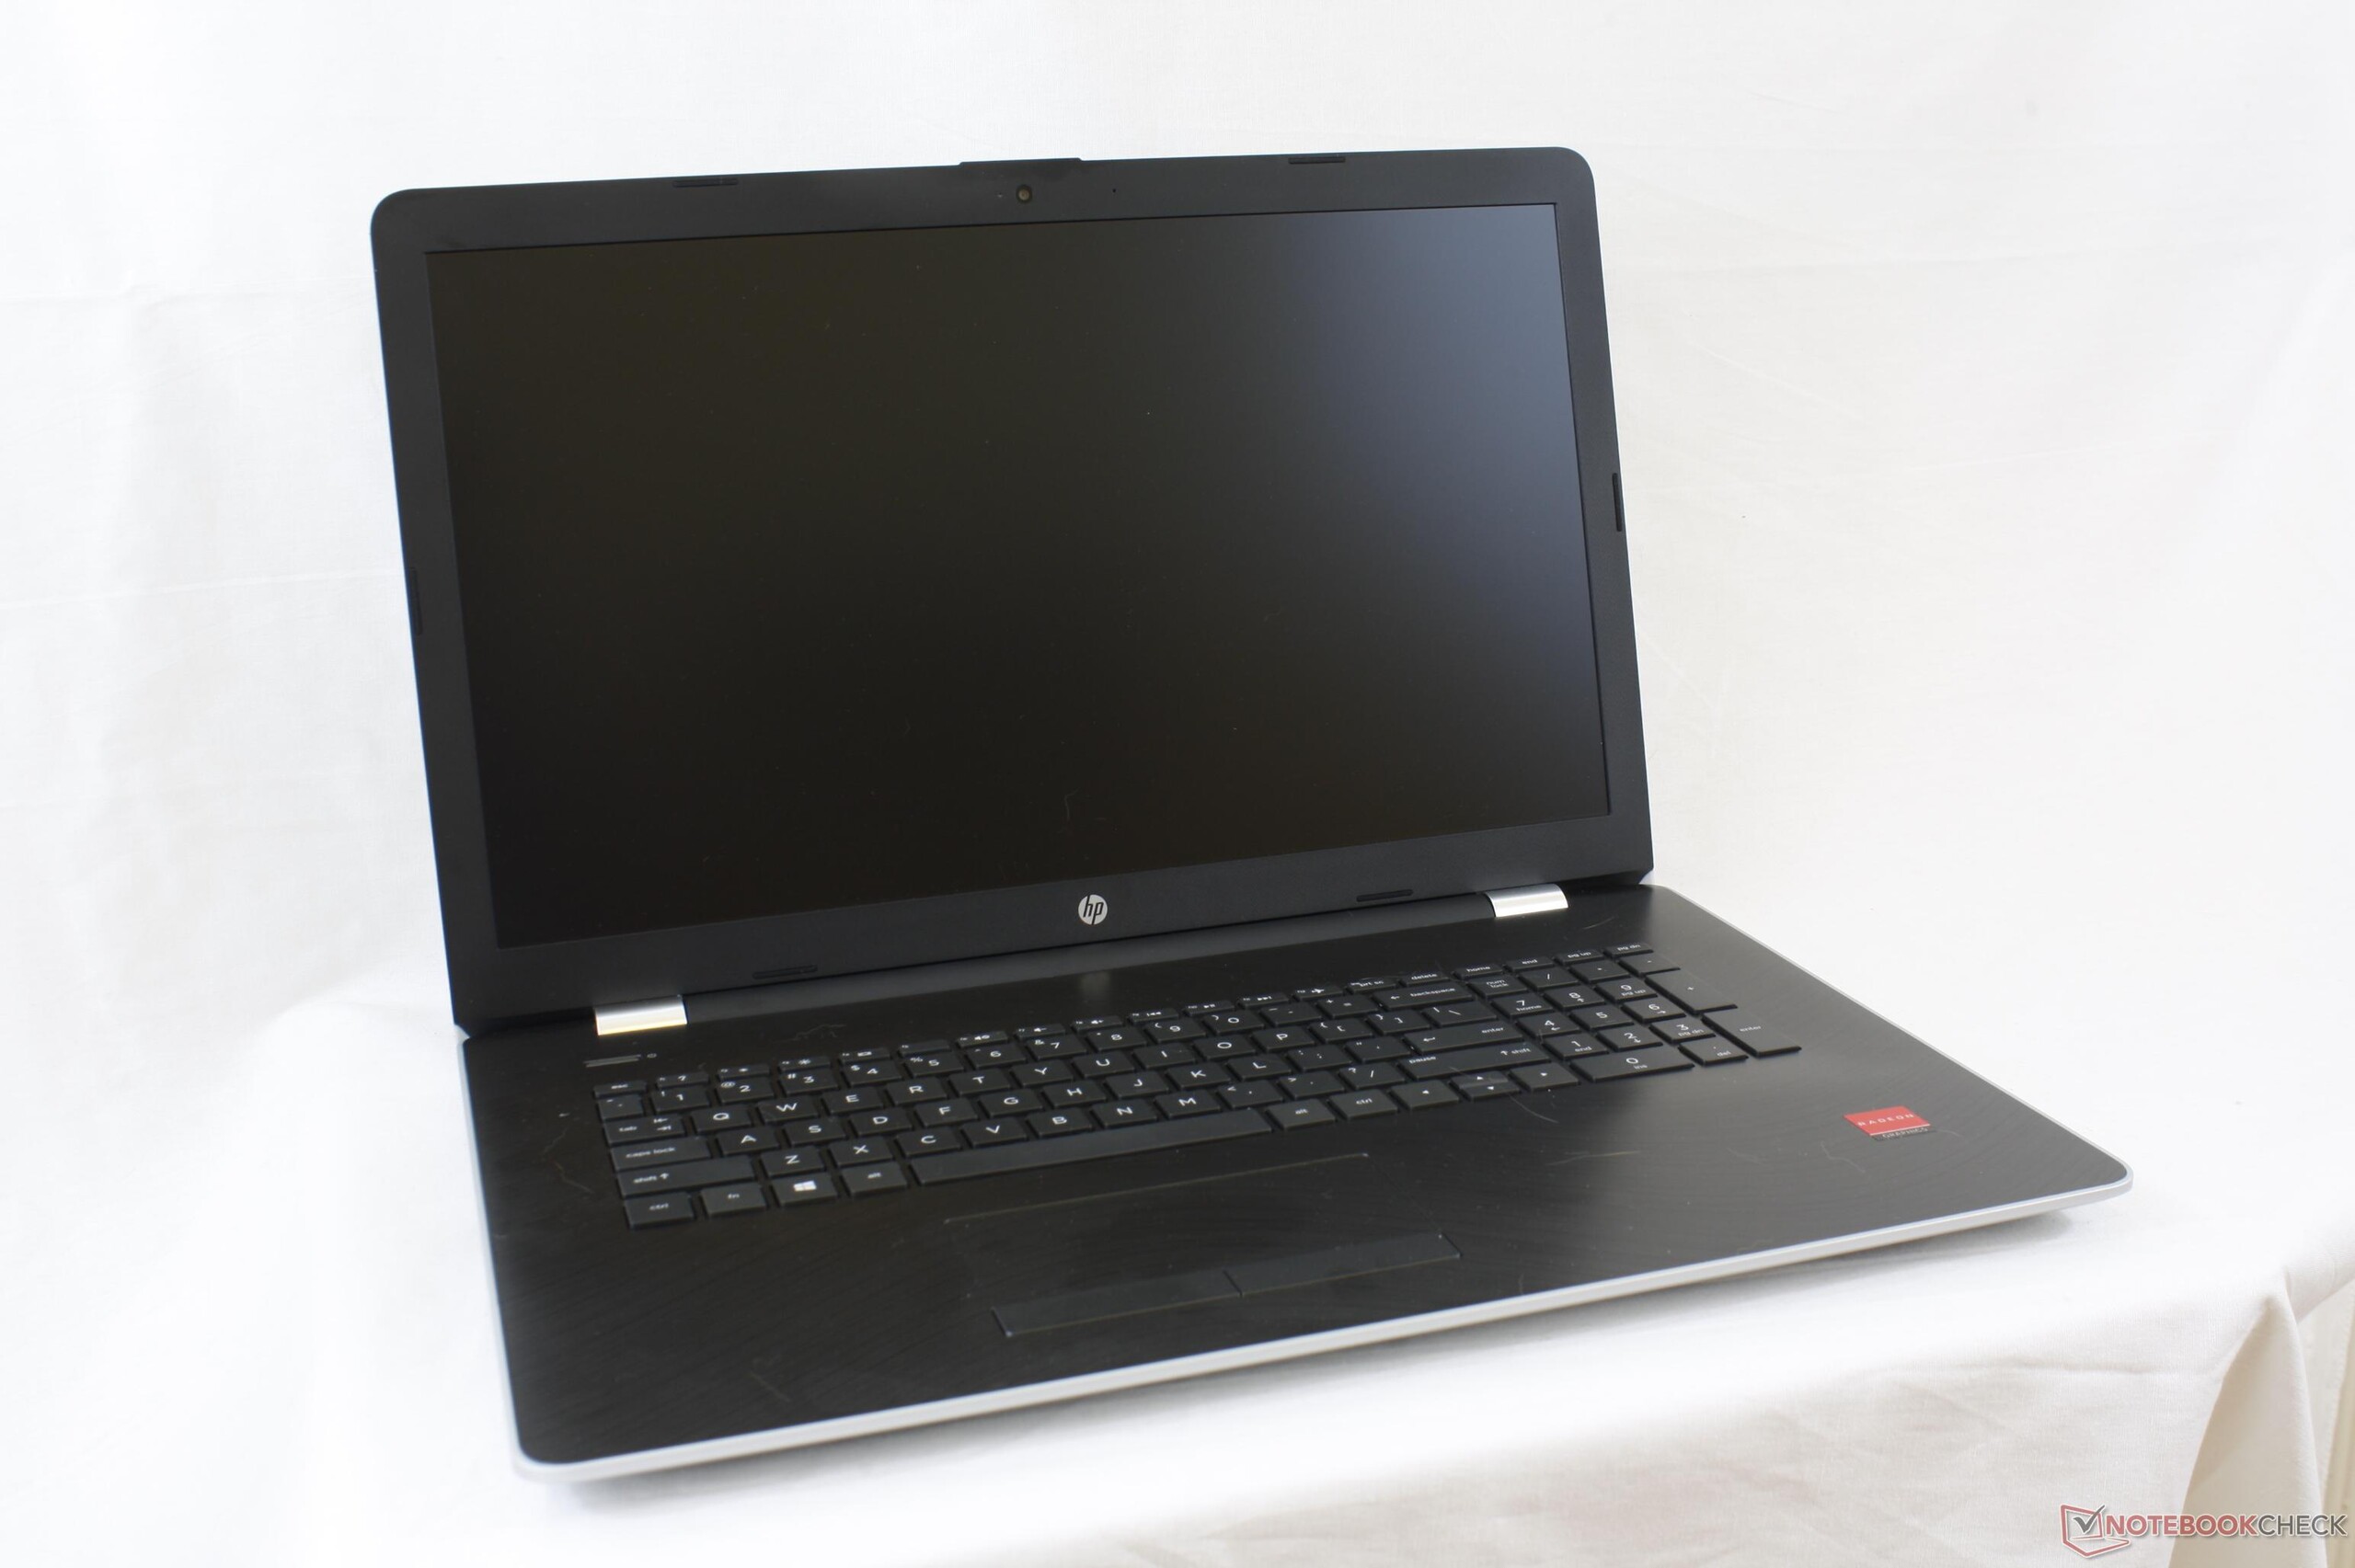
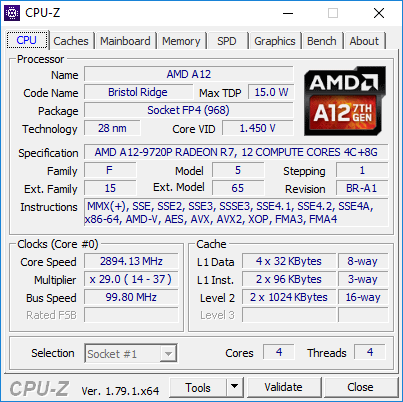
Breve Análise do Portátil HP Pavilion 17z (A12-9720P, Radeon R7 M340)
| SD Card Reader | |
| average JPG Copy Test (av. of 3 runs) | |
| Dell XPS 15 9560 (i7-7700HQ, UHD) | |
| HP Pavilion 17z 1EX13AV | |
| Dell Inspiron 17 5759-5118 | |
| maximum AS SSD Seq Read Test (1GB) | |
| Dell XPS 15 9560 (i7-7700HQ, UHD) | |
| HP Pavilion 17z 1EX13AV | |
| Dell Inspiron 17 5759-5118 | |
| Networking | |
| iperf3 transmit AX12 | |
| Lenovo Ideapad 110-17IKB 80VK0001GE | |
| HP Pavilion 17-x110ng | |
| HP Pavilion 17z 1EX13AV | |
| iperf3 receive AX12 | |
| Lenovo Ideapad 110-17IKB 80VK0001GE | |
| HP Pavilion 17z 1EX13AV | |
| HP Pavilion 17-x110ng | |
| |||||||||||||||||||||||||
iluminação: 91 %
iluminação com acumulador: 333.5 cd/m²
Contraste: 1042:1 (Preto: 0.32 cd/m²)
ΔE ColorChecker Calman: 4 | ∀{0.5-29.43 Ø4.71}
ΔE Greyscale Calman: 4.5 | ∀{0.09-98 Ø4.96}
88.1% sRGB (Argyll 1.6.3 3D)
57.5% AdobeRGB 1998 (Argyll 1.6.3 3D)
64.6% AdobeRGB 1998 (Argyll 3D)
88.5% sRGB (Argyll 3D)
64.3% Display P3 (Argyll 3D)
Gamma: 2.19
CCT: 6386 K
| HP Pavilion 17z 1EX13AV ID: AUO109D, Name: AU Optronics B173HW01 V0, IPS, 17.3", 1920x1080 | HP Pavilion 17-x110ng Chi Mei CMN1738, IPS, WLED, 17.3", 1920x1080 | Lenovo Ideapad 110-17IKB 80VK0001GE AU Optronics B173RTN02.2, TN LED, 17.3", 1600x900 | Asus F756UX-T7013T Chi Mei CMN1735 / N173HGE-E11, TN LED, 17.3", 1920x1080 | Dell Inspiron 17 5759-5118 AU Optronics B173HTN, TN LED, 17.3", 1920x1080 | MSI GL72 7RDX-602 Chi Mei CMN1735 N173HGE-E11, TN LED, 17.3", 1920x1080 | |
|---|---|---|---|---|---|---|
| Display | -2% | -19% | 2% | 4% | 3% | |
| Display P3 Coverage (%) | 64.3 | 63.6 -1% | 51.1 -21% | 63.9 -1% | 69.3 8% | 65.2 1% |
| sRGB Coverage (%) | 88.5 | 86.5 -2% | 73.4 -17% | 93.7 6% | 90.6 2% | 94.3 7% |
| AdobeRGB 1998 Coverage (%) | 64.6 | 63.3 -2% | 52.6 -19% | 64.6 0% | 66.3 3% | 65.6 2% |
| Response Times | -7% | -3% | 9% | -51% | 16% | |
| Response Time Grey 50% / Grey 80% * (ms) | 40.8 ? | 41 ? -0% | 50 ? -23% | 42 ? -3% | 86 ? -111% | 29 ? 29% |
| Response Time Black / White * (ms) | 26.4 ? | 30 ? -14% | 22 ? 17% | 21 ? 20% | 24 ? 9% | 26 ? 2% |
| PWM Frequency (Hz) | 200 ? | 50 ? | 1000 ? | 200 ? | 961 | |
| Screen | -23% | -65% | -17% | -43% | -59% | |
| Brightness middle (cd/m²) | 333.5 | 288 -14% | 231 -31% | 268 -20% | 304 -9% | 299 -10% |
| Brightness (cd/m²) | 323 | 285 -12% | 210 -35% | 255 -21% | 292 -10% | 274 -15% |
| Brightness Distribution (%) | 91 | 88 -3% | 83 -9% | 83 -9% | 84 -8% | 80 -12% |
| Black Level * (cd/m²) | 0.32 | 0.61 -91% | 0.37 -16% | 0.17 47% | 0.37 -16% | 0.25 22% |
| Contrast (:1) | 1042 | 472 -55% | 624 -40% | 1576 51% | 822 -21% | 1196 15% |
| Colorchecker dE 2000 * | 4 | 4.56 -14% | 9.83 -146% | 7.18 -80% | 10.62 -166% | 12.92 -223% |
| Colorchecker dE 2000 max. * | 6.9 | 7.76 -12% | 18.35 -166% | 11.67 -69% | 19.91 -189% | |
| Greyscale dE 2000 * | 4.5 | 4.95 -10% | 12.46 -177% | 7.97 -77% | 11.78 -162% | 13.16 -192% |
| Gamma | 2.19 100% | 2.48 89% | 2.43 91% | 2.34 94% | 2.39 92% | 2.36 93% |
| CCT | 6386 102% | 7669 85% | 13115 50% | 8541 76% | 12997 50% | 15046 43% |
| Color Space (Percent of AdobeRGB 1998) (%) | 57.5 | 48 -17% | 59 3% | 59 3% | 60 4% | |
| Color Space (Percent of sRGB) (%) | 88.1 | 93 6% | 73 -17% | 94 7% | 90 2% | 94 7% |
| Média Total (Programa/Configurações) | -11% /
-16% | -29% /
-48% | -2% /
-10% | -30% /
-34% | -13% /
-37% |
* ... menor é melhor
Exibir tempos de resposta
| ↔ Tempo de resposta preto para branco | ||
|---|---|---|
| 26.4 ms ... ascensão ↗ e queda ↘ combinadas | ↗ 14 ms ascensão | 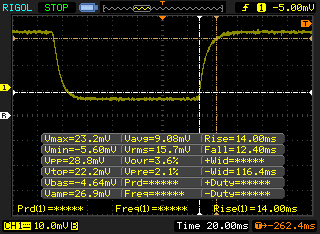 |
| ↘ 12.4 ms queda | ||
| A tela mostra taxas de resposta relativamente lentas em nossos testes e pode ser muito lenta para os jogadores. Em comparação, todos os dispositivos testados variam de 0.1 (mínimo) a 240 (máximo) ms. » 66 % de todos os dispositivos são melhores. Isso significa que o tempo de resposta medido é pior que a média de todos os dispositivos testados (19.8 ms). | ||
| ↔ Tempo de resposta 50% cinza a 80% cinza | ||
| 40.8 ms ... ascensão ↗ e queda ↘ combinadas | ↗ 22 ms ascensão | 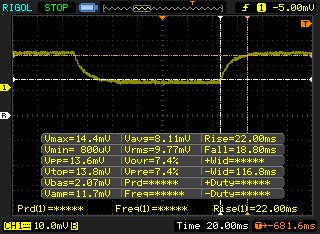 |
| ↘ 18.8 ms queda | ||
| A tela mostra taxas de resposta lentas em nossos testes e será insatisfatória para os jogadores. Em comparação, todos os dispositivos testados variam de 0.165 (mínimo) a 636 (máximo) ms. » 64 % de todos os dispositivos são melhores. Isso significa que o tempo de resposta medido é pior que a média de todos os dispositivos testados (31 ms). | ||
Cintilação da tela / PWM (modulação por largura de pulso)
| Tela tremeluzindo / PWM não detectado | 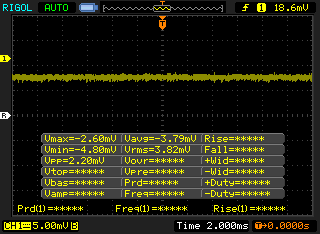 | ||
[pwm_comparison] Em comparação: 52 % de todos os dispositivos testados não usam PWM para escurecer a tela. Se PWM foi detectado, uma média de 7754 (mínimo: 5 - máximo: 343500) Hz foi medida. | |||
| Cinebench R10 | |
| Rendering Multiple CPUs 32Bit | |
| HP Pavilion 17-x110ng | |
| Acer TravelMate P249-M-5452 | |
| HP EliteBook 755 G4 | |
| HP Pavilion 17z 1EX13AV | |
| HP 15-ba077ng | |
| Lenovo Ideapad 110-15ACL 80TJ00H0GE | |
| HP Pavilion 15-aw004ng W8Y60EA | |
| Asus X555LD-XX283H | |
| Asus X555DA-BB11 | |
| Rendering Single 32Bit | |
| HP Pavilion 17-x110ng | |
| Acer TravelMate P249-M-5452 | |
| HP Pavilion 17z 1EX13AV | |
| HP 15-ba077ng | |
| HP EliteBook 755 G4 | |
| HP Pavilion 15-aw004ng W8Y60EA | |
| Asus X555LD-XX283H | |
| Asus X555DA-BB11 | |
| Lenovo Ideapad 110-15ACL 80TJ00H0GE | |
| wPrime 2.10 - 1024m | |
| Lenovo ThinkPad X1 Tablet Gen 2 | |
| HP Pavilion 14t-ab000 K9E07AV | |
| Asus X555DA-BB11 | |
| HP Pavilion 17z 1EX13AV | |
* ... menor é melhor
| PCMark 8 - Home Score Accelerated v2 | |
| Asus ASUSPRO B9440UA-GV0101T | |
| Lenovo Ideapad 110-17IKB 80VK0001GE | |
| Dell Inspiron 17 5759-5118 | |
| HP Pavilion 17-x110ng | |
| HP Pavilion 17z 1EX13AV | |
| Lenovo Yoga 510-14AST | |
| HP EliteBook 725 G4 | |
| Lenovo Yoga 3 Pro 13 80HE004LGE | |
| PCMark 8 Home Score Accelerated v2 | 2783 pontos | |
| PCMark 8 Creative Score Accelerated v2 | 3219 pontos | |
| PCMark 8 Work Score Accelerated v2 | 3518 pontos | |
| PCMark 10 Score | 2235 pontos | |
Ajuda | ||
| HP Pavilion 17z 1EX13AV WDC Scorpio Blue WD10JPVX-60JC3T1 | HP Pavilion 17-x110ng SanDisk Z400s SD8SNAT-256G | Lenovo Ideapad 110-17IKB 80VK0001GE WDC Scorpio Blue WD10JPCX-24UE4T0 | Asus F756UX-T7013T HGST Travelstar 5K1000 HTS541010A9E680 | Dell Inspiron 17 5759-5118 Seagate Momentus SpinPoint M8 ST1000LM024 HN-M101MBB | |
|---|---|---|---|---|---|
| CrystalDiskMark 3.0 | 8313% | 45% | 22% | -9% | |
| Read Seq (MB/s) | 90 | 500 456% | 110.3 23% | 105.8 18% | 91.8 2% |
| Write Seq (MB/s) | 90.3 | 325.1 260% | 109 21% | 105 16% | 84.7 -6% |
| Read 512 (MB/s) | 28.47 | 290.2 919% | 39.19 38% | 33.33 17% | 26.59 -7% |
| Write 512 (MB/s) | 47.07 | 300.3 538% | 52.9 12% | 39.12 -17% | 32.7 -31% |
| Read 4k (MB/s) | 0.31 | 11.24 3526% | 0.45 45% | 0.413 33% | 0.288 -7% |
| Write 4k (MB/s) | 0.3997 | 86 21416% | 1.201 200% | 0.947 137% | 0.638 60% |
| Read 4k QD32 (MB/s) | 1.021 | 145.4 14141% | 1.079 6% | 0.812 -20% | 0.59 -42% |
| Write 4k QD32 (MB/s) | 1.076 | 272.7 25244% | 1.234 15% | 0.968 -10% | 0.642 -40% |

| 3DMark 11 | |
| 1280x720 Performance GPU | |
| Acer Aspire E5-575G-549D | |
| HP Pavilion 17z 1EX13AV | |
| Intel Skull Canyon NUC6i7KYK | |
| Apple MacBook Pro 13 2017 Touchbar i5 | |
| Lenovo Flex 2 Pro-15 | |
| Samsung Notebook 9 NP900X5N-X01US | |
| HP EliteBook 755 G4 | |
| Lenovo IdeaPad 305-15IBD | |
| Lenovo ThinkPad L570 20J80020PB | |
| Acer TravelMate P249-M-5452 | |
| HP 15-bw077ax | |
| Lenovo Ideapad 110-15ACL 80TJ00H0GE | |
| Toshiba Portege Z20t-B-10C | |
| 1280x720 Performance Combined | |
| Acer Aspire E5-575G-549D | |
| Intel Skull Canyon NUC6i7KYK | |
| Apple MacBook Pro 13 2017 Touchbar i5 | |
| Samsung Notebook 9 NP900X5N-X01US | |
| Lenovo Flex 2 Pro-15 | |
| Lenovo ThinkPad L570 20J80020PB | |
| Acer TravelMate P249-M-5452 | |
| Lenovo IdeaPad 305-15IBD | |
| HP Pavilion 17z 1EX13AV | |
| HP EliteBook 755 G4 | |
| Lenovo Ideapad 110-15ACL 80TJ00H0GE | |
| HP 15-bw077ax | |
| Toshiba Portege Z20t-B-10C | |
| 3DMark | |
| 1280x720 Cloud Gate Standard Graphics | |
| Acer Aspire E5-575G-549D | |
| Intel Skull Canyon NUC6i7KYK | |
| Apple MacBook Pro 13 2017 Touchbar i5 | |
| HP Pavilion 17z 1EX13AV | |
| Lenovo ThinkPad L570 20J80020PB | |
| Lenovo Flex 2 Pro-15 | |
| Samsung Notebook 9 NP900X5N-X01US | |
| Acer TravelMate P249-M-5452 | |
| HP EliteBook 755 G4 | |
| Lenovo IdeaPad 305-15IBD | |
| Toshiba Portege Z20t-B-10C | |
| HP 15-bw077ax | |
| 1920x1080 Fire Strike Graphics | |
| Acer Aspire E5-575G-549D | |
| HP Pavilion 17z 1EX13AV | |
| Intel Skull Canyon NUC6i7KYK | |
| Apple MacBook Pro 13 2017 Touchbar i5 | |
| Samsung Notebook 9 NP900X5N-X01US | |
| Lenovo Flex 2 Pro-15 | |
| Lenovo ThinkPad L570 20J80020PB | |
| HP EliteBook 755 G4 | |
| Lenovo IdeaPad 305-15IBD | |
| Acer TravelMate P249-M-5452 | |
| HP 15-bw077ax | |
| Toshiba Portege Z20t-B-10C | |
| 3DMark 11 Performance | 2961 pontos | |
| 3DMark Ice Storm Standard Score | 41857 pontos | |
| 3DMark Cloud Gate Standard Score | 5704 pontos | |
| 3DMark Fire Strike Score | 1407 pontos | |
Ajuda | ||
| BioShock Infinite - 1366x768 High Preset | |
| Acer Aspire E5-575G-549D | |
| Acer Aspire V17 Nitro VN7-791G-50MV | |
| Samsung Notebook 9 NP900X5N-X01US | |
| Asus X302UV-FN016T | |
| HP Pavilion 17z 1EX13AV | |
| Lenovo ThinkPad X1 Tablet Gen 2 | |
| Dell Latitude 5280 | |
| Toshiba Satellite Pro R50-C-16V | |
| Rise of the Tomb Raider - 1024x768 Lowest Preset | |
| Acer Aspire E5-575G-549D | |
| Samsung Notebook 9 NP900X5N-X01US | |
| HP Pavilion 17z 1EX13AV | |
| Microsoft Surface Pro (2017) i7 | |
| Asus X302UV-FN016T | |
| Dell Latitude 5280 | |
| baixo | média | alto | ultra | |
|---|---|---|---|---|
| StarCraft II: Heart of the Swarm (2013) | 61 | 35.5 | 21.5 | |
| BioShock Infinite (2013) | 74.5 | 43.5 | 34.1 | 11.8 |
| Metro: Last Light (2013) | 32.6 | 26 | 18.9 | |
| Thief (2014) | 20.3 | |||
| The Witcher 3 (2015) | 19 | |||
| Batman: Arkham Knight (2015) | 19 | |||
| Metal Gear Solid V (2015) | 57 | 40 | 14 | |
| Dota 2 Reborn (2015) | 46 | 38 | 21 | 18 |
| Fallout 4 (2015) | 25.6 | |||
| Rise of the Tomb Raider (2016) | 28.2 | 15 | ||
| Doom (2016) | 20.2 | |||
| Overwatch (2016) | 54.8 | 44.9 | ||
| Prey (2017) | 38.4 | 14.7 |
Barulho
| Ocioso |
| 30.4 / 30.5 / 30.5 dB |
| Carga |
| 41.5 / 48.2 dB |
 | ||
30 dB silencioso 40 dB(A) audível 50 dB(A) ruidosamente alto |
||
min: | ||
| HP Pavilion 17z 1EX13AV Radeon R7 M340, A12-9720P, WDC Scorpio Blue WD10JPVX-60JC3T1 | HP Pavilion 17-x110ng Radeon R7 M440, i5-7200U, SanDisk Z400s SD8SNAT-256G | Lenovo Ideapad 110-17IKB 80VK0001GE Radeon R5 M430, i5-7200U, WDC Scorpio Blue WD10JPCX-24UE4T0 | Asus F756UX-T7013T GeForce GTX 950M, 6200U, HGST Travelstar 5K1000 HTS541010A9E680 | Dell Inspiron 17 5759-5118 Radeon R5 M335, 6200U, Seagate Momentus SpinPoint M8 ST1000LM024 HN-M101MBB | MSI GL72 7RDX-602 GeForce GTX 1050 Mobile, i7-7700HQ, HGST Travelstar 7K1000 HTS721010A9E630 | |
|---|---|---|---|---|---|---|
| Noise | 3% | 1% | -5% | -6% | -3% | |
| desligado / ambiente * (dB) | 28 | 29 -4% | 30.5 -9% | 31.2 -11% | 30.8 -10% | |
| Idle Minimum * (dB) | 30.4 | 31 -2% | 32.5 -7% | 32.4 -7% | 33.9 -12% | 32.4 -7% |
| Idle Average * (dB) | 30.5 | 31 -2% | 32.5 -7% | 32.6 -7% | 33.9 -11% | 32.4 -6% |
| Idle Maximum * (dB) | 30.5 | 31 -2% | 32.5 -7% | 32.6 -7% | 33.9 -11% | 32.8 -8% |
| Load Average * (dB) | 41.5 | 33.8 19% | 34.6 17% | 42 -1% | 43.8 -6% | 40.9 1% |
| Witcher 3 ultra * (dB) | 41.8 | |||||
| Load Maximum * (dB) | 48.2 | 44.8 7% | 38.3 21% | 45.2 6% | 44.2 8% | 43.6 10% |
* ... menor é melhor
(±) A temperatura máxima no lado superior é 40.8 °C / 105 F, em comparação com a média de 36.8 °C / 98 F , variando de 21 a 71 °C para a classe Multimedia.
(±) A parte inferior aquece até um máximo de 41.6 °C / 107 F, em comparação com a média de 39.1 °C / 102 F
(+) Em uso inativo, a temperatura média para o lado superior é 23.3 °C / 74 F, em comparação com a média do dispositivo de 31.3 °C / ### class_avg_f### F.
(±) Jogando The Witcher 3, a temperatura média para o lado superior é 33.2 °C / 92 F, em comparação com a média do dispositivo de 31.3 °C / ## #class_avg_f### F.
(+) Os apoios para as mãos e o touchpad estão atingindo a temperatura máxima da pele (32.8 °C / 91 F) e, portanto, não estão quentes.
(-) A temperatura média da área do apoio para as mãos de dispositivos semelhantes foi 28.7 °C / 83.7 F (-4.1 °C / -7.3 F).
HP Pavilion 17z 1EX13AV análise de áudio
(-) | alto-falantes não muito altos (###valor### dB)
Graves 100 - 315Hz
(±) | graves reduzidos - em média 13.7% menor que a mediana
(-) | graves não são lineares (16.5% delta para frequência anterior)
Médios 400 - 2.000 Hz
(+) | médios equilibrados - apenas 3.5% longe da mediana
(-) | médios não são lineares (17.3% delta para frequência anterior)
Altos 2 - 16 kHz
(+) | agudos equilibrados - apenas 4.6% longe da mediana
(-) | os máximos não são lineares (18.5% delta da frequência anterior)
Geral 100 - 16.000 Hz
(±) | a linearidade do som geral é média (27.5% diferença em relação à mediana)
Comparado com a mesma classe
» 93% de todos os dispositivos testados nesta classe foram melhores, 2% semelhantes, 5% piores
» O melhor teve um delta de 5%, a média foi 17%, o pior foi 45%
Comparado com todos os dispositivos testados
» 84% de todos os dispositivos testados foram melhores, 3% semelhantes, 13% piores
» O melhor teve um delta de 4%, a média foi 23%, o pior foi 134%
Apple MacBook 12 (Early 2016) 1.1 GHz análise de áudio
(+) | os alto-falantes podem tocar relativamente alto (###valor### dB)
Graves 100 - 315Hz
(±) | graves reduzidos - em média 11.3% menor que a mediana
(±) | a linearidade dos graves é média (14.2% delta para a frequência anterior)
Médios 400 - 2.000 Hz
(+) | médios equilibrados - apenas 2.4% longe da mediana
(+) | médios são lineares (5.5% delta para frequência anterior)
Altos 2 - 16 kHz
(+) | agudos equilibrados - apenas 2% longe da mediana
(+) | os máximos são lineares (4.5% delta da frequência anterior)
Geral 100 - 16.000 Hz
(+) | o som geral é linear (10.2% diferença em relação à mediana)
Comparado com a mesma classe
» 7% de todos os dispositivos testados nesta classe foram melhores, 2% semelhantes, 90% piores
» O melhor teve um delta de 5%, a média foi 18%, o pior foi 53%
Comparado com todos os dispositivos testados
» 5% de todos os dispositivos testados foram melhores, 1% semelhantes, 94% piores
» O melhor teve um delta de 4%, a média foi 23%, o pior foi 134%
| desligado | |
| Ocioso | |
| Carga |
|
Key:
min: | |
| HP Pavilion 17z 1EX13AV A12-9720P, Radeon R7 M340, WDC Scorpio Blue WD10JPVX-60JC3T1, IPS, 1920x1080, 17.3" | HP Pavilion 17-x110ng i5-7200U, Radeon R7 M440, SanDisk Z400s SD8SNAT-256G, IPS, WLED, 1920x1080, 17.3" | Lenovo Ideapad 110-17IKB 80VK0001GE i5-7200U, Radeon R5 M430, WDC Scorpio Blue WD10JPCX-24UE4T0, TN LED, 1600x900, 17.3" | Asus F756UX-T7013T 6200U, GeForce GTX 950M, HGST Travelstar 5K1000 HTS541010A9E680, TN LED, 1920x1080, 17.3" | Dell Inspiron 17 5759-5118 6200U, Radeon R5 M335, Seagate Momentus SpinPoint M8 ST1000LM024 HN-M101MBB, TN LED, 1920x1080, 17.3" | MSI GL72 7RDX-602 i7-7700HQ, GeForce GTX 1050 Mobile, HGST Travelstar 7K1000 HTS721010A9E630, TN LED, 1920x1080, 17.3" | |
|---|---|---|---|---|---|---|
| Power Consumption | 8% | 26% | 5% | 19% | -49% | |
| Idle Minimum * (Watt) | 7.8 | 7.7 1% | 6.9 12% | 5.8 26% | 6.2 21% | 9.6 -23% |
| Idle Average * (Watt) | 11.7 | 14 -20% | 9.6 18% | 11.2 4% | 11.6 1% | 15 -28% |
| Idle Maximum * (Watt) | 15.7 | 15.1 4% | 11.7 25% | 11.9 24% | 12.3 22% | 16.5 -5% |
| Load Average * (Watt) | 57.4 | 33 43% | 29 49% | 54 6% | 36 37% | 104 -81% |
| Witcher 3 ultra * (Watt) | 53.3 | |||||
| Load Maximum * (Watt) | 62.3 | 54.6 12% | 45.4 27% | 84 -35% | 55 12% | 129 -107% |
* ... menor é melhor
| HP Pavilion 17z 1EX13AV A12-9720P, Radeon R7 M340, 41.6 Wh | HP Pavilion 17-x110ng i5-7200U, Radeon R7 M440, 41 Wh | Lenovo Ideapad 110-17IKB 80VK0001GE i5-7200U, Radeon R5 M430, 32 Wh | Asus F756UX-T7013T 6200U, GeForce GTX 950M, 38 Wh | Dell Inspiron 17 5759-5118 6200U, Radeon R5 M335, 40 Wh | MSI GL72 7RDX-602 i7-7700HQ, GeForce GTX 1050 Mobile, 43.2 Wh | |
|---|---|---|---|---|---|---|
| Duração da bateria | 34% | 5% | 7% | 23% | -25% | |
| Reader / Idle (h) | 6.8 | 8.8 29% | 8.2 21% | 9.6 41% | 5.5 -19% | |
| WiFi v1.3 (h) | 3.9 | 5.8 49% | 4.1 5% | 3.6 -8% | 5 28% | 3.4 -13% |
| Load (h) | 1.2 | 1.5 25% | 1.3 8% | 1.2 0% | 0.7 -42% |
Pro
Contra

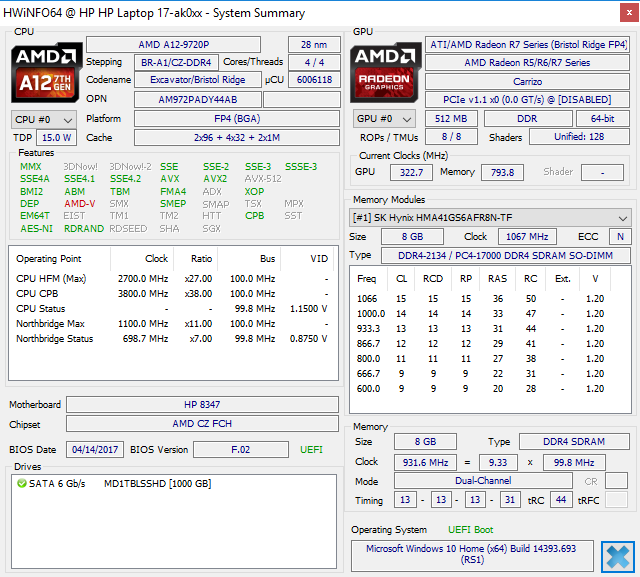
A APU A12-9720P é um exemplo forte de quanto a AMD anda na corridas dos CPUs antes da chegada do Ryzen e da arquitetura Zen. Normalmente, quando um processador esquenta faz mais barulho do que uma alternativa, você esperaria que fosse mais rápido. Isso não é assim para o A12-9720P, pois ele esquenta mais, é mais barulhento e mais lento que o Core i3-5010U de duas gerações atrás. Os programas demoram em serem lançados e instalados mesmo com um sistema baseado em HDD.
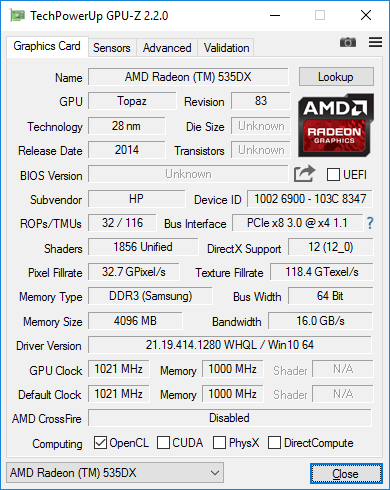
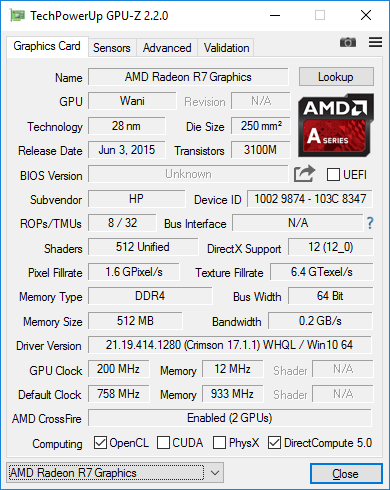
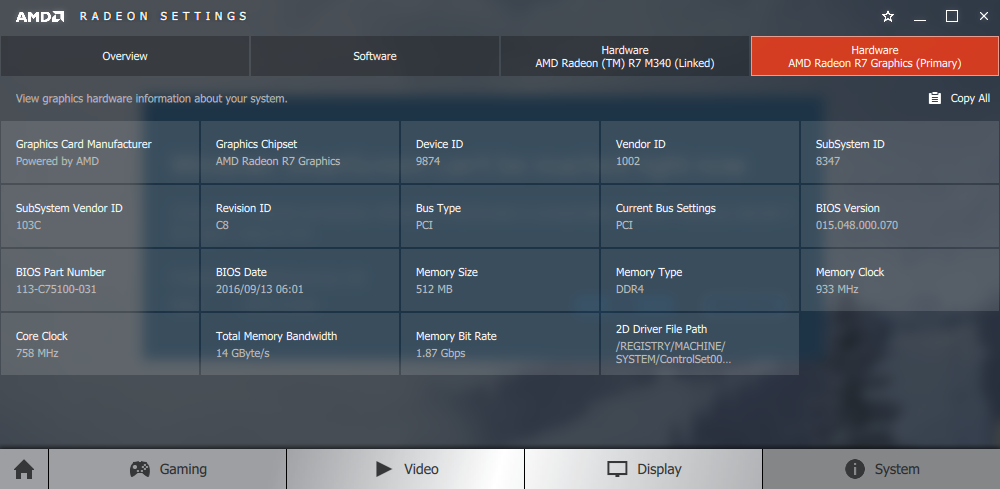
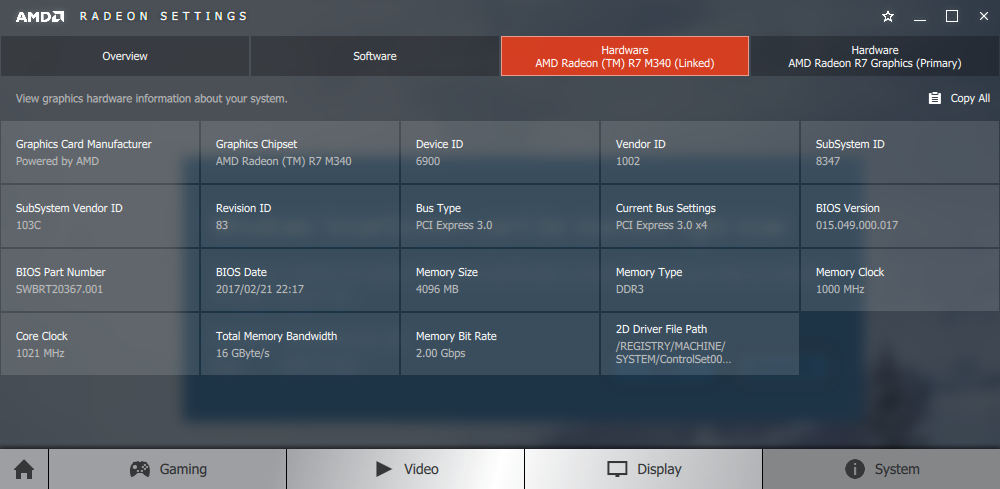
No que diz respeito à GPU, o Radeon R7 M340 na verdade não é muito ruim, dado que está quase lá com a GTX 950M em potência gráfica bruta. O principal problema é que está acorrentada a uma CPU muito lenta até o ponto em que o desempenho de jogos real é significativamente mais lento do que um portátil GTX 950M. Este desequilíbrio evita que o Pavilion 17z seja uma máquina de jogos econômica e nos faz questionar a inclusão do R7 M340 em primeiro lugar. A GPU está simplesmente sugando mais energia, adicionando mais calor e reduzindo a duração da bateria sem realmente beneficiar o usuário com todo seu potencial. Simplificando, os portáteis Ryzen não poderão se beneficiar rapidamente.
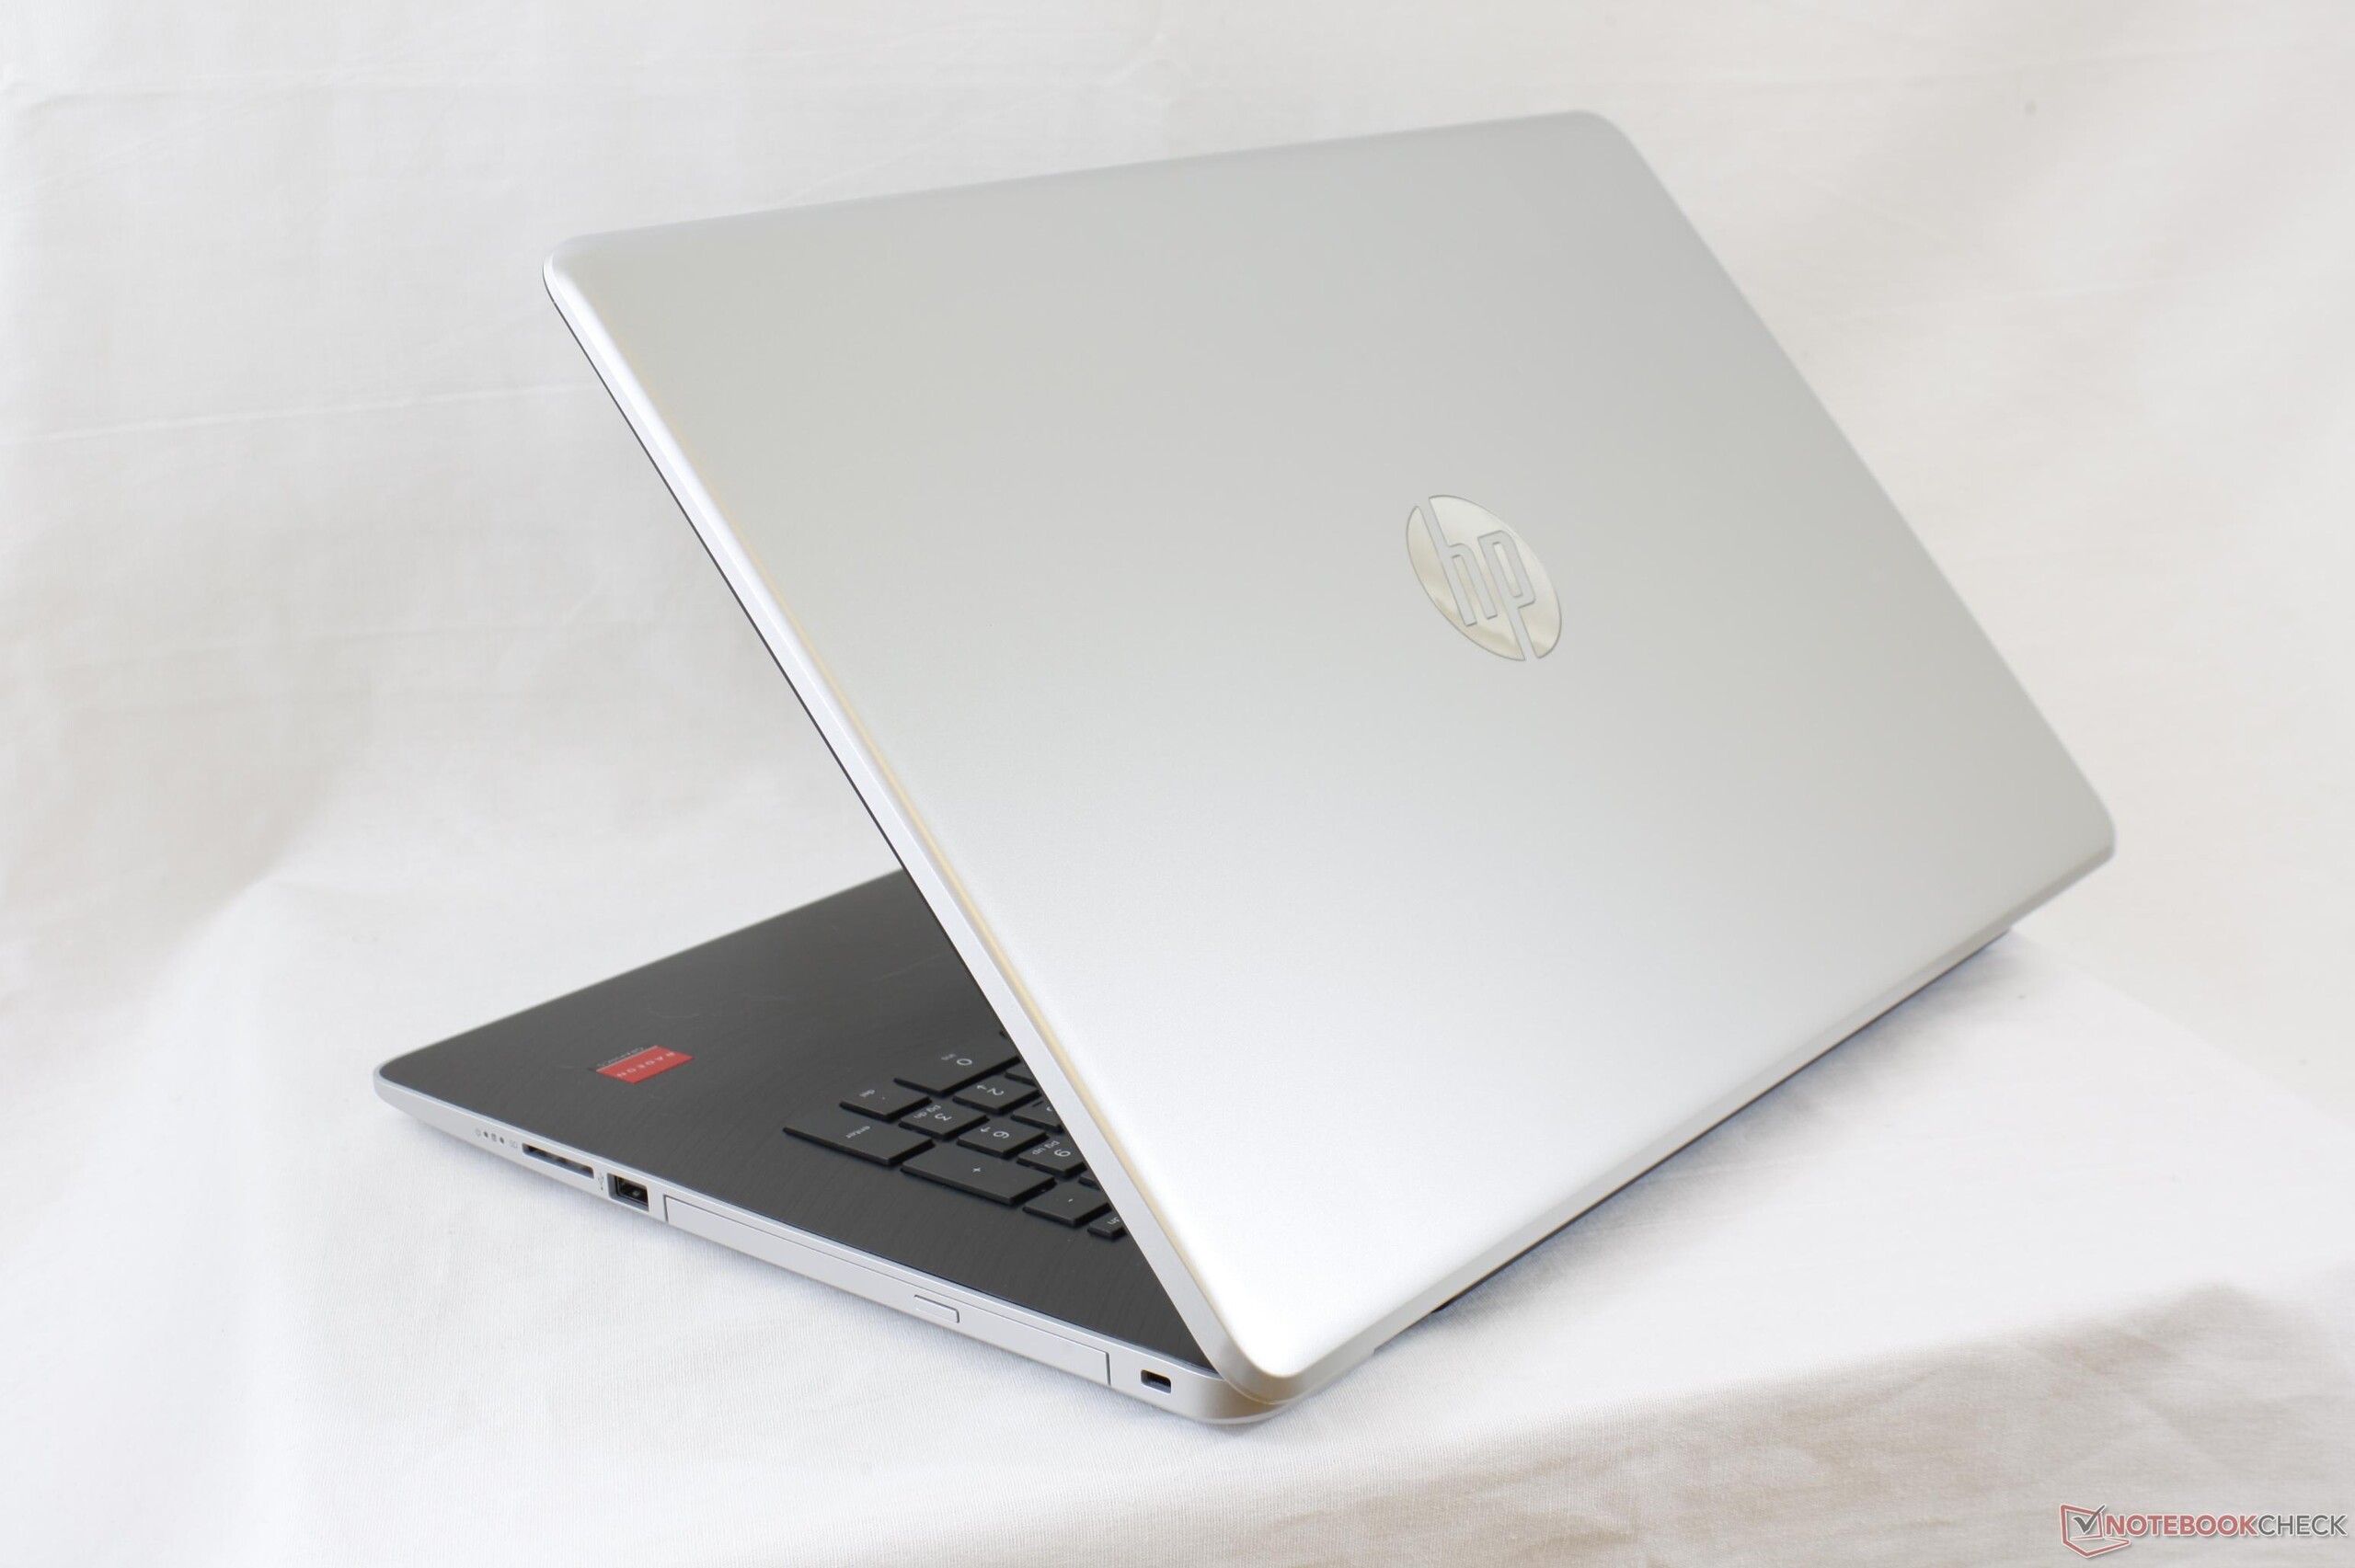
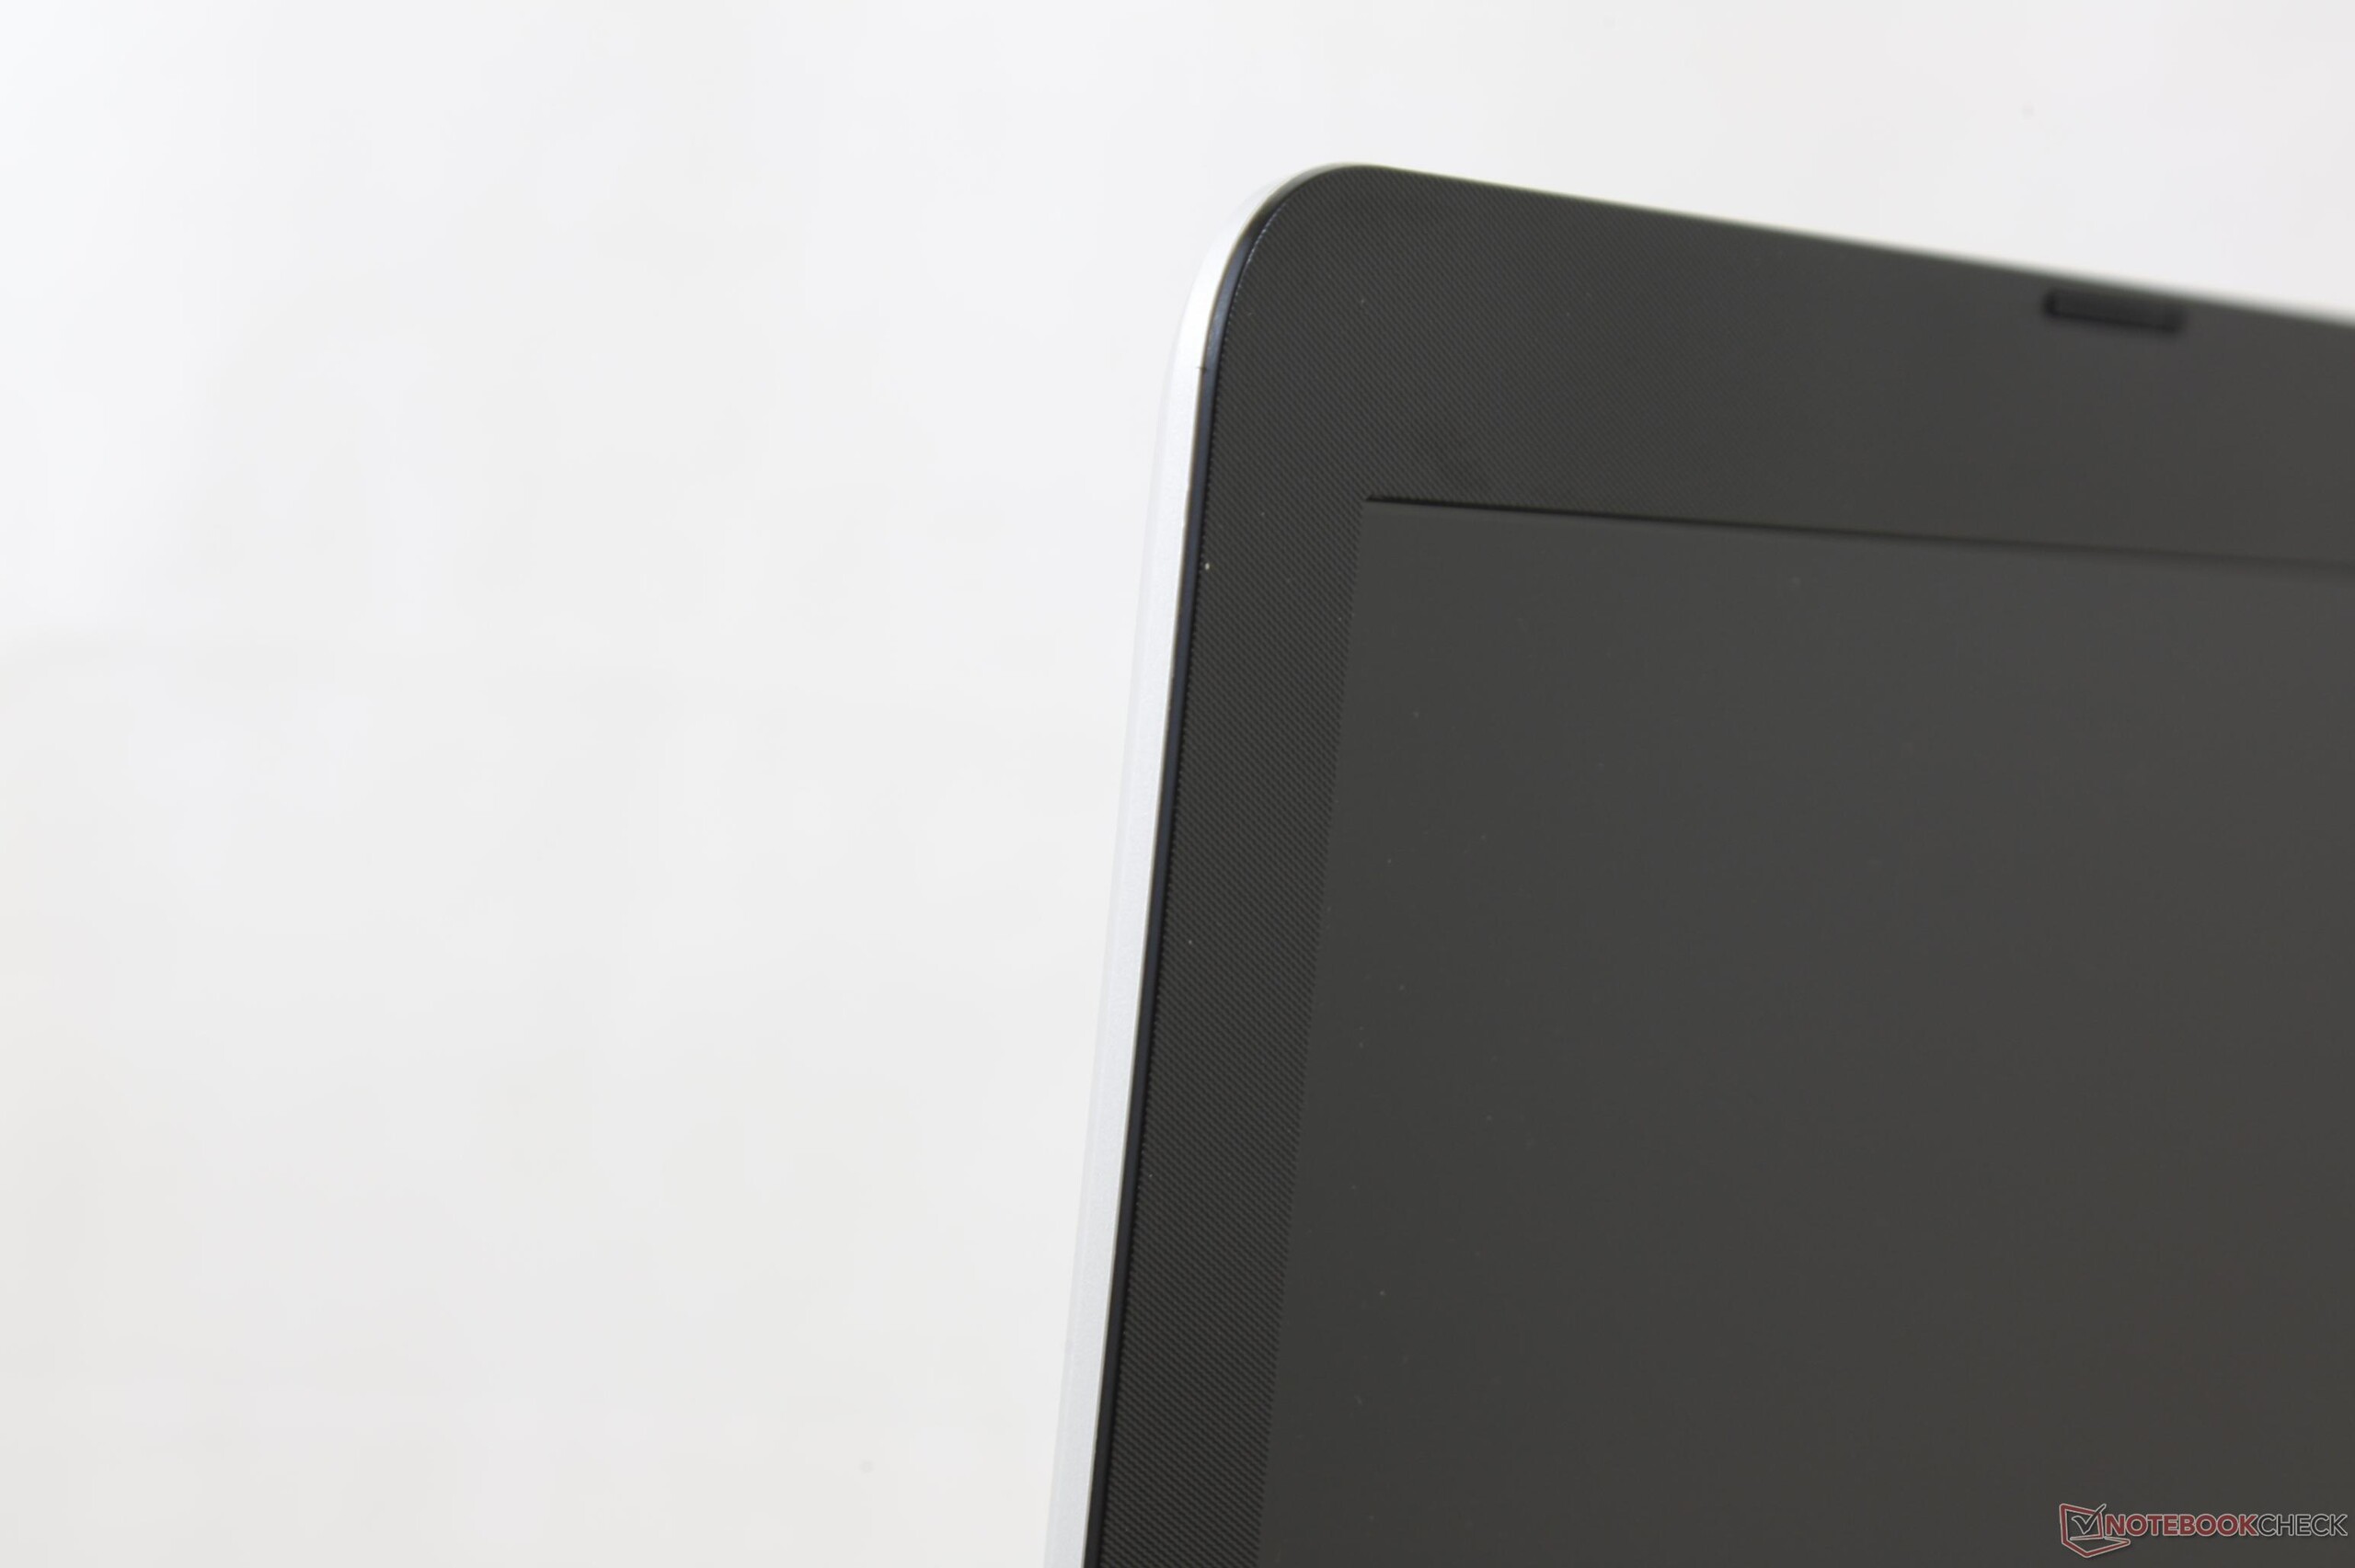
Fora as nossas reclamações da AMD, o hardware do Pavilion 17z é decente, nada espetacular, considerando o baixo preço. As cores e o contraste são muito bons para uma oferta de econômica, mas quase todo o resto do portátil, desde o painel granulado até a sensação das superfícies de plástico, está um nível abaixo do convencional.
Você recebe o que pagou. O Pavilion 17z, com AMD, certamente é menos caro do que um equivalente da Intel, mas o impacto no desempenho e na duração da bateria é muito grande para engolir.
HP Pavilion 17z 1EX13AV
- 07/14/2017 v6 (old)
Allen Ngo
Price comparison
