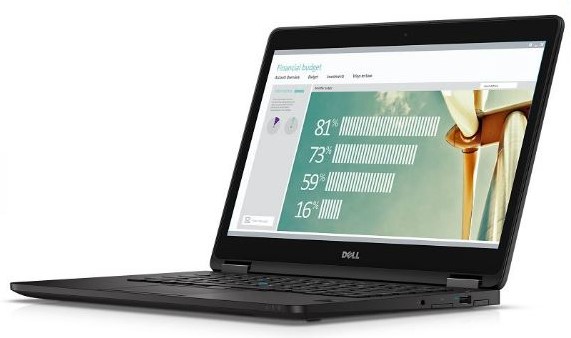
Breve Análise do Portátil Dell Latitude 12 E7270
| Networking | |
| iperf Server (receive) TCP 1 m 512KB | |
| Dell Latitude 12 E7270 | |
| Dell Latitude 13 7370 | |
| Lenovo ThinkPad X260-20F6007RGE | |
| iperf Client (transmit) TCP 1 m 512KB | |
| Lenovo ThinkPad X260-20F6007RGE | |
| Dell Latitude 13 7370 | |
| Dell Latitude 12 E7270 | |
| |||||||||||||||||||||||||
iluminação: 91 %
iluminação com acumulador: 354 cd/m²
Contraste: 751:1 (Preto: 0.47 cd/m²)
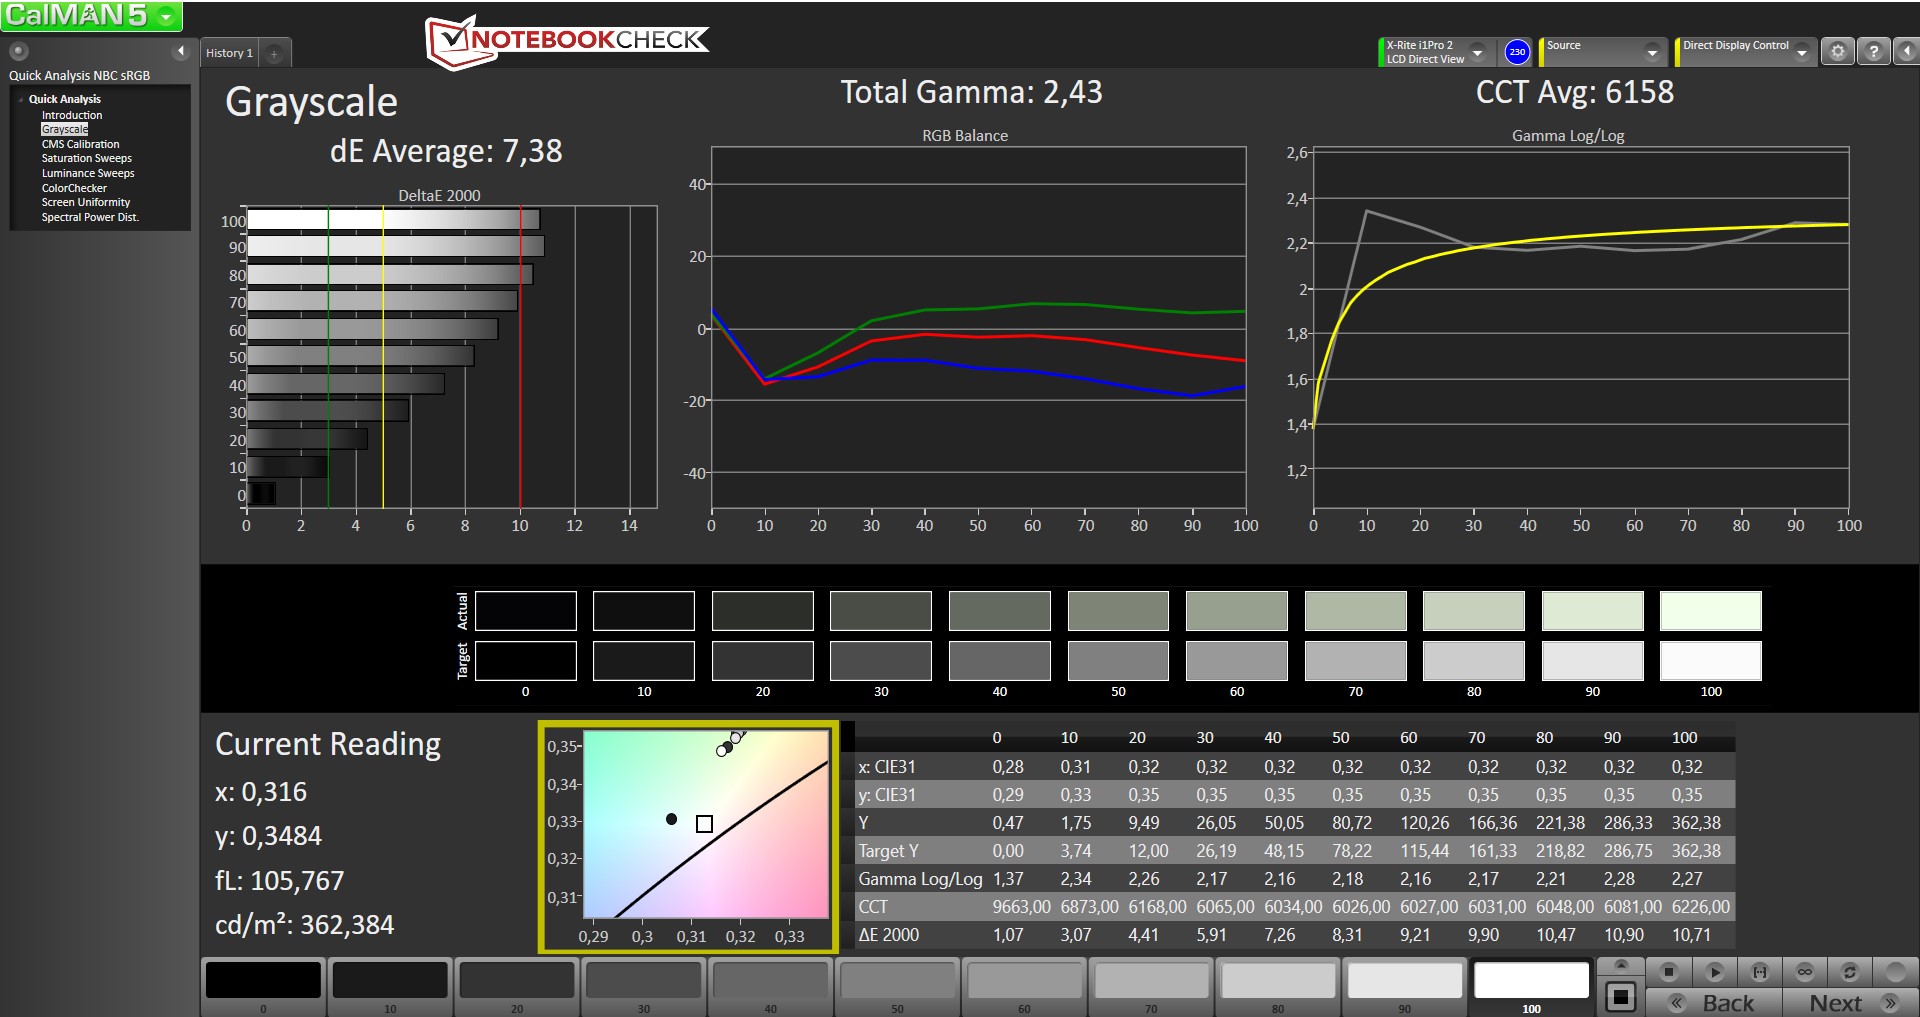
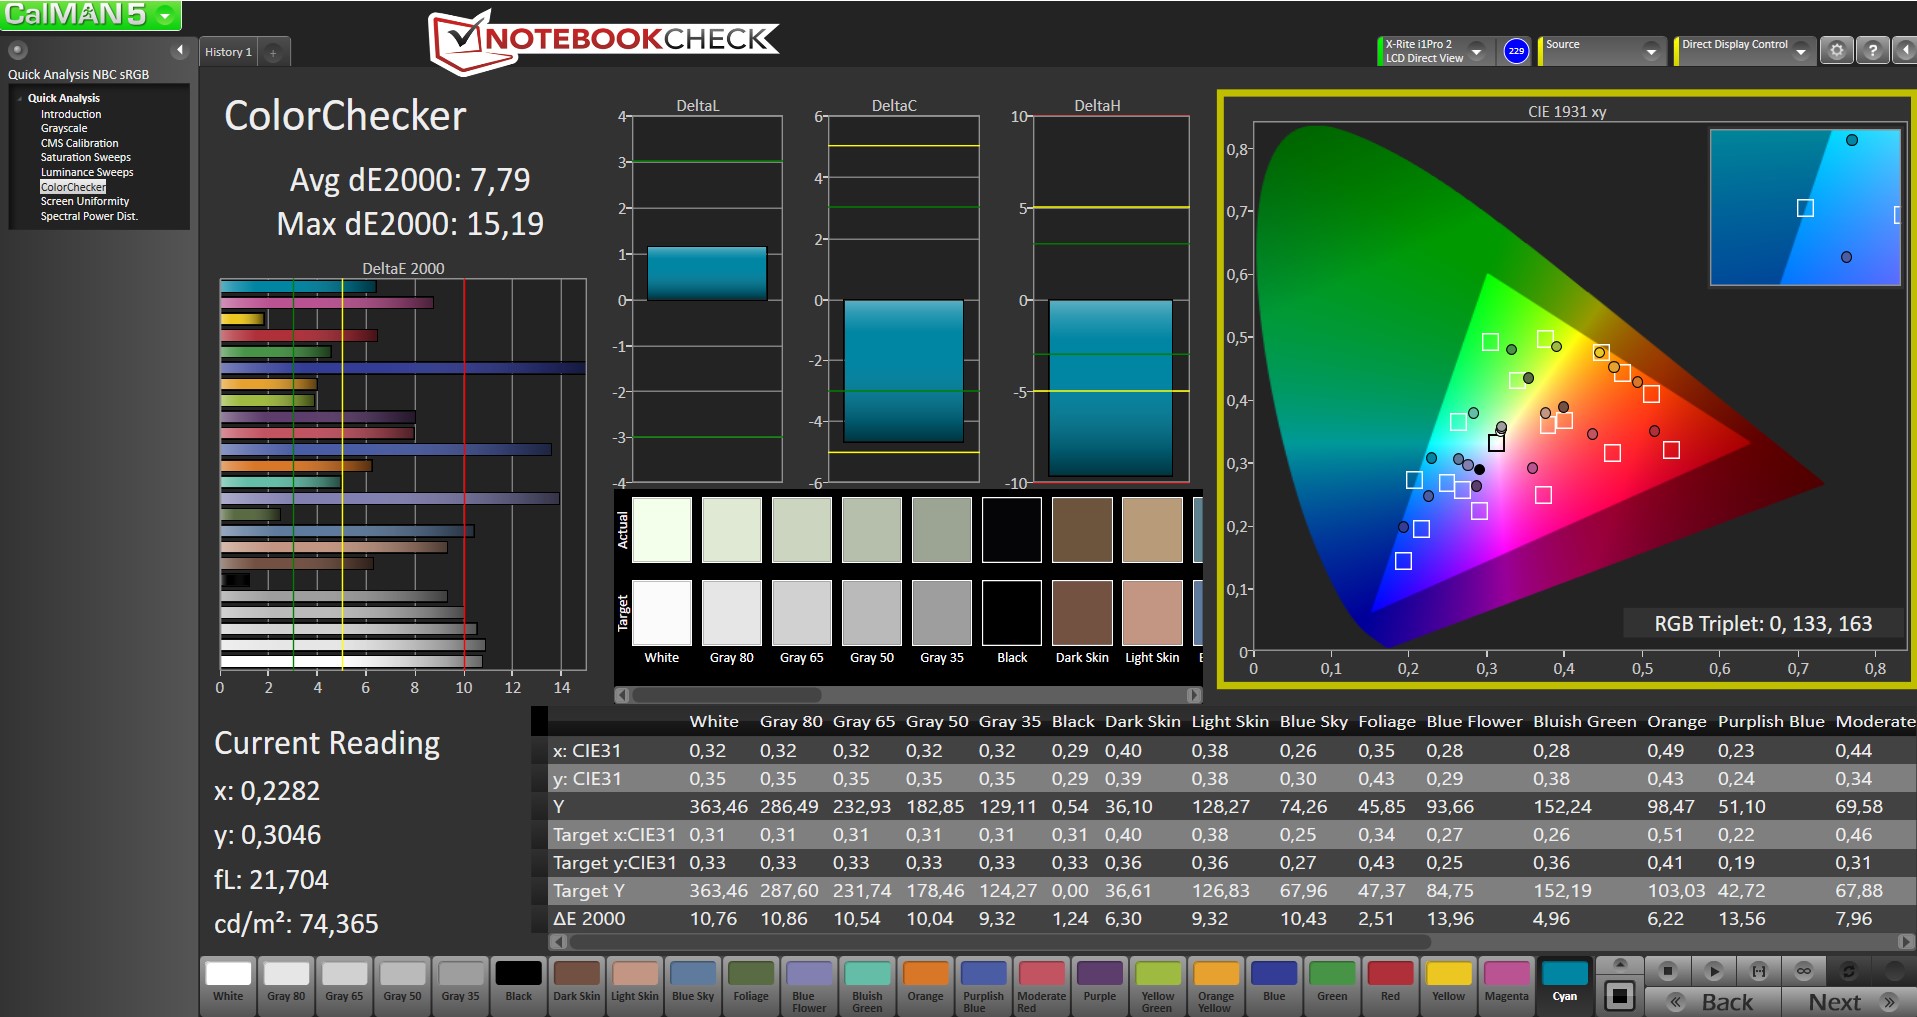
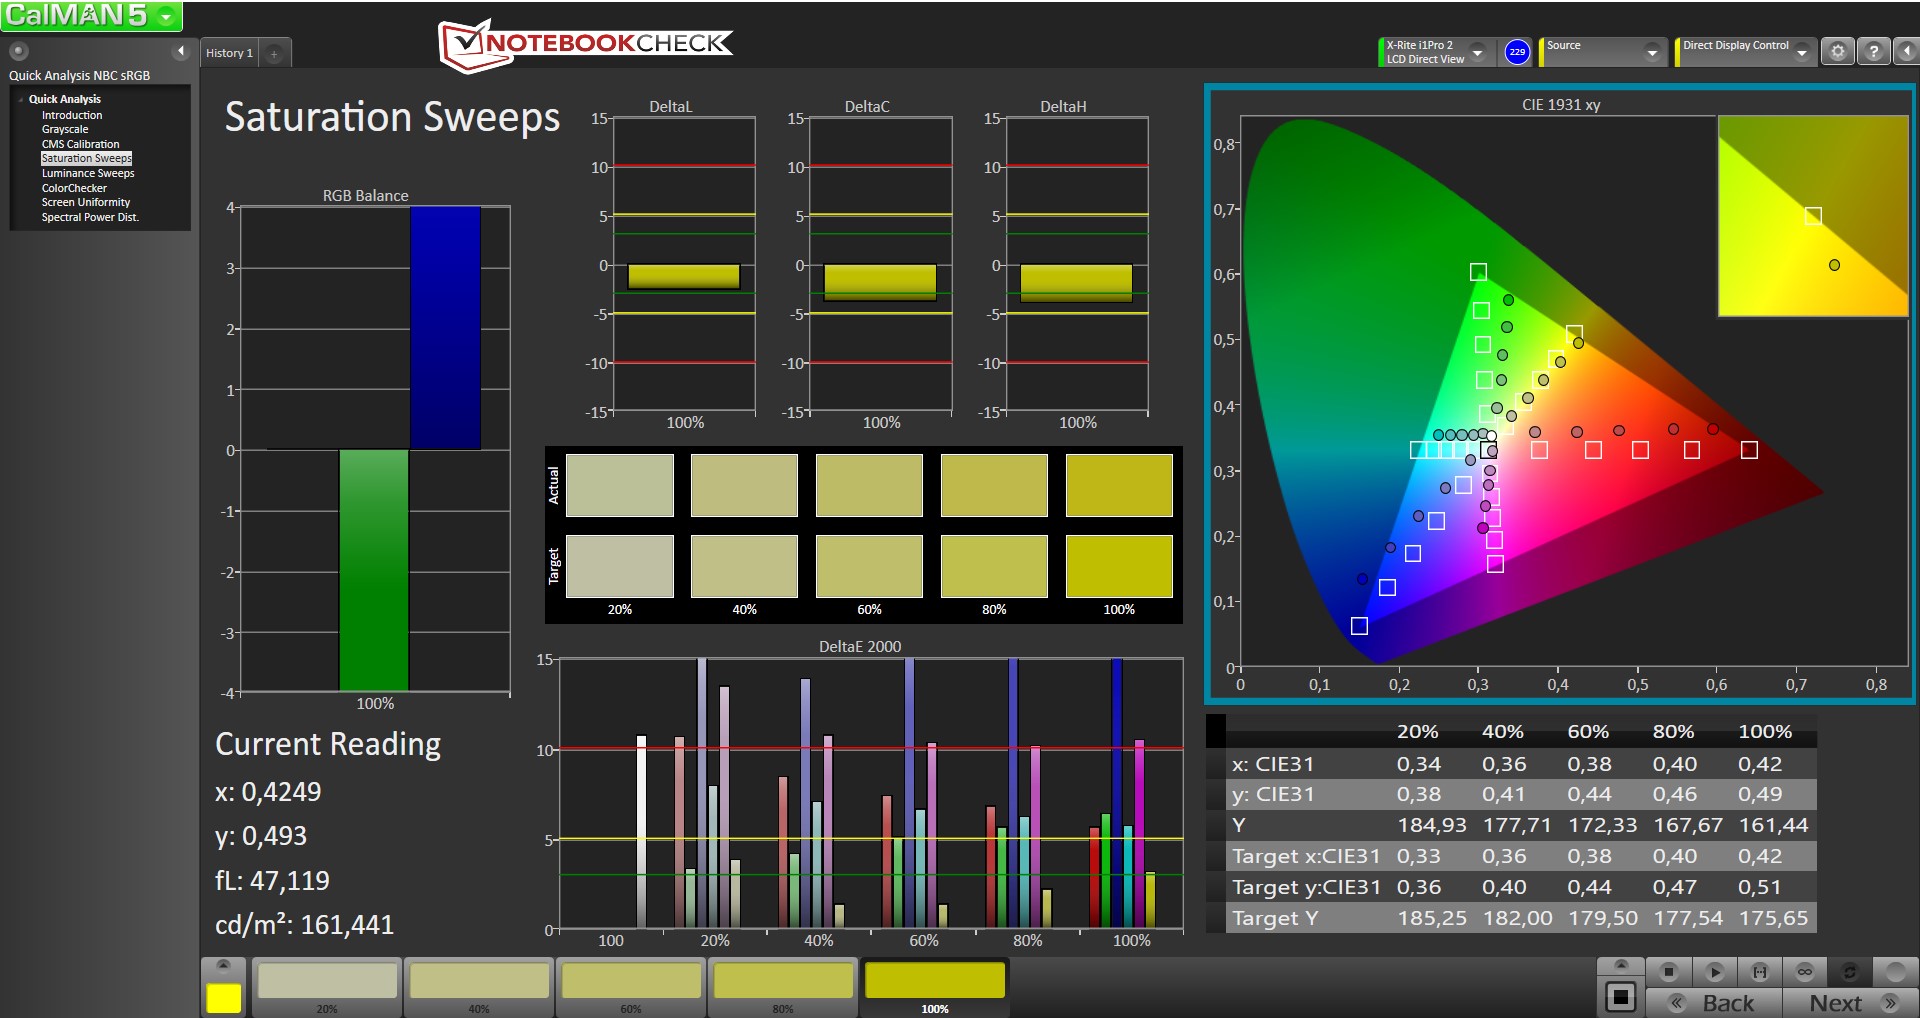
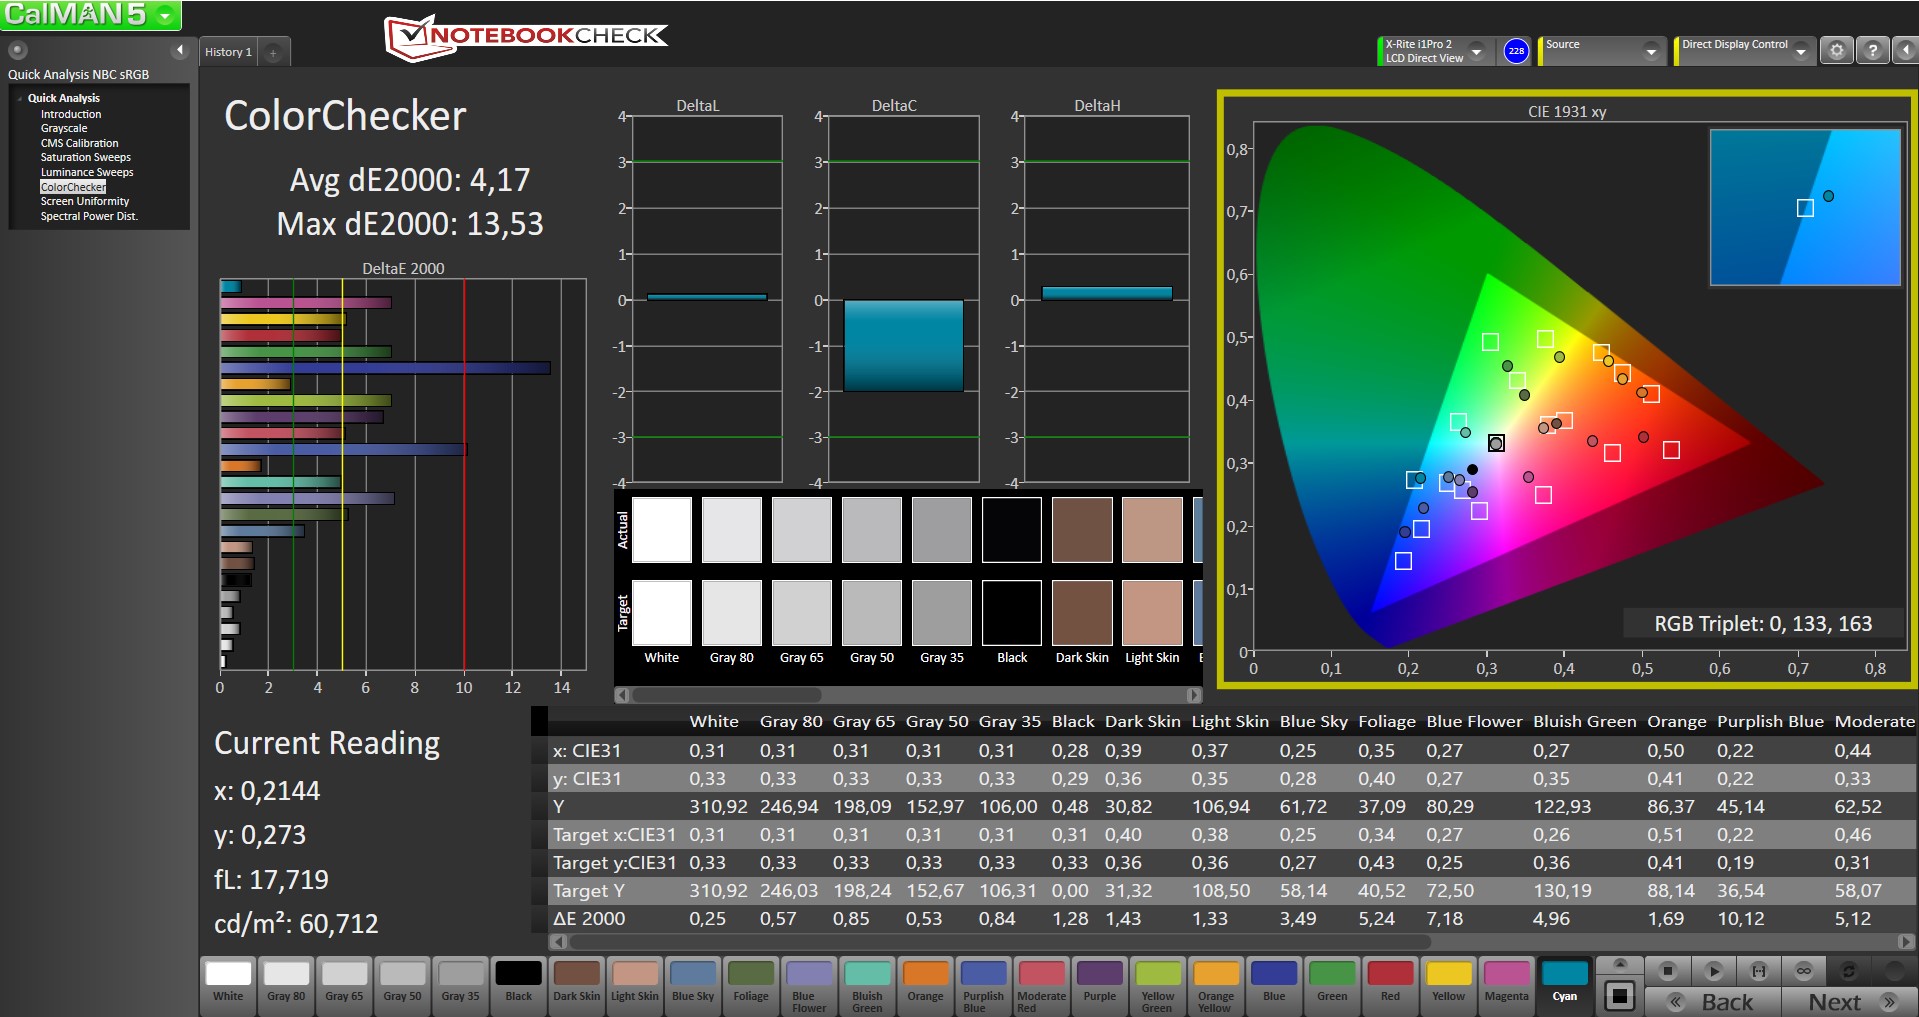
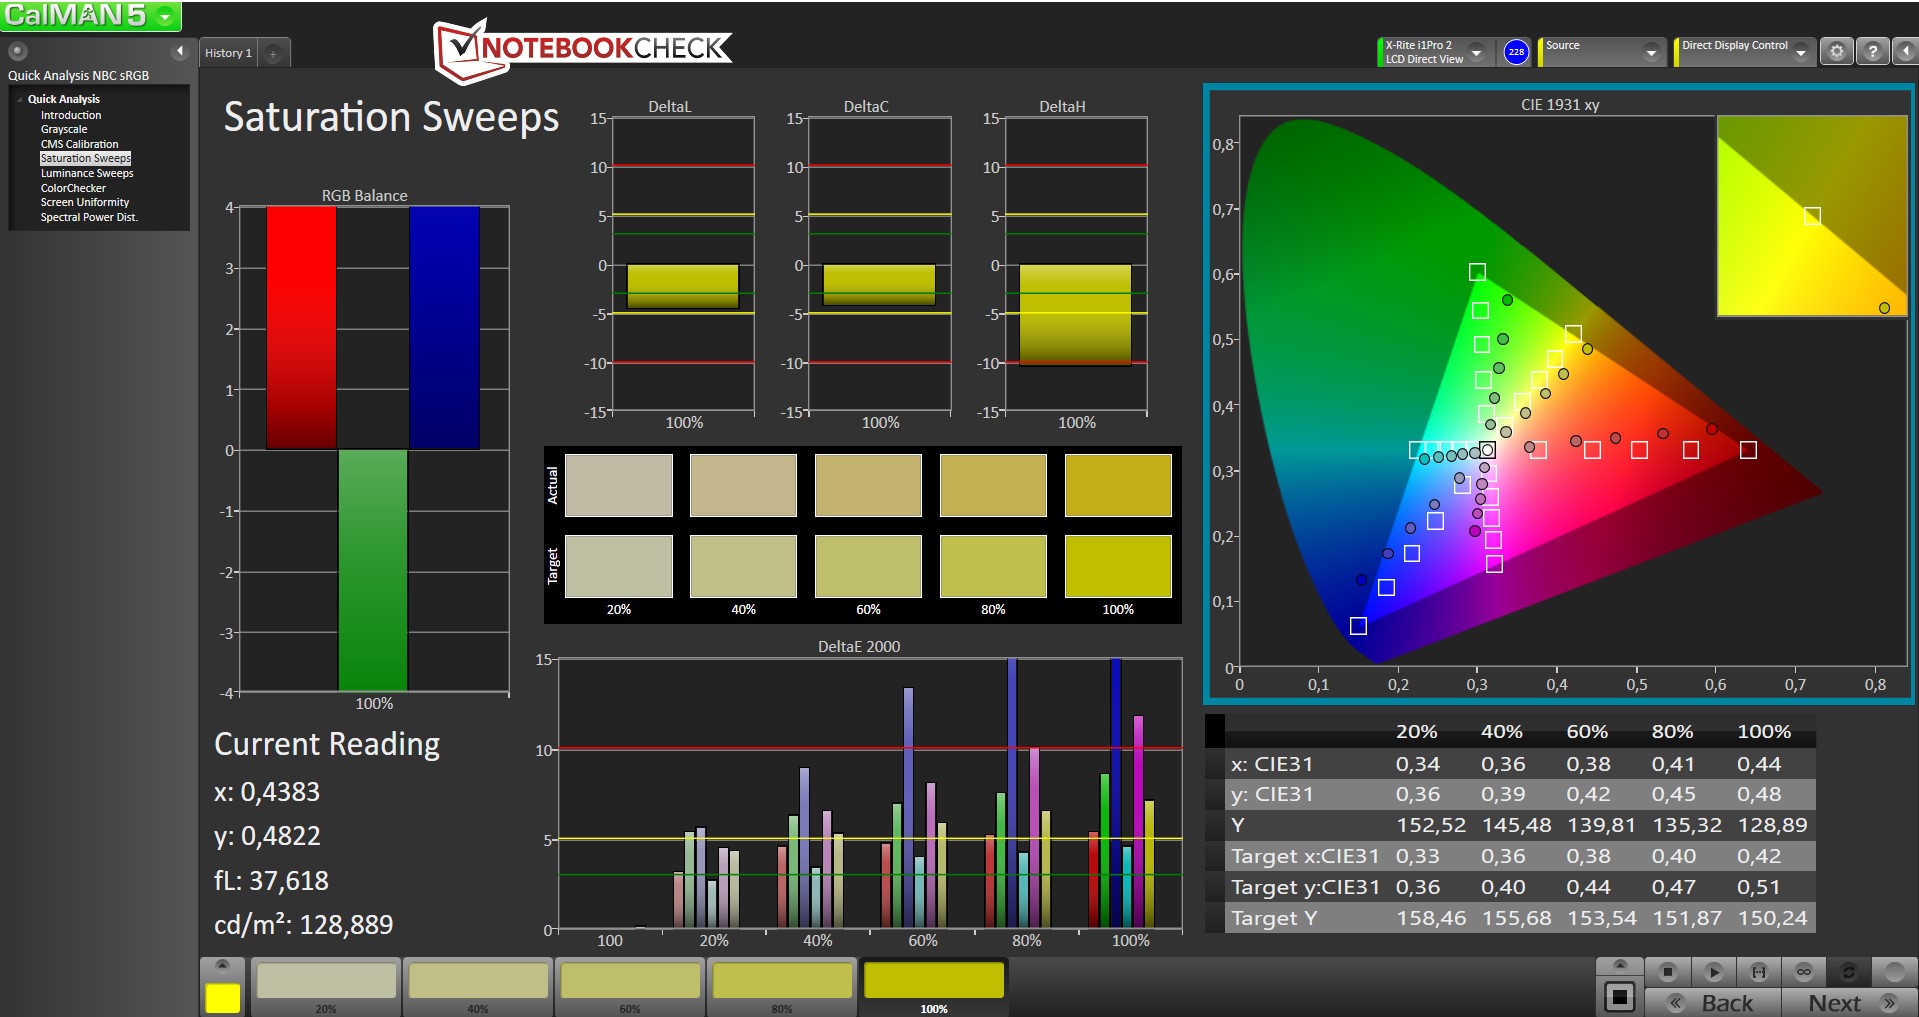
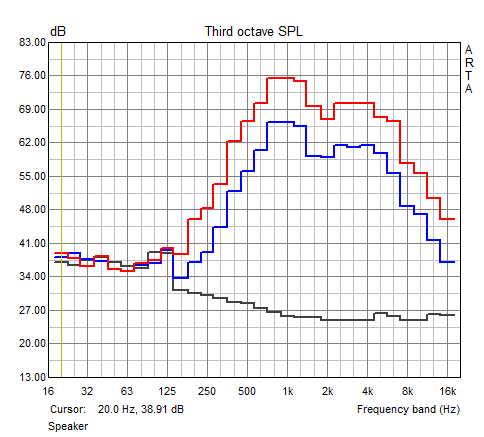
ΔE ColorChecker Calman: 7.79 | ∀{0.5-29.43 Ø4.71}
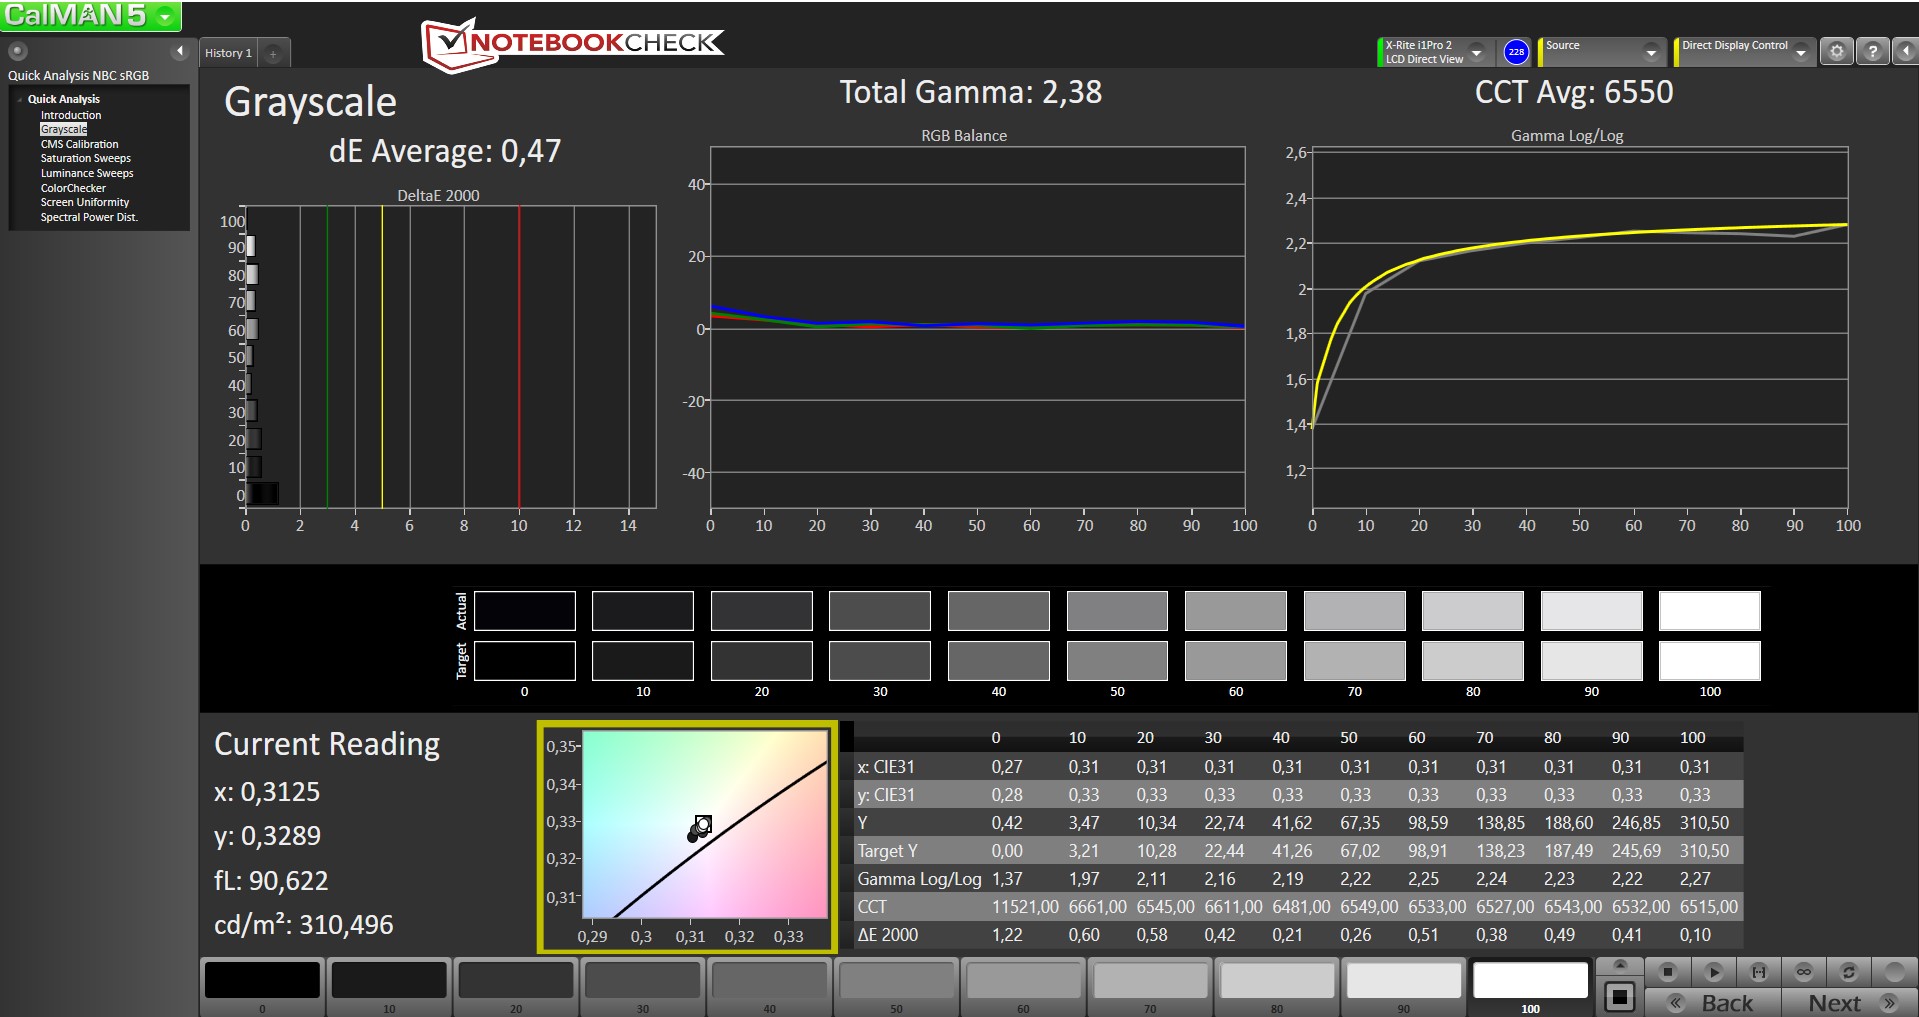
ΔE Greyscale Calman: 7.38 | ∀{0.09-98 Ø4.96}
58.87% sRGB (Argyll 1.6.3 3D)
37.72% AdobeRGB 1998 (Argyll 1.6.3 3D)
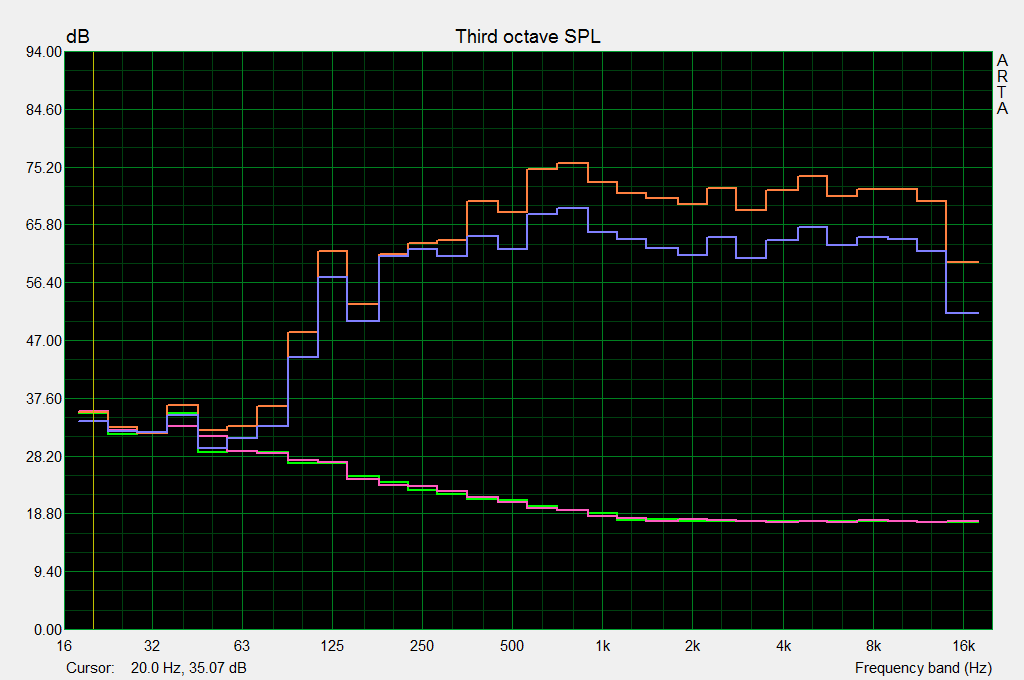
41.07% AdobeRGB 1998 (Argyll 3D)
59.2% sRGB (Argyll 3D)
39.7% Display P3 (Argyll 3D)
Gamma: 2.43
CCT: 6158 K
| Dell Latitude 12 E7270 IPS LED, 1920x1080 | Lenovo ThinkPad X260-20F6007RGE IPS, 1920x1080 | HP EliteBook 820 G3 TN LED, 1366x768 | Dell Latitude 13 7370 IPS, 1920x1080 | Dell XPS 13 9350 WQXGA IPS, 3200x1800 | |
|---|---|---|---|---|---|
| Display | 13% | -2% | 31% | 58% | |
| Display P3 Coverage (%) | 39.7 | 44.71 13% | 38.9 -2% | 52.2 31% | 63.6 60% |
| sRGB Coverage (%) | 59.2 | 66.1 12% | 58.5 -1% | 78.3 32% | 92.3 56% |
| AdobeRGB 1998 Coverage (%) | 41.07 | 46.23 13% | 40.2 -2% | 53.9 31% | 65.4 59% |
| Response Times | 11% | -26% | -24% | -18% | |
| Response Time Grey 50% / Grey 80% * (ms) | 38.4 ? | 32.8 ? 15% | 58 ? -51% | 50.4 ? -31% | 50.8 ? -32% |
| Response Time Black / White * (ms) | 28.8 ? | 27.2 ? 6% | 29.2 ? -1% | 33.6 ? -17% | 29.6 ? -3% |
| PWM Frequency (Hz) | |||||
| Screen | 14% | -19% | 19% | 37% | |
| Brightness middle (cd/m²) | 353 | 337 -5% | 244 -31% | 261 -26% | 307.5 -13% |
| Brightness (cd/m²) | 334 | 322 -4% | 240 -28% | 241 -28% | 297 -11% |
| Brightness Distribution (%) | 91 | 91 0% | 84 -8% | 85 -7% | 92 1% |
| Black Level * (cd/m²) | 0.47 | 0.32 32% | 0.6 -28% | 0.26 45% | 0.207 56% |
| Contrast (:1) | 751 | 1053 40% | 407 -46% | 1004 34% | 1486 98% |
| Colorchecker dE 2000 * | 7.79 | 5.71 27% | 9 -16% | 4.3 45% | 4.18 46% |
| Colorchecker dE 2000 max. * | 15.19 | 15.39 -1% | 15.73 -4% | 8.66 43% | 7.84 48% |
| Greyscale dE 2000 * | 7.38 | 5.15 30% | 9.48 -28% | 5.82 21% | 4.94 33% |
| Gamma | 2.43 91% | 2.38 92% | 2.44 90% | 2.44 90% | 2.31 95% |
| CCT | 6158 106% | 6881 94% | 11116 58% | 6771 96% | 7645 85% |
| Color Space (Percent of AdobeRGB 1998) (%) | 37.72 | 42.38 12% | 37.18 -1% | 49.18 30% | 59 56% |
| Color Space (Percent of sRGB) (%) | 58.87 | 65.62 11% | 58.63 0% | 77.84 32% | 92 56% |
| Média Total (Programa/Configurações) | 13% /
13% | -16% /
-16% | 9% /
16% | 26% /
34% |
* ... menor é melhor
Exibir tempos de resposta
| ↔ Tempo de resposta preto para branco | ||
|---|---|---|
| 28.8 ms ... ascensão ↗ e queda ↘ combinadas | ↗ 10.8 ms ascensão | 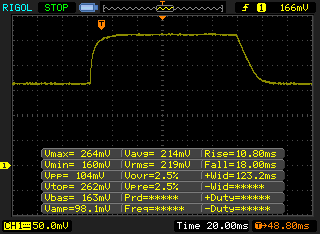 |
| ↘ 18 ms queda | ||
| A tela mostra taxas de resposta relativamente lentas em nossos testes e pode ser muito lenta para os jogadores. Em comparação, todos os dispositivos testados variam de 0.1 (mínimo) a 240 (máximo) ms. » 76 % de todos os dispositivos são melhores. Isso significa que o tempo de resposta medido é pior que a média de todos os dispositivos testados (19.8 ms). | ||
| ↔ Tempo de resposta 50% cinza a 80% cinza | ||
| 38.4 ms ... ascensão ↗ e queda ↘ combinadas | ↗ 17.2 ms ascensão | 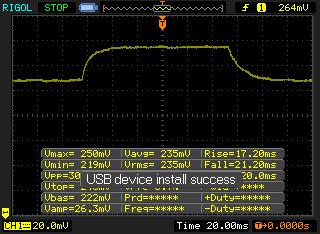 |
| ↘ 21.2 ms queda | ||
| A tela mostra taxas de resposta lentas em nossos testes e será insatisfatória para os jogadores. Em comparação, todos os dispositivos testados variam de 0.165 (mínimo) a 636 (máximo) ms. » 58 % de todos os dispositivos são melhores. Isso significa que o tempo de resposta medido é pior que a média de todos os dispositivos testados (31 ms). | ||
Cintilação da tela / PWM (modulação por largura de pulso)
| Tela tremeluzindo / PWM não detectado | ||
[pwm_comparison] Em comparação: 52 % de todos os dispositivos testados não usam PWM para escurecer a tela. Se PWM foi detectado, uma média de 7754 (mínimo: 5 - máximo: 343500) Hz foi medida. | ||
| PCMark 8 Home Score Accelerated v2 | 3420 pontos | |
| PCMark 8 Work Score Accelerated v2 | 4395 pontos | |
Ajuda | ||
| CrystalDiskMark 3.0 | |
| Write 4k | |
| Samsung SM951 MZVPV256HDGL m.2 PCI-e | |
| Liteon L8H-256V2G | |
| Liteonit LCH-512V2S | |
| Read 4k | |
| Samsung SM951 MZVPV256HDGL m.2 PCI-e | |
| Liteonit LCH-512V2S | |
| Liteon L8H-256V2G | |

| 3DMark - 1280x720 Cloud Gate Standard Score | |
| Dell XPS 13 9350 WQXGA | |
| Lenovo ThinkPad X260-20F6007RGE | |
| Dell Latitude 12 E7270 | |
| HP EliteBook 820 G3 | |
| Dell Latitude 12 E7250 | |
| Dell Latitude 13 7370 | |
| 3DMark 11 - 1280x720 Performance | |
| Dell XPS 13 9350 WQXGA | |
| Dell Latitude 12 E7270 | |
| HP EliteBook 820 G3 | |
| Lenovo ThinkPad X260-20F6007RGE | |
| Dell Latitude 13 7370 | |
| Dell Latitude 12 E7250 | |
| 3DMark 11 Performance | 1433 pontos | |
| 3DMark Ice Storm Standard Score | 47956 pontos | |
| 3DMark Cloud Gate Standard Score | 5250 pontos | |
| 3DMark Fire Strike Score | 698 pontos | |
Ajuda | ||
| baixo | média | alto | ultra | |
|---|---|---|---|---|
| BioShock Infinite (2013) | 38 | 25 | 19 | 5 |
| Battlefield 4 (2013) | 35 | 25 | 16 | 5 |
| Rise of the Tomb Raider (2016) | 14 | 9 | 5 |
Barulho
| Ocioso |
| 28.9 / 28.9 / 28.9 dB |
| Carga |
| 31.3 / 37.6 dB |
 | ||
30 dB silencioso 40 dB(A) audível 50 dB(A) ruidosamente alto |
||
min: | ||
(±) A temperatura máxima no lado superior é 44.3 °C / 112 F, em comparação com a média de 35.9 °C / 97 F , variando de 21.4 a 59 °C para a classe Subnotebook.
(-) A parte inferior aquece até um máximo de 52.6 °C / 127 F, em comparação com a média de 39.2 °C / 103 F
(+) Em uso inativo, a temperatura média para o lado superior é 30.2 °C / 86 F, em comparação com a média do dispositivo de 30.8 °C / ### class_avg_f### F.
(+) Os apoios para as mãos e o touchpad estão atingindo a temperatura máxima da pele (32.8 °C / 91 F) e, portanto, não estão quentes.
(-) A temperatura média da área do apoio para as mãos de dispositivos semelhantes foi 28.2 °C / 82.8 F (-4.6 °C / -8.2 F).
| desligado | |
| Ocioso | |
| Carga |
|
Key:
min: | |
| Dell Latitude 12 E7270 55 Wh | Lenovo ThinkPad X260-20F6007RGE 46 Wh | HP Elitebook 820 G2-J8R58EA 46 Wh | Dell Latitude 12 E7250 52 Wh | Dell XPS 13 9350 WQXGA 56 Wh | Dell Latitude 13 7370 34 Wh | |
|---|---|---|---|---|---|---|
| Power Consumption | -2% | -5% | -23% | -41% | 0% | |
| Idle Minimum * (Watt) | 3.8 | 3.5 8% | 3.1 18% | 4.1 -8% | 7.2 -89% | 5 -32% |
| Idle Average * (Watt) | 6.7 | 5.5 18% | 5.8 13% | 8.3 -24% | 9.3 -39% | 7.5 -12% |
| Idle Maximum * (Watt) | 7.2 | 6.7 7% | 6.5 10% | 9.4 -31% | 11.6 -61% | 8 -11% |
| Load Average * (Watt) | 27.2 | 28.9 -6% | 30.5 -12% | 31.6 -16% | 31.9 -17% | 15.3 44% |
| Load Maximum * (Watt) | 30.2 | 42.1 -39% | 46.3 -53% | 40.4 -34% | 29.9 1% | 26.8 11% |
* ... menor é melhor
| Battery Runtime - WiFi Websurfing | |
| Dell Latitude 12 E7270 | |
| Lenovo ThinkPad X260-20F6007RGE | |
| Dell Latitude 13 7370 | |
| HP Elitebook 820 G2-J8R58EA | |
| Dell XPS 13 9350 WQXGA | |
Pro
Contra
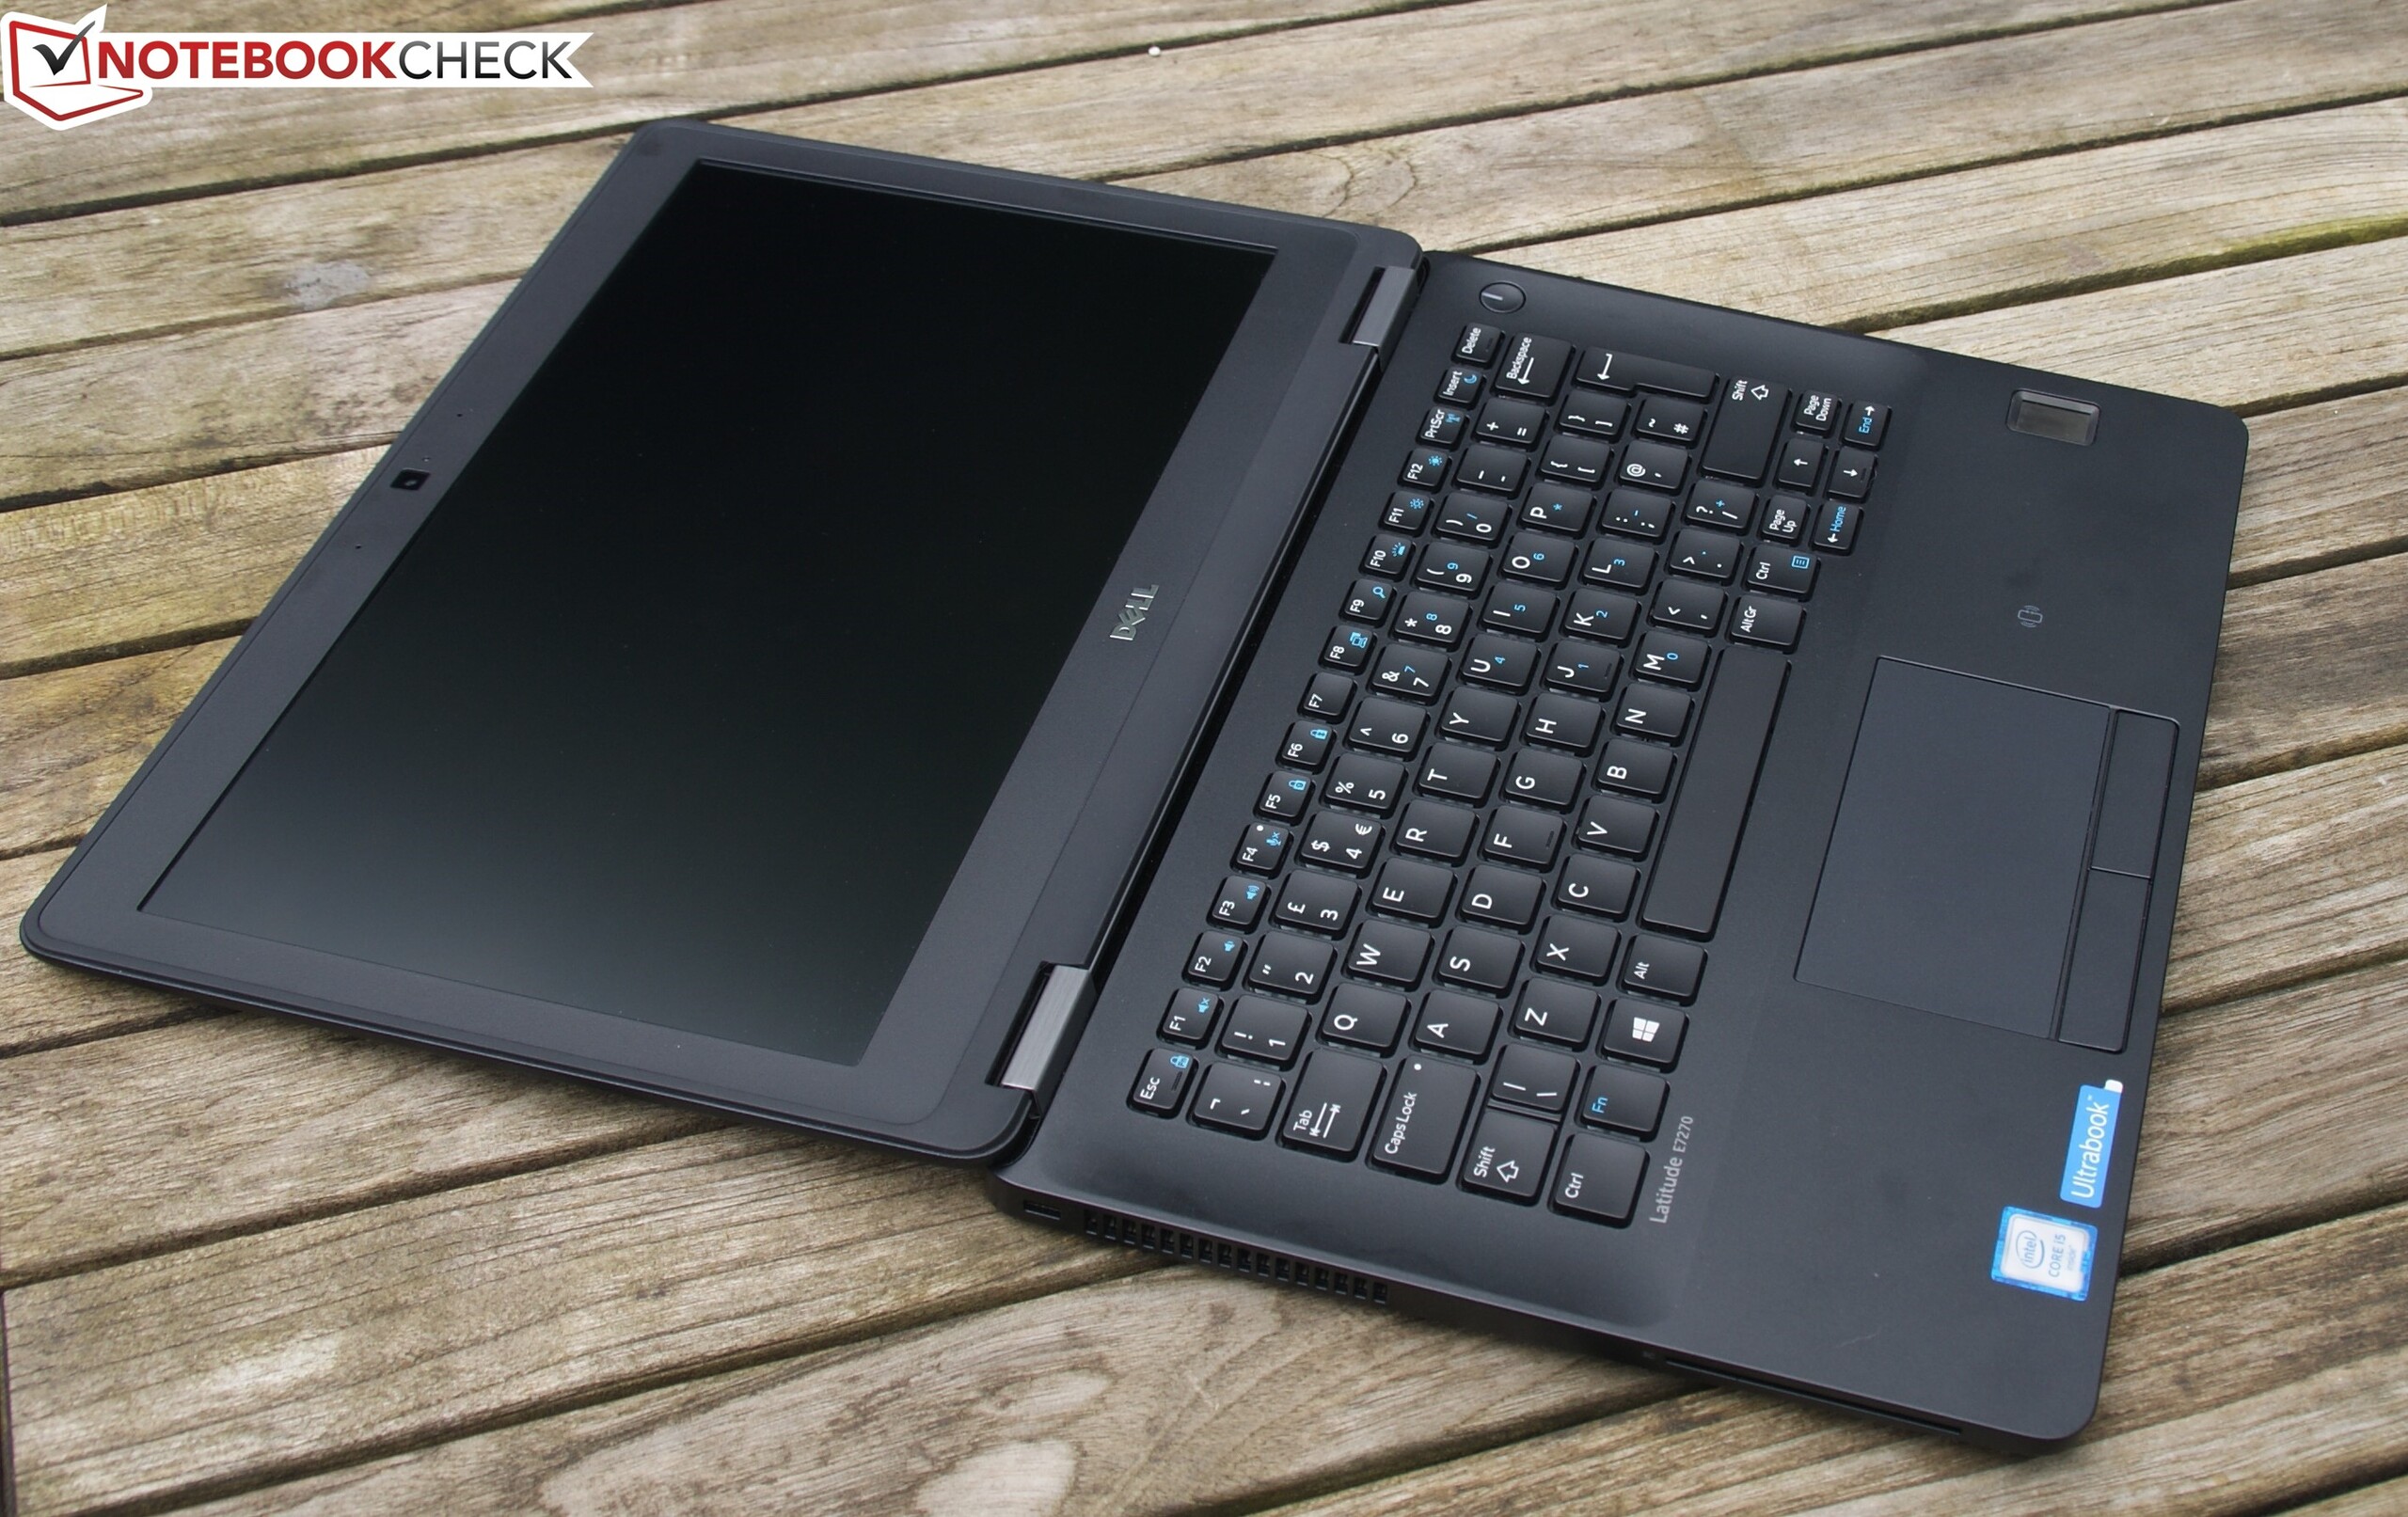
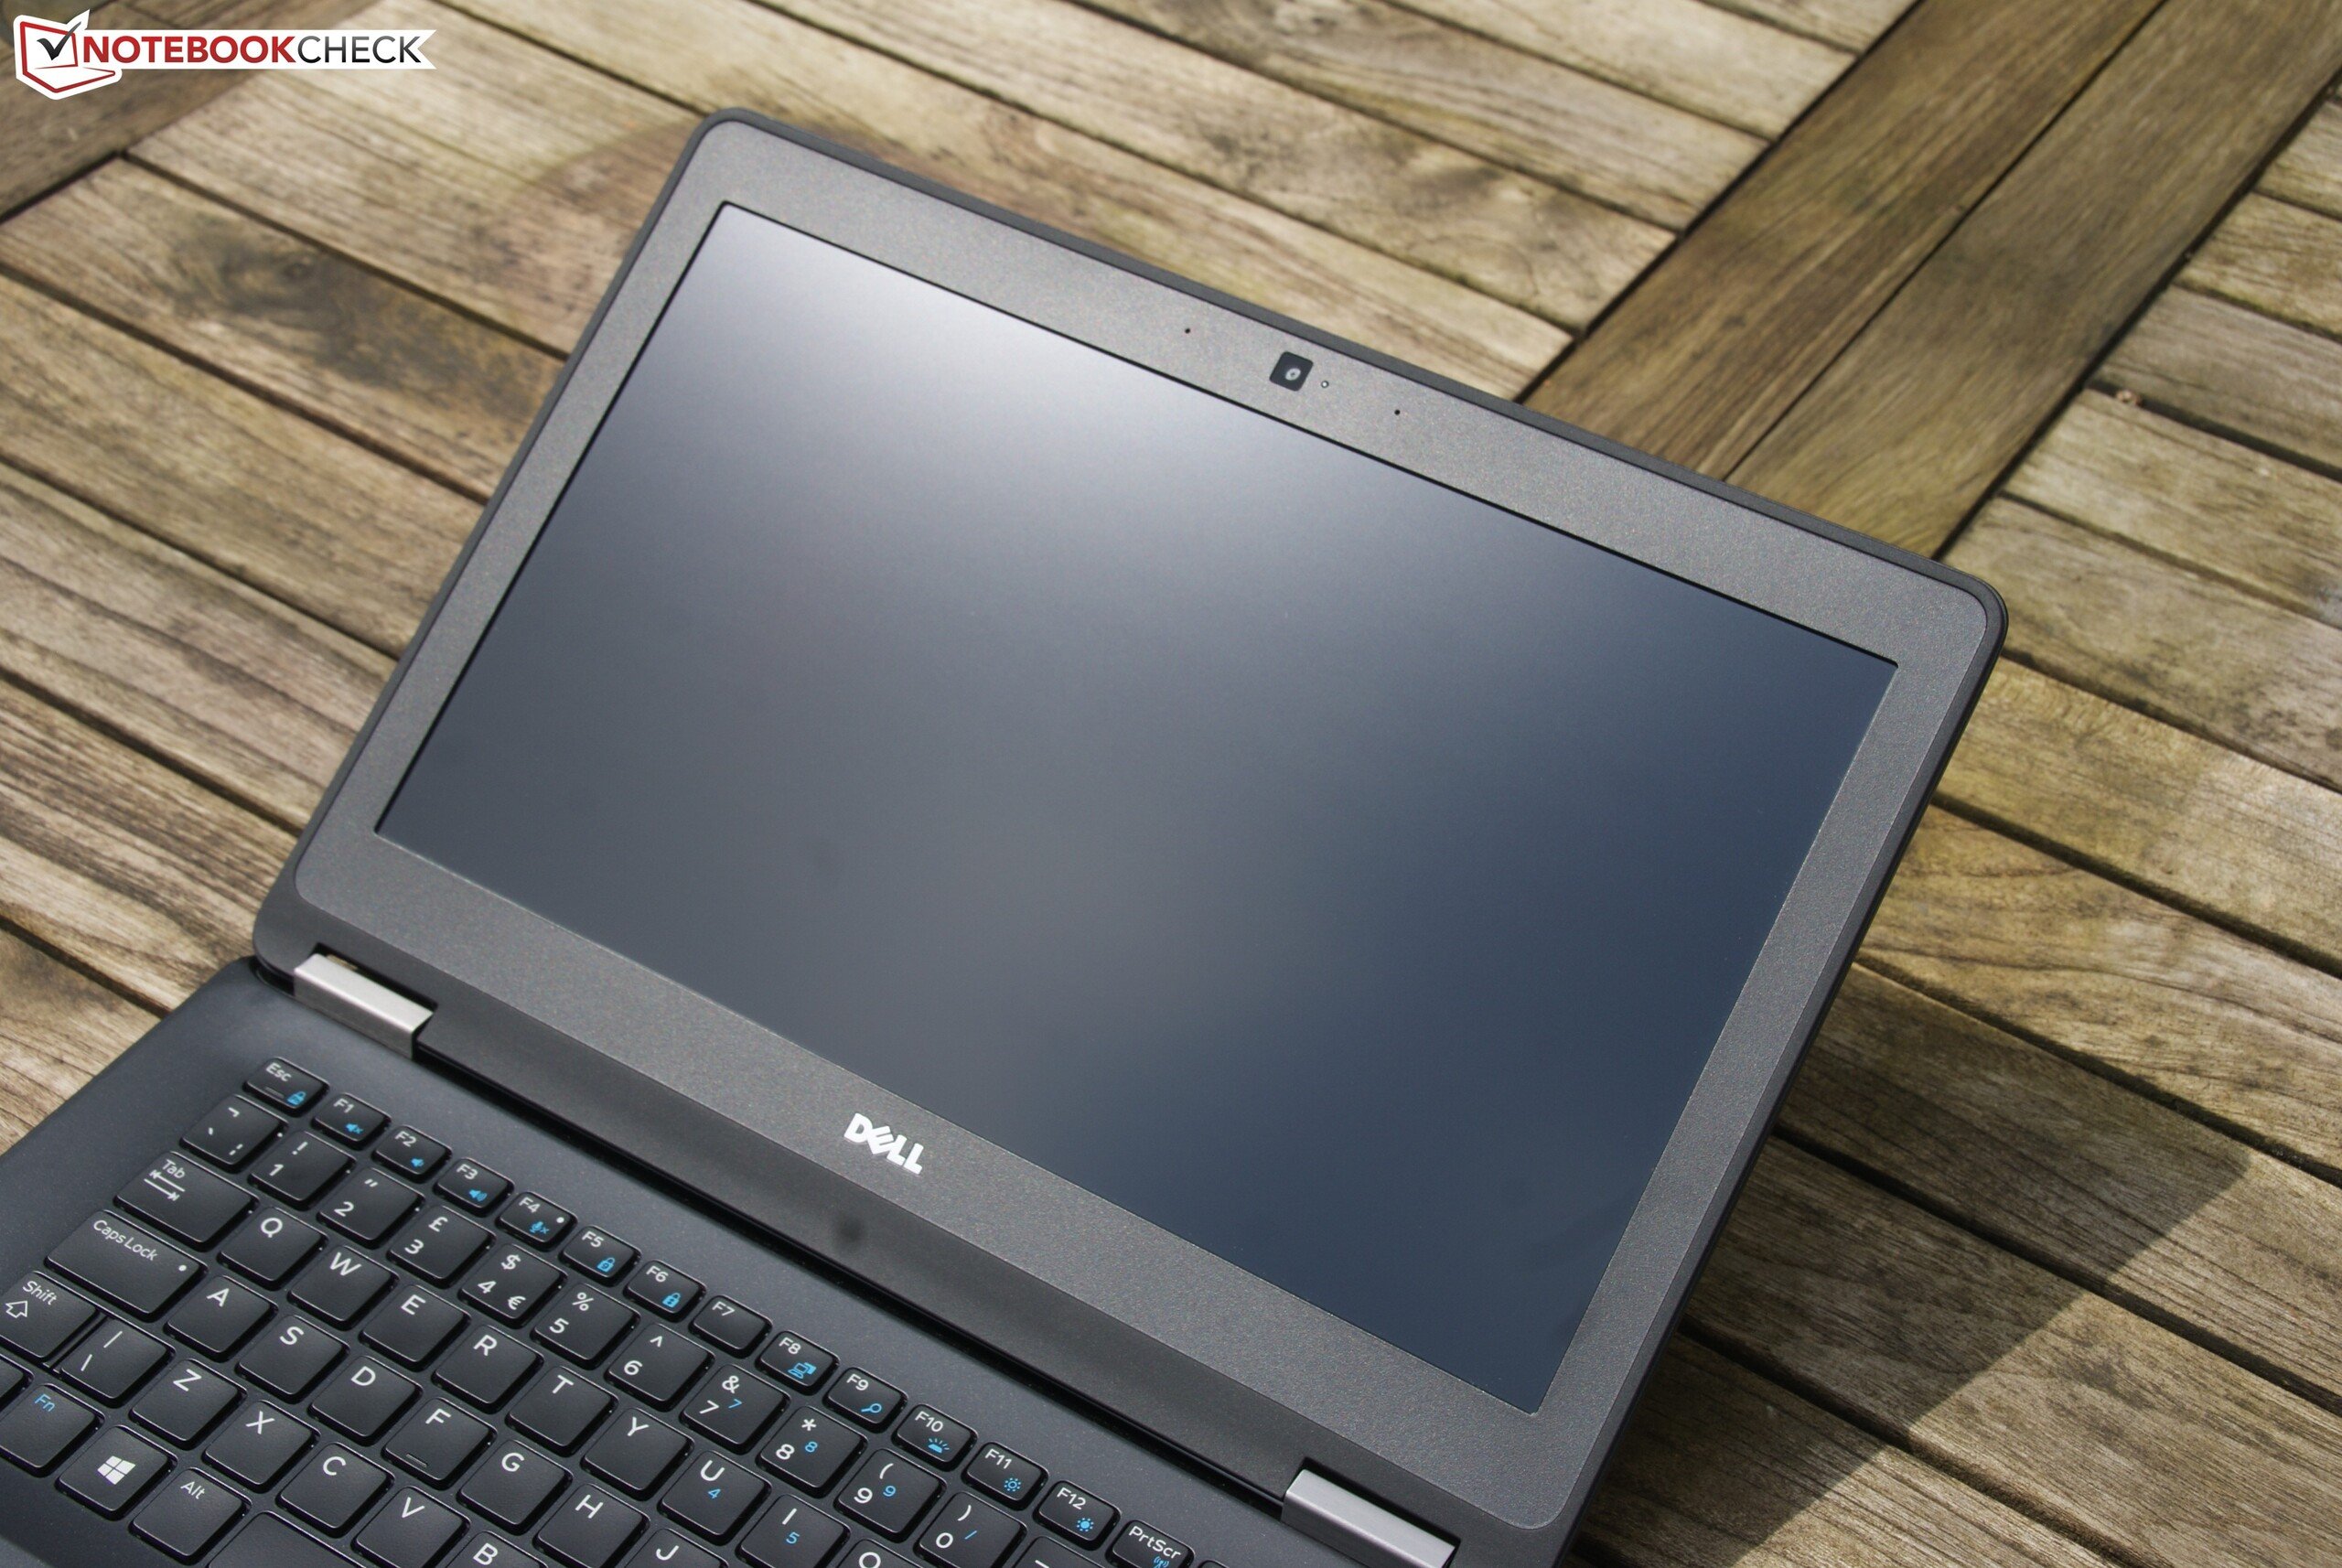
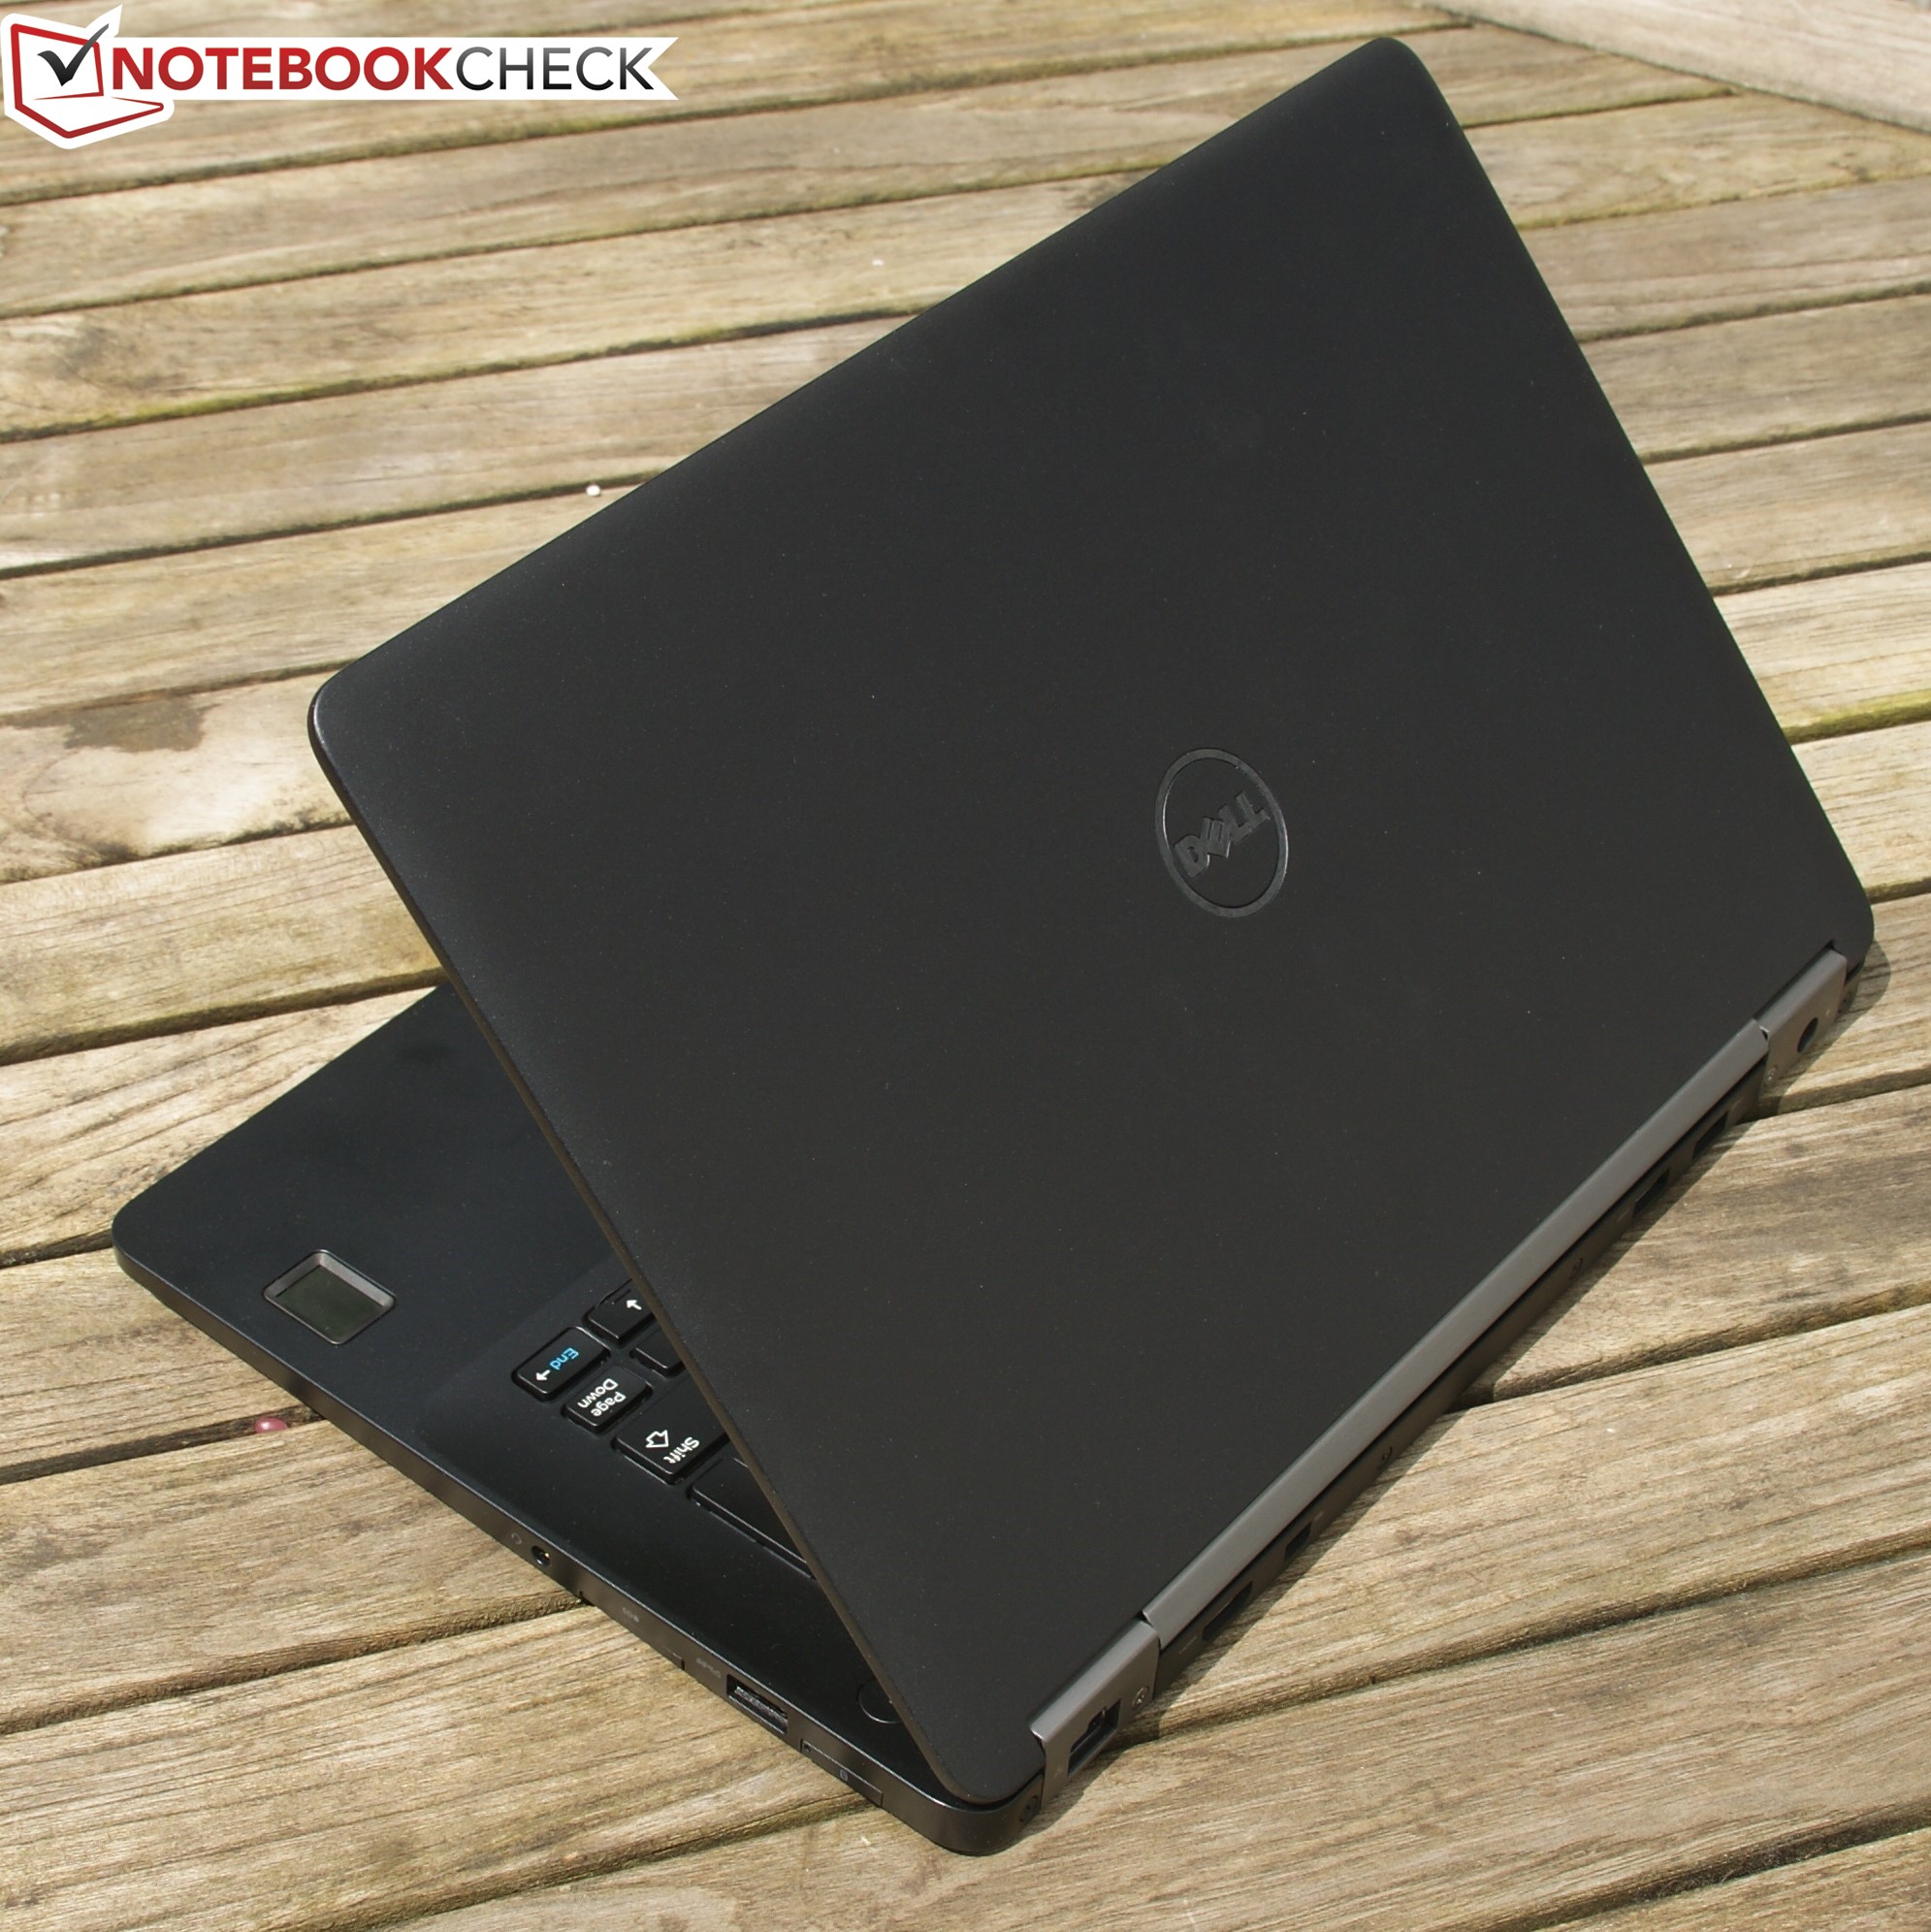
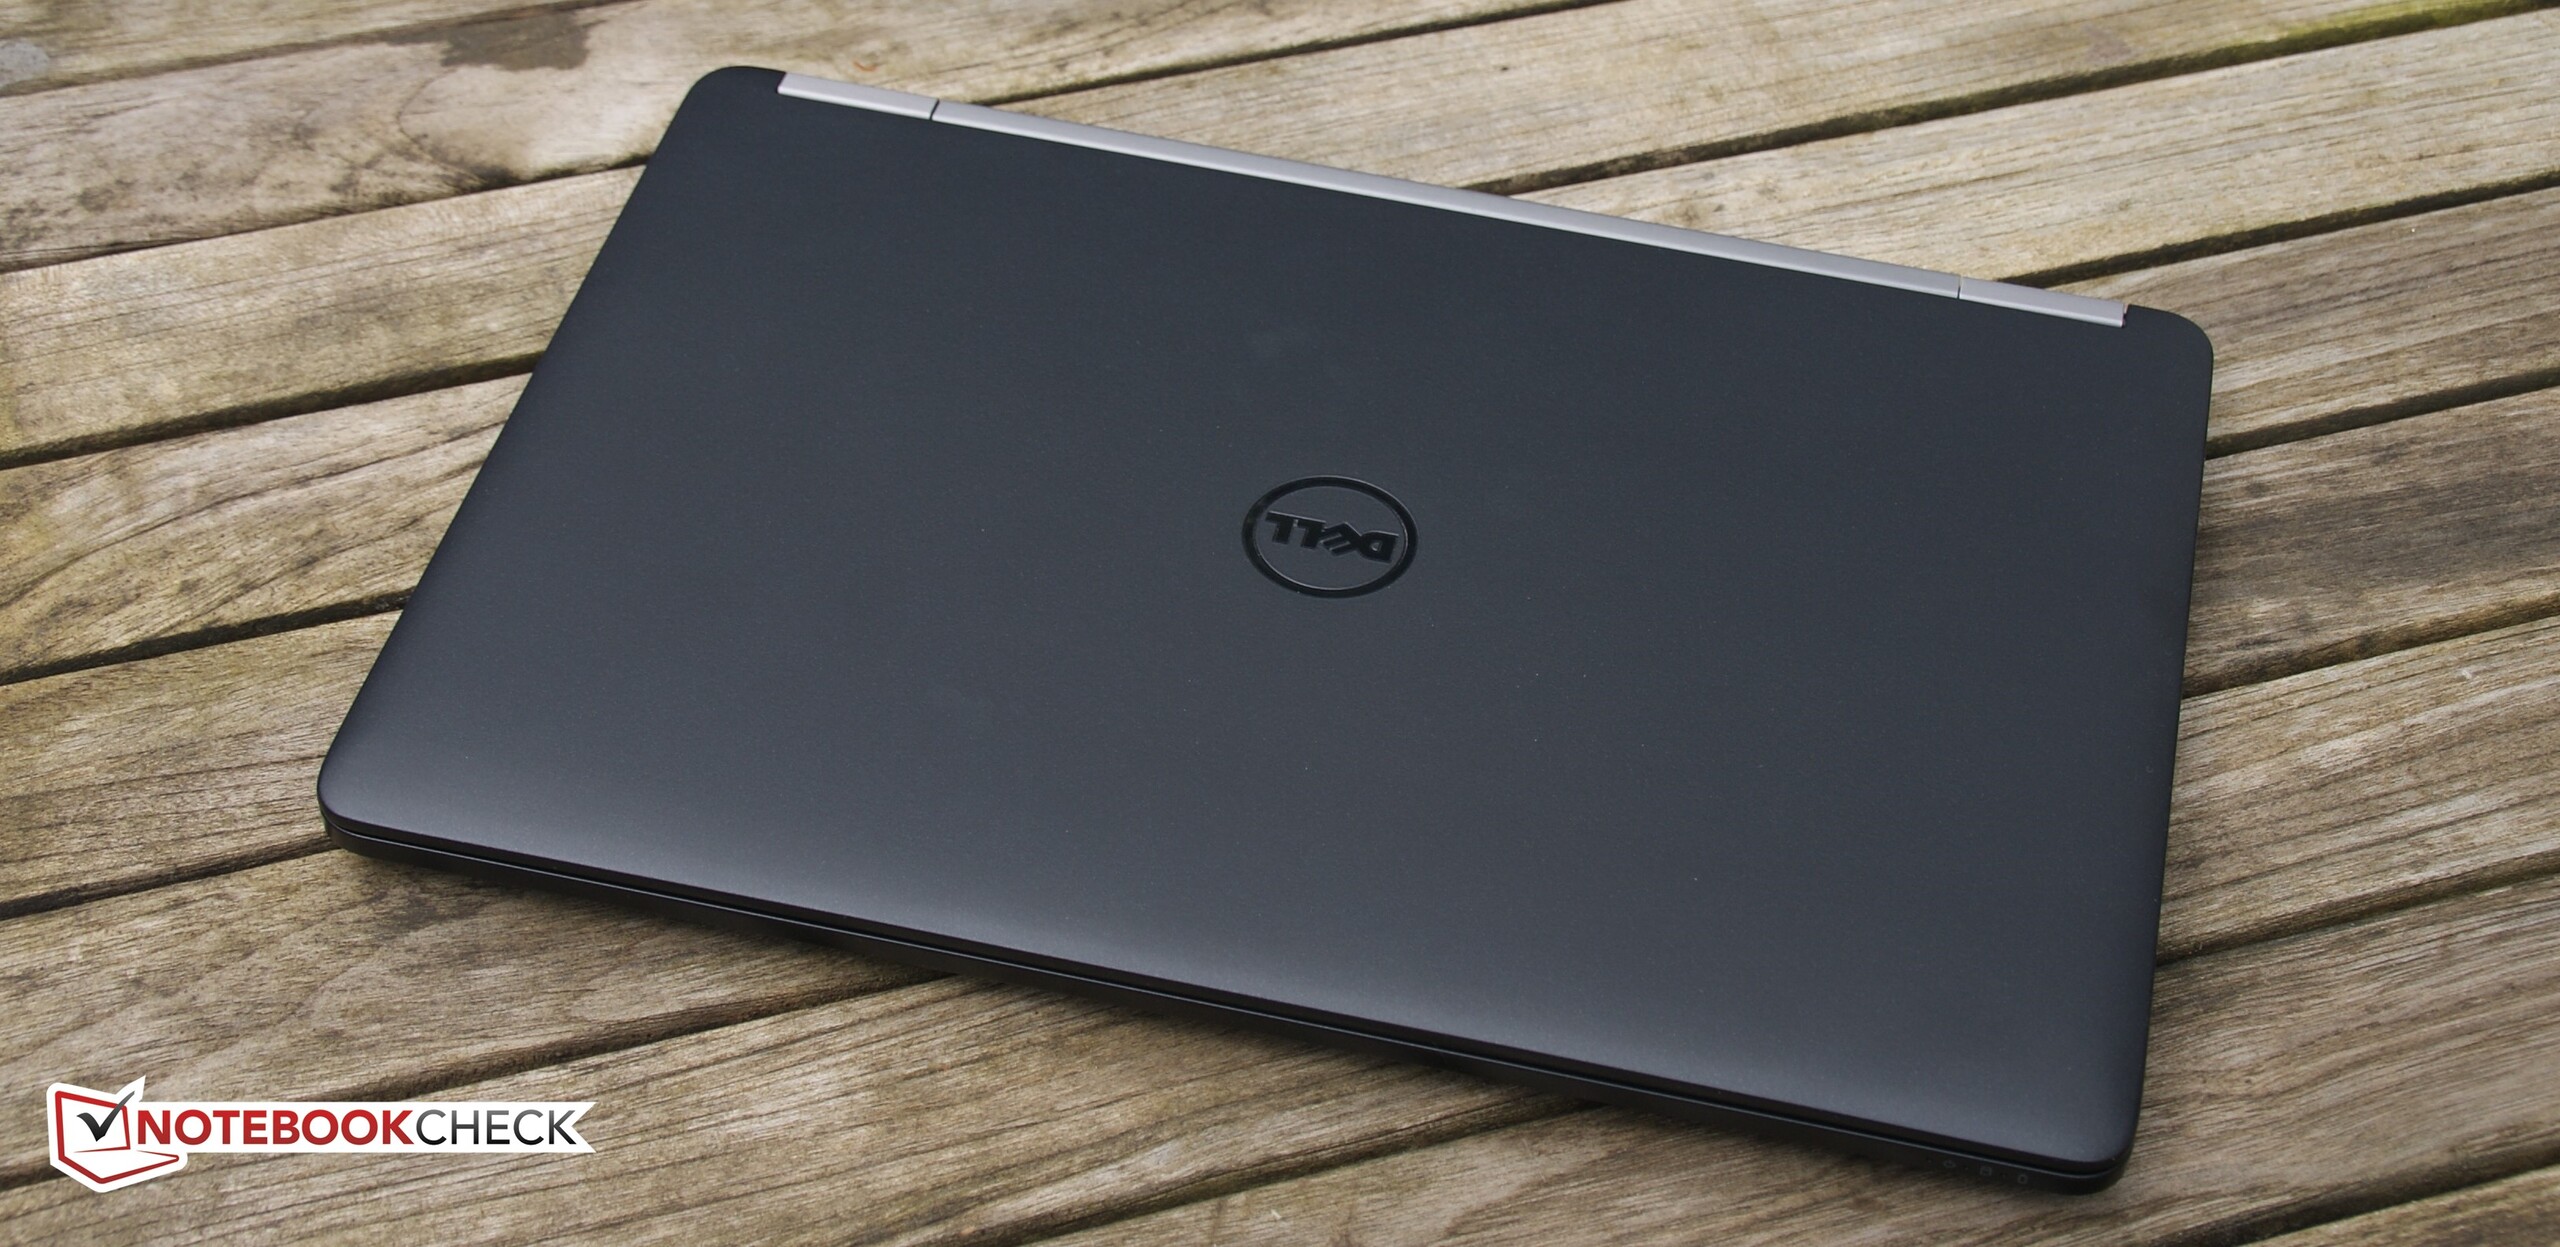
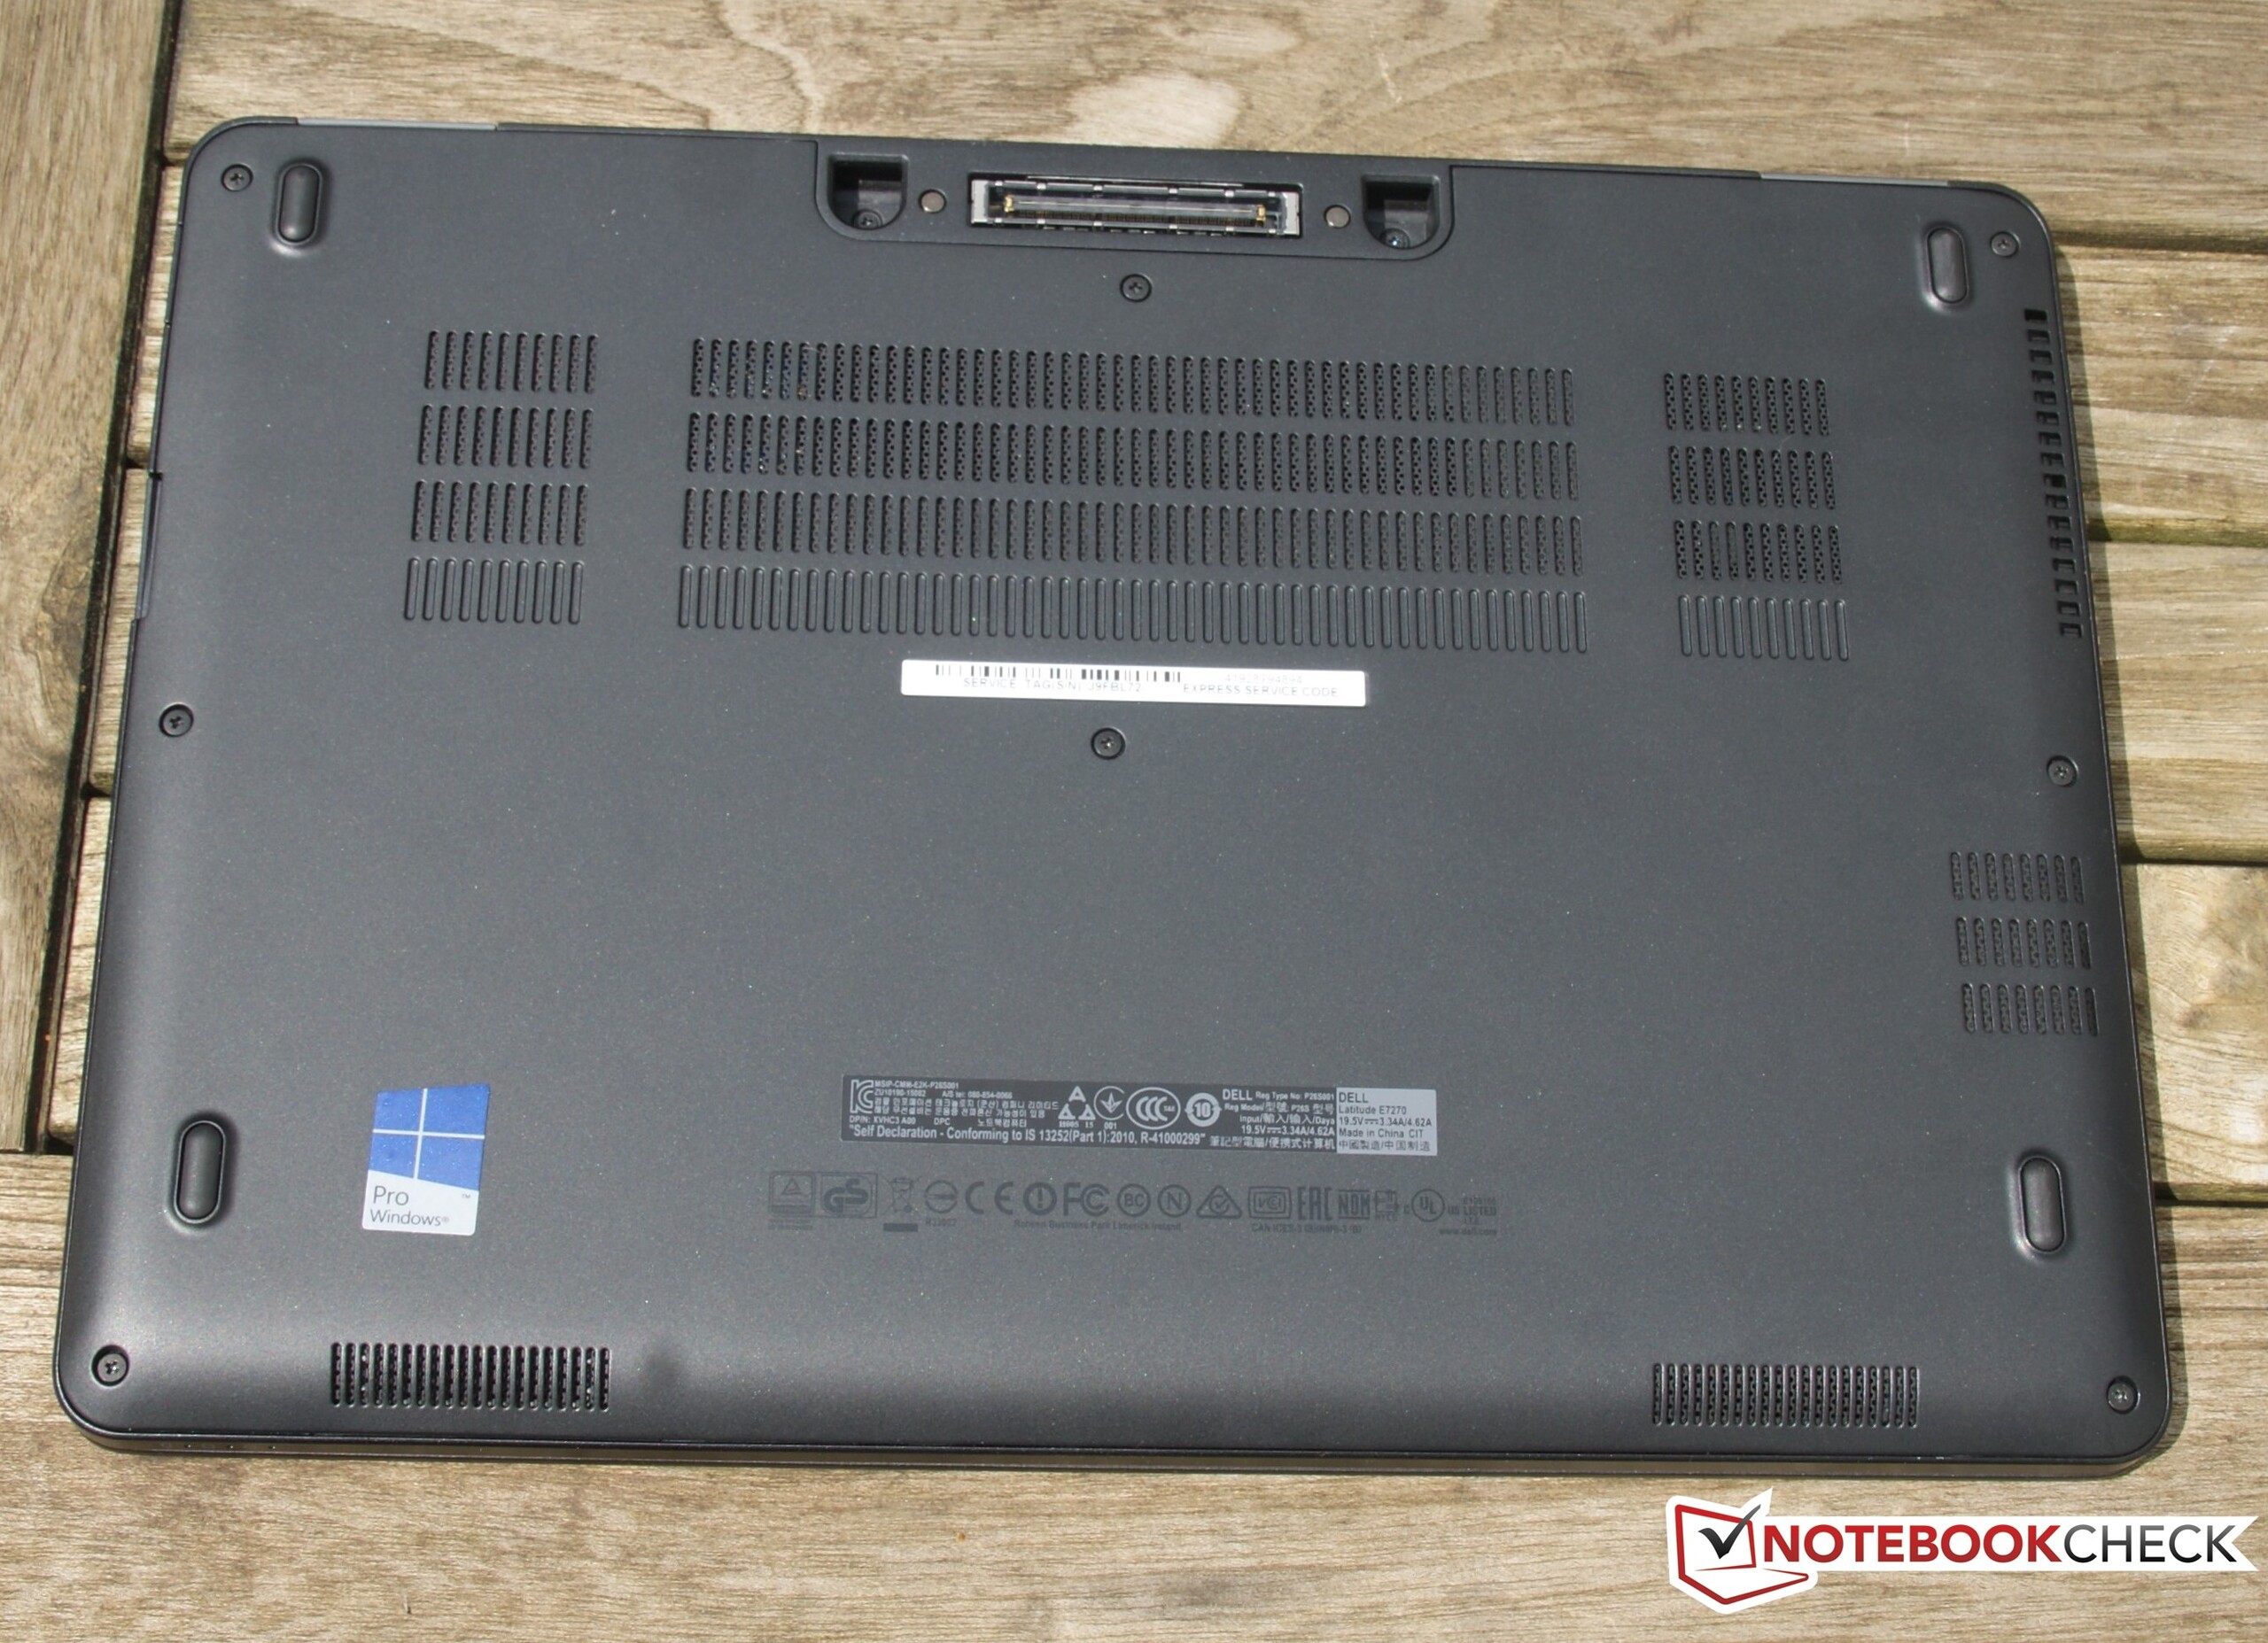
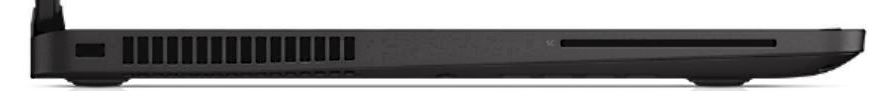
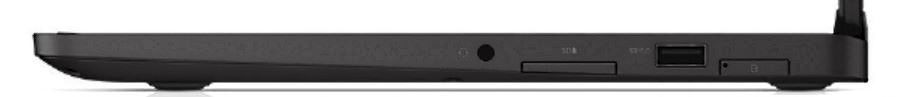
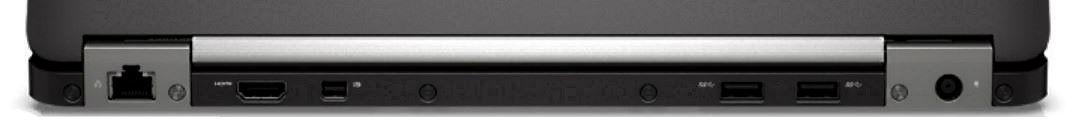
A atualização Skylake da série Latitude 7000 não decepciona. Com o E7270, a Dell lança um aparelho sólido e bem desenvolvido para o mercado, que particularmente emociona em termos de alta mobilidade. A tela apresenta um alto brilho de mais de 300 nits, que é mais do que a Dell especifica, a duração da bateria é excelente, e o aparelho é muito compacto, leve e fino. Graças à carcaça robusta, o usuário não deve se preocupar com o aparelho durante o seu transporte. Além disso, o E7270 é extremamente flexível com uma boa diversidade de portas que estão posicionadas idealmente graças à tradicional construção top-base. O E7270 deveria, portanto, cumprir muito bem o seu trabalho como um aparelho para escritório móvel. Os recursos tipicamente empresariais (segurança, porta docking) estão todos presentes.
Uma recomendação de compra pode ser outorgada para o grupo alvo (usuários empresariais móveis). No entanto, isso também se aplica para o rival HP 820 G3 e Lenovo ThinkPad X260. Aqui, são os detalhes os que fazem a diferença. O Latitude não possui um TrackPoint, a qual é uma decisão bastante incomum no setor empresarial, e é uma desvantagem sobre os oponentes. Embora tenha uma vantagem com sua duração de bateria estando equipado com a grande bateria de 55 Wh, o rival da Lenovo é mais forte com a sua flexível tecnologia Power Bridge. Outra fraqueza do E7270 é a reprodução das cores da tela. No entanto, o aparelho da Lenovo é apenas um pouco melhor (o modelo da HP foi testado apenas com uma tela HD, o qual seria uma comparação injusta).
A Dell oferece um aparelho de escritório sólido como rocha que é muito competitivo. No entanto, o Latitude terá dificuldades contra o XPS 13 da própria Dell quando os recursos empresariais especiais não sejam necessários.
As coisas se complicam quando se olha além do setor empresarial. O próprio XPS 13 da Dell oferece, por menos dinheiro, uma tela melhor e maior, um design mais moderno com marcos finos, e também está mais preparado para o futuro graças ao Thunderbolt. Por outro lado, sua expansibilidade não é tão boa, e o aparelho naturalmente não possui alguns recursos especificamente empresariais, encontrados na concorrência dos subportáteis.
Esta é uma versão reduzida da análise original. Você pode ler a análise completa em inglês aqui.
Dell Latitude 12 E7270
- 06/30/2016 v5.1 (old)
Benjamin Herzig