Breve Análise do Portátil Fujitsu LifeBook E746 (i5-6200U, HD520)
| SD Card Reader - average JPG Copy Test (av. of 3 runs) | |
| Toshiba Tecra X40-D | |
| Lenovo ThinkPad L470-20J5S00C00 (Toshiba Exceria Pro SDXC 64 GB UHS-II) | |
| Fujitsu Lifebook E746 (Toshiba Exceria Pro SDXC 64 GB UHS-II) | |
| HP 14-bs007ng (Toshiba Exceria Pro SDXC 64 GB UHS-II) | |
| Acer TravelMate P449-G2-M-56CD (Toshiba Exceria Pro SDXC 64 GB UHS-II) | |
| Networking | |
| iperf3 transmit AX12 | |
| Acer TravelMate P449-G2-M-56CD | |
| Fujitsu Lifebook E746 | |
| Toshiba Tecra X40-D | |
| Lenovo ThinkPad L470-20J5S00C00 | |
| HP 14-bs007ng | |
| iperf3 receive AX12 | |
| Lenovo ThinkPad L470-20J5S00C00 | |
| Toshiba Tecra X40-D | |
| Acer TravelMate P449-G2-M-56CD | |
| Fujitsu Lifebook E746 | |
| HP 14-bs007ng | |
| |||||||||||||||||||||||||
iluminação: 86 %
iluminação com acumulador: 320 cd/m²
Contraste: 1032:1 (Preto: 0.31 cd/m²)
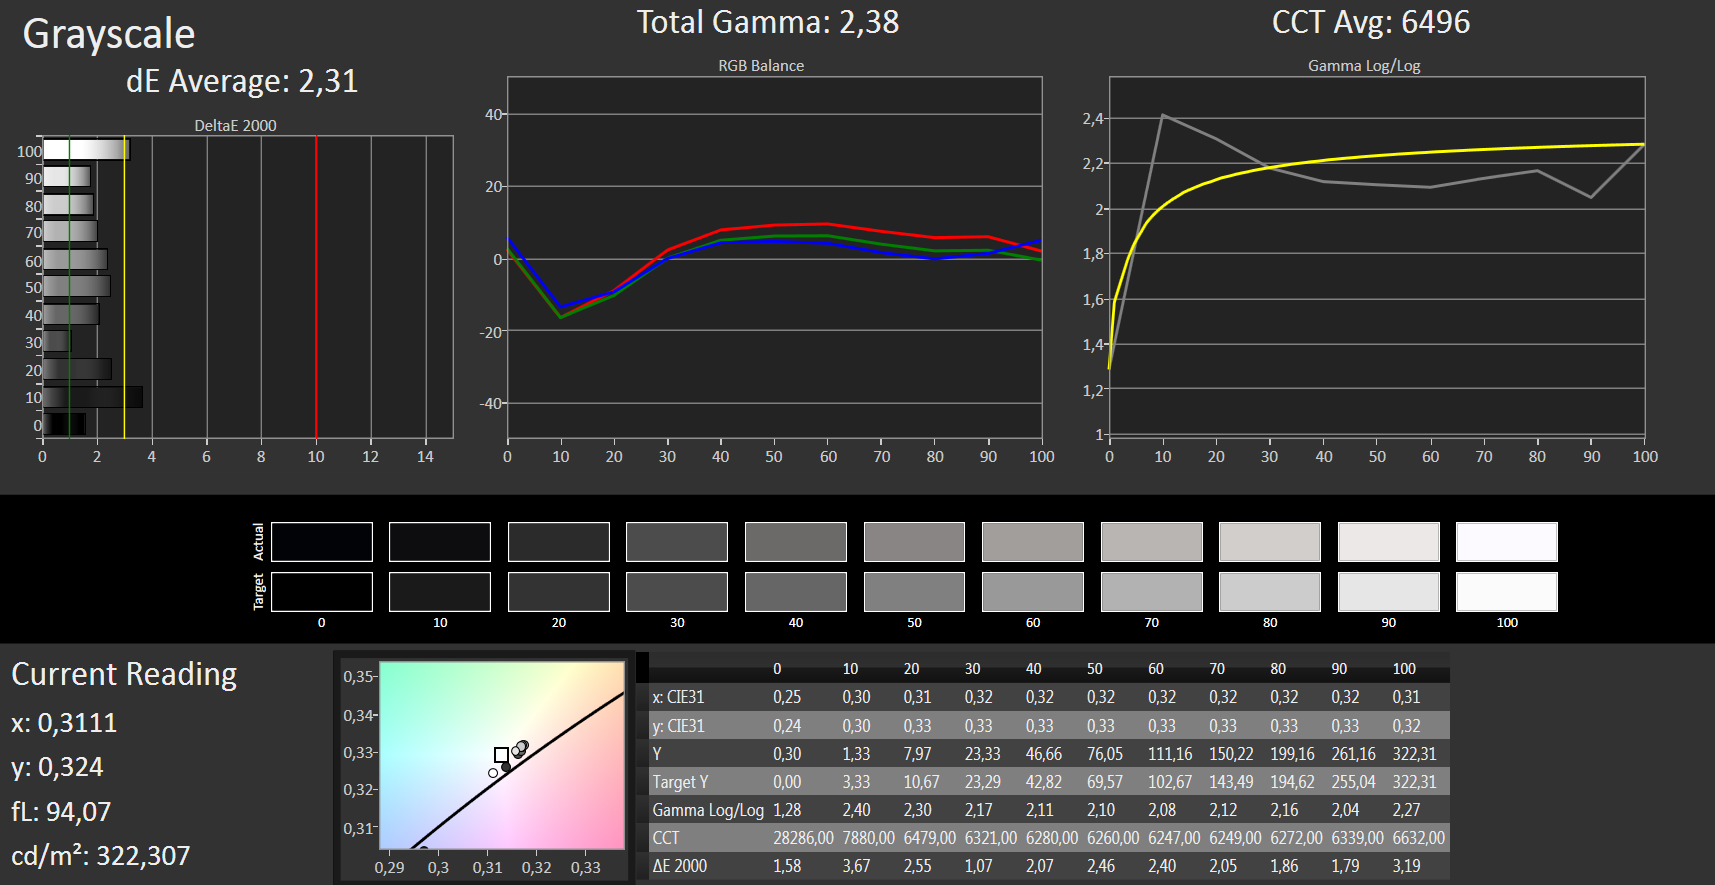
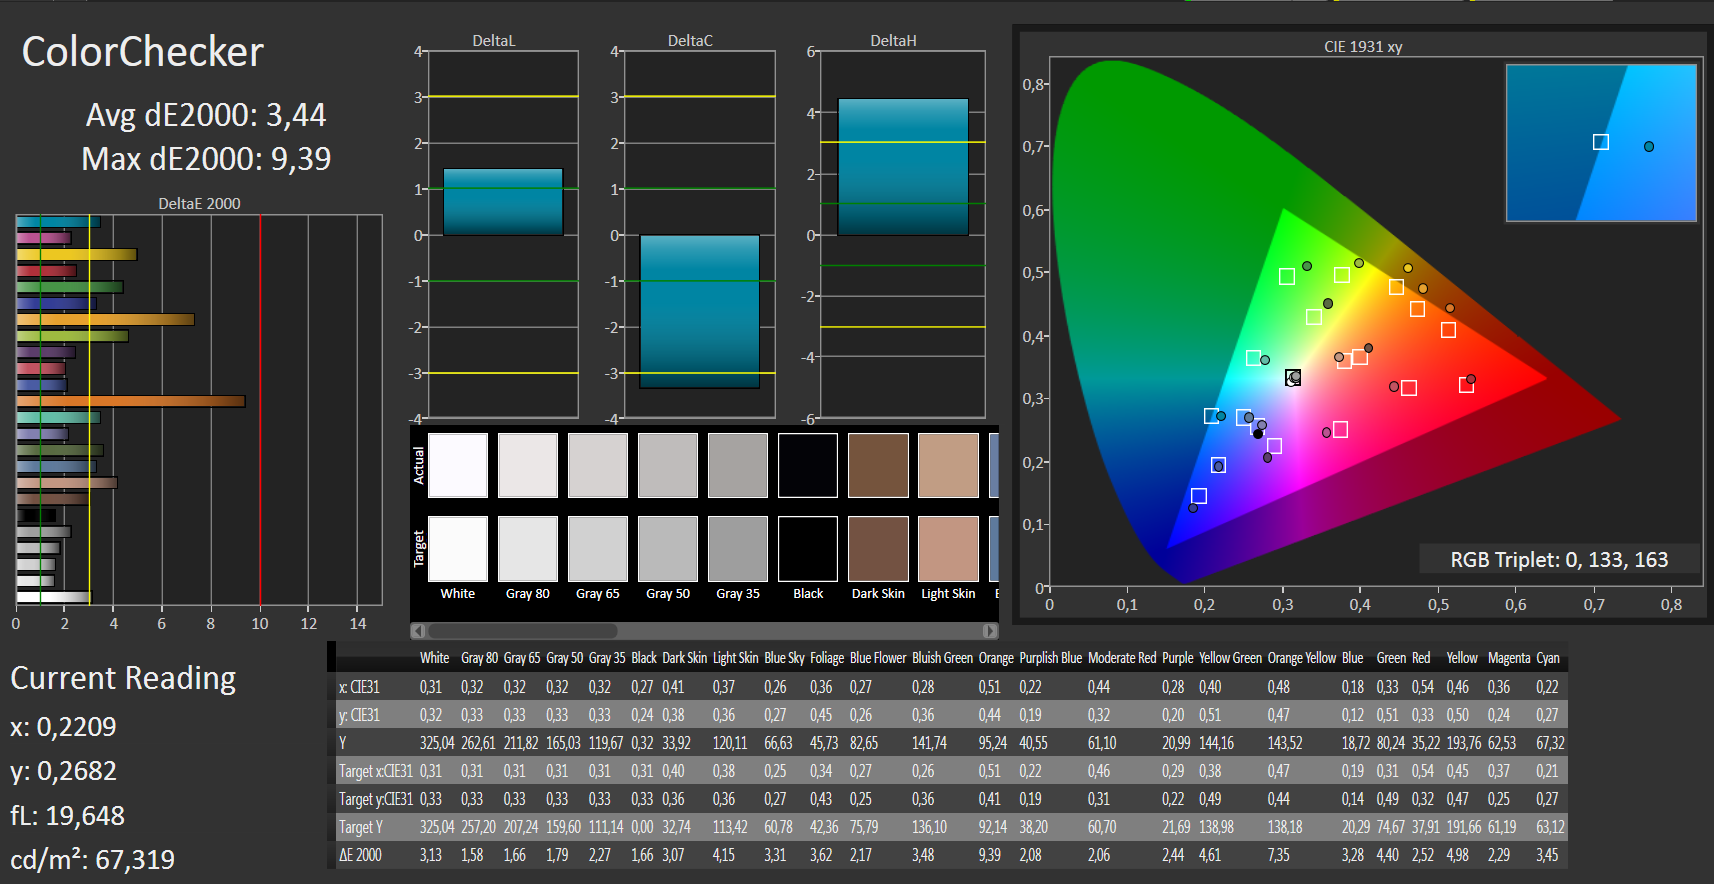
ΔE ColorChecker Calman: 3.44 | ∀{0.5-29.43 Ø4.72}
ΔE Greyscale Calman: 2.31 | ∀{0.09-98 Ø4.97}
84% sRGB (Argyll 1.6.3 3D)
55% AdobeRGB 1998 (Argyll 1.6.3 3D)
61.3% AdobeRGB 1998 (Argyll 3D)
83.9% sRGB (Argyll 3D)
64.1% Display P3 (Argyll 3D)
Gamma: 2.38
CCT: 6496 K
| Fujitsu Lifebook E746 LG Philips LGD046D, , 1920x1080, 14" | Acer TravelMate P449-G2-M-56CD N140HCA-EAB, , 1920x1080, 14" | Toshiba Tecra X40-D Toshiba TOS508F, , 1920x1080, 14" | Lenovo ThinkPad L470-20J5S00C00 N140HCA-EAB, , 1920x1080, 14" | HP 14-bs007ng AU Optronics, , 1920x1080, 14" | |
|---|---|---|---|---|---|
| Display | -31% | -32% | -29% | -39% | |
| Display P3 Coverage (%) | 64.1 | 41.04 -36% | 40.55 -37% | 42.21 -34% | 36.53 -43% |
| sRGB Coverage (%) | 83.9 | 61.2 -27% | 61 -27% | 62.7 -25% | 54.9 -35% |
| AdobeRGB 1998 Coverage (%) | 61.3 | 42.47 -31% | 41.89 -32% | 43.71 -29% | 37.74 -38% |
| Response Times | -16% | -12% | -38% | -14% | |
| Response Time Grey 50% / Grey 80% * (ms) | 34 ? | 39 ? -15% | 38 ? -12% | 50.4 ? -48% | 39 ? -15% |
| Response Time Black / White * (ms) | 24 ? | 28 ? -17% | 26.8 ? -12% | 30.8 ? -28% | 27 ? -13% |
| PWM Frequency (Hz) | 21000 ? | 25000 ? | 20410 ? | ||
| Screen | -32% | -42% | -40% | -8% | |
| Brightness middle (cd/m²) | 320 | 271 -15% | 283.9 -11% | 274 -14% | 251 -22% |
| Brightness (cd/m²) | 315 | 256 -19% | 261 -17% | 256 -19% | 229 -27% |
| Brightness Distribution (%) | 86 | 85 -1% | 85 -1% | 85 -1% | 85 -1% |
| Black Level * (cd/m²) | 0.31 | 0.43 -39% | 0.25 19% | 0.35 -13% | 0.15 52% |
| Contrast (:1) | 1032 | 630 -39% | 1136 10% | 783 -24% | 1673 62% |
| Colorchecker dE 2000 * | 3.44 | 5.03 -46% | 6.4 -86% | 6.1 -77% | 4.67 -36% |
| Colorchecker dE 2000 max. * | 9.39 | 11.9 -27% | 18.7 -99% | 13.8 -47% | 9.4 -0% |
| Greyscale dE 2000 * | 2.31 | 4.02 -74% | 6.3 -173% | 5.7 -147% | 3.09 -34% |
| Gamma | 2.38 92% | 2.31 95% | 2.39 92% | 2.11 104% | 2.44 90% |
| CCT | 6496 100% | 6659 98% | 6511 100% | 6419 101% | 7050 92% |
| Color Space (Percent of AdobeRGB 1998) (%) | 55 | 39 -29% | 38 -31% | 40.2 -27% | 35 -36% |
| Color Space (Percent of sRGB) (%) | 84 | 61 -27% | 60 -29% | 62.4 -26% | 55 -35% |
| Média Total (Programa/Configurações) | -26% /
-29% | -29% /
-36% | -36% /
-37% | -20% /
-15% |
* ... menor é melhor

Exibir tempos de resposta
| ↔ Tempo de resposta preto para branco | ||
|---|---|---|
| 24 ms ... ascensão ↗ e queda ↘ combinadas | ↗ 14 ms ascensão | 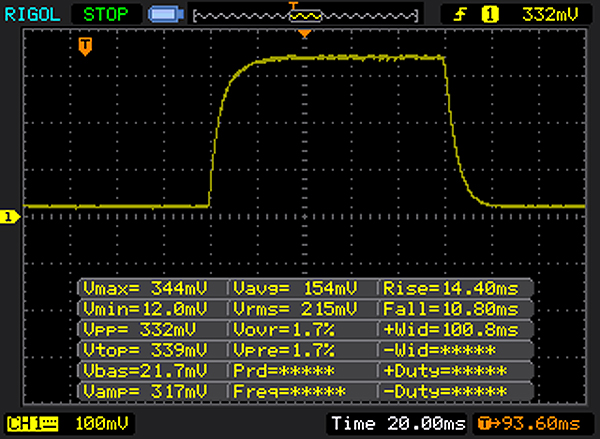 |
| ↘ 10 ms queda | ||
| A tela mostra boas taxas de resposta em nossos testes, mas pode ser muito lenta para jogadores competitivos. Em comparação, todos os dispositivos testados variam de 0.1 (mínimo) a 240 (máximo) ms. » 54 % de todos os dispositivos são melhores. Isso significa que o tempo de resposta medido é pior que a média de todos os dispositivos testados (19.8 ms). | ||
| ↔ Tempo de resposta 50% cinza a 80% cinza | ||
| 34 ms ... ascensão ↗ e queda ↘ combinadas | ↗ 16 ms ascensão | 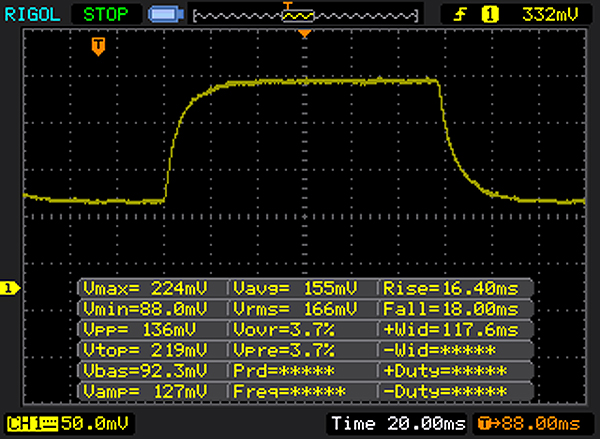 |
| ↘ 18 ms queda | ||
| A tela mostra taxas de resposta lentas em nossos testes e será insatisfatória para os jogadores. Em comparação, todos os dispositivos testados variam de 0.165 (mínimo) a 636 (máximo) ms. » 47 % de todos os dispositivos são melhores. Isso significa que o tempo de resposta medido é semelhante à média de todos os dispositivos testados (31 ms). | ||
Cintilação da tela / PWM (modulação por largura de pulso)
| Tela tremeluzindo/PWM detectado | 21000 Hz | ≤ 90 % configuração de brilho | 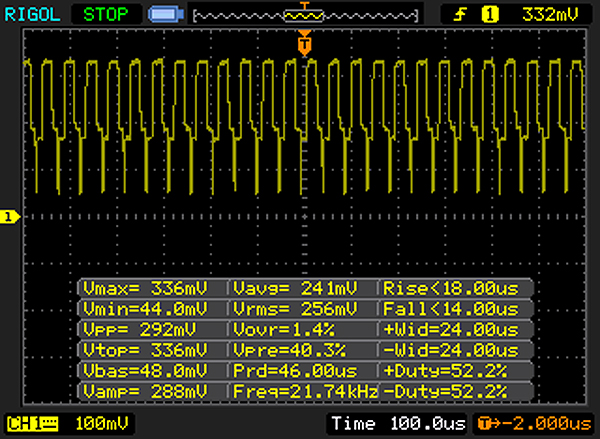 |
A luz de fundo da tela pisca em 21000 Hz (pior caso, por exemplo, utilizando PWM) Cintilação detectada em uma configuração de brilho de 90 % e abaixo. Não deve haver cintilação ou PWM acima desta configuração de brilho. A frequência de 21000 Hz é bastante alta, então a maioria dos usuários sensíveis ao PWM não deve notar nenhuma oscilação. [pwm_comparison] Em comparação: 52 % de todos os dispositivos testados não usam PWM para escurecer a tela. Se PWM foi detectado, uma média de 7772 (mínimo: 5 - máximo: 343500) Hz foi medida. | |||
| Cinebench R15 | |
| CPU Single 64Bit | |
| Toshiba Tecra X40-D | |
| Acer TravelMate P449-G2-M-56CD | |
| HP 14-bs007ng | |
| Lenovo ThinkPad L470-20J5S00C00 | |
| Acer TravelMate P249-M-5452 | |
| Fujitsu Lifebook E746 | |
| CPU Multi 64Bit | |
| Toshiba Tecra X40-D | |
| HP 14-bs007ng | |
| Acer TravelMate P449-G2-M-56CD | |
| Lenovo ThinkPad L470-20J5S00C00 | |
| Acer TravelMate P249-M-5452 | |
| Fujitsu Lifebook E746 | |
| PCMark 8 | |
| Home Score Accelerated v2 | |
| Toshiba Tecra X40-D | |
| HP 14-bs007ng | |
| Acer TravelMate P449-G2-M-56CD | |
| Acer TravelMate P249-M-5452 | |
| Lenovo ThinkPad L470-20J5S00C00 | |
| Fujitsu Lifebook E746 | |
| Work Score Accelerated v2 | |
| Toshiba Tecra X40-D | |
| Acer TravelMate P449-G2-M-56CD | |
| Acer TravelMate P249-M-5452 | |
| Fujitsu Lifebook E746 | |
| Lenovo ThinkPad L470-20J5S00C00 | |
| PCMark 8 Home Score Accelerated v2 | 3133 pontos | |
| PCMark 8 Work Score Accelerated v2 | 4288 pontos | |
Ajuda | ||
| Fujitsu Lifebook E746 Toshiba THNSNK256GCS8 | Acer TravelMate P449-G2-M-56CD Intel SSD 600p SSDPEKKW512G7 | Lenovo ThinkPad L470-20J5S00C00 SanDisk X400 256GB, SATA (SD8SB8U-256G) | HP 14-bs007ng SanDisk SD8SN8U256G1006 | Acer TravelMate P249-M-5452 SK Hynix HFS256G39TND-N210A | |
|---|---|---|---|---|---|
| CrystalDiskMark 3.0 | 80% | 7% | -3% | 6% | |
| Read Seq (MB/s) | 490.6 | 1086 121% | 495.2 1% | 456.1 -7% | 510 4% |
| Write Seq (MB/s) | 264.8 | 581 119% | 485.7 83% | 457.3 73% | 267.2 1% |
| Read 512 (MB/s) | 411.6 | 869 111% | 323.4 -21% | 347 -16% | 347.6 -16% |
| Write 512 (MB/s) | 262.3 | 584 123% | 291.5 11% | 277.3 6% | 267.5 2% |
| Read 4k (MB/s) | 24.86 | 35.89 44% | 34.2 38% | 28.47 15% | 33.12 33% |
| Write 4k (MB/s) | 110.1 | 122.4 11% | 74.3 -33% | 55.4 -50% | 95.9 -13% |
| Read 4k QD32 (MB/s) | 383.4 | 462.9 21% | 321.3 -16% | 304.3 -21% | 392.8 2% |
| Write 4k QD32 (MB/s) | 198.7 | 370.9 87% | 188 -5% | 158.2 -20% | 266.4 34% |

| 3DMark 11 - 1280x720 Performance GPU | |
| Toshiba Tecra X40-D | |
| HP 14-bs007ng | |
| Lenovo ThinkPad L470-20J5S00C00 | |
| Acer TravelMate P449-G2-M-56CD | |
| Acer TravelMate P249-M-5452 | |
| Fujitsu Lifebook E746 | |
| 3DMark | |
| 1280x720 Cloud Gate Standard Graphics | |
| Toshiba Tecra X40-D | |
| Lenovo ThinkPad L470-20J5S00C00 | |
| Acer TravelMate P249-M-5452 | |
| Acer TravelMate P449-G2-M-56CD | |
| Fujitsu Lifebook E746 | |
| 1920x1080 Fire Strike Graphics | |
| Toshiba Tecra X40-D | |
| Lenovo ThinkPad L470-20J5S00C00 | |
| Acer TravelMate P249-M-5452 | |
| Acer TravelMate P449-G2-M-56CD | |
| Fujitsu Lifebook E746 | |
| 3DMark 11 Performance | 1359 pontos | |
| 3DMark Cloud Gate Standard Score | 5202 pontos | |
| 3DMark Fire Strike Score | 668 pontos | |
Ajuda | ||
| BioShock Infinite | |
| 1280x720 Very Low Preset | |
| Acer TravelMate P249-M-5452 | |
| HP 14-bs007ng | |
| Acer TravelMate P449-G2-M-56CD | |
| Lenovo ThinkPad L470-20J5S00C00 | |
| Fujitsu Lifebook E746 | |
| 1366x768 Medium Preset | |
| Acer TravelMate P249-M-5452 | |
| HP 14-bs007ng | |
| Acer TravelMate P449-G2-M-56CD | |
| Lenovo ThinkPad L470-20J5S00C00 | |
| Fujitsu Lifebook E746 | |
| baixo | média | alto | ultra | |
|---|---|---|---|---|
| BioShock Infinite (2013) | 40.9 | 23.02 | 18.87 | 5.88 |
| Thief (2014) | 17.7 | 10.4 | 8.9 |
Barulho
| Ocioso |
| 30.3 / 30.3 / 30.3 dB |
| Carga |
| 33.5 / 33.5 dB |
 | ||
30 dB silencioso 40 dB(A) audível 50 dB(A) ruidosamente alto |
||
min: | ||
(+) A temperatura máxima no lado superior é 31 °C / 88 F, em comparação com a média de 34.3 °C / 94 F , variando de 21.2 a 62.5 °C para a classe Office.
(+) A parte inferior aquece até um máximo de 32.8 °C / 91 F, em comparação com a média de 36.8 °C / 98 F
(+) Em uso inativo, a temperatura média para o lado superior é 26.2 °C / 79 F, em comparação com a média do dispositivo de 29.5 °C / ### class_avg_f### F.
(+) Os apoios para as mãos e o touchpad são mais frios que a temperatura da pele, com um máximo de 30.2 °C / 86.4 F e, portanto, são frios ao toque.
(-) A temperatura média da área do apoio para as mãos de dispositivos semelhantes foi 27.5 °C / 81.5 F (-2.7 °C / -4.9 F).
Fujitsu Lifebook E746 análise de áudio
(-) | alto-falantes não muito altos (###valor### dB)
Graves 100 - 315Hz
(-) | quase nenhum baixo - em média 36.4% menor que a mediana
(+) | o baixo é linear (6.3% delta para a frequência anterior)
Médios 400 - 2.000 Hz
(±) | médios reduzidos - em média 11.2% menor que a mediana
(±) | a linearidade dos médios é média (11.3% delta para frequência anterior)
Altos 2 - 16 kHz
(+) | agudos equilibrados - apenas 2.8% longe da mediana
(+) | os máximos são lineares (6% delta da frequência anterior)
Geral 100 - 16.000 Hz
(-) | o som geral não é linear (33.6% diferença em relação à mediana)
Comparado com a mesma classe
» 96% de todos os dispositivos testados nesta classe foram melhores, 2% semelhantes, 3% piores
» O melhor teve um delta de 7%, a média foi 21%, o pior foi 53%
Comparado com todos os dispositivos testados
» 92% de todos os dispositivos testados foram melhores, 1% semelhantes, 6% piores
» O melhor teve um delta de 4%, a média foi 24%, o pior foi 134%
Apple MacBook 12 (Early 2016) 1.1 GHz análise de áudio
(+) | os alto-falantes podem tocar relativamente alto (###valor### dB)
Graves 100 - 315Hz
(±) | graves reduzidos - em média 11.3% menor que a mediana
(±) | a linearidade dos graves é média (14.2% delta para a frequência anterior)
Médios 400 - 2.000 Hz
(+) | médios equilibrados - apenas 2.4% longe da mediana
(+) | médios são lineares (5.5% delta para frequência anterior)
Altos 2 - 16 kHz
(+) | agudos equilibrados - apenas 2% longe da mediana
(+) | os máximos são lineares (4.5% delta da frequência anterior)
Geral 100 - 16.000 Hz
(+) | o som geral é linear (10.2% diferença em relação à mediana)
Comparado com a mesma classe
» 7% de todos os dispositivos testados nesta classe foram melhores, 2% semelhantes, 91% piores
» O melhor teve um delta de 5%, a média foi 18%, o pior foi 53%
Comparado com todos os dispositivos testados
» 5% de todos os dispositivos testados foram melhores, 1% semelhantes, 94% piores
» O melhor teve um delta de 4%, a média foi 24%, o pior foi 134%
| desligado | |
| Ocioso | |
| Carga |
|
Key:
min: | |
| Fujitsu Lifebook E746 6200U, HD Graphics 520, Toshiba THNSNK256GCS8, IPS, 1920x1080, 14" | Acer TravelMate P449-G2-M-56CD i5-7200U, HD Graphics 620, Intel SSD 600p SSDPEKKW512G7, IPS, 1920x1080, 14" | Toshiba Tecra X40-D i7-7600U, HD Graphics 620, Samsung PM961 MZVLW256HEHP, IPS, 1920x1080, 14" | Lenovo ThinkPad L470-20J5S00C00 i5-7200U, HD Graphics 620, SanDisk X400 256GB, SATA (SD8SB8U-256G), IPS, 1920x1080, 14" | HP 14-bs007ng i5-7200U, HD Graphics 620, SanDisk SD8SN8U256G1006, IPS, 1920x1080, 14" | |
|---|---|---|---|---|---|
| Power Consumption | -4% | 4% | 7% | 15% | |
| Idle Minimum * (Watt) | 3.9 | 4.5 -15% | 5.2 -33% | 2.6 33% | 3.1 21% |
| Idle Average * (Watt) | 7.9 | 7.1 10% | 6.9 13% | 6.3 20% | 5.5 30% |
| Idle Maximum * (Watt) | 9.6 | 10.2 -6% | 7 27% | 7 27% | 6 37% |
| Load Average * (Watt) | 30.4 | 29.8 2% | 24.6 19% | 29.1 4% | 29 5% |
| Load Maximum * (Watt) | 28.2 | 31 -10% | 30.1 -7% | 42.3 -50% | 33.7 -20% |
* ... menor é melhor
| Fujitsu Lifebook E746 6200U, HD Graphics 520, 63 Wh | Acer TravelMate P449-G2-M-56CD i5-7200U, HD Graphics 620, 48 Wh | Toshiba Tecra X40-D i7-7600U, HD Graphics 620, 48 Wh | Lenovo ThinkPad L470-20J5S00C00 i5-7200U, HD Graphics 620, 48 Wh | HP 14-bs007ng i5-7200U, HD Graphics 620, 41 Wh | |
|---|---|---|---|---|---|
| Duração da bateria | -9% | -5% | 25% | 51% | |
| Reader / Idle (h) | 19.7 | 16.3 -17% | 14.6 -26% | 23.3 18% | |
| WiFi v1.3 (h) | 4.7 | 5.7 21% | 6 28% | 8 70% | 7.1 51% |
| Load (h) | 2.5 | 1.7 -32% | 2.1 -16% | 2.2 -12% |
Pro
Contra
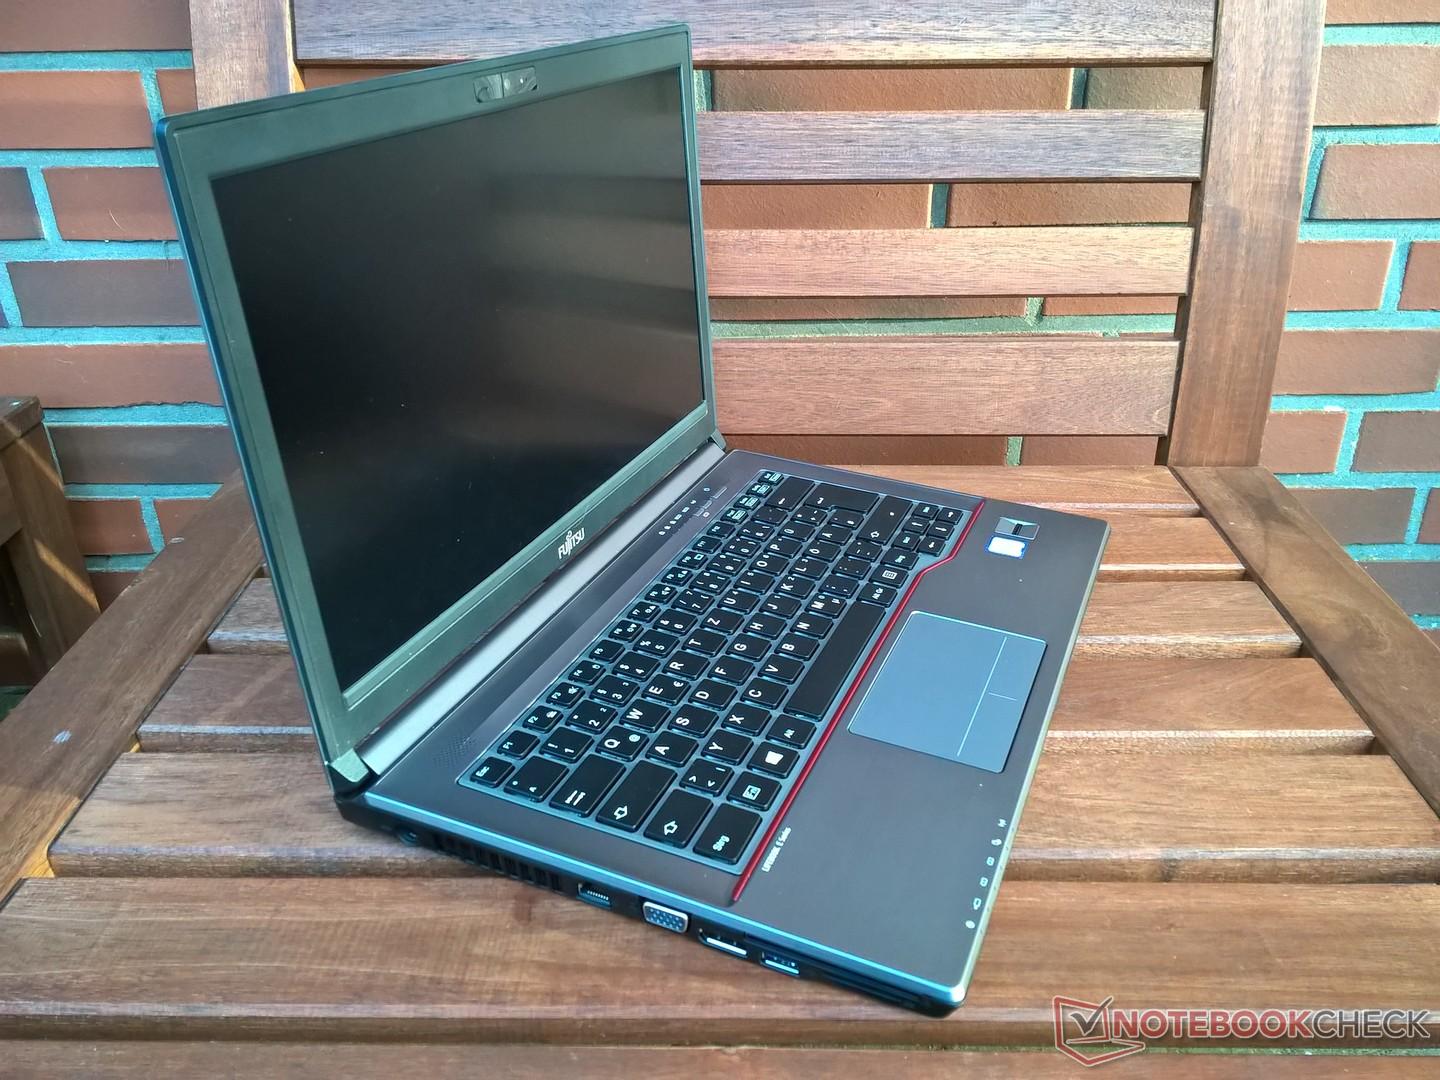
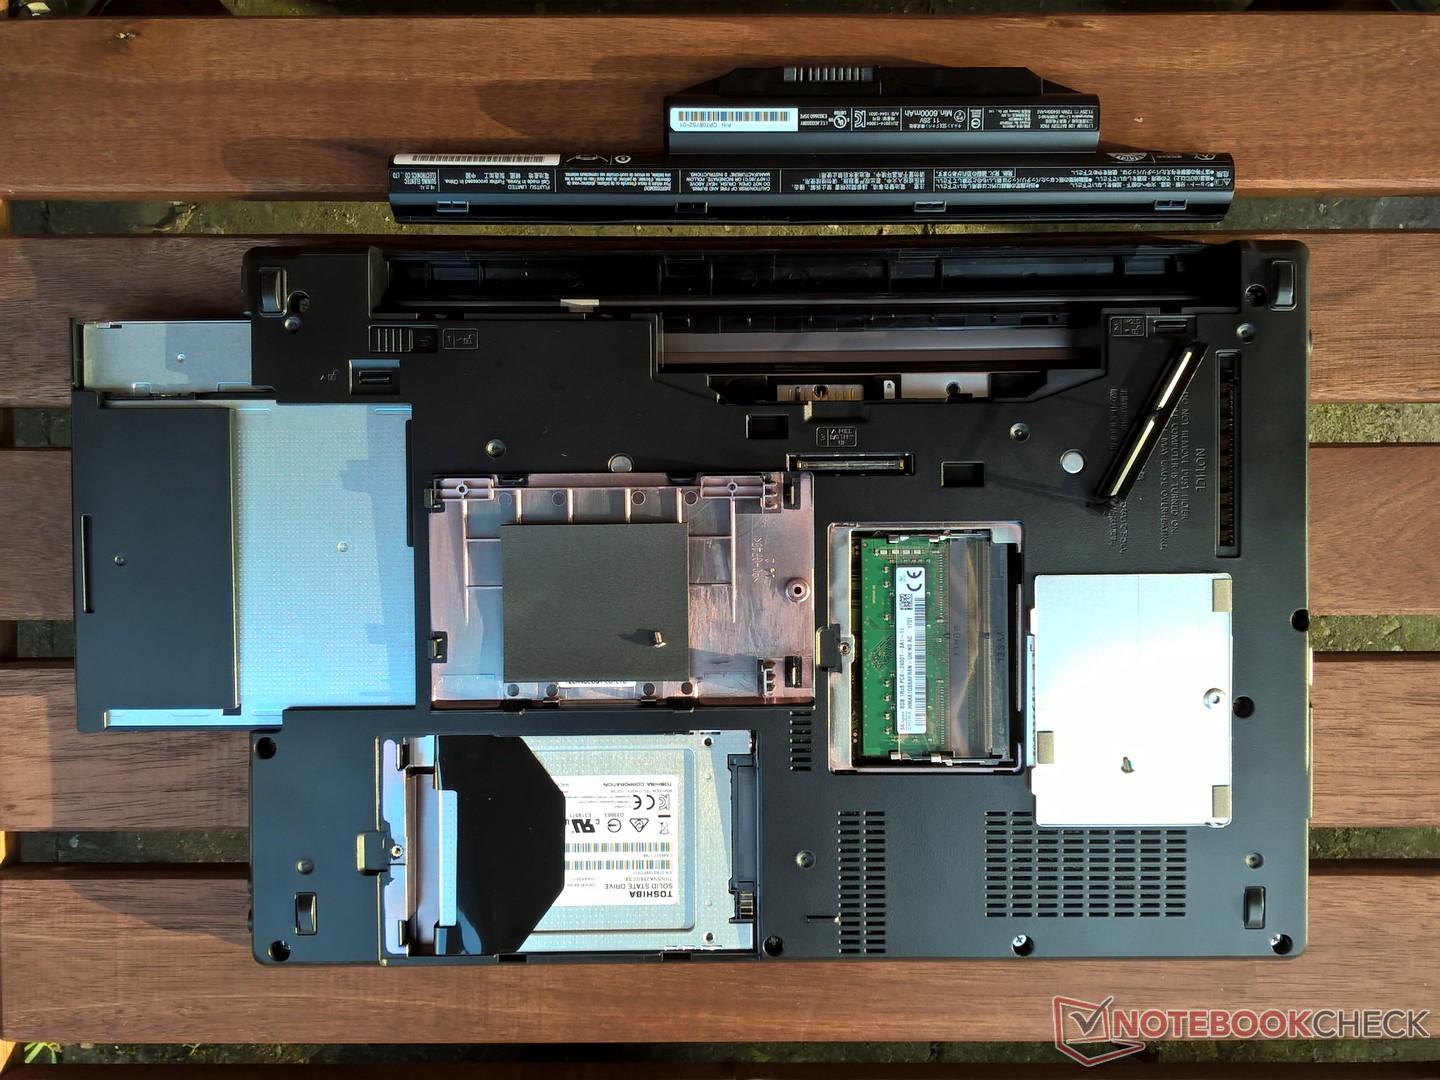
O LifeBook E746 é um sólido portátil empresarial. Oferece aos compradores uma ampla gama de portas e muitas opções de expansão. No entanto, as configurações disponíveis estão um pouco atrasadas em termos de desenvolvimentos técnicos mais recentes, já que a Fujitsu não oferece nenhum processador recente.
Com o LifeBook E746, a Fujitsu está oferecendo aos compradores um dispositivo de negócios caro, mas muito adaptável.
A relação preço-desempenho é outro ponto em contra do LifeBook E746. Muitos fabricantes oferecem dispositivos com melhor hardware e uma gama similar de portas a um preço significativamente menor.
Fujitsu Lifebook E746
- 11/13/2017 v6 (old)
Mike Wobker
Price comparison
