Breve Análise do Portátil Gigabyte Aero 14 (7700HQ, GTX 1060)
| SD Card Reader | |
| average JPG Copy Test (av. of 3 runs) | |
| Schenker XMG P407 | |
| Gigabyte Aero 14 | |
| MSI GS43VR 6RE-006US | |
| maximum AS SSD Seq Read Test (1GB) | |
| Schenker XMG P407 | |
| Gigabyte Aero 14 | |
| MSI GS43VR 6RE-006US | |
| Networking | |
| iperf3 transmit AX12 | |
| Razer Blade (2016) | |
| Gigabyte Aero 14 | |
| Schenker XMG P407 | |
| iperf3 receive AX12 | |
| Gigabyte Aero 14 | |
| Razer Blade (2016) | |
| Schenker XMG P407 | |
| |||||||||||||||||||||||||
iluminação: 79 %
iluminação com acumulador: 290 cd/m²
Contraste: 967:1 (Preto: 0.3 cd/m²)
ΔE ColorChecker Calman: 4.59 | ∀{0.5-29.43 Ø4.71}
ΔE Greyscale Calman: 4.32 | ∀{0.09-98 Ø4.96}
92% sRGB (Argyll 1.6.3 3D)
59% AdobeRGB 1998 (Argyll 1.6.3 3D)
65.5% AdobeRGB 1998 (Argyll 3D)
91.8% sRGB (Argyll 3D)
64.4% Display P3 (Argyll 3D)
Gamma: 2.25
CCT: 7320 K
| Gigabyte Aero 14 LG Philips LP140QH1-SPF1 (LGD049A), , 2560x1440, 14" | MSI GS43VR 6RE-006US Name: LG Philips LP140WF3-SPD1, ID: LGD046D, , 1920x1080, 14" | Schenker XMG P407 LG Philips LP140WF3-SPD1 (LGD046D), , 1920x1080, 14" | Razer Blade (2016) Sharp LQ140Z1JW01 (SHP1401), , 3200x1800, 14" | |
|---|---|---|---|---|
| Display | -3% | -6% | 4% | |
| Display P3 Coverage (%) | 64.4 | 65.5 2% | 64.5 0% | 66.9 4% |
| sRGB Coverage (%) | 91.8 | 86.4 -6% | 82.1 -11% | 96.8 5% |
| AdobeRGB 1998 Coverage (%) | 65.5 | 63.1 -4% | 60 -8% | 68.2 4% |
| Response Times | 13% | -12% | -24% | |
| Response Time Grey 50% / Grey 80% * (ms) | 41 ? | 31.6 ? 23% | 47 ? -15% | 41 ? -0% |
| Response Time Black / White * (ms) | 25 ? | 24.4 ? 2% | 27 ? -8% | 37 ? -48% |
| PWM Frequency (Hz) | 200 ? | |||
| Screen | 10% | 3% | 30% | |
| Brightness middle (cd/m²) | 290 | 288.4 -1% | 298 3% | 328 13% |
| Brightness (cd/m²) | 257 | 282 10% | 282 10% | 328 28% |
| Brightness Distribution (%) | 79 | 83 5% | 80 1% | 69 -13% |
| Black Level * (cd/m²) | 0.3 | 0.35 -17% | 0.27 10% | 0.22 27% |
| Contrast (:1) | 967 | 824 -15% | 1104 14% | 1491 54% |
| Colorchecker dE 2000 * | 4.59 | 2.61 43% | 4.42 4% | 1.91 58% |
| Colorchecker dE 2000 max. * | 8.68 | 7.34 15% | 8.57 1% | 3.23 63% |
| Greyscale dE 2000 * | 4.32 | 1.18 73% | 4.11 5% | 1.69 61% |
| Gamma | 2.25 98% | 2.24 98% | 2.5 88% | 2.3 96% |
| CCT | 7320 89% | 6506 100% | 6329 103% | 6418 101% |
| Color Space (Percent of AdobeRGB 1998) (%) | 59 | 56.4 -4% | 54 -8% | 63 7% |
| Color Space (Percent of sRGB) (%) | 92 | 86.4 -6% | 82 -11% | 97 5% |
| Média Total (Programa/Configurações) | 7% /
8% | -5% /
-1% | 3% /
18% |
* ... menor é melhor
Exibir tempos de resposta
| ↔ Tempo de resposta preto para branco | ||
|---|---|---|
| 25 ms ... ascensão ↗ e queda ↘ combinadas | ↗ 4 ms ascensão | 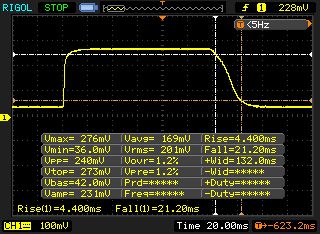 |
| ↘ 21 ms queda | ||
| A tela mostra taxas de resposta relativamente lentas em nossos testes e pode ser muito lenta para os jogadores. Em comparação, todos os dispositivos testados variam de 0.1 (mínimo) a 240 (máximo) ms. » 59 % de todos os dispositivos são melhores. Isso significa que o tempo de resposta medido é pior que a média de todos os dispositivos testados (19.8 ms). | ||
| ↔ Tempo de resposta 50% cinza a 80% cinza | ||
| 41 ms ... ascensão ↗ e queda ↘ combinadas | ↗ 17 ms ascensão | 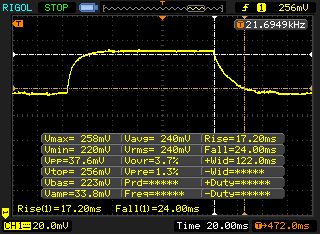 |
| ↘ 24 ms queda | ||
| A tela mostra taxas de resposta lentas em nossos testes e será insatisfatória para os jogadores. Em comparação, todos os dispositivos testados variam de 0.165 (mínimo) a 636 (máximo) ms. » 65 % de todos os dispositivos são melhores. Isso significa que o tempo de resposta medido é pior que a média de todos os dispositivos testados (30.9 ms). | ||
Cintilação da tela / PWM (modulação por largura de pulso)
| Tela tremeluzindo / PWM não detectado | 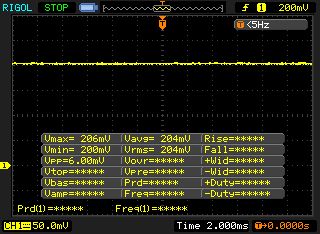 | ||
[pwm_comparison] Em comparação: 52 % de todos os dispositivos testados não usam PWM para escurecer a tela. Se PWM foi detectado, uma média de 7744 (mínimo: 5 - máximo: 343500) Hz foi medida. | |||
| Cinebench R15 | |
| CPU Single 64Bit | |
| Gigabyte Aero 14 | |
| Schenker XMG P407 | |
| Razer Blade (2016) | |
| MSI GS43VR 6RE-006US | |
| CPU Multi 64Bit | |
| Schenker XMG P407 | |
| Gigabyte Aero 14 | |
| MSI GS43VR 6RE-006US | |
| Razer Blade (2016) | |
| PCMark 8 | |
| Home Score Accelerated v2 | |
| Schenker XMG P407 | |
| MSI GS43VR 6RE-006US | |
| Gigabyte Aero 14 | |
| Razer Blade (2016) | |
| Work Score Accelerated v2 | |
| Schenker XMG P407 | |
| MSI GS43VR 6RE-006US | |
| Gigabyte Aero 14 | |
| Razer Blade (2016) | |
| PCMark 8 Home Score Accelerated v2 | 3717 pontos | |
| PCMark 8 Work Score Accelerated v2 | 4702 pontos | |
Ajuda | ||
| Gigabyte Aero 14 LiteOn CX2-8B256 | MSI GS43VR 6RE-006US SanDisk SD8SN8U1T001122 | Schenker XMG P407 Samsung SM961 MZVPW256 m.2 PCI-e | Razer Blade (2016) Samsung PM951 NVMe MZVLV512 | |
|---|---|---|---|---|
| CrystalDiskMark 3.0 | -68% | 19% | -12% | |
| Read Seq (MB/s) | 1584 | 335.3 -79% | 1345 -15% | 1296 -18% |
| Write Seq (MB/s) | 795 | 299 -62% | 1502 89% | 603 -24% |
| Read 512 (MB/s) | 985 | 223 -77% | 320.3 -67% | 655 -34% |
| Write 512 (MB/s) | 814 | 246.7 -70% | 1276 57% | 604 -26% |
| Read 4k (MB/s) | 44.93 | 17.68 -61% | 58.9 31% | 42.22 -6% |
| Write 4k (MB/s) | 131.2 | 35.31 -73% | 171 30% | 139.6 6% |
| Read 4k QD32 (MB/s) | 602 | 247.4 -59% | 625 4% | 573 -5% |
| Write 4k QD32 (MB/s) | 441 | 156.3 -65% | 539 22% | 480 9% |

| 3DMark - 1920x1080 Fire Strike Graphics | |
| MSI GS43VR 6RE-006US | |
| Gigabyte Aero 14 | |
| Razer Blade (2016) | |
| Schenker XMG P407 | |
| 3DMark 11 - 1280x720 Performance GPU | |
| MSI GS43VR 6RE-006US | |
| Gigabyte Aero 14 | |
| Razer Blade (2016) | |
| Schenker XMG P407 | |
| 3DMark 11 Performance | 11868 pontos | |
| 3DMark Cloud Gate Standard Score | 20574 pontos | |
| 3DMark Fire Strike Score | 9778 pontos | |
Ajuda | ||
| The Witcher 3 - 1920x1080 Ultra Graphics & Postprocessing (HBAO+) | |
| Gigabyte Aero 14 | |
| Razer Blade (2016) | |
| baixo | média | alto | ultra | |
|---|---|---|---|---|
| The Witcher 3 (2015) | 38.3 | |||
| Anno 2205 (2015) | 77.5 | 29 | ||
| The Division (2016) | 46.9 | 37.8 | ||
| For Honor (2017) | 56 () | 42 () | ||
| Ghost Recon Wildlands (2017) | 66.2 | 60.1 | 35.7 |
Barulho
| Ocioso |
| 31 / 32 / 33 dB |
| Carga |
| 42 / 53 dB |
 | ||
30 dB silencioso 40 dB(A) audível 50 dB(A) ruidosamente alto |
||
min: | ||
(-) A temperatura máxima no lado superior é 58.3 °C / 137 F, em comparação com a média de 36.8 °C / 98 F , variando de 21 a 71 °C para a classe Multimedia.
(-) A parte inferior aquece até um máximo de 59.8 °C / 140 F, em comparação com a média de 39.1 °C / 102 F
(+) Em uso inativo, a temperatura média para o lado superior é 22.9 °C / 73 F, em comparação com a média do dispositivo de 31.3 °C / ### class_avg_f### F.
(-) Jogando The Witcher 3, a temperatura média para o lado superior é 40.7 °C / 105 F, em comparação com a média do dispositivo de 31.3 °C / ## #class_avg_f### F.
(+) Os apoios para as mãos e o touchpad estão atingindo a temperatura máxima da pele (34.5 °C / 94.1 F) e, portanto, não estão quentes.
(-) A temperatura média da área do apoio para as mãos de dispositivos semelhantes foi 28.7 °C / 83.7 F (-5.8 °C / -10.4 F).
Gigabyte Aero 14 análise de áudio
(±) | o volume do alto-falante é médio, mas bom (###valor### dB)
Graves 100 - 315Hz
(±) | graves reduzidos - em média 10.6% menor que a mediana
(±) | a linearidade dos graves é média (13.7% delta para a frequência anterior)
Médios 400 - 2.000 Hz
(+) | médios equilibrados - apenas 3.6% longe da mediana
(±) | a linearidade dos médios é média (8% delta para frequência anterior)
Altos 2 - 16 kHz
(+) | agudos equilibrados - apenas 2.1% longe da mediana
(+) | os máximos são lineares (5.1% delta da frequência anterior)
Geral 100 - 16.000 Hz
(+) | o som geral é linear (12.8% diferença em relação à mediana)
Comparado com a mesma classe
» 24% de todos os dispositivos testados nesta classe foram melhores, 5% semelhantes, 71% piores
» O melhor teve um delta de 5%, a média foi 17%, o pior foi 45%
Comparado com todos os dispositivos testados
» 12% de todos os dispositivos testados foram melhores, 3% semelhantes, 85% piores
» O melhor teve um delta de 4%, a média foi 23%, o pior foi 134%
Razer Blade (2016) análise de áudio
(±) | o volume do alto-falante é médio, mas bom (###valor### dB)
Graves 100 - 315Hz
(±) | graves reduzidos - em média 8.4% menor que a mediana
(±) | a linearidade dos graves é média (11.2% delta para a frequência anterior)
Médios 400 - 2.000 Hz
(+) | médios equilibrados - apenas 4.6% longe da mediana
(+) | médios são lineares (4.3% delta para frequência anterior)
Altos 2 - 16 kHz
(+) | agudos equilibrados - apenas 4.3% longe da mediana
(+) | os máximos são lineares (5.5% delta da frequência anterior)
Geral 100 - 16.000 Hz
(±) | a linearidade do som geral é média (17.1% diferença em relação à mediana)
Comparado com a mesma classe
» 46% de todos os dispositivos testados nesta classe foram melhores, 12% semelhantes, 42% piores
» O melhor teve um delta de 6%, a média foi 18%, o pior foi 132%
Comparado com todos os dispositivos testados
» 31% de todos os dispositivos testados foram melhores, 8% semelhantes, 61% piores
» O melhor teve um delta de 4%, a média foi 23%, o pior foi 134%
MSI GS43VR 6RE-006US análise de áudio
(±) | o volume do alto-falante é médio, mas bom (###valor### dB)
Graves 100 - 315Hz
(-) | quase nenhum baixo - em média 17.5% menor que a mediana
(±) | a linearidade dos graves é média (12% delta para a frequência anterior)
Médios 400 - 2.000 Hz
(+) | médios equilibrados - apenas 3.9% longe da mediana
(±) | a linearidade dos médios é média (9.5% delta para frequência anterior)
Altos 2 - 16 kHz
(±) | máximos mais altos - em média 6.4% maior que a mediana
(±) | a linearidade dos máximos é média (8.5% delta para frequência anterior)
Geral 100 - 16.000 Hz
(±) | a linearidade do som geral é média (28.9% diferença em relação à mediana)
Comparado com a mesma classe
» 95% de todos os dispositivos testados nesta classe foram melhores, 2% semelhantes, 4% piores
» O melhor teve um delta de 6%, a média foi 18%, o pior foi 132%
Comparado com todos os dispositivos testados
» 87% de todos os dispositivos testados foram melhores, 2% semelhantes, 11% piores
» O melhor teve um delta de 4%, a média foi 23%, o pior foi 134%
Schenker XMG P407 análise de áudio
(±) | o volume do alto-falante é médio, mas bom (###valor### dB)
Graves 100 - 315Hz
(-) | quase nenhum baixo - em média 19.2% menor que a mediana
(±) | a linearidade dos graves é média (11% delta para a frequência anterior)
Médios 400 - 2.000 Hz
(+) | médios equilibrados - apenas 4.4% longe da mediana
(±) | a linearidade dos médios é média (9.6% delta para frequência anterior)
Altos 2 - 16 kHz
(+) | agudos equilibrados - apenas 3.7% longe da mediana
(+) | os máximos são lineares (5.5% delta da frequência anterior)
Geral 100 - 16.000 Hz
(±) | a linearidade do som geral é média (20.5% diferença em relação à mediana)
Comparado com a mesma classe
» 73% de todos os dispositivos testados nesta classe foram melhores, 5% semelhantes, 22% piores
» O melhor teve um delta de 6%, a média foi 18%, o pior foi 132%
Comparado com todos os dispositivos testados
» 54% de todos os dispositivos testados foram melhores, 8% semelhantes, 38% piores
» O melhor teve um delta de 4%, a média foi 23%, o pior foi 134%
| desligado | |
| Ocioso | |
| Carga |
|
Key:
min: | |
| Gigabyte Aero 14 i7-7700HQ, GeForce GTX 1060 Mobile | MSI GS43VR 6RE-006US 6700HQ, GeForce GTX 1060 Mobile | Schenker XMG P407 i7-7700HQ, GeForce GTX 1050 Ti Mobile | Razer Blade (2016) 6700HQ, GeForce GTX 1060 Mobile | |
|---|---|---|---|---|
| Power Consumption | -28% | -10% | -2% | |
| Idle Minimum * (Watt) | 8 | 12.1 -51% | 10 -25% | 9 -13% |
| Idle Average * (Watt) | 13 | 19 -46% | 15 -15% | 14 -8% |
| Idle Maximum * (Watt) | 20 | 19.5 2% | 24 -20% | 22 -10% |
| Load Average * (Watt) | 78 | 106.7 -37% | 82 -5% | 72 8% |
| Witcher 3 ultra * (Watt) | 110 | |||
| Load Maximum * (Watt) | 146 | 159 -9% | 124 15% | 124 15% |
* ... menor é melhor
| Gigabyte Aero 14 i7-7700HQ, GeForce GTX 1060 Mobile, 94 Wh | MSI GS43VR 6RE-006US 6700HQ, GeForce GTX 1060 Mobile, 61 Wh | Schenker XMG P407 i7-7700HQ, GeForce GTX 1050 Ti Mobile, 45 Wh | Razer Blade (2016) 6700HQ, GeForce GTX 1060 Mobile, 70 Wh | |
|---|---|---|---|---|
| Duração da bateria | -42% | -46% | -53% | |
| Reader / Idle (h) | 15.2 | 9.6 -37% | 7.4 -51% | |
| WiFi v1.3 (h) | 8.7 | 4.4 -49% | 4 -54% | 4.1 -53% |
| Load (h) | 2.2 | 1.3 -41% | 1.5 -32% | |
| H.264 (h) | 3.6 |
Então, está tudo ótimo? Bom, quase. A maioria dos itens em nossa lista de contras provavelmente será irrelevante para o típico consumidor do Aero 14. No entanto, o barulho constante da ventoinha com revoluções médias é muito irritante, e a Gigabyte precisa urgentemente abordar esse problema.
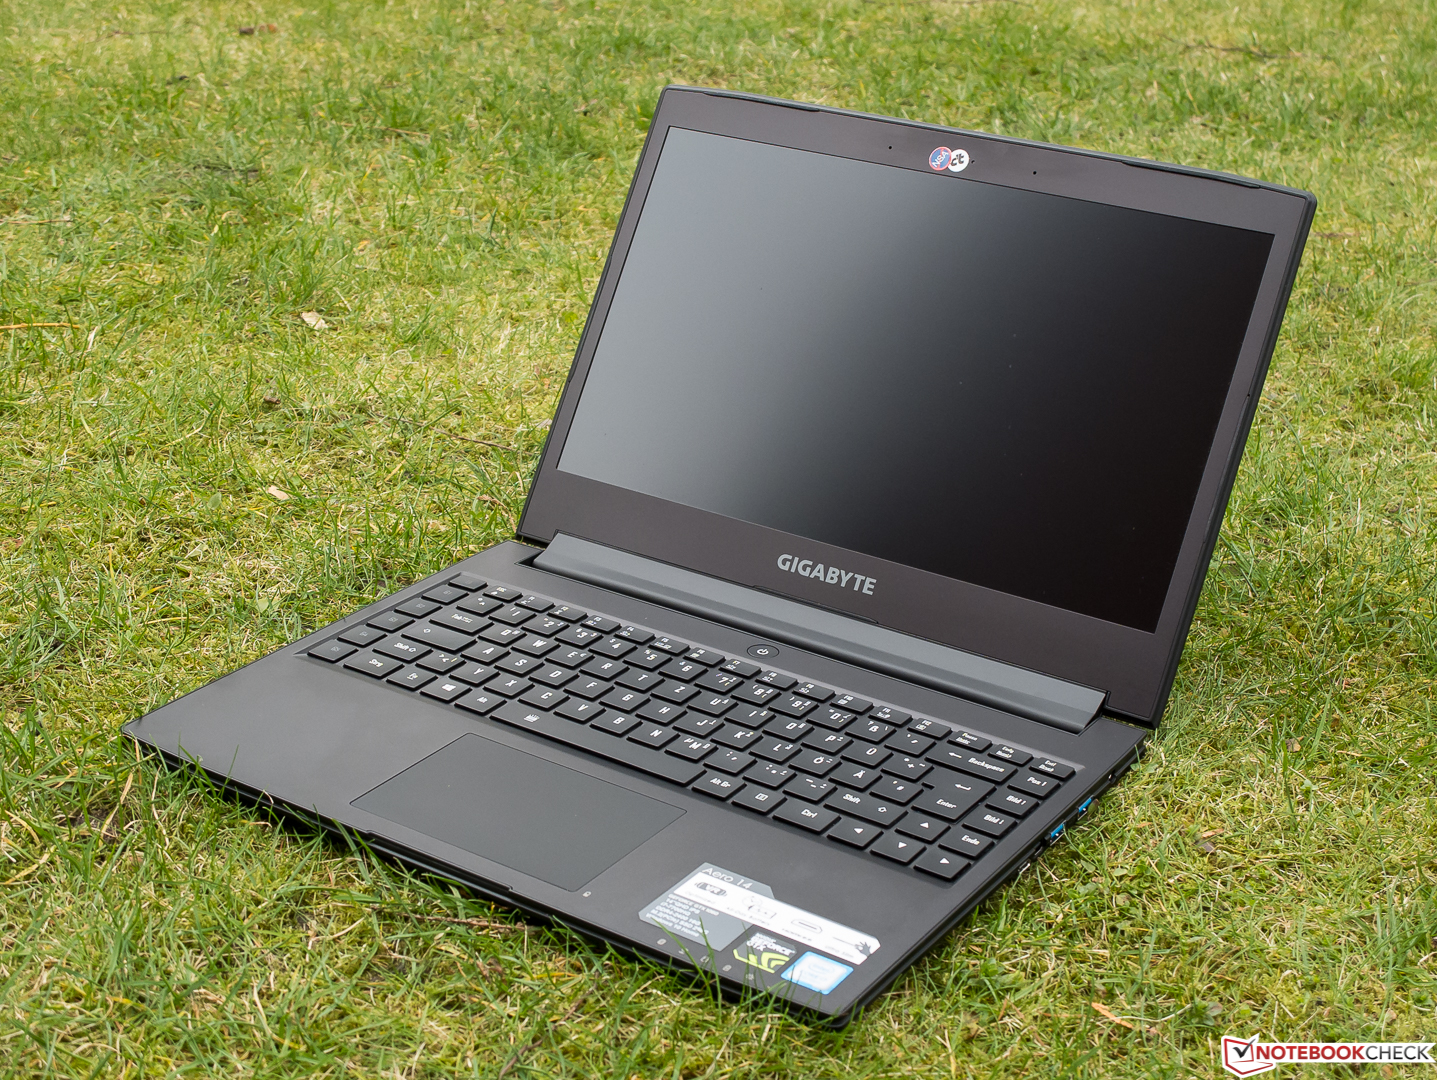
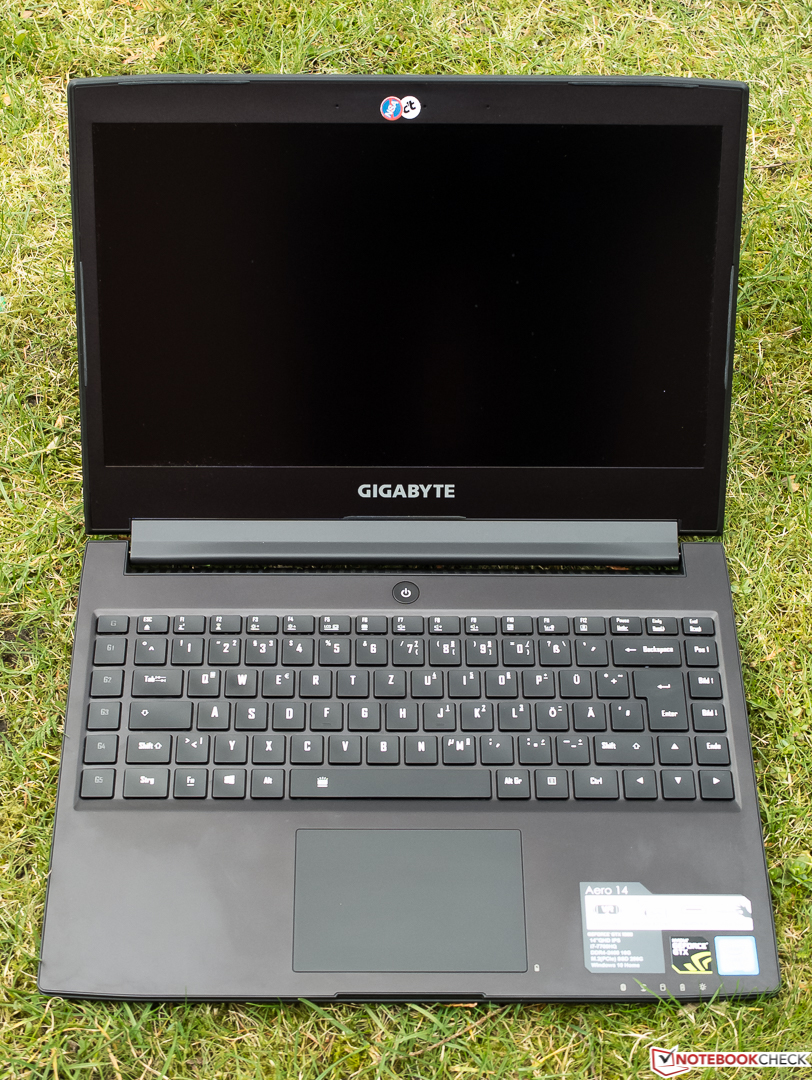
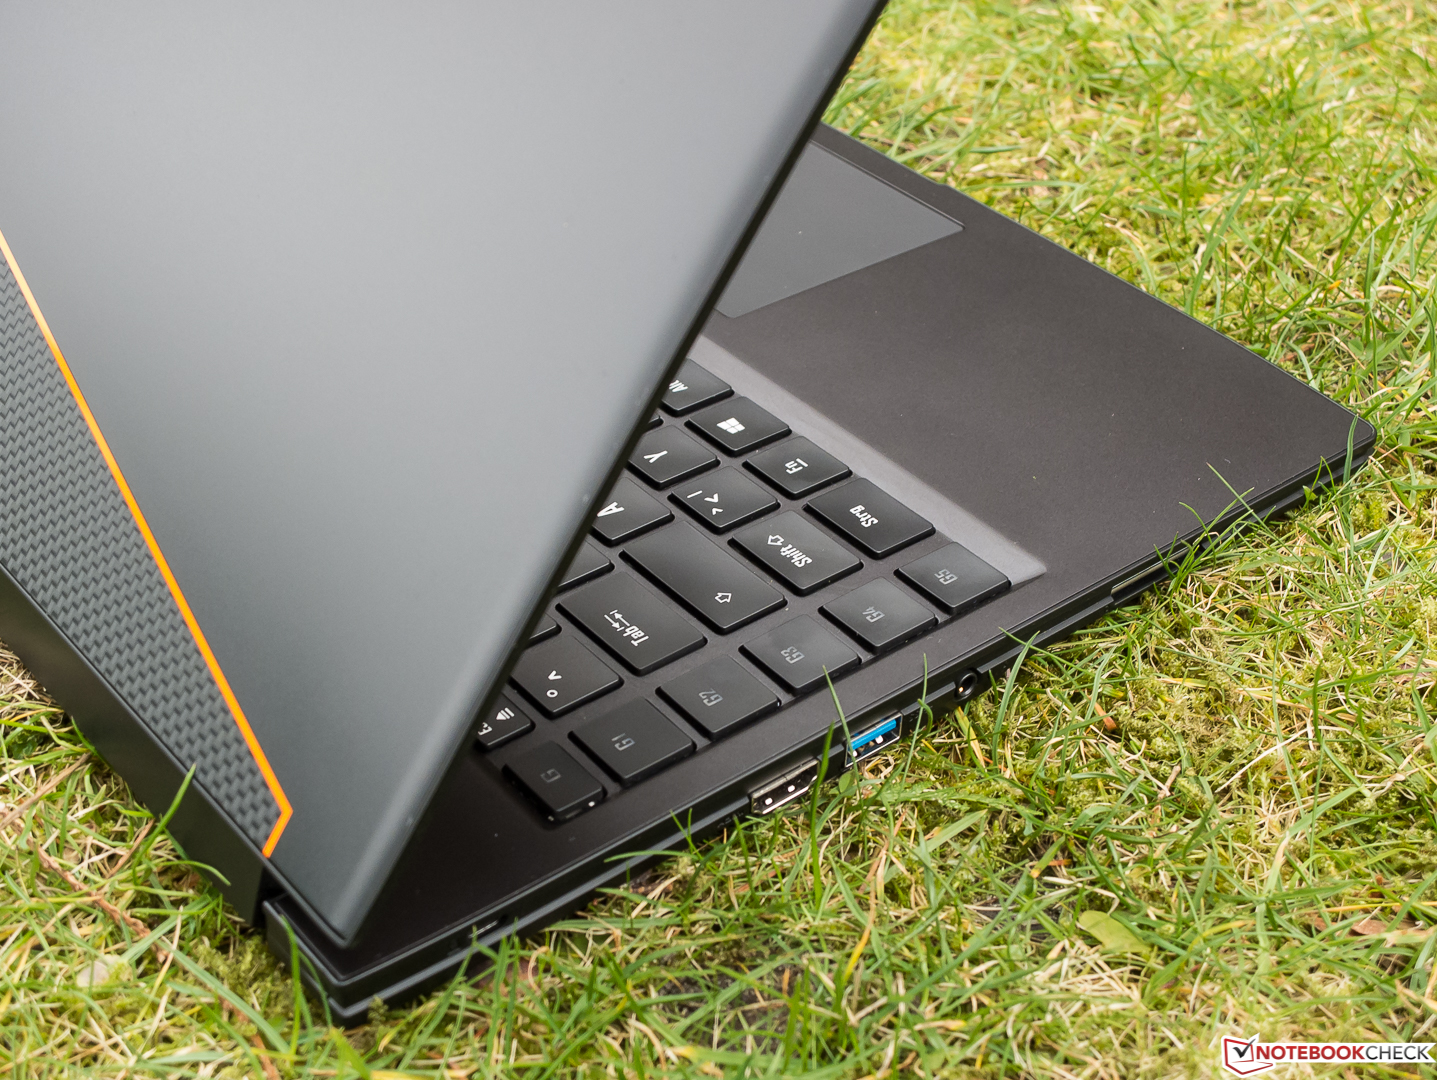
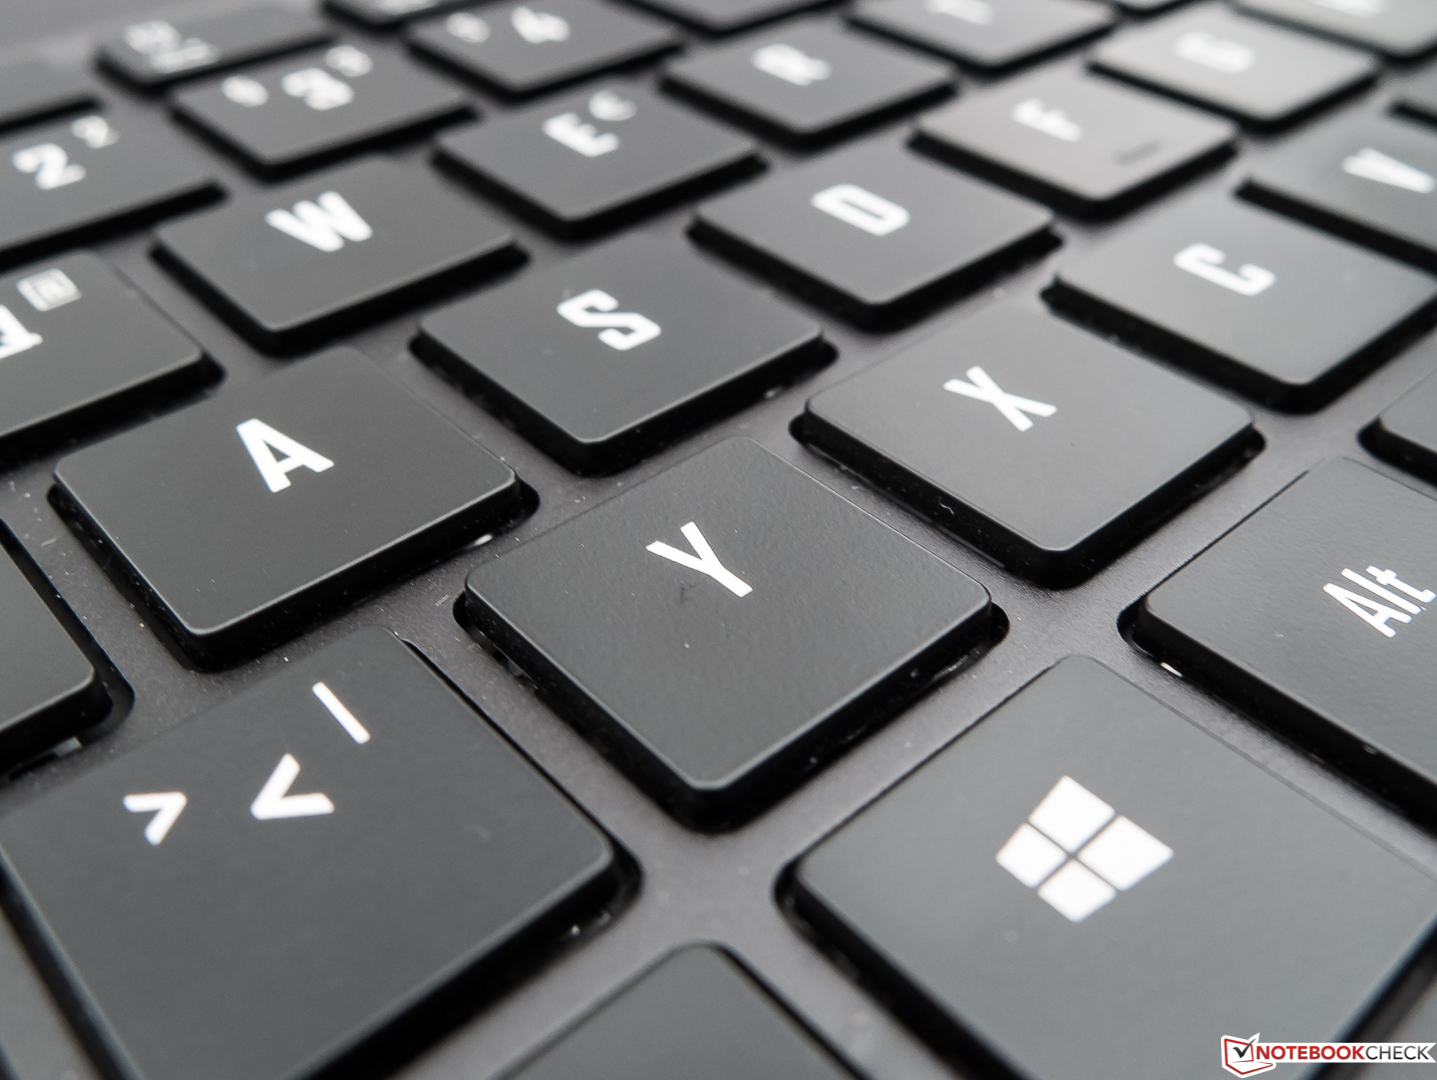
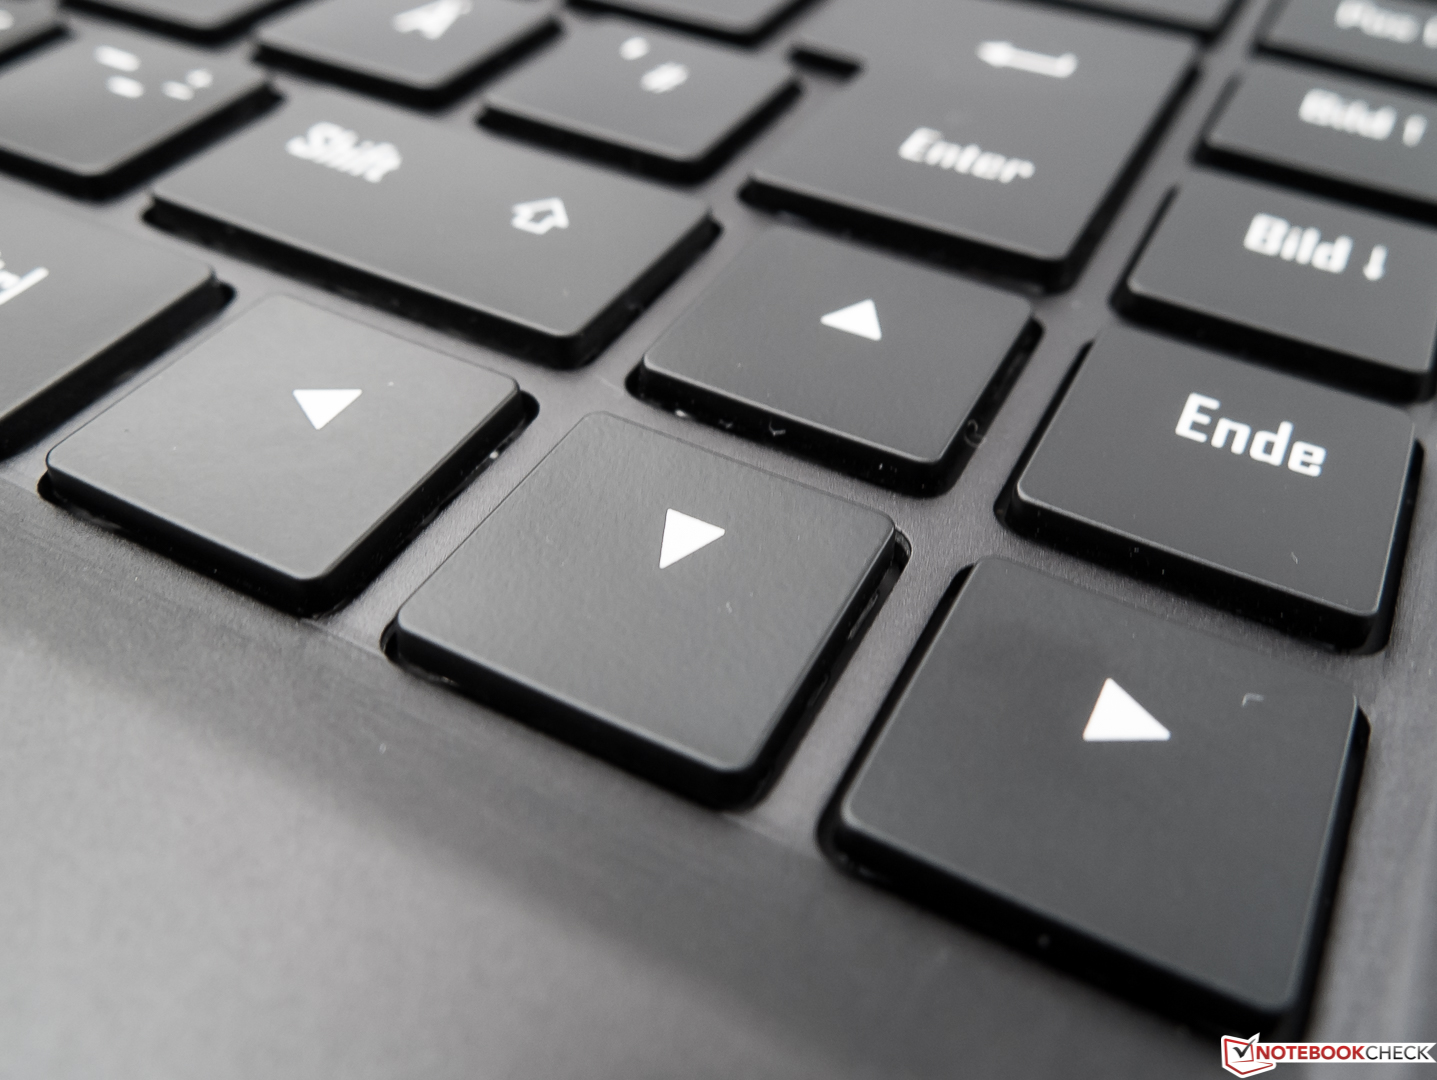
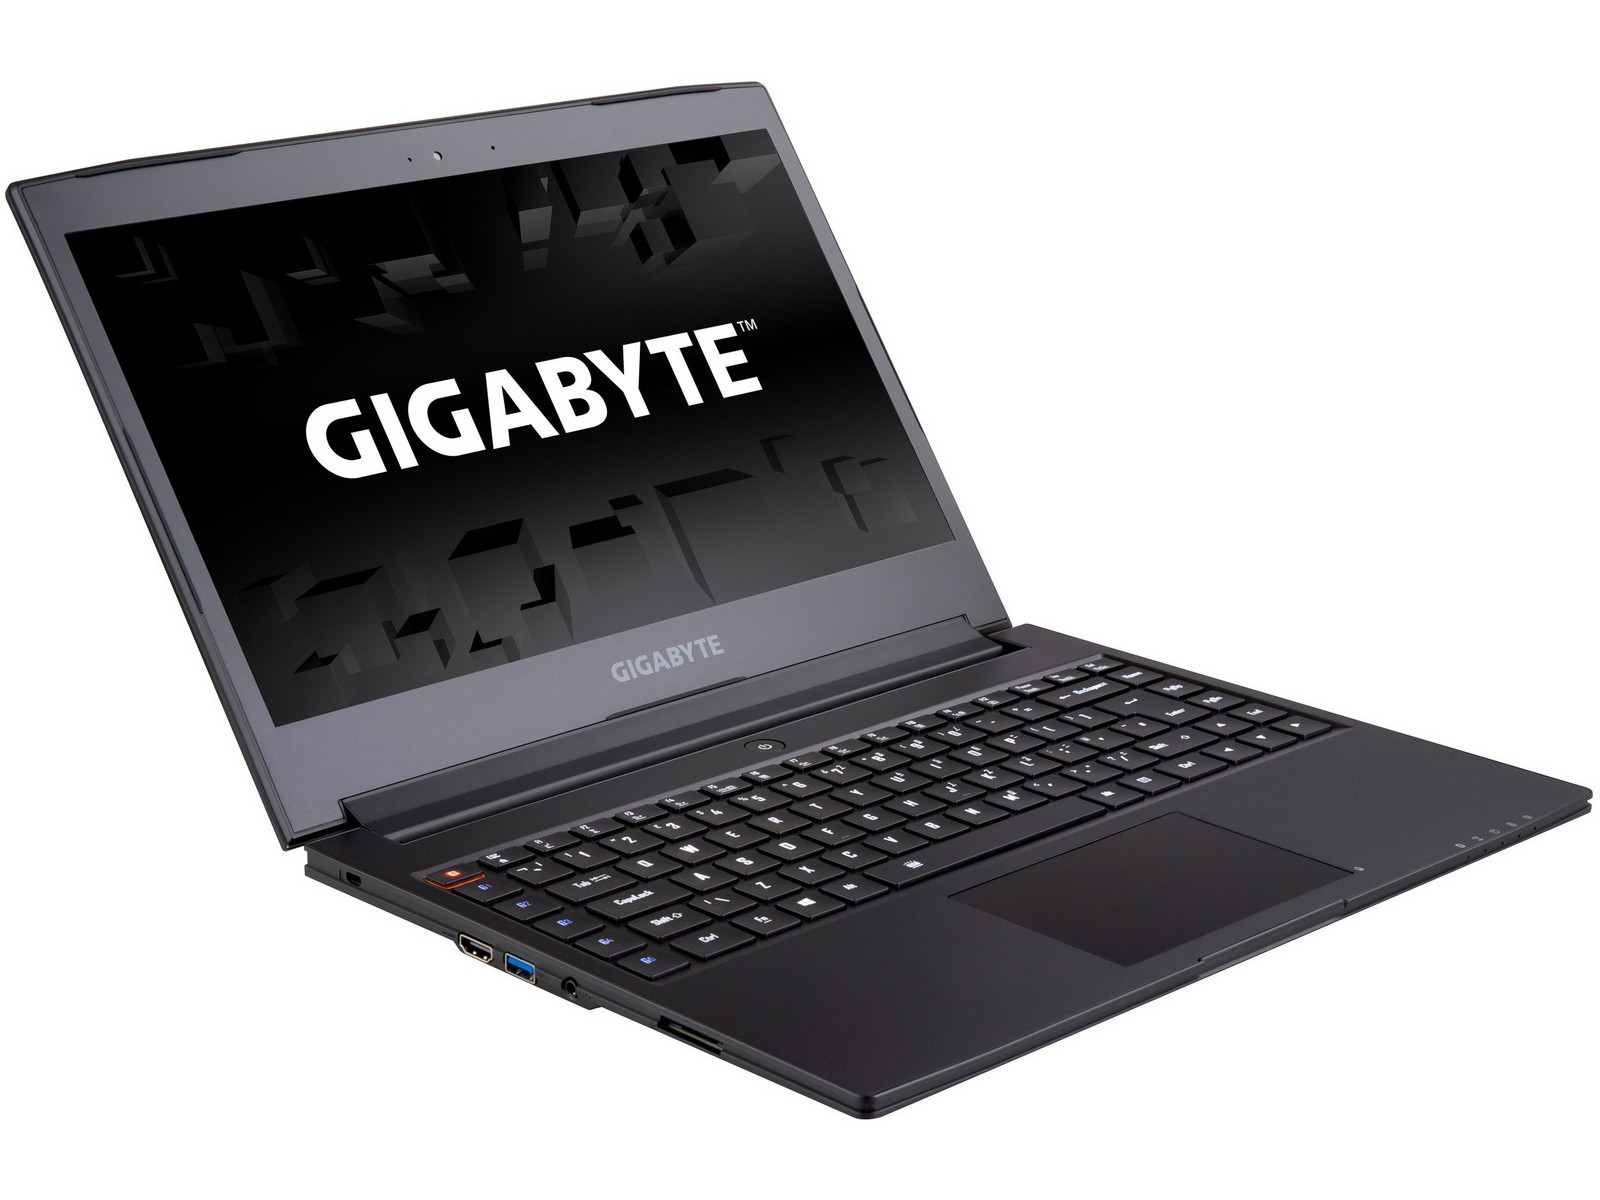
Fora isso, o Aero 14 deixou uma impressão geral muito boa. Apesar de sua massiva bateria, a carcaça de alumínio é compacta e leve; além de seu teclado co layout fora do padrão, os dispositivos de entrada ainda são suficientemente bons inclusive para portáteis de escritório; e existem mais portas das poderíamos desejar, incluindo um adaptador USB-Ethernet já incluída na caixa. Também não temos reclamos sobre o seu desempenho.
Sua enorme bateria e sua duração resultante, certamente são um recurso exclusivo do Gigabyte Aero 14 entre seus irmãos portáteis para jogos. Isto, no entanto, é ofuscado pelo barulho de alta frequência da ventoinha, motivo pelo qual simplesmente não podemos recomendar este portátil.
Pro
Contra
So, is everything hunky-dory? Well, almost. Most of the items on our cons list will probably be irrelevant to the typical Aero 14 consumer. However, the constant fan whining at medium revs is very annoying, and Gigabyte urgently needs to address this issue.
Other than that, the Aero 14 left a very good overall impression. Despite its massive battery the aluminum case is compact and lightweight; apart from its non-standard keyboard layout the input devices, while clearly designed with gamers in mind (re: macro keys), are still decent enough even for office laptops; and there are more ports than we could wish for, including a USB-Ethernet adaptor already included in the box. Also, we have no complaints regarding its performance.
Its enormous battery and the resulting battery life are surely a unique feature of Gigabyte’s Aero 14 among its mobile-gaming laptop brethren. This, however, is overshadowed by the fan’s overly annoying high-frequency whining noise, which is why we simply cannot recommend this laptop.
Gigabyte Aero 14
- 06/30/2017 v6 (old)
Sven Kloevekorn
Price comparison
