Breve Análise do Portátil Gigabyte Aero 14K (i7-7700HQ, GTX 1050 Ti, QHD)
| SD Card Reader | |
| average JPG Copy Test (av. of 3 runs) | |
| Gigabyte Aero 14-K7 (Toshiba Exceria Pro SDXC 64 GB UHS-II)) | |
| Schenker XMG P407 (Toshiba Exceria Pro SDXC 64 GB UHS-II) | |
| Gigabyte Aero 14 (Toshiba Exceria Pro SDXC 64 GB UHS-II) | |
| MSI GS43VR 7RE-069US (Toshiba Exceria Pro SDXC 64 GB UHS-II) | |
| maximum AS SSD Seq Read Test (1GB) | |
| Gigabyte Aero 14-K7 (Toshiba Exceria Pro SDXC 64 GB UHS-II)) | |
| Schenker XMG P407 (Toshiba Exceria Pro SDXC 64 GB UHS-II) | |
| Gigabyte Aero 14 (Toshiba Exceria Pro SDXC 64 GB UHS-II) | |
| MSI GS43VR 7RE-069US (Toshiba Exceria Pro SDXC 64 GB UHS-II) | |
| Networking | |
| iperf3 transmit AX12 | |
| MSI GS43VR 7RE-069US | |
| Gigabyte Aero 14 | |
| Schenker XMG P407 | |
| Gigabyte Aero 14-K7 | |
| iperf3 receive AX12 | |
| Gigabyte Aero 14 | |
| Gigabyte Aero 14-K7 | |
| MSI GS43VR 7RE-069US | |
| Schenker XMG P407 | |
| |||||||||||||||||||||||||
iluminação: 84 %
iluminação com acumulador: 277 cd/m²
Contraste: 1026:1 (Preto: 0.27 cd/m²)
ΔE ColorChecker Calman: 4.26 | ∀{0.5-29.43 Ø4.71}
ΔE Greyscale Calman: 4.32 | ∀{0.09-98 Ø4.96}
91% sRGB (Argyll 1.6.3 3D)
59% AdobeRGB 1998 (Argyll 1.6.3 3D)
65.9% AdobeRGB 1998 (Argyll 3D)
91.2% sRGB (Argyll 3D)
65.1% Display P3 (Argyll 3D)
Gamma: 2.37
CCT: 7298 K
| Gigabyte Aero 14-K7 IPS, 2560x1440, 14" | Razer Blade (2017) IPS, 1920x1080, 14" | MSI GS43VR 7RE-069US IPS, 1920x1080, 14" | Schenker XMG P407 IPS, 1920x1080, 14" | Gigabyte Aero 14 IPS, 2560x1440, 14" | |
|---|---|---|---|---|---|
| Display | -3% | -7% | -0% | ||
| Display P3 Coverage (%) | 65.1 | 66.3 2% | 64.5 -1% | 64.4 -1% | |
| sRGB Coverage (%) | 91.2 | 85.9 -6% | 82.1 -10% | 91.8 1% | |
| AdobeRGB 1998 Coverage (%) | 65.9 | 62.8 -5% | 60 -9% | 65.5 -1% | |
| Response Times | 20% | 23% | -13% | -1% | |
| Response Time Grey 50% / Grey 80% * (ms) | 40 ? | 25.2 ? 37% | 31.6 ? 21% | 47 ? -18% | 41 ? -2% |
| Response Time Black / White * (ms) | 25.2 ? | 24.8 ? 2% | 19.2 ? 24% | 27 ? -7% | 25 ? 1% |
| PWM Frequency (Hz) | 130 ? | 21370 | 21190 ? | ||
| Screen | -1% | 8% | 0% | -3% | |
| Brightness middle (cd/m²) | 277 | 272 -2% | 306.6 11% | 298 8% | 290 5% |
| Brightness (cd/m²) | 252 | 277 10% | 291 15% | 282 12% | 257 2% |
| Brightness Distribution (%) | 84 | 84 0% | 86 2% | 80 -5% | 79 -6% |
| Black Level * (cd/m²) | 0.27 | 0.26 4% | 0.28 -4% | 0.27 -0% | 0.3 -11% |
| Contrast (:1) | 1026 | 1046 2% | 1095 7% | 1104 8% | 967 -6% |
| Colorchecker dE 2000 * | 4.26 | 4.59 -8% | 3.9 8% | 4.42 -4% | 4.59 -8% |
| Colorchecker dE 2000 max. * | 8.37 | 8.49 -1% | 9 -8% | 8.57 -2% | 8.68 -4% |
| Greyscale dE 2000 * | 4.32 | 4.28 1% | 2 54% | 4.11 5% | 4.32 -0% |
| Gamma | 2.37 93% | 2.23 99% | 2.14 103% | 2.5 88% | 2.25 98% |
| CCT | 7298 89% | 6848 95% | 6626 98% | 6329 103% | 7320 89% |
| Color Space (Percent of AdobeRGB 1998) (%) | 59 | 55 -7% | 56.1 -5% | 54 -8% | 59 0% |
| Color Space (Percent of sRGB) (%) | 91 | 83 -9% | 86.1 -5% | 82 -10% | 92 1% |
| Média Total (Programa/Configurações) | 10% /
2% | 9% /
7% | -7% /
-3% | -1% /
-2% |
* ... menor é melhor
Cintilação da tela / PWM (modulação por largura de pulso)
| Tela tremeluzindo/PWM detectado | 130 Hz | ≤ 95 % configuração de brilho | 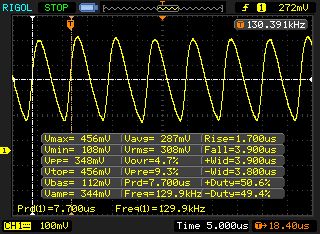 |
A luz de fundo da tela pisca em 130 Hz (pior caso, por exemplo, utilizando PWM) Cintilação detectada em uma configuração de brilho de 95 % e abaixo. Não deve haver cintilação ou PWM acima desta configuração de brilho. A frequência de 130 Hz é muito baixa, portanto a oscilação pode causar fadiga ocular e dores de cabeça após uso prolongado. [pwm_comparison] Em comparação: 52 % de todos os dispositivos testados não usam PWM para escurecer a tela. Se PWM foi detectado, uma média de 7744 (mínimo: 5 - máximo: 343500) Hz foi medida. | |||
Exibir tempos de resposta
| ↔ Tempo de resposta preto para branco | ||
|---|---|---|
| 25.2 ms ... ascensão ↗ e queda ↘ combinadas | ↗ 13.2 ms ascensão | 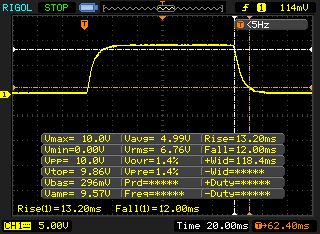 |
| ↘ 12 ms queda | ||
| A tela mostra taxas de resposta relativamente lentas em nossos testes e pode ser muito lenta para os jogadores. Em comparação, todos os dispositivos testados variam de 0.1 (mínimo) a 240 (máximo) ms. » 61 % de todos os dispositivos são melhores. Isso significa que o tempo de resposta medido é pior que a média de todos os dispositivos testados (19.8 ms). | ||
| ↔ Tempo de resposta 50% cinza a 80% cinza | ||
| 40 ms ... ascensão ↗ e queda ↘ combinadas | ↗ 19.6 ms ascensão | 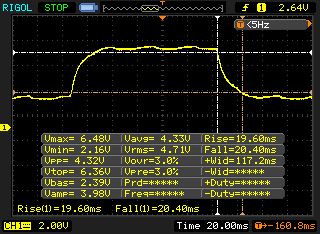 |
| ↘ 20.4 ms queda | ||
| A tela mostra taxas de resposta lentas em nossos testes e será insatisfatória para os jogadores. Em comparação, todos os dispositivos testados variam de 0.165 (mínimo) a 636 (máximo) ms. » 61 % de todos os dispositivos são melhores. Isso significa que o tempo de resposta medido é pior que a média de todos os dispositivos testados (30.9 ms). | ||
| Cinebench R15 | |
| CPU Single 64Bit | |
| Gigabyte Aero 14-K7 | |
| Gigabyte Aero 14 | |
| Razer Blade (2017) | |
| MSI GS43VR 7RE-069US | |
| Schenker XMG P407 | |
| CPU Multi 64Bit | |
| Gigabyte Aero 14-K7 | |
| Schenker XMG P407 | |
| MSI GS43VR 7RE-069US | |
| Gigabyte Aero 14 | |
| Razer Blade (2017) | |
| Cinebench R11.5 | |
| CPU Multi 64Bit | |
| Gigabyte Aero 14-K7 | |
| MSI GS43VR 7RE-069US | |
| Schenker XMG P407 | |
| CPU Single 64Bit | |
| MSI GS43VR 7RE-069US | |
| Gigabyte Aero 14-K7 | |
| Schenker XMG P407 | |
| Cinebench R10 | |
| Rendering Multiple CPUs 32Bit | |
| Gigabyte Aero 14-K7 | |
| MSI GS43VR 7RE-069US | |
| Schenker XMG P407 | |
| Rendering Single 32Bit | |
| Gigabyte Aero 14-K7 | |
| MSI GS43VR 7RE-069US | |
| Schenker XMG P407 | |
| Geekbench 3 | |
| 32 Bit Multi-Core Score | |
| Gigabyte Aero 14-K7 | |
| Schenker XMG P407 | |
| 32 Bit Single-Core Score | |
| Gigabyte Aero 14-K7 | |
| Schenker XMG P407 | |
| Geekbench 4.0 | |
| 64 Bit Multi-Core Score | |
| Gigabyte Aero 14-K7 | |
| Schenker XMG P407 | |
| 64 Bit Single-Core Score | |
| Gigabyte Aero 14-K7 | |
| Schenker XMG P407 | |
| Geekbench 4.4 | |
| 64 Bit Multi-Core Score | |
| Gigabyte Aero 14-K7 | |
| 64 Bit Single-Core Score | |
| Gigabyte Aero 14-K7 | |
| JetStream 1.1 - 1.1 Total | |
| Gigabyte Aero 14-K7 | |
| Schenker XMG P407 | |
| MSI GS43VR 7RE-069US | |
| PCMark 7 Score | 6103 pontos | |
| PCMark 8 Home Score Accelerated v2 | 3962 pontos | |
| PCMark 8 Creative Score Accelerated v2 | 5282 pontos | |
| PCMark 8 Work Score Accelerated v2 | 4822 pontos | |
| PCMark 10 Score | 4339 pontos | |
Ajuda | ||
| PCMark 8 | |
| Home Score Accelerated v2 | |
| Schenker XMG P407 | |
| Gigabyte Aero 14-K7 | |
| Razer Blade (2017) | |
| MSI GS43VR 7RE-069US | |
| Gigabyte Aero 14 | |
| Work Score Accelerated v2 | |
| Schenker XMG P407 | |
| Razer Blade (2017) | |
| Gigabyte Aero 14-K7 | |
| Gigabyte Aero 14 | |
| MSI GS43VR 7RE-069US | |

| Gigabyte Aero 14-K7 Samsung SM961 MZVPW256HEGL | Razer Blade (2017) Samsung PM951 NVMe MZVLV256 | Schenker XMG P407 Samsung SM961 MZVPW256 m.2 PCI-e | Gigabyte Aero 14 LiteOn CX2-8B256 | |
|---|---|---|---|---|
| CrystalDiskMark 3.0 | -29% | -3% | -2% | |
| Read Seq (MB/s) | 1971 | 1122 -43% | 1345 -32% | 1584 -20% |
| Write Seq (MB/s) | 1541 | 311 -80% | 1502 -3% | 795 -48% |
| Read 512 (MB/s) | 432.6 | 682 58% | 320.3 -26% | 985 128% |
| Write 512 (MB/s) | 1283 | 310 -76% | 1276 -1% | 814 -37% |
| Read 4k (MB/s) | 55.4 | 34.8 -37% | 58.9 6% | 44.93 -19% |
| Write 4k (MB/s) | 141.7 | 134.3 -5% | 171 21% | 131.2 -7% |
| Read 4k QD32 (MB/s) | 603 | 565 -6% | 625 4% | 602 0% |
| Write 4k QD32 (MB/s) | 513 | 308 -40% | 539 5% | 441 -14% |
| 3DMark 06 Standard Score | 27789 pontos | |
| 3DMark 11 Performance | 9524 pontos | |
| 3DMark Ice Storm Standard Score | 116034 pontos | |
| 3DMark Cloud Gate Standard Score | 22642 pontos | |
| 3DMark Fire Strike Score | 6667 pontos | |
| 3DMark Fire Strike Extreme Score | 3516 pontos | |
| 3DMark Time Spy Score | 2484 pontos | |
Ajuda | ||
| 3DMark 11 - 1280x720 Performance GPU | |
| MSI GS43VR 7RE-069US | |
| Gigabyte Aero 14 | |
| Razer Blade (2017) | |
| Schenker XMG P407 | |
| Gigabyte Aero 14-K7 | |
| 3DMark - 1920x1080 Fire Strike Graphics | |
| MSI GS43VR 7RE-069US | |
| Gigabyte Aero 14 | |
| Razer Blade (2017) | |
| Schenker XMG P407 | |
| Gigabyte Aero 14-K7 | |
| BioShock Infinite - 1920x1080 Ultra Preset, DX11 (DDOF) | |
| MSI GS43VR 7RE-069US | |
| Schenker XMG P407 | |
| Gigabyte Aero 14-K7 | |
| Acer Nitro 5 AN515-51-788E | |
| The Witcher 3 - 1920x1080 High Graphics & Postprocessing (Nvidia HairWorks Off) | |
| MSI GS43VR 7RE-069US | |
| Razer Blade (2017) | |
| Acer Nitro 5 AN515-51-788E | |
| Gigabyte Aero 14-K7 | |
| Prey - 1920x1080 Very High Preset AA:2TX SM AF:16x | |
| MSI GS43VR 7RE-069US | |
| Gigabyte Aero 14-K7 | |
| Acer Nitro 5 AN515-51-788E | |
| F1 2017 - 1920x1080 Ultra High Preset AA:T AF:16x | |
| Acer Nitro 5 AN515-51-788E | |
| Gigabyte Aero 14-K7 | |
| baixo | média | alto | ultra | |
|---|---|---|---|---|
| Tomb Raider (2013) | 439.9 | 304.3 | 202.2 | 90.7 |
| BioShock Infinite (2013) | 267.7 | 207.7 | 188.5 | 74.4 |
| The Witcher 3 (2015) | 141 | 82.8 | 45.7 | 26.1 |
| Prey (2017) | 142.4 | 101.9 | 80.7 | 67.7 |
| F1 2017 (2017) | 184 | 90 | 70 | 44 |
| FIFA 18 (2017) | 293 | 232.4 | 188.6 | 156.8 |
Barulho
| Ocioso |
| 32 / 33 / 38 dB |
| Carga |
| 46 / 53 dB |
 | ||
30 dB silencioso 40 dB(A) audível 50 dB(A) ruidosamente alto |
||
min: | ||
| Gigabyte Aero 14-K7 i7-7700HQ, GeForce GTX 1050 Ti Mobile | Razer Blade (2017) i7-7700HQ, GeForce GTX 1060 Mobile | MSI GS43VR 7RE-069US i7-7700HQ, GeForce GTX 1060 Mobile | Schenker XMG P407 i7-7700HQ, GeForce GTX 1050 Ti Mobile | Gigabyte Aero 14 i7-7700HQ, GeForce GTX 1060 Mobile | |
|---|---|---|---|---|---|
| Noise | 6% | -5% | 5% | 4% | |
| desligado / ambiente * (dB) | 30 | 28 7% | 29 3% | 31 -3% | |
| Idle Minimum * (dB) | 32 | 30 6% | 33 -3% | 31 3% | 31 3% |
| Idle Average * (dB) | 33 | 30 9% | 34.5 -5% | 32 3% | 32 3% |
| Idle Maximum * (dB) | 38 | 30 21% | 35 8% | 36 5% | 33 13% |
| Load Average * (dB) | 46 | 51 -11% | 54.2 -18% | 43 7% | 42 9% |
| Witcher 3 ultra * (dB) | 46 | 56.7 -23% | 45 2% | ||
| Load Maximum * (dB) | 53 | 51 4% | 54.2 -2% | 48 9% | 53 -0% |
* ... menor é melhor
(-) A temperatura máxima no lado superior é 51 °C / 124 F, em comparação com a média de 36.8 °C / 98 F , variando de 21 a 71 °C para a classe Multimedia.
(-) A parte inferior aquece até um máximo de 58 °C / 136 F, em comparação com a média de 39.1 °C / 102 F
(+) Em uso inativo, a temperatura média para o lado superior é 23.8 °C / 75 F, em comparação com a média do dispositivo de 31.3 °C / ### class_avg_f### F.
(-) Jogando The Witcher 3, a temperatura média para o lado superior é 40 °C / 104 F, em comparação com a média do dispositivo de 31.3 °C / ## #class_avg_f### F.
(+) Os apoios para as mãos e o touchpad estão atingindo a temperatura máxima da pele (35 °C / 95 F) e, portanto, não estão quentes.
(-) A temperatura média da área do apoio para as mãos de dispositivos semelhantes foi 28.7 °C / 83.7 F (-6.3 °C / -11.3 F).
| Gigabyte Aero 14-K7 i7-7700HQ, GeForce GTX 1050 Ti Mobile | MSI GS43VR 7RE-069US i7-7700HQ, GeForce GTX 1060 Mobile | Schenker XMG P407 i7-7700HQ, GeForce GTX 1050 Ti Mobile | Gigabyte Aero 14 i7-7700HQ, GeForce GTX 1060 Mobile | |
|---|---|---|---|---|
| Heat | -15% | 3% | -2% | |
| Maximum Upper Side * (°C) | 51 | 47.8 6% | 49 4% | 58.3 -14% |
| Maximum Bottom * (°C) | 58 | 63.2 -9% | 50.8 12% | 59.8 -3% |
| Idle Upper Side * (°C) | 24 | 29.8 -24% | 26.3 -10% | 23.3 3% |
| Idle Bottom * (°C) | 25 | 33.2 -33% | 24.1 4% | 23.8 5% |
* ... menor é melhor
Gigabyte Aero 14-K7 análise de áudio
(±) | o volume do alto-falante é médio, mas bom (###valor### dB)
Graves 100 - 315Hz
(±) | graves reduzidos - em média 10.5% menor que a mediana
(±) | a linearidade dos graves é média (13% delta para a frequência anterior)
Médios 400 - 2.000 Hz
(+) | médios equilibrados - apenas 4.7% longe da mediana
(±) | a linearidade dos médios é média (9.9% delta para frequência anterior)
Altos 2 - 16 kHz
(+) | agudos equilibrados - apenas 1.7% longe da mediana
(+) | os máximos são lineares (4.1% delta da frequência anterior)
Geral 100 - 16.000 Hz
(+) | o som geral é linear (14.1% diferença em relação à mediana)
Comparado com a mesma classe
» 32% de todos os dispositivos testados nesta classe foram melhores, 4% semelhantes, 64% piores
» O melhor teve um delta de 5%, a média foi 17%, o pior foi 45%
Comparado com todos os dispositivos testados
» 17% de todos os dispositivos testados foram melhores, 4% semelhantes, 79% piores
» O melhor teve um delta de 4%, a média foi 23%, o pior foi 134%
MSI GS43VR 7RE-069US análise de áudio
(±) | o volume do alto-falante é médio, mas bom (###valor### dB)
Graves 100 - 315Hz
(-) | quase nenhum baixo - em média 21.9% menor que a mediana
(±) | a linearidade dos graves é média (7.2% delta para a frequência anterior)
Médios 400 - 2.000 Hz
(+) | médios equilibrados - apenas 3.5% longe da mediana
(±) | a linearidade dos médios é média (7.6% delta para frequência anterior)
Altos 2 - 16 kHz
(±) | máximos mais altos - em média 5.7% maior que a mediana
(±) | a linearidade dos máximos é média (11% delta para frequência anterior)
Geral 100 - 16.000 Hz
(±) | a linearidade do som geral é média (27.5% diferença em relação à mediana)
Comparado com a mesma classe
» 93% de todos os dispositivos testados nesta classe foram melhores, 1% semelhantes, 5% piores
» O melhor teve um delta de 6%, a média foi 18%, o pior foi 132%
Comparado com todos os dispositivos testados
» 84% de todos os dispositivos testados foram melhores, 3% semelhantes, 13% piores
» O melhor teve um delta de 4%, a média foi 23%, o pior foi 134%
| desligado | |
| Ocioso | |
| Carga |
|
Key:
min: | |
| Gigabyte Aero 14-K7 i7-7700HQ, GeForce GTX 1050 Ti Mobile | Razer Blade (2017) i7-7700HQ, GeForce GTX 1060 Mobile | MSI GS43VR 7RE-069US i7-7700HQ, GeForce GTX 1060 Mobile | Schenker XMG P407 i7-7700HQ, GeForce GTX 1050 Ti Mobile | Gigabyte Aero 14 i7-7700HQ, GeForce GTX 1060 Mobile | |
|---|---|---|---|---|---|
| Power Consumption | 13% | 4% | -5% | 1% | |
| Idle Minimum * (Watt) | 9 | 7.5 17% | 9.1 -1% | 10 -11% | 8 11% |
| Idle Average * (Watt) | 14 | 12.1 14% | 11.9 15% | 15 -7% | 13 7% |
| Idle Maximum * (Watt) | 19 | 14.3 25% | 12.2 36% | 24 -26% | 20 -5% |
| Load Average * (Watt) | 84 | 73.5 12% | 77 8% | 82 2% | 78 7% |
| Witcher 3 ultra * (Watt) | 95 | 108 -14% | 126.4 -33% | 110 -16% | |
| Load Maximum * (Watt) | 149 | 110.2 26% | 153 -3% | 124 17% | 146 2% |
* ... menor é melhor
| Gigabyte Aero 14-K7 i7-7700HQ, GeForce GTX 1050 Ti Mobile, 94.24 Wh | Razer Blade (2017) i7-7700HQ, GeForce GTX 1060 Mobile, 70 Wh | MSI GS43VR 7RE-069US i7-7700HQ, GeForce GTX 1060 Mobile, 61 Wh | Schenker XMG P407 i7-7700HQ, GeForce GTX 1050 Ti Mobile, 45 Wh | Gigabyte Aero 14 i7-7700HQ, GeForce GTX 1060 Mobile, 94 Wh | |
|---|---|---|---|---|---|
| Duração da bateria | 2% | -52% | -50% | -5% | |
| Reader / Idle (h) | 15.9 | 9 -43% | 7.4 -53% | 15.2 -4% | |
| H.264 (h) | 7.8 | 3.6 -54% | |||
| WiFi v1.3 (h) | 8.9 | 9.1 2% | 2.9 -67% | 4 -55% | 8.7 -2% |
| Load (h) | 2.4 | 1.3 -46% | 1.5 -37% | 2.2 -8% |
Pro
Contra
O gamer compacto da Gigabyte pode mostrar todos os jogos de computador atuais em sua tela QHD mate, mas os compradores terão que renunciar às configurações máximas de qualidade. O núcleo de gráfico GeForce GTX 1050 Ti oferece muito pouco desempenho para isso.
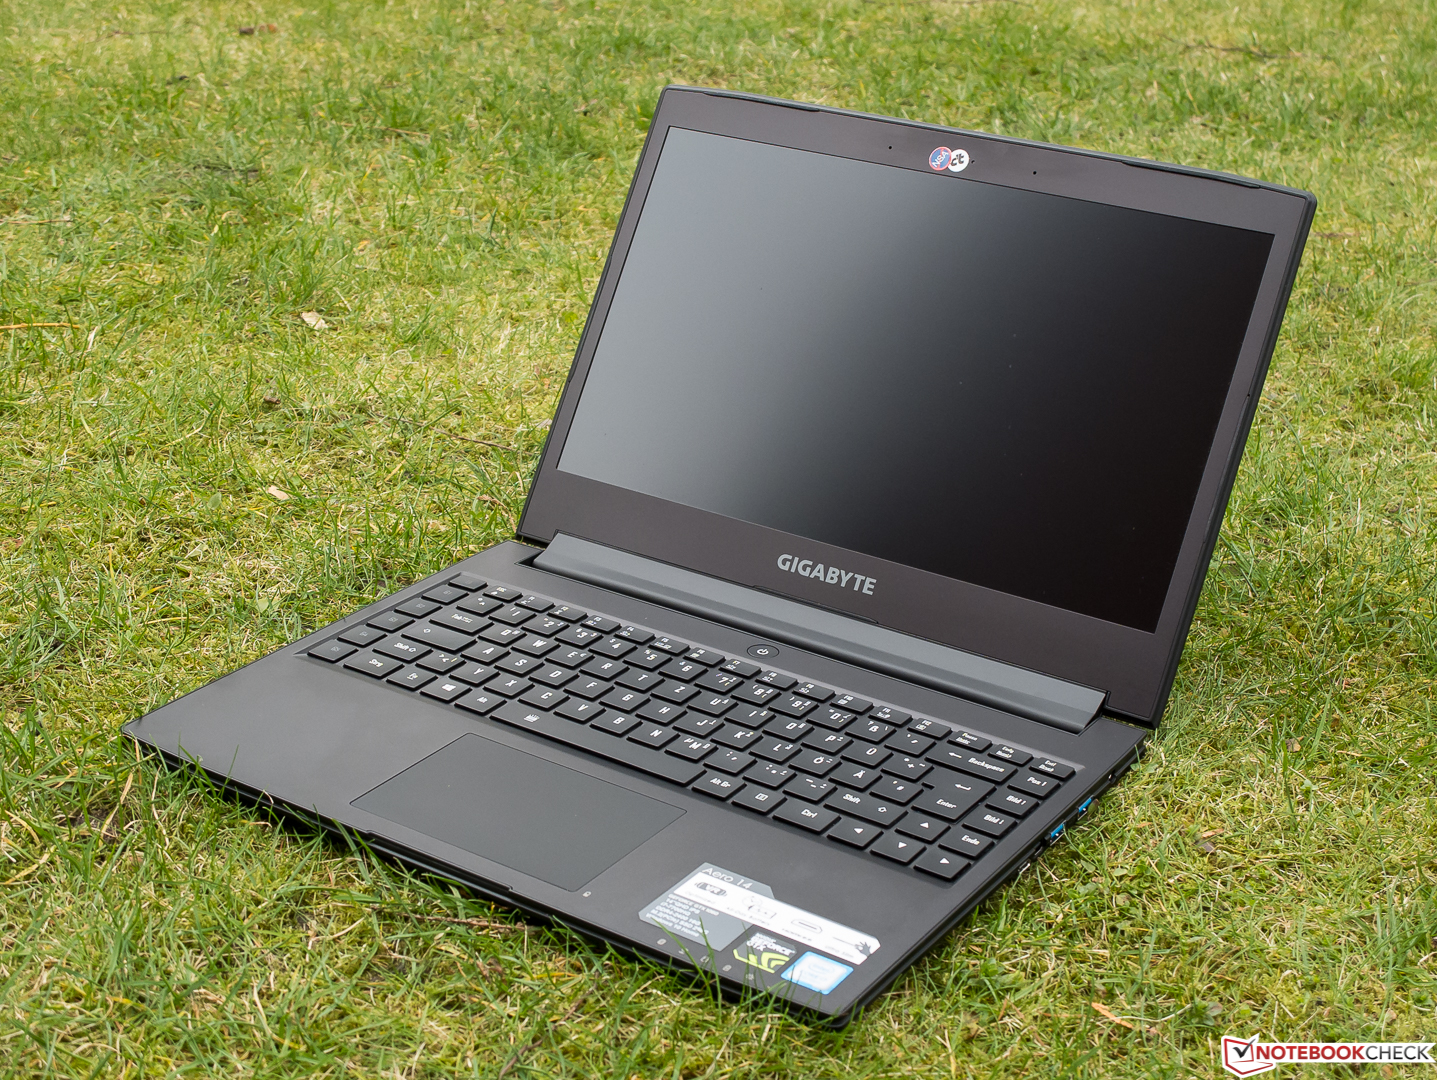
O aparelho de 14 polegadas da Gigabyte combina alto poder de processamento com longos tempos de duração da bateria.
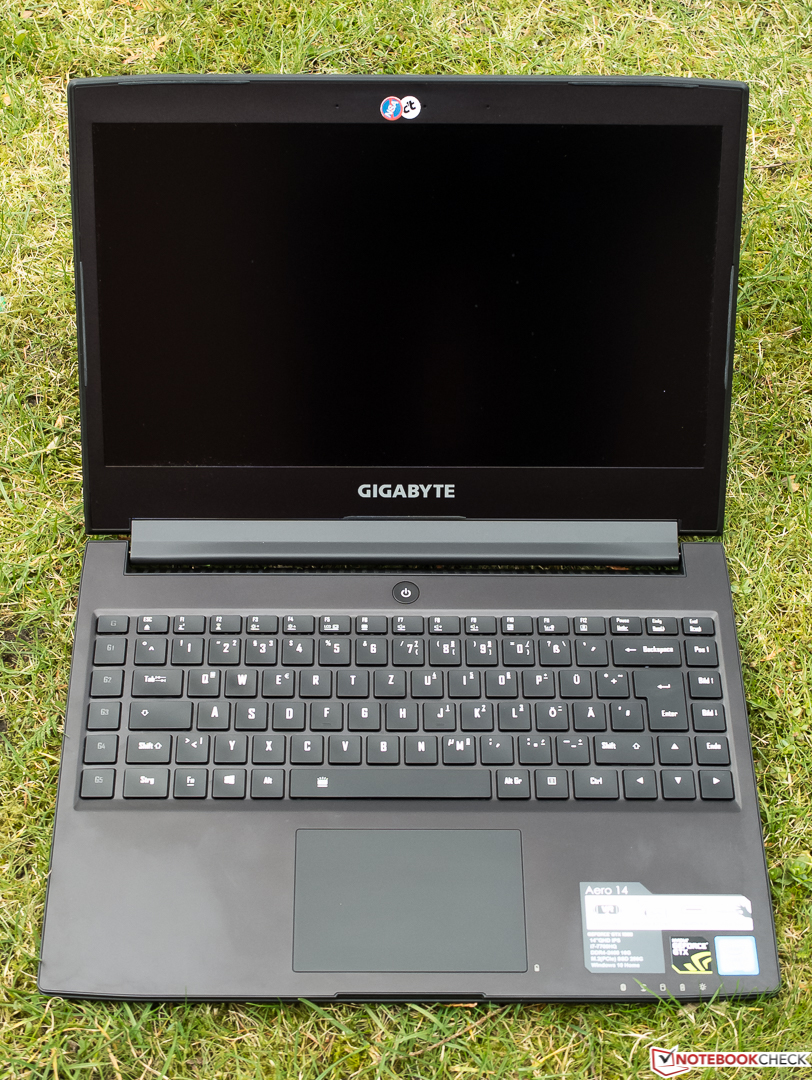
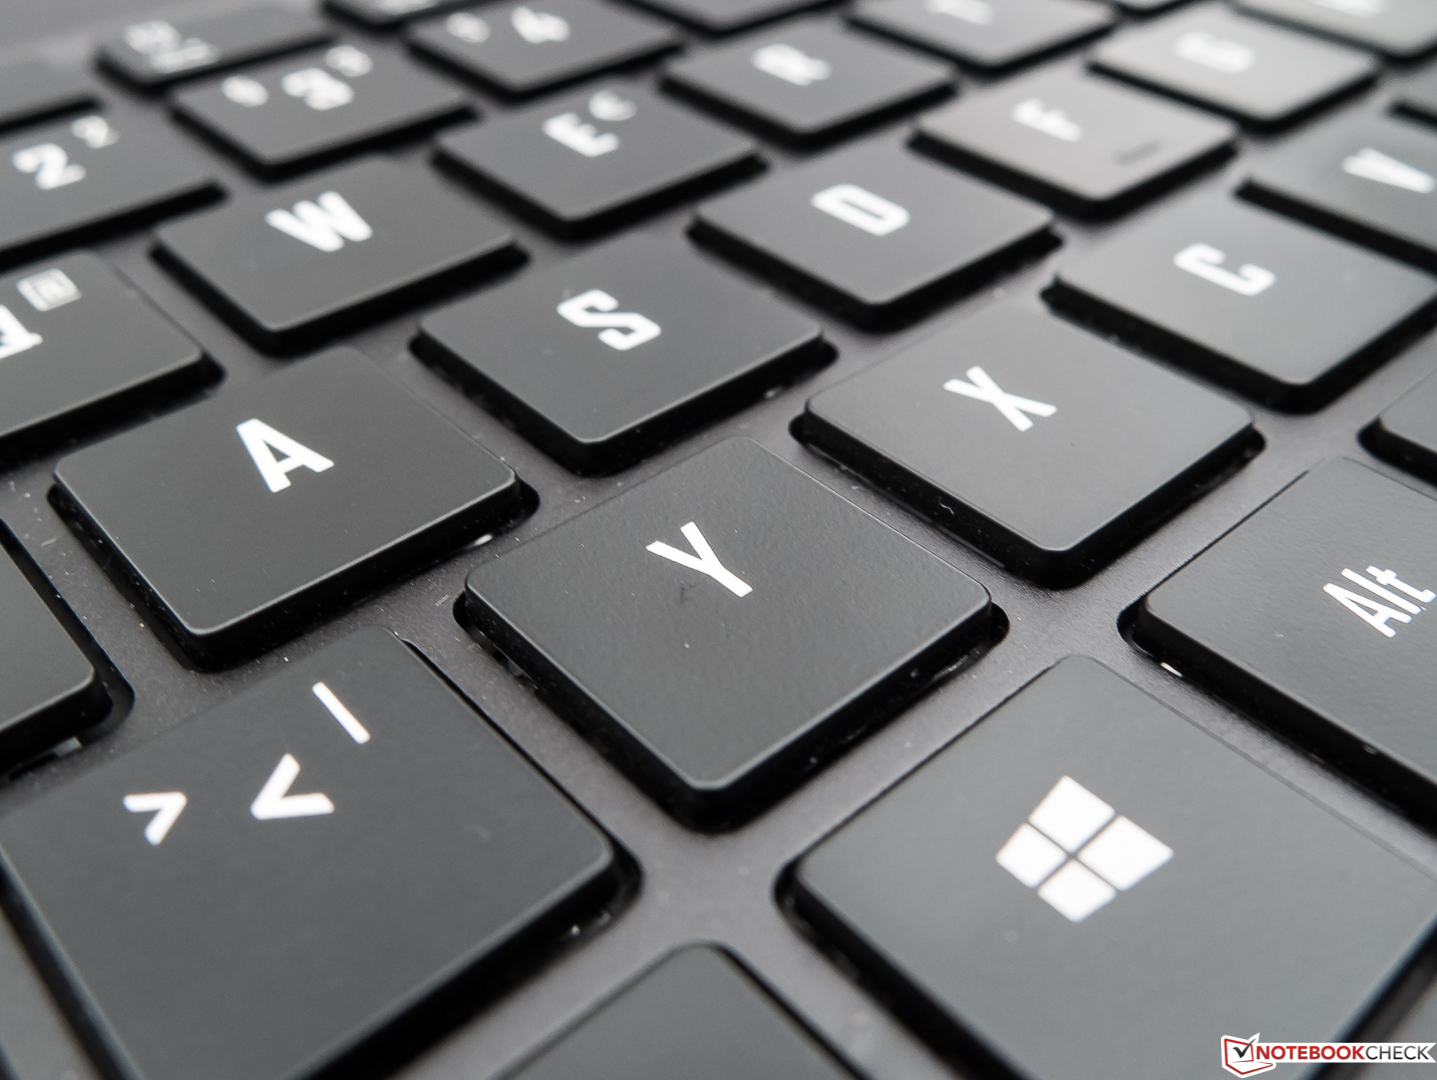
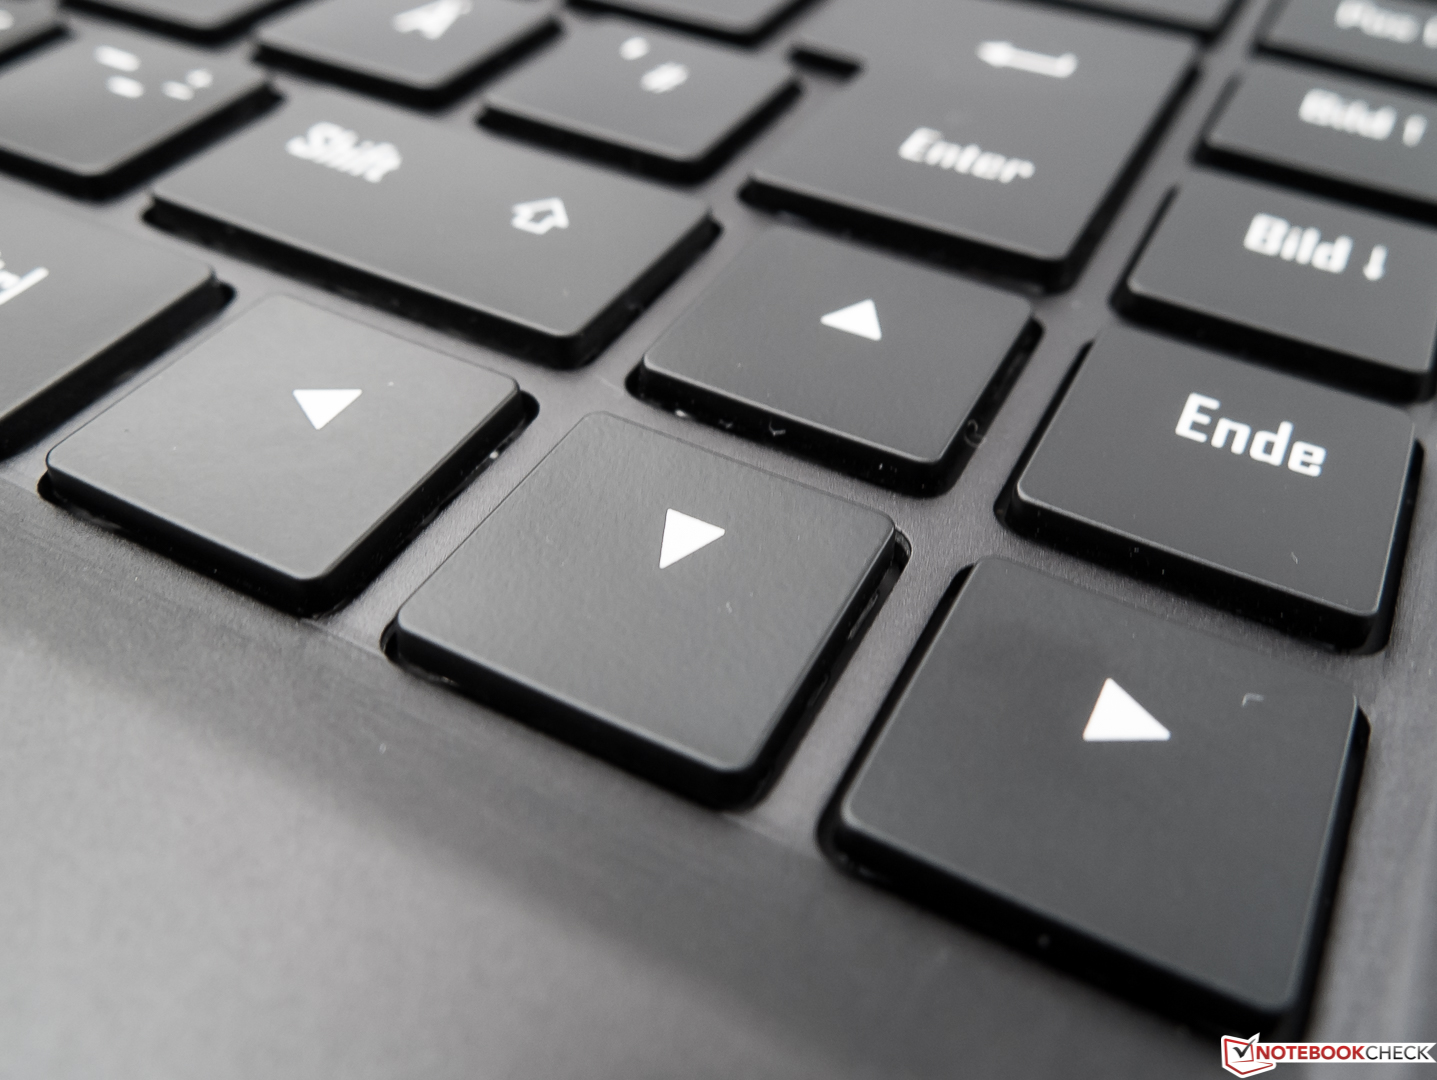
O Aero também fez um bom trabalho como um aparelho de escritório: O aparelho possui um teclado muito bom e funciona silenciosamente. E também oferece uso móvel: Graças à bateria bem dimensionada, o dispositivo possui ótimos tempos de duração da bateria, o que coloca alguns portáteis de escritório em vergonha.
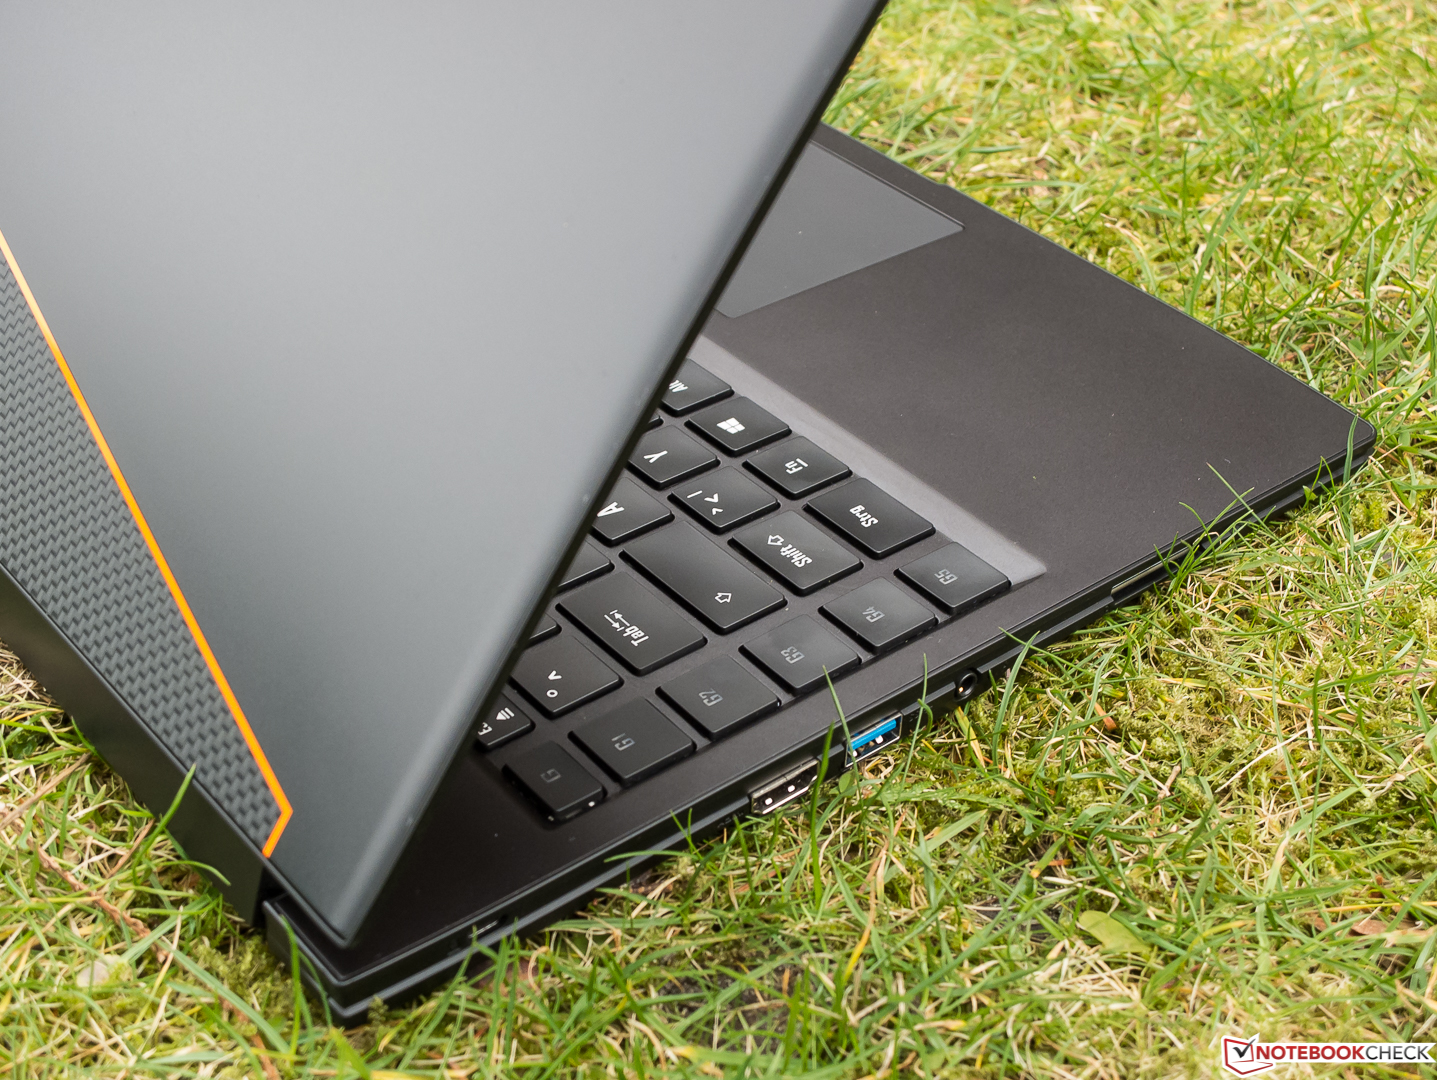
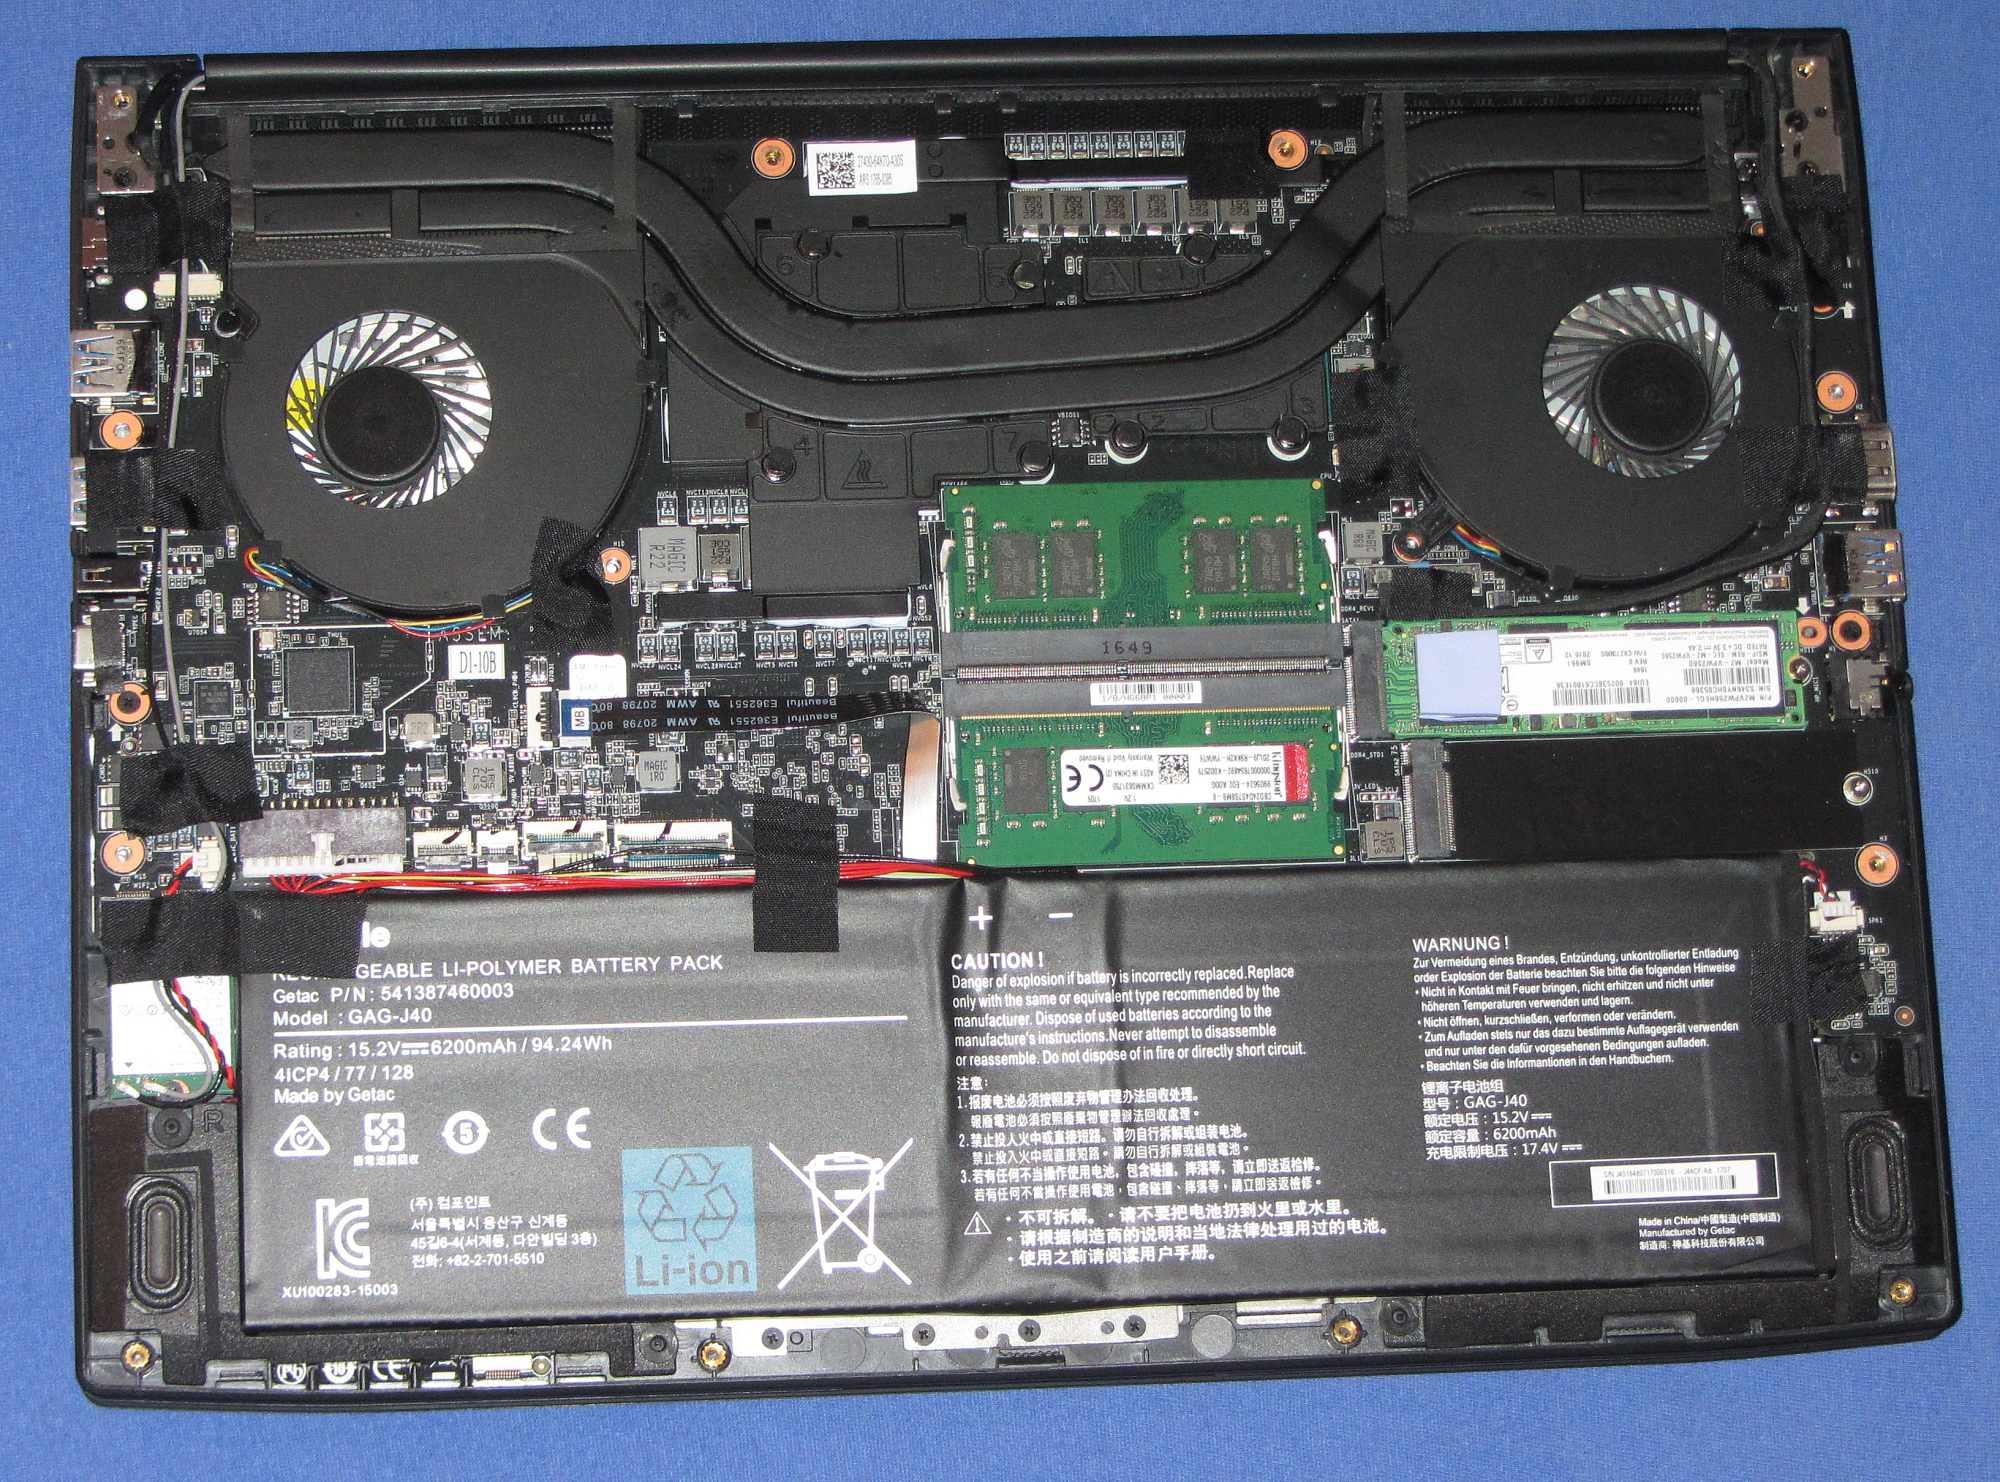
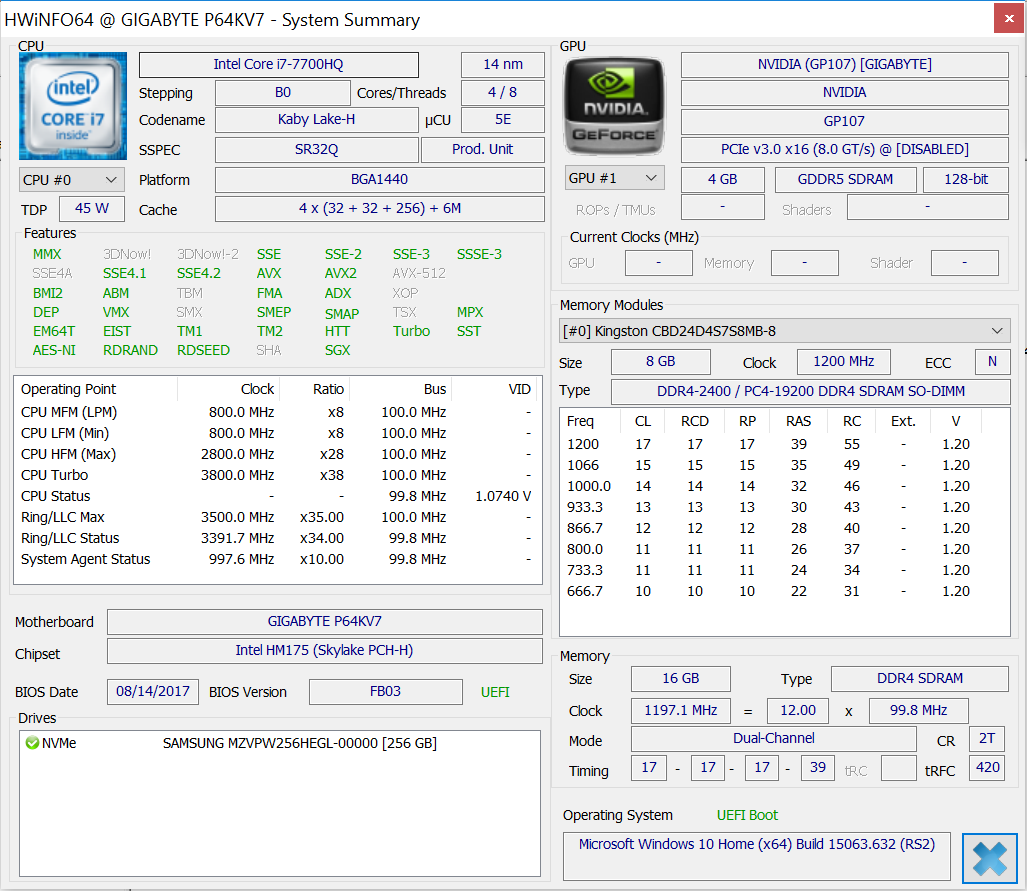
O veloz SSD NVMe garante um sistema veloz. Seria possível trocar o SSD, e este não oferece muito espaço para um gamer com sua capacidade de 256 GB. Também há um slot para instalar um segundo SSD M.2. A tela QHD mate agrada com ângulos de visão estáveis e um contraste bom. Infelizmente, o brilho da tela é bastante baixo para um portátil desta faixa de preços.
Gigabyte Aero 14-K7
- 10/12/2017 v6 (old)
Sascha Mölck