Notebookcheck Logo

Análise do laptop Gigabyte Aero 14 OLED BMF: Notebook de estúdio compacto com tela true color
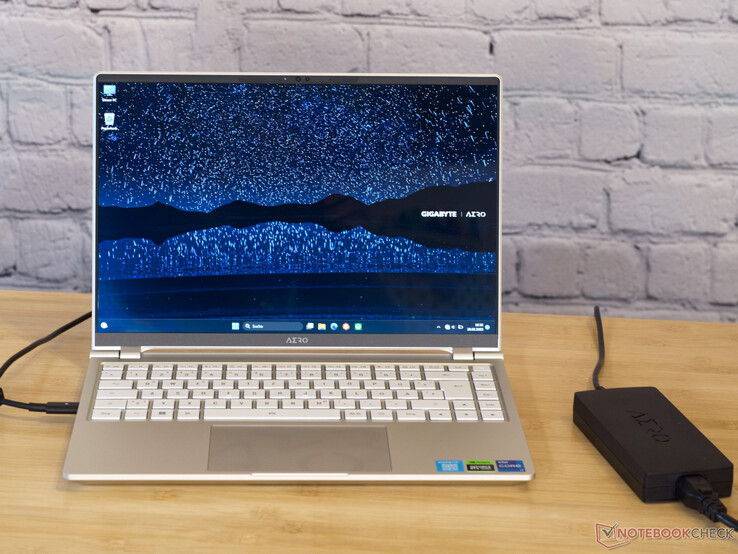
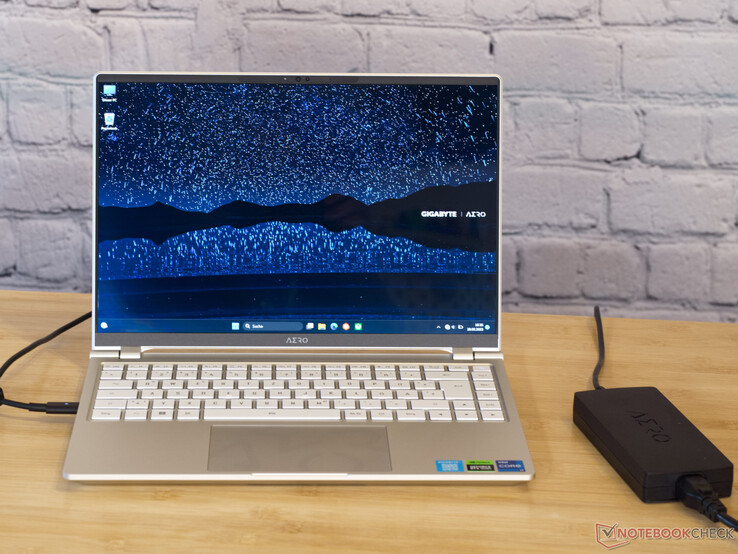
Rápido e fabuloso. Para um notebook de 14 polegadas, o Gigabyte Aero 14 OLED BMF tem muito a oferecer. A tela potente já está incluída no nome. Com um Core i7 e uma Nvidia RTX 4050, o bom desempenho é garantido. Mas os componentes internos não são o único ponto de venda do notebook de 14 polegadas, que também oferece um teclado impressionante com um deslocamento decente.
Gigabyte Aero 14 OLED BMF

A Gigabyte não atende apenas aos gamers com hardware de alto desempenho, pois o fabricante taiwanês também projeta sua marca Aero para uso no campo criativo. Há placas-mãe e placas de vídeo, bem como notebooks com muito desempenho sem RGB ou um design excessivamente agressivo. O Gigabyte Aero 14 é o menor representante da série de laptops. Mas o tamanho nem sempre é a única coisa que importa. O pequeno Aero 14 OLED BMF contém umIntel Core i7-13700H e uma placa Nvidia GeForce RTX 4050há também 16 GB de RAM e um SSD NVMe com 1 TB de espaço de armazenamento. Um painel OLED de alta resolução da Samsung é usado como tela. Uma bateria de 63 Wh garante um bom tempo de execução longe da tomada. Tudo isso está alojado em um chassi fino de alumínio.

Assim, o notebook é um companheiro pequeno, portátil e poderoso para mentes criativas. Mas o Aero 14 não está sozinho entre os modelos de 14 polegadas: a concorrência é forte e frequentemente oferece seus próprios recursos interessantes. OSchenker Vision 14tem uma enorme bateria de 99 Wh. O Asus Zephyrus G14vem com processadores AMD e um processador RTX 3060. A RTX 4090 da variante Zephyrus G14também pode ser interessante. O Acer Swift X 14 também oferece desempenho razoável para usuários preocupados com o preço. As análises do MSI Stealth 14 Studio e do Lenovo Yoga Pro 7estão atualmente em andamento.

Gigabyte Aero 14 OLED BMF (Aero 14 Serie)
Processador
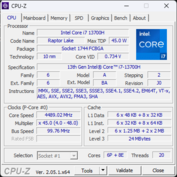
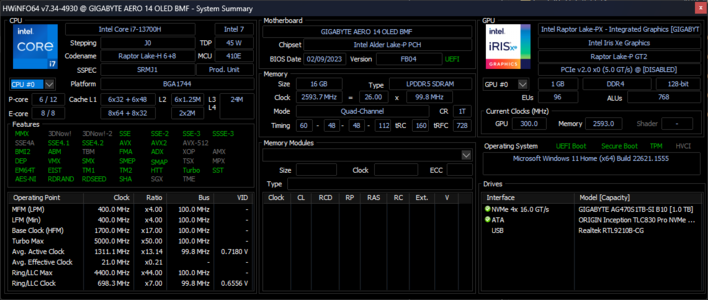
Intel Core i7-13700H 14 x 1.8 - 5 GHz, 70 W PL2 / Short Burst, 40 W PL1 / Sustained, Raptor Lake-H
Placa gráfica
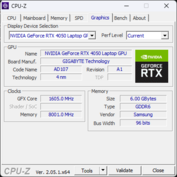
NVIDIA GeForce RTX 4050 Laptop GPU - 6 GB VRAM, 35 W TDP, Intel Iris Xe 96 EUs
Memória
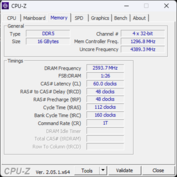
16 GB 
, DDR5, soldered
Pantalha
14.00 polegadas 16:10, 2880 x 1800 pixel 243 PPI, Samsung SDC4192 (ATNA40YK14-0), OLED, Brilhante: sim, HDR, 90 Hz
placa mãe
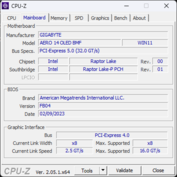
Intel Alder Lake-P PCH
Disco rígido
Gigabyte AG470S1TB-SI B10, 1024 GB 
, 820 GB livre
Placa de Som
Intel Raptor Lake-P/U/H PCH - cAVS
Conexões
2 USB 3.0, 2 USB 3.2 Gen 2x2 20Gbps, 2 Thunderbolt, 1 HDMI, 2 DisplayPort, Conexões Audio: 3.5 mm headset audio jack , Card Reader: microSD reader
Funcionamento em rede
Intel Wi-Fi 6E AX210 (a/b/g/h/n = Wi-Fi 4/ac = Wi-Fi 5/ax = Wi-Fi 6/), Bluetooth 5.2
Tamanho
altura x largura x profundidade (em mm): 17 x 311 x 220.8
Bateria
63 Wh Lítio-Polímero
Sistema Operativo
Microsoft Windows 11 Pro
Camera
Webcam: FHD (1080p) for Windows Hello
Primary Camera: 2.1 MPix
Características adicionais
Alto falantes: 2x 2W Speaker, Teclado: Chiclet, Iluminação do Teclado: sim, Microfibre cloth, 24 Meses Garantia
peso
1.408 kg, Suprimento de energia: 557 g
Preço
1997 Euro
Note: The manufacturer may use components from different suppliers including display panels, drives or memory sticks with similar specifications.


Potenziali concorrenti a confronto

Rating
Date
Model
Weight
Height
Size
Resolution
Best Price
89.4 %
05/2023
Gigabyte Aero 14 OLED BMF
i7-13700H, NVIDIA GeForce RTX 4050 Laptop GPU
1.4 kg17 mm14.00"2880x1800
88.8 %
10/2022
SCHENKER Vision 14 2022 RTX 3050 Ti
i7-12700H, GeForce RTX 3050 Ti Laptop GPU
1.3 kg16.6 mm14.00"2880x1800
85.4 %
07/2023
MSI Stealth 14 Studio A13V
i7-13700H, NVIDIA GeForce RTX 4050 Laptop GPU
1.7 kg19 mm14.00"2560x1600
90.2 %
05/2023
Lenovo Yoga Pro 7 14IRH G8
i7-13700H, NVIDIA GeForce RTX 4050 Laptop GPU
1.5 kg15.6 mm14.50"3072x1920
83.5 %
06/2021
Asus Zephyrus G14 GA401QM
R9 5900HS, GeForce RTX 3060 Laptop GPU
1.7 kg19.9 mm14.00"1920x1080
86 %
11/2022
Acer Predator Triton 300 SE
i9-12900H, GeForce RTX 3060 Laptop GPU
1.7 kg19.8 mm14.00"2880x1800
85.9 %
11/2022
Acer Swift X SFX14-51G-5876
i5-1240P, GeForce RTX 3050 4GB Laptop GPU
1.4 kg18.3 mm14.00"2240x1400

Estojo - Alumínio resistente

Todas as principais superfícies do notebook são feitas de alumínio. Isso faz com que o dispositivo inteiro pareça robusto e de alta qualidade sem ser muito pesado. O design do notebook é simples à primeira vista, mas tem muitos elementos de design pequenos que deixam o laptop mais solto sem serem intrusivos. Por exemplo, a Gigabyte coloca pequenos logotipos nas dobradiças da tela ou oculta as letras AΣRO no touchpad. Somente as letras iluminadas na tampa da tela realmente chamam a atenção.

As bordas estreitas da tela proporcionam uma tela quase sem bordas. Um pequeno ponto de crítica são as dobradiças da tela: embora elas funcionem sem problemas e sempre mantenham a tela na posição, o ângulo máximo de abertura da tela é de apenas 126°. Isso significa que, às vezes, o ângulo de visão da tela fica bastante inclinado quando se usa o laptop pequeno no colo.

Gigabyte Aero 14 OLED BMF

Com apenas 1,4 kg, o Gigabyte Aero 14 é mais leve do que a maioria de seus rivais; somente o Schenker Visionpesa 100 gramas a menos. Com uma diferença de poucos milímetros, todos os laptops estão bem abaixo da marca de dois centímetros em termos de espessura. Aqui, também, o Schenker Vision é o dispositivo mais fino no campo de comparação, seguido de perto pelo nosso dispositivo de teste.

Confronto delle dimensioni

324 mm 222 mm 19.9 mm 1.7 kg326 mm 227 mm 15.6 mm 1.5 kg315 mm 246.6 mm 19 mm 1.7 kg313.4 mm 227 mm 19.8 mm 1.7 kg312.9 mm 214 mm 18.3 mm 1.4 kg311 mm 220.8 mm 17 mm 1.4 kg308.8 mm 215 mm 16.6 mm 1.3 kg297 mm 210 mm 1 mm 5.7 g

Equipamento - Thunderbolt 4 sem PowerDelivery

A Gigabyte distribui uma grande variedade de portas em três lados do pequeno notebook. O USB Type-C à esquerda e à direita, bem como o USB Type-A e o HDMI na parte traseira devem permitir um bom gerenciamento de cabos. No entanto, um olhar mais atento revela que a porta USB-C à esquerda é rotulada como DCIN, que não suporta Thunderbolt nem DisplayPort e só pode ser usada para a fonte de alimentação, além da funcionalidade USB. Em nossos testes, foram experimentadas fontes de alimentação e cabos USB-C PD de diferentes fabricantes e classes de desempenho. Infelizmente, o notebook só aceitou energia por meio do adaptador de energia fornecido. Também não foi possível conectar uma estação de acoplamento entre o adaptador de alimentação e o notebook. Os soquetes USB-C à direita suportam Thunderbolt 4 e DisplayPort, mas não têm USB Power Delivery. Portanto, uma solução de plugue único para a mesa com estação de acoplamento e monitor externo não é possível aqui.

2x USB-C com Thunderbolt 4 e DisplayPort
USB-C com entrada de energia; leitor de cartão microSD; conector de áudio de 3,5 mm
HDMI 2.1; USB 3.2 Gen 1

Leitor de cartão SD

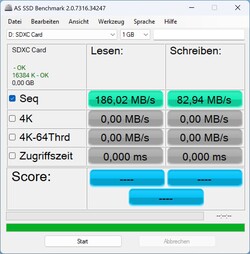
O leitor de cartão microSD no Gigabyte Aero 14 não utiliza totalmente as velocidades de transferência possíveis do nosso microSD AV PRO de 128 GB, mas as velocidades de leitura e gravação alcançadas são excepcionalmente boas. O leitor de cartão é capaz de transferir mais de 180 MB/s.

Dos dispositivos concorrentes, apenas o Schenker Vision tem um leitor de cartão SD. Entretanto, ele é consideravelmente mais lento do que o do nosso dispositivo de teste.

SD Card Reader
average JPG Copy Test (av. of 3 runs)
Gigabyte Aero 14 OLED BMF
Intel Core i7-13700H
177.9 (155.77min - 183.27max) MB/s
Average of class Multimedia
  (17.6 - 205, n=66, last 2 years)
93.3 MB/s -48%
SCHENKER Vision 14 2022 RTX 3050 Ti
Intel Core i7-12700H
57.8 MB/s -68%
maximum AS SSD Seq Read Test (1GB)
Gigabyte Aero 14 OLED BMF
Intel Core i7-13700H
186.02 MB/s
Average of class Multimedia
  (16.8 - 266, n=62, last 2 years)
122.6 MB/s -34%
SCHENKER Vision 14 2022 RTX 3050 Ti
Intel Core i7-12700H
80.5 MB/s -57%

Comunicação

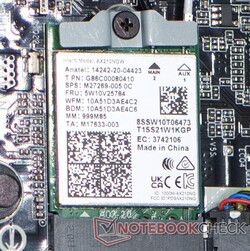
Módulo Intel Wi-Fi AX211 no Gigabyte Aero 14

A Gigabyte instala o módulo Intel AX210. Ele suporta os padrões mais recentes com WiFi 6E e Bluetooth 5.2. As velocidades de transferência estão acima da média e são maiores do que as dos dispositivos concorrentes. No entanto, não há diferença significativa entre as redes de 5 GHz e 6 GHz. As velocidades de transmissão de upload e download praticamente não diferem nas redes WiFi 6 e WiFi 6E do nosso roteador AX11000.

Networking
iperf3 transmit AX12
Average Intel Wi-Fi 6E AX210
  (675 - 1602, n=27)
1166 MBit/s
Asus Zephyrus G14 GA401QM
Intel Wi-Fi 6 AX200
1002 (735min - 1087max) MBit/s
Average of class Multimedia
  (285 - 998, n=2, last 2 years)
642 MBit/s
iperf3 receive AX12
Average of class Multimedia
  (1017 - 1675, n=2, last 2 years)
1346 MBit/s
Average Intel Wi-Fi 6E AX210
  (914 - 1716, n=27)
1309 MBit/s
Asus Zephyrus G14 GA401QM
Intel Wi-Fi 6 AX200
1174 (1002min - 1406max) MBit/s
iperf3 transmit AXE11000
Gigabyte Aero 14 OLED BMF
Intel Wi-Fi 6E AX210
1574 (1478min - 1665max) MBit/s
MSI Stealth 14 Studio A13V
Killer Wi-Fi 6E AX1675i 160MHz Wireless Network Adapter
1475 (1388min, 1391.77P1 - 1512max) MBit/s -6%
SCHENKER Vision 14 2022 RTX 3050 Ti
Intel Wi-Fi 6 AX201
1458 (1294min - 1591max) MBit/s -7%
Lenovo Yoga Pro 7 14IRH G8
Intel Wi-Fi 6E AX211
1348 (1296min, 1296.87P1 - 1385max) MBit/s -14%
Average of class Multimedia
  (358 - 1735, n=76, last 2 years)
1327 MBit/s -16%
Acer Swift X SFX14-51G-5876
Intel Wi-Fi 6E AX211
1256 (1102min - 1313max) MBit/s -20%
Average Intel Wi-Fi 6E AX210
  (565 - 1584, n=16)
1160 MBit/s -26%
iperf3 receive AXE11000
Gigabyte Aero 14 OLED BMF
Intel Wi-Fi 6E AX210
1679 (1641min - 1697max) MBit/s
Acer Swift X SFX14-51G-5876
Intel Wi-Fi 6E AX211
1617 (1389min - 1645max) MBit/s -4%
SCHENKER Vision 14 2022 RTX 3050 Ti
Intel Wi-Fi 6 AX201
1570 (1446min - 1613max) MBit/s -6%
Lenovo Yoga Pro 7 14IRH G8
Intel Wi-Fi 6E AX211
1541 (1426min, 1427.45P1 - 1639max) MBit/s -8%
MSI Stealth 14 Studio A13V
Killer Wi-Fi 6E AX1675i 160MHz Wireless Network Adapter
1426 (1375min, 1379.64P1 - 1458max) MBit/s -15%
Average of class Multimedia
  (701 - 1789, n=78, last 2 years)
1416 MBit/s -16%
Average Intel Wi-Fi 6E AX210
  (750 - 1711, n=16)
1271 MBit/s -24%
iperf3 transmit AXE11000 6GHz
Gigabyte Aero 14 OLED BMF
Intel Wi-Fi 6E AX210
1594 (1492min - 1637max) MBit/s
Acer Predator Triton 300 SE
Killer Wi-Fi 6E AX1675i 160MHz Wireless Network Adapter
1482 (1273min - 1624max) MBit/s -7%
Average of class Multimedia
  (944 - 1822, n=39, last 2 years)
1409 MBit/s -12%
Average Intel Wi-Fi 6E AX210
  (712 - 1615, n=16)
1337 MBit/s -16%
iperf3 receive AXE11000 6GHz
Gigabyte Aero 14 OLED BMF
Intel Wi-Fi 6E AX210
1667 (1652min - 1678max) MBit/s
Average Intel Wi-Fi 6E AX210
  (885 - 1827, n=17)
1490 MBit/s -11%
Average of class Multimedia
  (920 - 1803, n=39, last 2 years)
1485 MBit/s -11%
Acer Predator Triton 300 SE
Killer Wi-Fi 6E AX1675i 160MHz Wireless Network Adapter
1454 (1377min - 1497max) MBit/s -13%
05010015020025030035040045050055060065070075080085090095010001050110011501200125013001350140014501500155016001650Tooltip
Gigabyte Aero 14 OLED BMF Intel Wi-Fi 6E AX210; iperf3 transmit AXE11000 6GHz; iperf 3.1.3: Ø1594 (1492-1637)
Acer Predator Triton 300 SE Killer Wi-Fi 6E AX1675i 160MHz Wireless Network Adapter; iperf3 transmit AXE11000 6GHz; iperf 3.1.3: Ø1482 (1273-1624)
Gigabyte Aero 14 OLED BMF Intel Wi-Fi 6E AX210; iperf3 receive AXE11000 6GHz; iperf 3.1.3: Ø1667 (1652-1678)
Acer Predator Triton 300 SE Killer Wi-Fi 6E AX1675i 160MHz Wireless Network Adapter; iperf3 receive AXE11000 6GHz; iperf 3.1.3: Ø1454 (1377-1497)
Gigabyte Aero 14 OLED BMF Intel Wi-Fi 6E AX210; iperf3 transmit AXE11000; iperf 3.1.3: Ø1574 (1478-1665)
SCHENKER Vision 14 2022 RTX 3050 Ti Intel Wi-Fi 6 AX201; iperf3 transmit AXE11000; iperf 3.1.3: Ø1458 (1294-1591)
MSI Stealth 14 Studio A13V Killer Wi-Fi 6E AX1675i 160MHz Wireless Network Adapter; iperf3 transmit AXE11000: Ø1475 (1388-1512)
Lenovo Yoga Pro 7 14IRH G8 Intel Wi-Fi 6E AX211; iperf3 transmit AXE11000: Ø1348 (1296-1385)
Acer Swift X SFX14-51G-5876 Intel Wi-Fi 6E AX211; iperf3 transmit AXE11000; iperf 3.1.3: Ø1256 (1102-1313)
Gigabyte Aero 14 OLED BMF Intel Wi-Fi 6E AX210; iperf3 receive AXE11000; iperf 3.1.3: Ø1679 (1641-1697)
SCHENKER Vision 14 2022 RTX 3050 Ti Intel Wi-Fi 6 AX201; iperf3 receive AXE11000; iperf 3.1.3: Ø1569 (1446-1613)
MSI Stealth 14 Studio A13V Killer Wi-Fi 6E AX1675i 160MHz Wireless Network Adapter; iperf3 receive AXE11000: Ø1426 (1375-1458)
Lenovo Yoga Pro 7 14IRH G8 Intel Wi-Fi 6E AX211; iperf3 receive AXE11000: Ø1541 (1426-1639)
Acer Swift X SFX14-51G-5876 Intel Wi-Fi 6E AX211; iperf3 receive AXE11000; iperf 3.1.3: Ø1617 (1389-1645)

Webcam

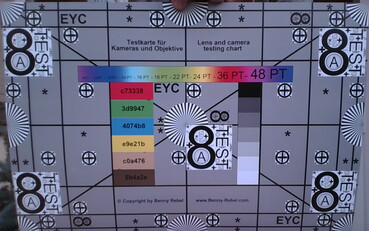
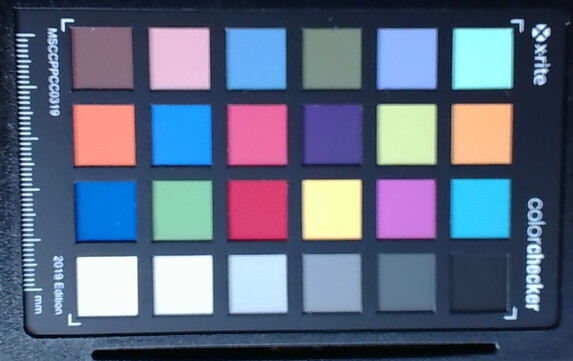
A webcam do notebook estúdio é compatível com o reconhecimento facial via Windows Hello e tem uma resolução de 2,1 MP (Full HD). Em boas condições de iluminação, a qualidade da imagem é bastante convincente. No entanto, um olhar mais atento à nossa imagem de teste revela bordas borradas e uma imagem ligeiramente borrada no geral. Se as condições de iluminação não forem ideais, a câmera tende a emitir ruídos rapidamente.
ColorChecker
17.6 ∆E
22.4 ∆E
19.1 ∆E
18.9 ∆E
20.5 ∆E
17.1 ∆E
20.7 ∆E
28.4 ∆E
16.5 ∆E
12.1 ∆E
18.2 ∆E
14.7 ∆E
23.2 ∆E
23.3 ∆E
15.9 ∆E
18.8 ∆E
16 ∆E
22.2 ∆E
2.3 ∆E
11.4 ∆E
21.3 ∆E
20.4 ∆E
17.3 ∆E
11.8 ∆E
ColorChecker Gigabyte Aero 14 OLED BMF: 17.92 ∆E min: 2.28 - max: 28.42 ∆E

Segurança

O Gigabyte Aero 14 oferece apenas reconhecimento facial para autenticação do usuário. O dispositivo não oferece um sensor de impressão digital ou outros recursos de segurança, como um slot Kensington Lock. Somente os recursos de segurança do Intel Core i7 com TPM 2.0 estão ativos.

Acessórios

Na embalagem do laptop da Gigabyte, encontramos apenas os documentos habituais e o adaptador de energia obrigatório.

Manutenção

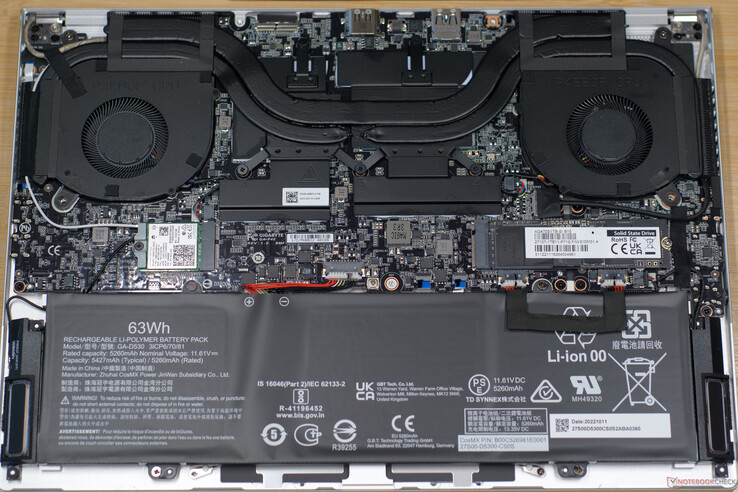
Oito pequenos parafusos TORX mantêm a base do laptop unida. Depois de desparafusá-los, alguns clipes de plástico mantêm a base no lugar. Uma ferramenta de abertura de plástico ou uma ventosa forte pode ser usada para abrir a parte traseira e as laterais até a parte frontal. Na parte frontal, a tampa da base é enganchada por baixo. Uma vez liberada nas laterais e na parte traseira, você pode levantá-la um pouco e removê-la em direção à parte traseira.

Em seu interior, encontramos um SSD M.2 NVMe intercambiável e o módulo M.2 WLAN. A memória de trabalho de 16 GB é soldada. A bateria de polímero de lítio do notebook é fixada com mais dois parafusos. Embora as ventoinhas do laptop ainda possam ser limpas facilmente, só é possível acessar as aletas de resfriamento removendo todo o sistema de resfriamento.

Garantia

Infelizmente, a declaração de garantia da Gigabyte deixa em aberto a questão de quanto tempo o laptop está coberto pela garantia e se refere aos varejistas. Na Alemanha, é provável que seja o período legal de 24 meses. Isso, é claro, pode ser diferente em outros países, portanto, os compradores interessados devem verificar antes de comprar.

O fabricante especifica um período de garantia mundial de um ano para a bateria.

Input Devices - Remarkable 1.7 mm key travel

Teclado

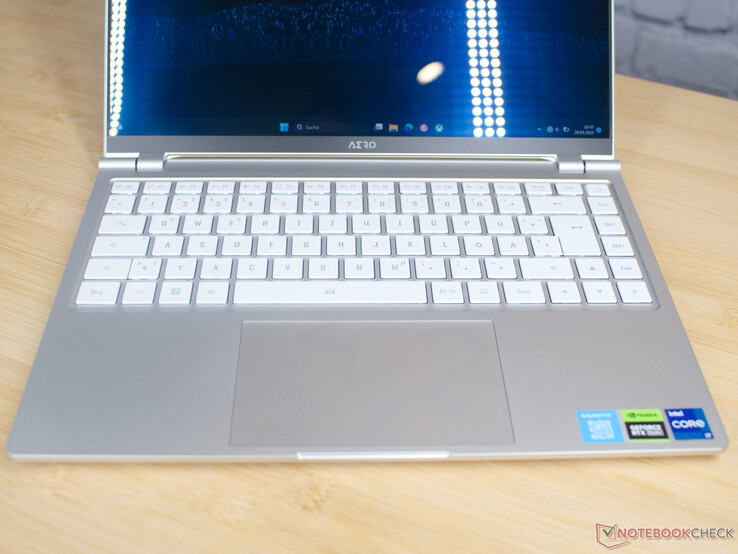
O Gigabyte Aero 14 BMF tem um excelente teclado retroiluminado com deslocamento das teclas de 1,7 mm. Isso não é uma questão óbvia, especialmente em um laptop tão fino. Em combinação com um forte feedback tátil, isso permite uma boa dinâmica de trabalho. Apenas as letras do teclado poderiam ter um pouco mais de contraste.

Outro ponto negativo da luz de fundo do teclado é o controle de brilho. Se ele não estiver definido para o brilho total, um leve zumbido da bobina se torna audível.

Touchpad

O touchpad do Gigabyte Aero 14 é agradavelmente grande, com 12,1 × 7,8 cm. Ele fica centralizado no gabinete e, portanto, deixa espaço suficiente para a palma da mão. Como o touchpad é feito de vidro fosco, ele deve manter sua agradável textura de superfície por um longo tempo. Dependendo do ângulo de visão, as letras com a marca AΣRO são mais ou menos perceptíveis.

Dispositivos de entrada no Gigabyte Aero 14

Tela - OLED em cores reais

Grade de subpixel OLED
Certificação HDR não encontrada

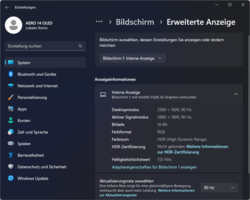
Um painel OLED da Samsung está instalado no Gigabyte Aero 14. Ele vem com vários certificados: é validado pela Pantone, certificado pela X-Rite, certificado pela TÜV Rheinland e atende ao padrão Eyesafe 2.0. A densidade de pixels é de 243 ppi com uma resolução de 3K. Medimos um brilho máximo de 430 cd/m² na tela. De acordo com a Gigabyte, ele suporta VESA DisplayHDR 600 True Black e, portanto, deve atingir um brilho pontual de até 600 cd/m². O Windows não permite a operação HDR no modo de bateria, mas o botão HDR nas configurações da tela permanece acinzentado também na operação de rede elétrica. O Windows também não encontra o certificado HDR da tela.

Como uma tela OLED, o painel convence com preto real e, portanto, não permite nenhum erro de iluminação. A Gigabyte pré-instalou o X-Rite Color Assistant e assim promete desvios de cor extremamente baixos de DeltaE abaixo de 1,15. Aqui você pode escolher entre diferentes perfis de cores: AdobeRGB, Display P3, sRGB e Rec. 709. Há relatórios no aplicativo para todos os perfis que descrevem a reprodução de cores. Nenhum dos perfis tem um desvio médio de cor maior que DeltaE 1. O ponto problemático aqui é o brilho calibrado: a tela do Gigabyte Aero 14 está certificada como 161.348 cd/m² (62% de brilho da tela). Se for definido um brilho mais alto, os desvios de cor aumentam significativamente. Os perfis de cores não estão disponíveis no modo HDR.

430
cd/m²
428
cd/m²
430
cd/m²
424
cd/m²
423
cd/m²
426
cd/m²
426
cd/m²
425
cd/m²
430
cd/m²
Distribuição do brilho
Samsung SDC4192 (ATNA40YK14-0) tested with X-Rite i1Pro 3
Máximo: 430 cd/m² (Nits) Médio: 426.9 cd/m² Minimum: 0.97 cd/m²
iluminação: 98 %
iluminação com acumulador: 424 cd/m²
Contraste: 4230:1 (Preto: 0.1 cd/m²)
ΔE Color 0.55 | 0.5-29.43 Ø5, calibrated: 1.15
ΔE Greyscale 0.69 | 0.57-98 Ø5.3
88.7% AdobeRGB 1998 (Argyll 2.2.0 3D)
100% sRGB (Argyll 2.2.0 3D)
99.8% Display P3 (Argyll 2.2.0 3D)
Gamma: 2.42
Gigabyte Aero 14 OLED BMF
Samsung SDC4192 (ATNA40YK14-0), OLED, 2880x1800, 14.00
SCHENKER Vision 14 2022 RTX 3050 Ti
MNE007ZA1-1, IPS, 2880x1800, 14.00
MSI Stealth 14 Studio A13V
B140QAN06.T, IPS, 2560x1600, 14.00
Lenovo Yoga Pro 7 14IRH G8
LEN145-3K, IPS, 3072x1920, 14.50
Asus Zephyrus G14 GA401QM
LM140LF-1F02, IPS, 1920x1080, 14.00
Acer Predator Triton 300 SE
Samsung ATNA40YK07-0, OLED, 2880x1800, 14.00
Acer Swift X SFX14-51G-5876
NV140DRM-N62, IPS-LED, 2240x1400, 14.00
Display
-15%
-3%
-1%
-21%
4%
-16%
Display P3 Coverage
99.8
74.1
-26%
96.2
-4%
98.7
-1%
68.1
-32%
99.9
0%
70.21
-30%
sRGB Coverage
100
97.4
-3%
99.6
0%
100
0%
92.4
-8%
100
0%
99.04
-1%
AdobeRGB 1998 Coverage
88.7
75.3
-15%
85.3
-4%
87.6
-1%
67.7
-24%
99
12%
72.59
-18%
Response Times
-859%
-136%
-886%
-1192%
36%
-1338%
Response Time Grey 50% / Grey 80% *
2.4 ?(1.4, 1)
31.5 ?(14, 17.5)
-1213%
5.5 ?(2.7, 2.8)
-129%
31.5 ?(14.5, 17)
-1213%
34.4 ?(15.6, 18.8)
-1333%
1.36 ?(0.68, 0.68)
43%
42 ?(20, 22)
-1650%
Response Time Black / White *
2.4 ?(1.4, 1)
14.5 ?(4.7, 9.8)
-504%
5.8 ?(2.1, 3.7)
-142%
15.8 ?(5.4, 10.4)
-558%
27.6 ?(16.4, 11.2)
-1050%
1.36 ?(0.52, 0.84)
43%
27 ?(15, 12)
-1025%
PWM Frequency
300
367.6 ?(100)
23%
Screen
-192%
-167%
-33%
-252%
-249%
-159%
Brightness middle
423
421
0%
419
-1%
441
4%
329.4
-22%
414.3
-2%
344
-19%
Brightness
427
416
-3%
402
-6%
453
6%
311
-27%
416
-3%
330
-23%
Brightness Distribution
98
89
-9%
89
-9%
92
-6%
90
-8%
99
1%
81
-17%
Black Level *
0.1
0.28
-180%
0.43
-330%
0.34
-240%
0.39
-290%
0.21
-110%
Contrast
4230
1504
-64%
974
-77%
1297
-69%
845
-80%
1638
-61%
Colorchecker dE 2000 *
0.55
3.2
-482%
2.3
-318%
0.6
-9%
4.01
-629%
4.68
-751%
2.39
-335%
Colorchecker dE 2000 max. *
1.15
5.5
-378%
5.8
-404%
1.3
-13%
8.21
-614%
7.78
-577%
5.24
-356%
Colorchecker dE 2000 calibrated *
1.15
2
-74%
0.9
22%
0.6
48%
3.89
-238%
0.99
14%
Greyscale dE 2000 *
0.69
4.4
-538%
3.3
-378%
0.8
-16%
3.2
-364%
1.8
-161%
4.31
-525%
Gamma
2.42 91%
2.22 99%
2.14 103%
2.2 100%
2.2 100%
2.22 99%
2.46 89%
CCT
6479 100%
6384 102%
6550 99%
6597 99%
7070 92%
6207 105%
6573 99%
Total Average (Program / Settings)
-355% / -249%
-102% / -127%
-307% / -148%
-488% / -337%
-70% / -114%
-504% / -297%

* ... smaller is better

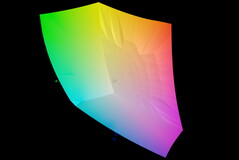
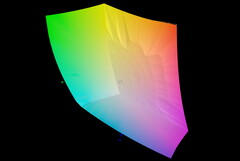
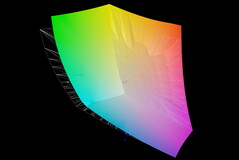
O monitor P3 e o sRGB são renderizados em quase 100%. Para a reprodução completa do AdobeRGB, a tela não apresenta os espectros de cores verde e azul. De acordo com nossas medições, a tela atinge apenas 88% do AdobeRGB com brilho total.

sRGB
sRGB
Tela-P3
Tela-P3
AdobeRGB
AdobeRGB

Aqui, o perfil DisplayP3 foi definido e medido por meio do aplicativo X-Rite. Com brilho total, a Gigabyte não consegue manter sua promessa publicitária para o Aero 14 OLED. O DeltaE 1.15 foi claramente perdido. A tela só atinge a fidelidade de cores anunciada com 62% de brilho ou menos. Nosso perfil ICC, criado com 100% de brilho (disponível para download na caixa de informações acima), traz apenas pequenas melhorias aqui. A tela melhora de um desvio de cor médio de DeltaE de 5,17 para 4,25. Mesmo com brilho total, seria desejável um desvio de cor de DeltaE 3 ou menos.

Escala de cinza com 100% de brilho
Saturação com 100% de brilho
ColorChecker com 100% de brilho
Escala de cinza com 50% de brilho
Saturação com 50% de brilho
ColorChecker com 50% de brilho
Escala de cinza com 100% de brilho, calibrado
Saturação com 100% de brilho, calibrado
ColorChecker com 100% de brilho, calibrado

Display Response Times

Display response times show how fast the screen is able to change from one color to the next. Slow response times can lead to afterimages and can cause moving objects to appear blurry (ghosting). Gamers of fast-paced 3D titles should pay special attention to fast response times.
       Response Time Black to White
2.4 ms ... rise ↗ and fall ↘ combined↗ 1.4 ms rise
↘ 1 ms fall
The screen shows very fast response rates in our tests and should be very well suited for fast-paced gaming.
In comparison, all tested devices range from 0.1 (minimum) to 240 (maximum) ms. » 7 % of all devices are better.
This means that the measured response time is better than the average of all tested devices (21.5 ms).
       Response Time 50% Grey to 80% Grey
2.4 ms ... rise ↗ and fall ↘ combined↗ 1.4 ms rise
↘ 1 ms fall
The screen shows very fast response rates in our tests and should be very well suited for fast-paced gaming.
In comparison, all tested devices range from 0.2 (minimum) to 636 (maximum) ms. » 7 % of all devices are better.
This means that the measured response time is better than the average of all tested devices (33.7 ms).

Screen Flickering / PWM (Pulse-Width Modulation)

To dim the screen, some notebooks will simply cycle the backlight on and off in rapid succession - a method called Pulse Width Modulation (PWM) . This cycling frequency should ideally be undetectable to the human eye. If said frequency is too low, users with sensitive eyes may experience strain or headaches or even notice the flickering altogether.
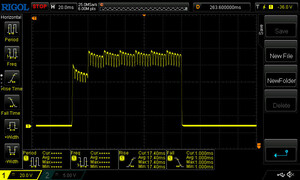
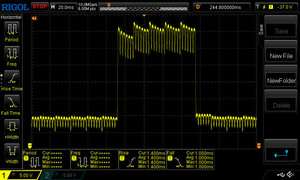
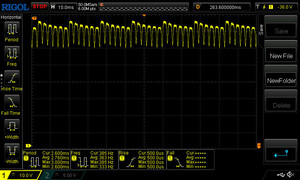
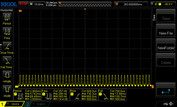
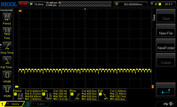
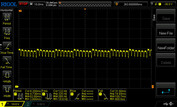
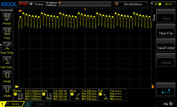
Screen flickering / PWM detected 300 Hz

The display backlight flickers at 300 Hz (worst case, e.g., utilizing PWM) .

The frequency of 300 Hz is relatively high, so most users sensitive to PWM should not notice any flickering. However, there are reports that some users are still sensitive to PWM at 500 Hz and above, so be aware.

In comparison: 53 % of all tested devices do not use PWM to dim the display. If PWM was detected, an average of 17900 (minimum: 5 - maximum: 3846000) Hz was measured.

PWM com 20% de brilho
PWM com 50% de brilho
PWM com 70% de brilho
PWM com 100% de brilho

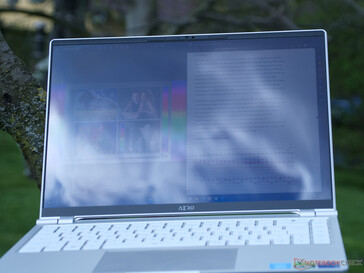
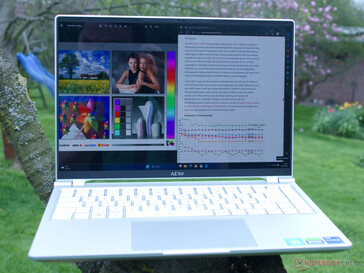
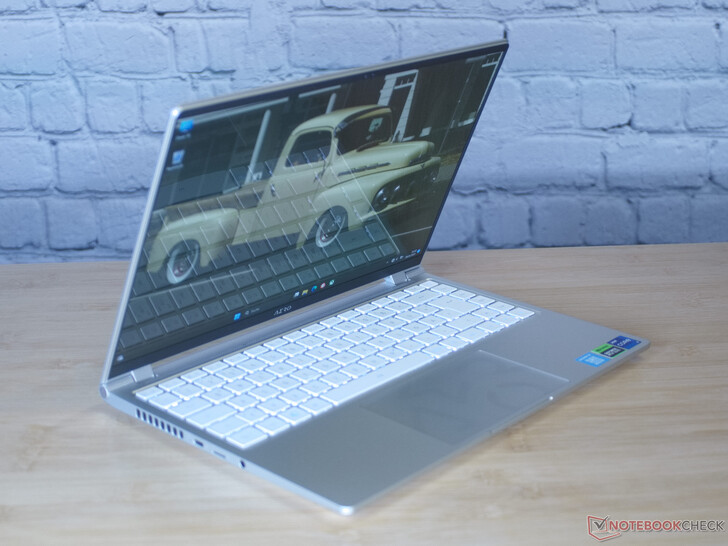
Com 430 cd/m², a tela deve ser adequada para uso em ambientes externos. No entanto, isso muda em um perfil de cor predefinido, desde que você queira uma reprodução exata das cores. 162 cd/m² não é suficiente para ofuscar interiores bem iluminados e seus reflexos na tela brilhante. Mesmo com um total de 430 cd/m², os reflexos podem prejudicar seriamente a legibilidade na presença de luz solar.

Aero 14 OLED em uso externo (ligeiramente nublado)
Aero 14 OLED em uso externo (muito nublado)
Reflexo do teclado do próprio laptop sob iluminação de estúdio e com 62% de brilho da tela
 

Como é comum em telas OLED, quase não há desvios de cor e contraste ao mudar o ângulo de visão. Visto de todas as posições, o Aero 14 OLED oferece uma boa imagem.

Estabilidade do ângulo de visão do Gigabyte Aero 14

Desempenho - Intel Core i7-13700H sem melhorias em relação ao antecessor

O Aero 14 OLED está disponível em duas configurações, ambas com umaGeForce RTX 4050e 16 GB LPDDR5. Nosso dispositivo de teste (BMF) usa o Intel Core i7-13700Henquanto a outra variante de configuração (9MF) usa o i5-12500Hem todos os outros recursos, o Aero 14 OLED BMF e o 9MF são praticamente idênticos.

Isso significa que ambos estão bem equipados para atender aos requisitos de um laptop de estúdio. Você pode fazer renderização 3D, edição de vídeo e de fotos. Muitos jogos também devem ser executados sem problemas nos dispositivos. Entretanto, os títulos atuais tendem a exigir mais da memória gráfica. 6 GB no GeForce 4050 são, portanto, bastante limitados.


Gigabyte Control Center - perdeu o controle

O Gigabyte Control Center causou problemas consideráveis, telas azuis e muita frustração em nossos testes. Na verdade, o aplicativo pode ser usado para ajustar um grande número de configurações no laptop com apenas alguns cliques. O primeiro ponto de crítica aparece ao iniciar o aplicativo: o controle de conta de usuário do Windows entra em ação. A conhecida pergunta "Deseja permitir que este aplicativo faça alterações em seu dispositivo?" é exibida

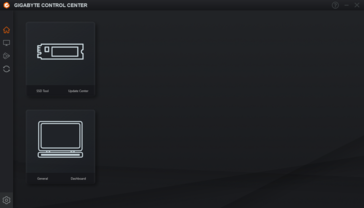
Depois disso, você acaba na tela inicial sem sentido do aplicativo. Aqui você precisa clicar mais para chegar às configurações estendidas.

Gigabyte Control Center - tela de inicialização
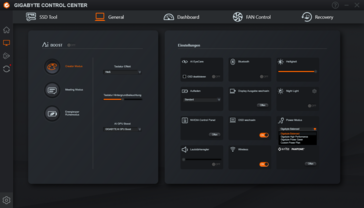
Guia Geral - configurações e aumento de IA
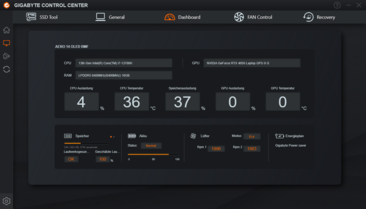
Guia Dashboard - informações sobre o status do sistema
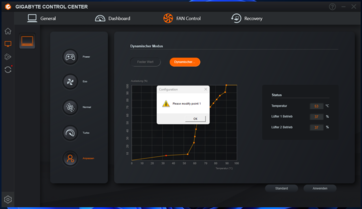
Controle de ventilador - curvas de ventilador personalizáveis

O que as várias opções de configuração na guia "General" fazem não está totalmente explicado em nenhum lugar. Os quatro perfis de desempenho diferentes para o Aero 14 também podem ser acessados aqui. No entanto, notamos em nossos testes que o laptop às vezes alterna entre os perfis de desempenho de forma irregular

O maior problema do aplicativo são as telas azuis aleatórias enquanto o aplicativo está aberto. Inicialmente, não tínhamos ideia da causa, mas depois de algum tempo, determinamos que isso estava relacionado ao aplicativo Gigabyte Control. Somente quando ele não estava minimizado é que o laptop travava em vários cenários.

O Centro de Controle não reconhece o laptop

Após uma dessas falhas, o aplicativo se recusou a reconhecer que estava sendo executado em um laptop Gigabyte. Ele havia perdido quase todas as funções. Isso significava que as ventoinhas do laptop estavam constantemente funcionando a toda velocidade. Uma simples atualização ou redefinição do aplicativo não trouxe nenhuma melhora. Somente depois que desinstalamos o Gigabyte Control Center com todos os componentes, limpamos o registro com o CCleaner e reinstalamos a versão mais recente do Control Center da Gigabyteo software voltou a funcionar depois de baixar várias atualizações para o nosso dispositivo de teste. Em seguida, ele funcionou de forma muito mais estável do que antes.

Condições de teste

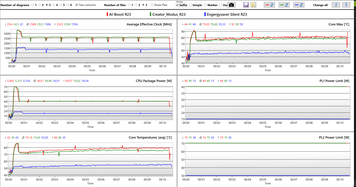
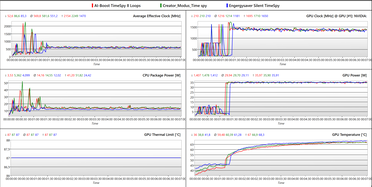
O Gigabyte Control Center tem quatro perfis de desempenho. Executamos todos os benchmarks no modo AI Boost com a curva de ventoinha "Normal" ativada. O processador é então alimentado com 40 watts e a Nvidia GeForce RTX 4050 com 35 watts. Todos os registros gravados mostram que nenhuma energia é transferida para frente e para trás entre a GPU e a CPU. Em todos os modos de desempenho, vemos a potência máxima da GPU em 35 watts. Nos modos AI e Creator, o desempenho do Intel Core i7 é limitado a 70 watts em PL2 e 40 watts em PL1. No modo Meeting e no modo Energysaver-Silent, o PL1 é limitado a 15 watts e o PL2 a 30 watts.

Log Cinebench Loop
Log Cinebench Loop
Registro 3DMark Time Spy Loop

Processador

A Gigabyte instala uma CPU Core i7 de ponta da atual série Raptor Lake da Intel. O processadori7-13700Hé muito potente para um notebook tão pequeno e geralmente é instalado em notebooks para jogos. Com seis núcleos de desempenho e oito de eficiência, o processador tem 20 threads. Mais uma vez, a diferença quase imperceptível em relação ao antecessor é notada nos processadores Raptor Lake. Aqui, o i7-12700H no Schenker Vision 14é uma boa comparação. Nele, o processador de 12ª geração também consome 40 watts. Os dois processadores diferem apenas ligeiramente nos benchmarks genéricos de processador.

Se quiser economizar algum dinheiro, dê uma olhada nos benchmarks doAcer Swift 3 SF314-71-56U3 e do Honor MagicBook 14as CPUs i5-12500H em ambos os laptops também estão disponíveis no Aero 14 OLED 9MF mais barato. Embora a diferença de desempenho seja visível nos benchmarks, ela está na faixa de 10 a 15% e, portanto, é insignificante para a maioria dos aplicativos. Especialmente porque o Aero tem uma GPU dedicada, as desvantagens do i5 são claramente atenuadas.

Cinebench R15 Multi Sustained Load

0140280420560700840980112012601400154016801820196021002240238025202660Tooltip
Gigabyte Aero 14 OLED BMF Intel Core i7-13700H: Ø2029 (1995.31-2490.5)
SCHENKER Vision 14 2022 RTX 3050 Ti Intel Core i7-12700H: Ø1988 (1948.94-2166.26)
MSI Stealth 14 Studio A13V Intel Core i7-13700H: Ø2311 (2156.33-2742.92)
Lenovo Yoga Pro 7 14IRH G8 Intel Core i7-13700H: Ø2374 (2297.79-2615.58)
Asus Zephyrus G14 GA401QM AMD Ryzen 9 5900HS: Ø2088 (2079.33-2098.42)
Acer Predator Triton 300 SE Intel Core i9-12900H: Ø2282 (2251.36-2406.88)
Acer Swift X SFX14-51G-5876 Intel Core i5-1240P: Ø1187 (1154.23-1512.34)
Acer Swift 3 SF314-71-56U3 Intel Core i5-12500H: Ø1607 (1512-1927.43)
Honor MagicBook 14 2022 Intel Core i5-12500H; Smart Mode: Ø1638 (1576.35-2094.02)
Honor MagicBook 14 2022 Intel Core i5-12500H: Ø1875 (1748.1-2091.07)
CPU Performance Rating: Percent
Cinebench R23: Multi Core | Single Core
Cinebench R20: CPU (Multi Core) | CPU (Single Core)
Cinebench R15: CPU Multi 64Bit | CPU Single 64Bit
Blender: v2.79 BMW27 CPU
7-Zip 18.03: 7z b 4 | 7z b 4 -mmt1
Geekbench 5.5: Multi-Core | Single-Core
HWBOT x265 Benchmark v2.2: 4k Preset
LibreOffice : 20 Documents To PDF
R Benchmark 2.5: Overall mean
CPU Performance Rating
Lenovo Yoga Pro 7 14IRH G8
Intel Core i7-13700H
84.4 pt
Acer Predator Triton 300 SE
Intel Core i9-12900H
82.1 pt
MSI Stealth 14 Studio A13V
Intel Core i7-13700H
78 pt
Gigabyte Aero 14 OLED BMF
Intel Core i7-13700H
77.3 pt
Average Intel Core i7-13700H
 
77 pt
SCHENKER Vision 14 2022 RTX 3050 Ti
Intel Core i7-12700H
73.2 pt
Average of class Multimedia
 
72.5 pt
Honor MagicBook 14 2022
Intel Core i5-12500H
68.6 pt
Acer Swift 3 SF314-71-56U3
Intel Core i5-12500H
66.6 pt
Asus Zephyrus G14 GA401QM -2!
AMD Ryzen 9 5900HS
64.9 pt
Acer Swift X SFX14-51G-5876
Intel Core i5-1240P
52.3 pt
Cinebench R23 / Multi Core
Lenovo Yoga Pro 7 14IRH G8
Intel Core i7-13700H
17442 Points +22%
MSI Stealth 14 Studio A13V
Intel Core i7-13700H
17260 (14061min - 17259.5max) Points +20%
Acer Predator Triton 300 SE
Intel Core i9-12900H
15906 (14978min - 15906.4max) Points +11%
Average Intel Core i7-13700H
  (5890 - 20034, n=27)
15155 Points +6%
SCHENKER Vision 14 2022 RTX 3050 Ti
Intel Core i7-12700H
14917 Points +4%
Gigabyte Aero 14 OLED BMF
Intel Core i7-13700H
14325 (12974.5min - 14324.9max) Points
Average of class Multimedia
  (4624 - 30789, n=101, last 2 years)
14189 Points -1%
Asus Zephyrus G14 GA401QM
AMD Ryzen 9 5900HS
13158 (12786.6min - 13158max) Points -8%
Honor MagicBook 14 2022
Intel Core i5-12500H
12225 Points -15%
Acer Swift 3 SF314-71-56U3
Intel Core i5-12500H
11330 Points -21%
Acer Swift X SFX14-51G-5876
Intel Core i5-1240P
8054 Points -44%
Cinebench R23 / Single Core
Acer Predator Triton 300 SE
Intel Core i9-12900H
1910 Points +4%
Lenovo Yoga Pro 7 14IRH G8
Intel Core i7-13700H
1881 Points +2%
Gigabyte Aero 14 OLED BMF
Intel Core i7-13700H
1840 Points
Average Intel Core i7-13700H
  (1323 - 1914, n=27)
1793 Points -3%
Average of class Multimedia
  (878 - 2110, n=99, last 2 years)
1713 Points -7%
Honor MagicBook 14 2022
Intel Core i5-12500H
1697 Points -8%
SCHENKER Vision 14 2022 RTX 3050 Ti
Intel Core i7-12700H
1678 Points -9%
Acer Swift 3 SF314-71-56U3
Intel Core i5-12500H
1677 Points -9%
MSI Stealth 14 Studio A13V
Intel Core i7-13700H
1627 Points -12%
Acer Swift X SFX14-51G-5876
Intel Core i5-1240P
1615 Points -12%
Asus Zephyrus G14 GA401QM
AMD Ryzen 9 5900HS
1457 Points -21%
Cinebench R20 / CPU (Multi Core)
MSI Stealth 14 Studio A13V
Intel Core i7-13700H
6597 Points +23%
Lenovo Yoga Pro 7 14IRH G8
Intel Core i7-13700H
6597 Points +23%
Acer Predator Triton 300 SE
Intel Core i9-12900H
6108 Points +14%
Average Intel Core i7-13700H
  (2322 - 7674, n=27)
5907 Points +10%
SCHENKER Vision 14 2022 RTX 3050 Ti
Intel Core i7-12700H
5762 Points +7%
Gigabyte Aero 14 OLED BMF
Intel Core i7-13700H
5373 Points
Average of class Multimedia
  (1783 - 11768, n=97, last 2 years)
5352 Points 0%
Asus Zephyrus G14 GA401QM
AMD Ryzen 9 5900HS
5058 Points -6%
Honor MagicBook 14 2022
Intel Core i5-12500H
4723 Points -12%
Acer Swift 3 SF314-71-56U3
Intel Core i5-12500H
4687 Points -13%
Acer Swift X SFX14-51G-5876
Intel Core i5-1240P
3172 Points -41%
Cinebench R20 / CPU (Single Core)
Acer Predator Triton 300 SE
Intel Core i9-12900H
733 Points +3%
Lenovo Yoga Pro 7 14IRH G8
Intel Core i7-13700H
730 Points +3%
Gigabyte Aero 14 OLED BMF
Intel Core i7-13700H
712 Points
SCHENKER Vision 14 2022 RTX 3050 Ti
Intel Core i7-12700H
701 Points -2%
Average Intel Core i7-13700H
  (508 - 741, n=27)
692 Points -3%
Acer Swift 3 SF314-71-56U3
Intel Core i5-12500H
656 Points -8%
Honor MagicBook 14 2022
Intel Core i5-12500H
652 Points -8%
Average of class Multimedia
  (341 - 812, n=97, last 2 years)
646 Points -9%
MSI Stealth 14 Studio A13V
Intel Core i7-13700H
640 Points -10%
Acer Swift X SFX14-51G-5876
Intel Core i5-1240P
621 Points -13%
Asus Zephyrus G14 GA401QM
AMD Ryzen 9 5900HS
568 Points -20%
Cinebench R15 / CPU Multi 64Bit
MSI Stealth 14 Studio A13V
Intel Core i7-13700H
2743 (2156.33min - 2742.92max) Points +10%
Lenovo Yoga Pro 7 14IRH G8
Intel Core i7-13700H
2616 (2297.79min - 2615.58max) Points +5%
Gigabyte Aero 14 OLED BMF
Intel Core i7-13700H
2491 (1995.31min - 2490.5max) Points
Average Intel Core i7-13700H
  (905 - 2982, n=27)
2444 Points -2%
Acer Predator Triton 300 SE
Intel Core i9-12900H
2407 (2251.36min - 2406.88max) Points -3%
Average of class Multimedia
  (785 - 4703, n=106, last 2 years)
2321 Points -7%
SCHENKER Vision 14 2022 RTX 3050 Ti
Intel Core i7-12700H
2166 (1948.94min - 2166.26max) Points -13%
Asus Zephyrus G14 GA401QM
AMD Ryzen 9 5900HS
2098 (2079.33min - 2098.42max) Points -16%
Honor MagicBook 14 2022
Intel Core i5-12500H
2094 (1576.35min - 2094.02max) Points -16%
Honor MagicBook 14 2022
Intel Core i5-12500H
2091 (1748.1min - 2091.07max) Points -16%
Acer Swift 3 SF314-71-56U3
Intel Core i5-12500H
2067 (1512min - 1927.43max) Points -17%
Acer Swift X SFX14-51G-5876
Intel Core i5-1240P
1512 (1154.23min - 1512.34max) Points -39%
Cinebench R15 / CPU Single 64Bit
Lenovo Yoga Pro 7 14IRH G8
Intel Core i7-13700H
273 Points +2%
Acer Predator Triton 300 SE
Intel Core i9-12900H
271 Points +1%
Gigabyte Aero 14 OLED BMF
Intel Core i7-13700H
268 Points
SCHENKER Vision 14 2022 RTX 3050 Ti
Intel Core i7-12700H
263 Points -2%
Average Intel Core i7-13700H
  (213 - 276, n=27)
260 Points -3%
Average of class Multimedia
  (142.6 - 308, n=99, last 2 years)
251 Points -6%
MSI Stealth 14 Studio A13V
Intel Core i7-13700H
241 Points -10%
Honor MagicBook 14 2022
Intel Core i5-12500H
240 Points -10%
Acer Swift 3 SF314-71-56U3
Intel Core i5-12500H
240 Points -10%
Asus Zephyrus G14 GA401QM
AMD Ryzen 9 5900HS
235 Points -12%
Acer Swift X SFX14-51G-5876
Intel Core i5-1240P
232 Points -13%
Blender / v2.79 BMW27 CPU
Acer Swift X SFX14-51G-5876
Intel Core i5-1240P
399 Seconds * -71%
Acer Swift 3 SF314-71-56U3
Intel Core i5-12500H
288 Seconds * -24%
Average of class Multimedia
  (107 - 662, n=95, last 2 years)
265 Seconds * -14%
Honor MagicBook 14 2022
Intel Core i5-12500H
264 Seconds * -13%
SCHENKER Vision 14 2022 RTX 3050 Ti
Intel Core i7-12700H
262 Seconds * -12%
Asus Zephyrus G14 GA401QM
AMD Ryzen 9 5900HS
233 Seconds * -0%
Gigabyte Aero 14 OLED BMF
Intel Core i7-13700H
233 Seconds *
Average Intel Core i7-13700H
  (169 - 555, n=27)
231 Seconds * +1%
Acer Predator Triton 300 SE
Intel Core i9-12900H
201 Seconds * +14%
Lenovo Yoga Pro 7 14IRH G8
Intel Core i7-13700H
197 Seconds * +15%
MSI Stealth 14 Studio A13V
Intel Core i7-13700H
190 Seconds * +18%
7-Zip 18.03 / 7z b 4
MSI Stealth 14 Studio A13V
Intel Core i7-13700H
70614 MIPS +20%
Lenovo Yoga Pro 7 14IRH G8
Intel Core i7-13700H
70222 MIPS +20%
Acer Predator Triton 300 SE
Intel Core i9-12900H
64899 MIPS +11%
Average Intel Core i7-13700H
  (27322 - 76344, n=27)
61327 MIPS +4%
Gigabyte Aero 14 OLED BMF
Intel Core i7-13700H
58703 MIPS
Average of class Multimedia
  (20166 - 119900, n=90, last 2 years)
57411 MIPS -2%
Asus Zephyrus G14 GA401QM
AMD Ryzen 9 5900HS
55697 MIPS -5%
Honor MagicBook 14 2022
Intel Core i5-12500H
51818 MIPS -12%
SCHENKER Vision 14 2022 RTX 3050 Ti
Intel Core i7-12700H
50517 MIPS -14%
Acer Swift 3 SF314-71-56U3
Intel Core i5-12500H
48771 MIPS -17%
Acer Swift X SFX14-51G-5876
Intel Core i5-1240P
34118 MIPS -42%
7-Zip 18.03 / 7z b 4 -mmt1
Gigabyte Aero 14 OLED BMF
Intel Core i7-13700H
6041 MIPS
Lenovo Yoga Pro 7 14IRH G8
Intel Core i7-13700H
5974 MIPS -1%
Average Intel Core i7-13700H
  (4825 - 6238, n=27)
5850 MIPS -3%
SCHENKER Vision 14 2022 RTX 3050 Ti
Intel Core i7-12700H
5833 MIPS -3%
Average of class Multimedia
  (3398 - 7163, n=90, last 2 years)
5639 MIPS -7%
Asus Zephyrus G14 GA401QM
AMD Ryzen 9 5900HS
5637 MIPS -7%
Acer Predator Triton 300 SE
Intel Core i9-12900H
5590 MIPS -7%
Acer Swift 3 SF314-71-56U3
Intel Core i5-12500H
5371 MIPS -11%
MSI Stealth 14 Studio A13V
Intel Core i7-13700H
5335 MIPS -12%
Honor MagicBook 14 2022
Intel Core i5-12500H
5260 MIPS -13%
Acer Swift X SFX14-51G-5876
Intel Core i5-1240P
4674 MIPS -23%
Geekbench 5.5 / Multi-Core
Lenovo Yoga Pro 7 14IRH G8
Intel Core i7-13700H
13225 Points +21%
MSI Stealth 14 Studio A13V
Intel Core i7-13700H
12988 Points +19%
Acer Predator Triton 300 SE
Intel Core i9-12900H
12963 Points +18%
Average Intel Core i7-13700H
  (6165 - 14215, n=27)
11884 Points +8%
Average of class Multimedia
  (3828 - 23059, n=100, last 2 years)
11372 Points +4%
SCHENKER Vision 14 2022 RTX 3050 Ti
Intel Core i7-12700H
10976 Points 0%
Gigabyte Aero 14 OLED BMF
Intel Core i7-13700H
10955 Points
Honor MagicBook 14 2022
Intel Core i5-12500H
10828 Points -1%
Acer Swift 3 SF314-71-56U3
Intel Core i5-12500H
10762 Points -2%
Acer Swift X SFX14-51G-5876
Intel Core i5-1240P
9070 Points -17%
Geekbench 5.5 / Single-Core
Lenovo Yoga Pro 7 14IRH G8
Intel Core i7-13700H
1878 Points 0%
Gigabyte Aero 14 OLED BMF
Intel Core i7-13700H
1869 Points
Acer Predator Triton 300 SE
Intel Core i9-12900H
1854 Points -1%
Average Intel Core i7-13700H
  (1362 - 1919, n=27)
1791 Points -4%
SCHENKER Vision 14 2022 RTX 3050 Ti
Intel Core i7-12700H
1778 Points -5%
Average of class Multimedia
  (926 - 2342, n=100, last 2 years)
1758 Points -6%
MSI Stealth 14 Studio A13V
Intel Core i7-13700H
1713 Points -8%
Acer Swift 3 SF314-71-56U3
Intel Core i5-12500H
1693 Points -9%
Honor MagicBook 14 2022
Intel Core i5-12500H
1685 Points -10%
Acer Swift X SFX14-51G-5876
Intel Core i5-1240P
1596 Points -15%
HWBOT x265 Benchmark v2.2 / 4k Preset
Lenovo Yoga Pro 7 14IRH G8
Intel Core i7-13700H
18.9 fps +20%
Acer Predator Triton 300 SE
Intel Core i9-12900H
18.7 fps +19%
MSI Stealth 14 Studio A13V
Intel Core i7-13700H
18 fps +15%
Average Intel Core i7-13700H
  (6.72 - 21.2, n=27)
16.7 fps +6%
Gigabyte Aero 14 OLED BMF
Intel Core i7-13700H
15.7 fps
Average of class Multimedia
  (4.99 - 30.5, n=88, last 2 years)
15.6 fps -1%
Asus Zephyrus G14 GA401QM
AMD Ryzen 9 5900HS
15.3 fps -3%
Honor MagicBook 14 2022
Intel Core i5-12500H
14.3 fps -9%
SCHENKER Vision 14 2022 RTX 3050 Ti
Intel Core i7-12700H
13.8 fps -12%
Acer Swift 3 SF314-71-56U3
Intel Core i5-12500H
12 fps -24%
Acer Swift X SFX14-51G-5876
Intel Core i5-1240P
9.41 fps -40%
LibreOffice / 20 Documents To PDF
Acer Swift X SFX14-51G-5876
Intel Core i5-1240P
58 s * -41%
MSI Stealth 14 Studio A13V
Intel Core i7-13700H
57.4 s * -40%
Asus Zephyrus G14 GA401QM
AMD Ryzen 9 5900HS
51.9 s * -26%
Average Intel Core i7-13700H
  (31.3 - 62.4, n=27)
48 s * -17%
Average of class Multimedia
  (6.7 - 84.9, n=92, last 2 years)
48 s * -17%
Lenovo Yoga Pro 7 14IRH G8
Intel Core i7-13700H
46.1 s * -12%
SCHENKER Vision 14 2022 RTX 3050 Ti
Intel Core i7-12700H
42.8 s * -4%
Honor MagicBook 14 2022
Intel Core i5-12500H
41.6 s * -1%
Acer Predator Triton 300 SE
Intel Core i9-12900H
41.2 s * -0%
Gigabyte Aero 14 OLED BMF
Intel Core i7-13700H
41.1 s *
Acer Swift 3 SF314-71-56U3
Intel Core i5-12500H
40.1 s * +2%
R Benchmark 2.5 / Overall mean
Acer Swift X SFX14-51G-5876
Intel Core i5-1240P
0.534 sec * -19%
Acer Swift 3 SF314-71-56U3
Intel Core i5-12500H
0.513 sec * -15%
Asus Zephyrus G14 GA401QM
AMD Ryzen 9 5900HS
0.51 sec * -14%
MSI Stealth 14 Studio A13V
Intel Core i7-13700H
0.503 sec * -13%
Honor MagicBook 14 2022
Intel Core i5-12500H
0.4969 sec * -11%
Average of class Multimedia
  (0.3826 - 0.723, n=90, last 2 years)
0.4811 sec * -8%
Average Intel Core i7-13700H
  (0.4308 - 0.607, n=27)
0.4658 sec * -4%
SCHENKER Vision 14 2022 RTX 3050 Ti
Intel Core i7-12700H
0.4587 sec * -3%
Gigabyte Aero 14 OLED BMF
Intel Core i7-13700H
0.447 sec *
Lenovo Yoga Pro 7 14IRH G8
Intel Core i7-13700H
0.4308 sec * +4%
Acer Predator Triton 300 SE
Intel Core i9-12900H
0.4292 sec * +4%

* ... smaller is better

Cinebench R15 CPU Multi 64Bit
2491 Points
Cinebench R15 OpenGL 64Bit
207 fps
Cinebench R15 Ref. Match 64Bit
99.6 %
Cinebench R15 CPU Single 64Bit
268 Points
Ajuda
Performance Rating
Acer Predator Triton 300 SE
Intel Core i9-12900H, GeForce RTX 3060 Laptop GPU
88.6 pt
MSI Stealth 14 Studio A13V
Intel Core i7-13700H, NVIDIA GeForce RTX 4050 Laptop GPU
87 pt
Asus Zephyrus G14 GA401QM
AMD Ryzen 9 5900HS, GeForce RTX 3060 Laptop GPU
86.1 pt
Lenovo Yoga Pro 7 14IRH G8
Intel Core i7-13700H, NVIDIA GeForce RTX 4050 Laptop GPU
81.8 pt
Gigabyte Aero 14 OLED BMF
Intel Core i7-13700H, NVIDIA GeForce RTX 4050 Laptop GPU
78.6 pt
Average Intel Core i7-13700H
 
76.6 pt
Average of class Multimedia
 
72.4 pt
SCHENKER Vision 14 2022 RTX 3050 Ti
Intel Core i7-12700H, GeForce RTX 3050 Ti Laptop GPU
68.6 pt
Acer Swift X SFX14-51G-5876
Intel Core i5-1240P, GeForce RTX 3050 4GB Laptop GPU
47 pt
AIDA64 / FP32 Ray-Trace
MSI Stealth 14 Studio A13V
Intel Core i7-13700H, NVIDIA GeForce RTX 4050 Laptop GPU
16696 KRay/s +30%
Asus Zephyrus G14 GA401QM
AMD Ryzen 9 5900HS, GeForce RTX 3060 Laptop GPU
15146 KRay/s +18%
Acer Predator Triton 300 SE
Intel Core i9-12900H, GeForce RTX 3060 Laptop GPU
15140 KRay/s +18%
Lenovo Yoga Pro 7 14IRH G8
Intel Core i7-13700H, NVIDIA GeForce RTX 4050 Laptop GPU
14781 KRay/s +15%
Average Intel Core i7-13700H
  (4986 - 18908, n=27)
13884 KRay/s +8%
Gigabyte Aero 14 OLED BMF
Intel Core i7-13700H, NVIDIA GeForce RTX 4050 Laptop GPU
12817 KRay/s
Average of class Multimedia
  (3804 - 27411, n=88, last 2 years)
12788 KRay/s 0%
SCHENKER Vision 14 2022 RTX 3050 Ti
Intel Core i7-12700H, GeForce RTX 3050 Ti Laptop GPU
12366 KRay/s -4%
Acer Swift X SFX14-51G-5876
Intel Core i5-1240P, GeForce RTX 3050 4GB Laptop GPU
7480 KRay/s -42%
AIDA64 / FPU Julia
Asus Zephyrus G14 GA401QM
AMD Ryzen 9 5900HS, GeForce RTX 3060 Laptop GPU
96666 Points +51%
MSI Stealth 14 Studio A13V
Intel Core i7-13700H, NVIDIA GeForce RTX 4050 Laptop GPU
83661 Points +30%
Acer Predator Triton 300 SE
Intel Core i9-12900H, GeForce RTX 3060 Laptop GPU
75181 Points +17%
Lenovo Yoga Pro 7 14IRH G8
Intel Core i7-13700H, NVIDIA GeForce RTX 4050 Laptop GPU
73879 Points +15%
Average Intel Core i7-13700H
  (25360 - 92359, n=27)
69749 Points +9%
Average of class Multimedia
  (16379 - 136048, n=88, last 2 years)
65480 Points +2%
Gigabyte Aero 14 OLED BMF
Intel Core i7-13700H, NVIDIA GeForce RTX 4050 Laptop GPU
64115 Points
SCHENKER Vision 14 2022 RTX 3050 Ti
Intel Core i7-12700H, GeForce RTX 3050 Ti Laptop GPU
61721 Points -4%
Acer Swift X SFX14-51G-5876
Intel Core i5-1240P, GeForce RTX 3050 4GB Laptop GPU
37854 Points -41%
AIDA64 / CPU SHA3
MSI Stealth 14 Studio A13V
Intel Core i7-13700H, NVIDIA GeForce RTX 4050 Laptop GPU
3824 MB/s +27%
Acer Predator Triton 300 SE
Intel Core i9-12900H, GeForce RTX 3060 Laptop GPU
3676 MB/s +22%
Lenovo Yoga Pro 7 14IRH G8
Intel Core i7-13700H, NVIDIA GeForce RTX 4050 Laptop GPU
3457 MB/s +15%
Asus Zephyrus G14 GA401QM
AMD Ryzen 9 5900HS, GeForce RTX 3060 Laptop GPU
3305 MB/s +10%
Average Intel Core i7-13700H
  (1339 - 4224, n=27)
3248 MB/s +8%
Average of class Multimedia
  (1099 - 6681, n=88, last 2 years)
3047 MB/s +1%
Gigabyte Aero 14 OLED BMF
Intel Core i7-13700H, NVIDIA GeForce RTX 4050 Laptop GPU
3016 MB/s
SCHENKER Vision 14 2022 RTX 3050 Ti
Intel Core i7-12700H, GeForce RTX 3050 Ti Laptop GPU
2850 MB/s -6%
Acer Swift X SFX14-51G-5876
Intel Core i5-1240P, GeForce RTX 3050 4GB Laptop GPU
1829 MB/s -39%
AIDA64 / CPU Queen
Acer Predator Triton 300 SE
Intel Core i9-12900H, GeForce RTX 3060 Laptop GPU
111168 Points +4%
Gigabyte Aero 14 OLED BMF
Intel Core i7-13700H, NVIDIA GeForce RTX 4050 Laptop GPU
107159 Points
Lenovo Yoga Pro 7 14IRH G8
Intel Core i7-13700H, NVIDIA GeForce RTX 4050 Laptop GPU
107064 Points 0%
MSI Stealth 14 Studio A13V
Intel Core i7-13700H, NVIDIA GeForce RTX 4050 Laptop GPU
105914 Points -1%
Asus Zephyrus G14 GA401QM
AMD Ryzen 9 5900HS, GeForce RTX 3060 Laptop GPU
103243 Points -4%
Average Intel Core i7-13700H
  (68763 - 107159, n=27)
97786 Points -9%
Average of class Multimedia
  (21547 - 134321, n=88, last 2 years)
92085 Points -14%
SCHENKER Vision 14 2022 RTX 3050 Ti
Intel Core i7-12700H, GeForce RTX 3050 Ti Laptop GPU
91588 Points -15%
Acer Swift X SFX14-51G-5876
Intel Core i5-1240P, GeForce RTX 3050 4GB Laptop GPU
74933 Points -30%
AIDA64 / FPU SinJulia
Asus Zephyrus G14 GA401QM
AMD Ryzen 9 5900HS, GeForce RTX 3060 Laptop GPU
12251 Points +41%
MSI Stealth 14 Studio A13V
Intel Core i7-13700H, NVIDIA GeForce RTX 4050 Laptop GPU
10457 Points +20%
Lenovo Yoga Pro 7 14IRH G8
Intel Core i7-13700H, NVIDIA GeForce RTX 4050 Laptop GPU
9710 Points +12%
Acer Predator Triton 300 SE
Intel Core i9-12900H, GeForce RTX 3060 Laptop GPU
9702 Points +11%
Average of class Multimedia
  (3099 - 15484, n=88, last 2 years)
9055 Points +4%
Average Intel Core i7-13700H
  (4800 - 11050, n=27)
8796 Points +1%
Gigabyte Aero 14 OLED BMF
Intel Core i7-13700H, NVIDIA GeForce RTX 4050 Laptop GPU
8708 Points
SCHENKER Vision 14 2022 RTX 3050 Ti
Intel Core i7-12700H, GeForce RTX 3050 Ti Laptop GPU
8278 Points -5%
Acer Swift X SFX14-51G-5876
Intel Core i5-1240P, GeForce RTX 3050 4GB Laptop GPU
5262 Points -40%
AIDA64 / FPU Mandel
Asus Zephyrus G14 GA401QM
AMD Ryzen 9 5900HS, GeForce RTX 3060 Laptop GPU
53430 Points +67%
MSI Stealth 14 Studio A13V
Intel Core i7-13700H, NVIDIA GeForce RTX 4050 Laptop GPU
41000 Points +28%
Acer Predator Triton 300 SE
Intel Core i9-12900H, GeForce RTX 3060 Laptop GPU
36920 Points +15%
Lenovo Yoga Pro 7 14IRH G8
Intel Core i7-13700H, NVIDIA GeForce RTX 4050 Laptop GPU
36674 Points +15%
Average Intel Core i7-13700H
  (12321 - 45118, n=27)
34225 Points +7%
Average of class Multimedia
  (9602 - 68591, n=88, last 2 years)
33558 Points +5%
Gigabyte Aero 14 OLED BMF
Intel Core i7-13700H, NVIDIA GeForce RTX 4050 Laptop GPU
31971 Points
SCHENKER Vision 14 2022 RTX 3050 Ti
Intel Core i7-12700H, GeForce RTX 3050 Ti Laptop GPU
30137 Points -6%
Acer Swift X SFX14-51G-5876
Intel Core i5-1240P, GeForce RTX 3050 4GB Laptop GPU
19131 Points -40%
AIDA64 / CPU AES
Asus Zephyrus G14 GA401QM
AMD Ryzen 9 5900HS, GeForce RTX 3060 Laptop GPU
132620 MB/s +18%
Acer Predator Triton 300 SE
Intel Core i9-12900H, GeForce RTX 3060 Laptop GPU
132544 MB/s +17%
Gigabyte Aero 14 OLED BMF
Intel Core i7-13700H, NVIDIA GeForce RTX 4050 Laptop GPU
112823 MB/s
Average Intel Core i7-13700H
  (28769 - 151254, n=27)
76256 MB/s -32%
MSI Stealth 14 Studio A13V
Intel Core i7-13700H, NVIDIA GeForce RTX 4050 Laptop GPU
76215 MB/s -32%
Average of class Multimedia
  (23702 - 169946, n=88, last 2 years)
76070 MB/s -33%
Lenovo Yoga Pro 7 14IRH G8
Intel Core i7-13700H, NVIDIA GeForce RTX 4050 Laptop GPU
72654 MB/s -36%
SCHENKER Vision 14 2022 RTX 3050 Ti
Intel Core i7-12700H, GeForce RTX 3050 Ti Laptop GPU
69002 MB/s -39%
Acer Swift X SFX14-51G-5876
Intel Core i5-1240P, GeForce RTX 3050 4GB Laptop GPU
39188 MB/s -65%
AIDA64 / CPU ZLib
MSI Stealth 14 Studio A13V
Intel Core i7-13700H, NVIDIA GeForce RTX 4050 Laptop GPU
1116 MB/s +33%
Lenovo Yoga Pro 7 14IRH G8
Intel Core i7-13700H, NVIDIA GeForce RTX 4050 Laptop GPU
1093 MB/s +30%
Acer Predator Triton 300 SE
Intel Core i9-12900H, GeForce RTX 3060 Laptop GPU
1029 MB/s +22%
SCHENKER Vision 14 2022 RTX 3050 Ti
Intel Core i7-12700H, GeForce RTX 3050 Ti Laptop GPU
962 MB/s +14%
Average Intel Core i7-13700H
  (389 - 1215, n=27)
936 MB/s +11%
Average of class Multimedia
  (302 - 1901, n=88, last 2 years)
868 MB/s +3%
Asus Zephyrus G14 GA401QM
AMD Ryzen 9 5900HS, GeForce RTX 3060 Laptop GPU
851 MB/s +1%
Gigabyte Aero 14 OLED BMF
Intel Core i7-13700H, NVIDIA GeForce RTX 4050 Laptop GPU
841 MB/s
Acer Swift X SFX14-51G-5876
Intel Core i5-1240P, GeForce RTX 3050 4GB Laptop GPU
539 MB/s -36%
AIDA64 / FP64 Ray-Trace
MSI Stealth 14 Studio A13V
Intel Core i7-13700H, NVIDIA GeForce RTX 4050 Laptop GPU
9072 KRay/s +31%
Acer Predator Triton 300 SE
Intel Core i9-12900H, GeForce RTX 3060 Laptop GPU
8122 KRay/s +17%
Lenovo Yoga Pro 7 14IRH G8
Intel Core i7-13700H, NVIDIA GeForce RTX 4050 Laptop GPU
7969 KRay/s +15%
Asus Zephyrus G14 GA401QM
AMD Ryzen 9 5900HS, GeForce RTX 3060 Laptop GPU
7772 KRay/s +12%
Average Intel Core i7-13700H
  (2540 - 10135, n=27)
7440 KRay/s +8%
Gigabyte Aero 14 OLED BMF
Intel Core i7-13700H, NVIDIA GeForce RTX 4050 Laptop GPU
6913 KRay/s
Average of class Multimedia
  (1996 - 14590, n=88, last 2 years)
6829 KRay/s -1%
SCHENKER Vision 14 2022 RTX 3050 Ti
Intel Core i7-12700H, GeForce RTX 3050 Ti Laptop GPU
6587 KRay/s -5%
Acer Swift X SFX14-51G-5876
Intel Core i5-1240P, GeForce RTX 3050 4GB Laptop GPU
4017 KRay/s -42%
AIDA64 / CPU PhotoWorxx
Gigabyte Aero 14 OLED BMF
Intel Core i7-13700H, NVIDIA GeForce RTX 4050 Laptop GPU
52727 MPixel/s
Acer Predator Triton 300 SE
Intel Core i9-12900H, GeForce RTX 3060 Laptop GPU
48269 MPixel/s -8%
Average Intel Core i7-13700H
  (19552 - 52727, n=27)
41296 MPixel/s -22%
Lenovo Yoga Pro 7 14IRH G8
Intel Core i7-13700H, NVIDIA GeForce RTX 4050 Laptop GPU
41106 MPixel/s -22%
Acer Swift X SFX14-51G-5876
Intel Core i5-1240P, GeForce RTX 3050 4GB Laptop GPU
37118 MPixel/s -30%
Average of class Multimedia
  (7419 - 53918, n=88, last 2 years)
36824 MPixel/s -30%
MSI Stealth 14 Studio A13V
Intel Core i7-13700H, NVIDIA GeForce RTX 4050 Laptop GPU
35953 MPixel/s -32%
SCHENKER Vision 14 2022 RTX 3050 Ti
Intel Core i7-12700H, GeForce RTX 3050 Ti Laptop GPU
29949 MPixel/s -43%
Asus Zephyrus G14 GA401QM
AMD Ryzen 9 5900HS, GeForce RTX 3060 Laptop GPU
15082 MPixel/s -71%

Desempenho do sistema

O notebook pequeno tem um bom desempenho nos benchmarks PCMark 10 e Crossmark. Somente na seção Criação de conteúdo digital o notebook de estúdio mostra alguma fraqueza e fica um pouco abaixo da média, com 9.627 pontos. No entanto, qualquer crítica a esse respeito seria um exagero, de modo que o notebook de 14 polegadas deve se adequar à finalidade pretendida sem problemas. O Aero 14 OLED lida rapidamente com a renderização de vídeo e 3D, bem como com a edição de imagens e outras tarefas.

PCMark 10 / Score
Acer Predator Triton 300 SE
GeForce RTX 3060 Laptop GPU, i9-12900H, Micron 3400 1TB MTFDKBA1T0TFH
7620 Points +5%
Lenovo Yoga Pro 7 14IRH G8
NVIDIA GeForce RTX 4050 Laptop GPU, i7-13700H, Samsung PM9A1 MZVL21T0HCLR
7292 Points 0%
Gigabyte Aero 14 OLED BMF
NVIDIA GeForce RTX 4050 Laptop GPU, i7-13700H, Gigabyte AG470S1TB-SI B10
7273 Points
Average Intel Core i7-13700H, NVIDIA GeForce RTX 4050 Laptop GPU
  (6822 - 7556, n=7)
7220 Points -1%
MSI Stealth 14 Studio A13V
NVIDIA GeForce RTX 4050 Laptop GPU, i7-13700H, Samsung PM9A1 MZVL21T0HCLR
6924 Points -5%
Asus Zephyrus G14 GA401QM
GeForce RTX 3060 Laptop GPU, R9 5900HS, SK Hynix HFM001TD3JX013N
6773 Points -7%
SCHENKER Vision 14 2022 RTX 3050 Ti
GeForce RTX 3050 Ti Laptop GPU, i7-12700H, Samsung SSD 980 Pro 1TB MZ-V8P1T0BW
6623 Points -9%
Average of class Multimedia
  (4635 - 8670, n=85, last 2 years)
6602 Points -9%
Acer Swift X SFX14-51G-5876
GeForce RTX 3050 4GB Laptop GPU, i5-1240P, Micron 3400 MTFDKBA512TFH 512GB
5863 Points -19%
PCMark 10 / Essentials
Gigabyte Aero 14 OLED BMF
NVIDIA GeForce RTX 4050 Laptop GPU, i7-13700H, Gigabyte AG470S1TB-SI B10
11549 Points
Acer Predator Triton 300 SE
GeForce RTX 3060 Laptop GPU, i9-12900H, Micron 3400 1TB MTFDKBA1T0TFH
11132 Points -4%
Average Intel Core i7-13700H, NVIDIA GeForce RTX 4050 Laptop GPU
  (10283 - 11549, n=7)
10915 Points -5%
Lenovo Yoga Pro 7 14IRH G8
NVIDIA GeForce RTX 4050 Laptop GPU, i7-13700H, Samsung PM9A1 MZVL21T0HCLR
10861 Points -6%
Average of class Multimedia
  (8480 - 12420, n=85, last 2 years)
10473 Points -9%
SCHENKER Vision 14 2022 RTX 3050 Ti
GeForce RTX 3050 Ti Laptop GPU, i7-12700H, Samsung SSD 980 Pro 1TB MZ-V8P1T0BW
10440 Points -10%
Asus Zephyrus G14 GA401QM
GeForce RTX 3060 Laptop GPU, R9 5900HS, SK Hynix HFM001TD3JX013N
10418 Points -10%
MSI Stealth 14 Studio A13V
NVIDIA GeForce RTX 4050 Laptop GPU, i7-13700H, Samsung PM9A1 MZVL21T0HCLR
10283 Points -11%
Acer Swift X SFX14-51G-5876
GeForce RTX 3050 4GB Laptop GPU, i5-1240P, Micron 3400 MTFDKBA512TFH 512GB
8996 Points -22%
PCMark 10 / Productivity
Acer Predator Triton 300 SE
GeForce RTX 3060 Laptop GPU, i9-12900H, Micron 3400 1TB MTFDKBA1T0TFH
10097 Points +8%
Asus Zephyrus G14 GA401QM
GeForce RTX 3060 Laptop GPU, R9 5900HS, SK Hynix HFM001TD3JX013N
9394 Points 0%
Gigabyte Aero 14 OLED BMF
NVIDIA GeForce RTX 4050 Laptop GPU, i7-13700H, Gigabyte AG470S1TB-SI B10
9390 Points
Lenovo Yoga Pro 7 14IRH G8
NVIDIA GeForce RTX 4050 Laptop GPU, i7-13700H, Samsung PM9A1 MZVL21T0HCLR
9274 Points -1%
Average Intel Core i7-13700H, NVIDIA GeForce RTX 4050 Laptop GPU
  (8368 - 9836, n=7)
9245 Points -2%
Average of class Multimedia
  (5845 - 11186, n=85, last 2 years)
8709 Points -7%
SCHENKER Vision 14 2022 RTX 3050 Ti
GeForce RTX 3050 Ti Laptop GPU, i7-12700H, Samsung SSD 980 Pro 1TB MZ-V8P1T0BW
8530 Points -9%
Acer Swift X SFX14-51G-5876
GeForce RTX 3050 4GB Laptop GPU, i5-1240P, Micron 3400 MTFDKBA512TFH 512GB
8510 Points -9%
MSI Stealth 14 Studio A13V
NVIDIA GeForce RTX 4050 Laptop GPU, i7-13700H, Samsung PM9A1 MZVL21T0HCLR
8368 Points -11%
PCMark 10 / Digital Content Creation
Acer Predator Triton 300 SE
GeForce RTX 3060 Laptop GPU, i9-12900H, Micron 3400 1TB MTFDKBA1T0TFH
10682 Points +11%
MSI Stealth 14 Studio A13V
NVIDIA GeForce RTX 4050 Laptop GPU, i7-13700H, Samsung PM9A1 MZVL21T0HCLR
10472 Points +9%
Lenovo Yoga Pro 7 14IRH G8
NVIDIA GeForce RTX 4050 Laptop GPU, i7-13700H, Samsung PM9A1 MZVL21T0HCLR
10447 Points +9%
Average Intel Core i7-13700H, NVIDIA GeForce RTX 4050 Laptop GPU
  (9527 - 10643, n=7)
10142 Points +5%
Gigabyte Aero 14 OLED BMF
NVIDIA GeForce RTX 4050 Laptop GPU, i7-13700H, Gigabyte AG470S1TB-SI B10
9627 Points
SCHENKER Vision 14 2022 RTX 3050 Ti
GeForce RTX 3050 Ti Laptop GPU, i7-12700H, Samsung SSD 980 Pro 1TB MZ-V8P1T0BW
8855 Points -8%
Average of class Multimedia
  (4688 - 13548, n=85, last 2 years)
8686 Points -10%
Asus Zephyrus G14 GA401QM
GeForce RTX 3060 Laptop GPU, R9 5900HS, SK Hynix HFM001TD3JX013N
8615 Points -11%
Acer Swift X SFX14-51G-5876
GeForce RTX 3050 4GB Laptop GPU, i5-1240P, Micron 3400 MTFDKBA512TFH 512GB
7146 Points -26%
CrossMark / Overall
Acer Predator Triton 300 SE
GeForce RTX 3060 Laptop GPU, i9-12900H, Micron 3400 1TB MTFDKBA1T0TFH
1971 Points +7%
Gigabyte Aero 14 OLED BMF
NVIDIA GeForce RTX 4050 Laptop GPU, i7-13700H, Gigabyte AG470S1TB-SI B10
1842 Points
Lenovo Yoga Pro 7 14IRH G8
NVIDIA GeForce RTX 4050 Laptop GPU, i7-13700H, Samsung PM9A1 MZVL21T0HCLR
1787 Points -3%
MSI Stealth 14 Studio A13V
NVIDIA GeForce RTX 4050 Laptop GPU, i7-13700H, Samsung PM9A1 MZVL21T0HCLR
1734 Points -6%
Average Intel Core i7-13700H, NVIDIA GeForce RTX 4050 Laptop GPU
  (1205 - 1937, n=9)
1733 Points -6%
Average of class Multimedia
  (1009 - 2146, n=91, last 2 years)
1701 Points -8%
SCHENKER Vision 14 2022 RTX 3050 Ti
GeForce RTX 3050 Ti Laptop GPU, i7-12700H, Samsung SSD 980 Pro 1TB MZ-V8P1T0BW
1654 Points -10%
Acer Swift X SFX14-51G-5876
GeForce RTX 3050 4GB Laptop GPU, i5-1240P, Micron 3400 MTFDKBA512TFH 512GB
1548 Points -16%
CrossMark / Productivity
Acer Predator Triton 300 SE
GeForce RTX 3060 Laptop GPU, i9-12900H, Micron 3400 1TB MTFDKBA1T0TFH
1877 Points +5%
Gigabyte Aero 14 OLED BMF
NVIDIA GeForce RTX 4050 Laptop GPU, i7-13700H, Gigabyte AG470S1TB-SI B10
1793 Points
Lenovo Yoga Pro 7 14IRH G8
NVIDIA GeForce RTX 4050 Laptop GPU, i7-13700H, Samsung PM9A1 MZVL21T0HCLR
1679 Points -6%
Average Intel Core i7-13700H, NVIDIA GeForce RTX 4050 Laptop GPU
  (1158 - 1877, n=9)
1650 Points -8%
MSI Stealth 14 Studio A13V
NVIDIA GeForce RTX 4050 Laptop GPU, i7-13700H, Samsung PM9A1 MZVL21T0HCLR
1631 Points -9%
SCHENKER Vision 14 2022 RTX 3050 Ti
GeForce RTX 3050 Ti Laptop GPU, i7-12700H, Samsung SSD 980 Pro 1TB MZ-V8P1T0BW
1625 Points -9%
Average of class Multimedia
  (971 - 2064, n=91, last 2 years)
1622 Points -10%
Acer Swift X SFX14-51G-5876
GeForce RTX 3050 4GB Laptop GPU, i5-1240P, Micron 3400 MTFDKBA512TFH 512GB
1523 Points -15%
CrossMark / Creativity
Acer Predator Triton 300 SE
GeForce RTX 3060 Laptop GPU, i9-12900H, Micron 3400 1TB MTFDKBA1T0TFH
2107 Points +9%
Lenovo Yoga Pro 7 14IRH G8
NVIDIA GeForce RTX 4050 Laptop GPU, i7-13700H, Samsung PM9A1 MZVL21T0HCLR
2044 Points +6%
Gigabyte Aero 14 OLED BMF
NVIDIA GeForce RTX 4050 Laptop GPU, i7-13700H, Gigabyte AG470S1TB-SI B10
1925 Points
MSI Stealth 14 Studio A13V
NVIDIA GeForce RTX 4050 Laptop GPU, i7-13700H, Samsung PM9A1 MZVL21T0HCLR
1909 Points -1%
Average of class Multimedia
  (1054 - 2865, n=91, last 2 years)
1893 Points -2%
Average Intel Core i7-13700H, NVIDIA GeForce RTX 4050 Laptop GPU
  (1293 - 2044, n=9)
1866 Points -3%
SCHENKER Vision 14 2022 RTX 3050 Ti
GeForce RTX 3050 Ti Laptop GPU, i7-12700H, Samsung SSD 980 Pro 1TB MZ-V8P1T0BW
1727 Points -10%
Acer Swift X SFX14-51G-5876
GeForce RTX 3050 4GB Laptop GPU, i5-1240P, Micron 3400 MTFDKBA512TFH 512GB
1579 Points -18%
CrossMark / Responsiveness
Acer Predator Triton 300 SE
GeForce RTX 3060 Laptop GPU, i9-12900H, Micron 3400 1TB MTFDKBA1T0TFH
1869 Points +8%
Gigabyte Aero 14 OLED BMF
NVIDIA GeForce RTX 4050 Laptop GPU, i7-13700H, Gigabyte AG470S1TB-SI B10
1725 Points
Average Intel Core i7-13700H, NVIDIA GeForce RTX 4050 Laptop GPU
  (1097 - 1929, n=9)
1608 Points -7%
MSI Stealth 14 Studio A13V
NVIDIA GeForce RTX 4050 Laptop GPU, i7-13700H, Samsung PM9A1 MZVL21T0HCLR
1560 Points -10%
Acer Swift X SFX14-51G-5876
GeForce RTX 3050 4GB Laptop GPU, i5-1240P, Micron 3400 MTFDKBA512TFH 512GB
1535 Points -11%
SCHENKER Vision 14 2022 RTX 3050 Ti
GeForce RTX 3050 Ti Laptop GPU, i7-12700H, Samsung SSD 980 Pro 1TB MZ-V8P1T0BW
1531 Points -11%
Average of class Multimedia
  (926 - 2171, n=91, last 2 years)
1462 Points -15%
Lenovo Yoga Pro 7 14IRH G8
NVIDIA GeForce RTX 4050 Laptop GPU, i7-13700H, Samsung PM9A1 MZVL21T0HCLR
1437 Points -17%
PCMark 10 Score
7273 pontos
Ajuda
AIDA64 / Memory Copy
Gigabyte Aero 14 OLED BMF
Intel Core i7-13700H, NVIDIA GeForce RTX 4050 Laptop GPU
78081 MB/s
Acer Predator Triton 300 SE
Intel Core i9-12900H, GeForce RTX 3060 Laptop GPU
73354 MB/s -6%
Lenovo Yoga Pro 7 14IRH G8
Intel Core i7-13700H, NVIDIA GeForce RTX 4050 Laptop GPU
64736 MB/s -17%
Average Intel Core i7-13700H
  (40018 - 78081, n=27)
63892 MB/s -18%
Average of class Multimedia
  (20513 - 94254, n=88, last 2 years)
61455 MB/s -21%
MSI Stealth 14 Studio A13V
Intel Core i7-13700H, NVIDIA GeForce RTX 4050 Laptop GPU
60487 MB/s -23%
Acer Swift X SFX14-51G-5876
Intel Core i5-1240P, GeForce RTX 3050 4GB Laptop GPU
57659 MB/s -26%
SCHENKER Vision 14 2022 RTX 3050 Ti
Intel Core i7-12700H, GeForce RTX 3050 Ti Laptop GPU
47829 MB/s -39%
Asus Zephyrus G14 GA401QM
AMD Ryzen 9 5900HS, GeForce RTX 3060 Laptop GPU
37979 MB/s -51%
AIDA64 / Memory Read
Gigabyte Aero 14 OLED BMF
Intel Core i7-13700H, NVIDIA GeForce RTX 4050 Laptop GPU
79656 MB/s
Acer Predator Triton 300 SE
Intel Core i9-12900H, GeForce RTX 3060 Laptop GPU
74642 MB/s -6%
MSI Stealth 14 Studio A13V
Intel Core i7-13700H, NVIDIA GeForce RTX 4050 Laptop GPU
69259 MB/s -13%
Lenovo Yoga Pro 7 14IRH G8
Intel Core i7-13700H, NVIDIA GeForce RTX 4050 Laptop GPU
68847 MB/s -14%
Average Intel Core i7-13700H
  (44583 - 79656, n=27)
67456 MB/s -15%
Acer Swift X SFX14-51G-5876
Intel Core i5-1240P, GeForce RTX 3050 4GB Laptop GPU
66631 MB/s -16%
Average of class Multimedia
  (22917 - 90142, n=88, last 2 years)
60555 MB/s -24%
Asus Zephyrus G14 GA401QM
AMD Ryzen 9 5900HS, GeForce RTX 3060 Laptop GPU
42968 MB/s -46%
SCHENKER Vision 14 2022 RTX 3050 Ti
Intel Core i7-12700H, GeForce RTX 3050 Ti Laptop GPU
37476 MB/s -53%
AIDA64 / Memory Write
Gigabyte Aero 14 OLED BMF
Intel Core i7-13700H, NVIDIA GeForce RTX 4050 Laptop GPU
92353 MB/s
Average Intel Core i7-13700H
  (42710 - 99898, n=27)
70383 MB/s -24%
Lenovo Yoga Pro 7 14IRH G8
Intel Core i7-13700H, NVIDIA GeForce RTX 4050 Laptop GPU
70038 MB/s -24%
Average of class Multimedia
  (20226 - 95196, n=88, last 2 years)
63628 MB/s -31%
Acer Predator Triton 300 SE
Intel Core i9-12900H, GeForce RTX 3060 Laptop GPU
63565 MB/s -31%
Acer Swift X SFX14-51G-5876
Intel Core i5-1240P, GeForce RTX 3050 4GB Laptop GPU
56984 MB/s -38%
MSI Stealth 14 Studio A13V
Intel Core i7-13700H, NVIDIA GeForce RTX 4050 Laptop GPU
50091 MB/s -46%
SCHENKER Vision 14 2022 RTX 3050 Ti
Intel Core i7-12700H, GeForce RTX 3050 Ti Laptop GPU
47179 MB/s -49%
Asus Zephyrus G14 GA401QM
AMD Ryzen 9 5900HS, GeForce RTX 3060 Laptop GPU
35272 MB/s -62%
AIDA64 / Memory Latency
Acer Swift X SFX14-51G-5876
Intel Core i5-1240P, GeForce RTX 3050 4GB Laptop GPU
117.9 ns * -27%
Lenovo Yoga Pro 7 14IRH G8
Intel Core i7-13700H, NVIDIA GeForce RTX 4050 Laptop GPU
103.5 ns * -11%
Average of class Multimedia
  (75 - 346, n=87, last 2 years)
102.3 ns * -10%
Acer Predator Triton 300 SE
Intel Core i9-12900H, GeForce RTX 3060 Laptop GPU
101.7 ns * -9%
Average Intel Core i7-13700H
  (82.4 - 136.8, n=27)
94.3 ns * -2%
Gigabyte Aero 14 OLED BMF
Intel Core i7-13700H, NVIDIA GeForce RTX 4050 Laptop GPU
92.9 ns *
SCHENKER Vision 14 2022 RTX 3050 Ti
Intel Core i7-12700H, GeForce RTX 3050 Ti Laptop GPU
92.7 ns * -0%
MSI Stealth 14 Studio A13V
Intel Core i7-13700H, NVIDIA GeForce RTX 4050 Laptop GPU
86.8 ns * +7%
Asus Zephyrus G14 GA401QM
AMD Ryzen 9 5900HS, GeForce RTX 3060 Laptop GPU
78.7 ns * +15%

* ... smaller is better

Latência DPC

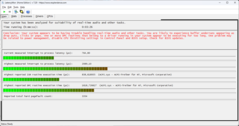
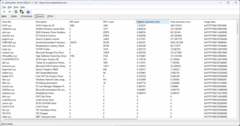
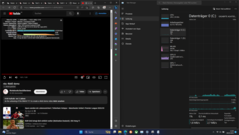
Para os criadores de conteúdo que executam podcasts ou transmissões ao vivo, as latências DPC relativamente altas medidas provavelmente serão um grande ponto de crítica. Com sua configuração de driver atual no momento do teste, o Aero 14 OLED dificilmente é adequado para edição de áudio ou vídeo em tempo real. Por outro lado, nosso vídeo de teste do YouTube em 4K 60Hz foi executado sem nenhuma queda de quadros.

LatencyMon
LatencyMon
Drivers LatencyMon
Drivers LatencyMon
Reprodução de vídeo do YouTube
DPC Latencies / LatencyMon - interrupt to process latency (max), Web, Youtube, Prime95
Asus Zephyrus G14 GA401QM
GeForce RTX 3060 Laptop GPU, R9 5900HS, SK Hynix HFM001TD3JX013N
5542 μs * -165%
Acer Predator Triton 300 SE
GeForce RTX 3060 Laptop GPU, i9-12900H, Micron 3400 1TB MTFDKBA1T0TFH
2698.9 μs * -29%
Gigabyte Aero 14 OLED BMF
NVIDIA GeForce RTX 4050 Laptop GPU, i7-13700H, Gigabyte AG470S1TB-SI B10
2089.1 μs *
MSI Stealth 14 Studio A13V
NVIDIA GeForce RTX 4050 Laptop GPU, i7-13700H, Samsung PM9A1 MZVL21T0HCLR
1558.8 μs * +25%
Lenovo Yoga Pro 7 14IRH G8
NVIDIA GeForce RTX 4050 Laptop GPU, i7-13700H, Samsung PM9A1 MZVL21T0HCLR
925.8 μs * +56%
SCHENKER Vision 14 2022 RTX 3050 Ti
GeForce RTX 3050 Ti Laptop GPU, i7-12700H, Samsung SSD 980 Pro 1TB MZ-V8P1T0BW
868.4 μs * +58%
Acer Swift X SFX14-51G-5876
GeForce RTX 3050 4GB Laptop GPU, i5-1240P, Micron 3400 MTFDKBA512TFH 512GB
521.6 μs * +75%

* ... smaller is better

Dispositivos de armazenamento

SSD Gigabyte AG470S1TB-SI B10 NVMe

A Gigabyte instala seu próprio SSD NVMe no Aero 14 OLED. OGigabyte AG470S1TB-SI B10apresenta boas taxas de transferência e não precisa se esquivar dos elogiados SSDs Samsung 980 Pro. Eles são mais rápidos na leitura sequencial, mas o SSD da Gigabyte tem uma clara vantagem nas tarefas aleatórias que são mais comuns no uso diário. Acima de tudo, a SSD no Aero 14 OLED é capaz de manter o alto desempenho por períodos mais longos, como mostra o DiskSpd Loop. Entre outras coisas, a almofada térmica na parte inferior do gabinete contribui para isso e mantém o disco rígido em baixas temperaturas de operação.

Gigabyte AG470S1TB-SI B10
Sequential Read: 4493.54MB/s
Sequential Write: 4062.33MB/s
4K Read: 80.14MB/s
4K Write: 206.22MB/s
4K-64 Read: 2733.5MB/s
4K-64 Write: 2592.88MB/s
Access Time Read: 0.061ms
Access Time Write: 0.018ms
Copy ISO: 1272.39MB/s
Copy Program: 853.83MB/s
Copy Game: 2044.29MB/s
Score Read: 3263Points
Score Write: 3205Points
Score Total: 8118Points
Drive Performance Rating - Percent
MSI Stealth 14 Studio A13V
Samsung PM9A1 MZVL21T0HCLR
91.1 pt
SCHENKER Vision 14 2022 RTX 3050 Ti
Samsung SSD 980 Pro 1TB MZ-V8P1T0BW
88.4 pt
Average Gigabyte AG470S1TB-SI B10
 
87.3 pt
Gigabyte Aero 14 OLED BMF
Gigabyte AG470S1TB-SI B10
81.3 pt
Acer Predator Triton 300 SE -11!
Micron 3400 1TB MTFDKBA1T0TFH
75.8 pt
Lenovo Yoga Pro 7 14IRH G8
Samsung PM9A1 MZVL21T0HCLR
67.6 pt
Acer Swift X SFX14-51G-5876
Micron 3400 MTFDKBA512TFH 512GB
66.1 pt
Average of class Multimedia
 
57.3 pt
Asus Zephyrus G14 GA401QM
SK Hynix HFM001TD3JX013N
47 pt
DiskSpd
seq read
MSI Stealth 14 Studio A13V
Samsung PM9A1 MZVL21T0HCLR
4040 (4016.61min - 4040.26max) MB/s +56%
SCHENKER Vision 14 2022 RTX 3050 Ti
Samsung SSD 980 Pro 1TB MZ-V8P1T0BW
3878 (3830.24min - 3878.26max) MB/s +50%
Lenovo Yoga Pro 7 14IRH G8
Samsung PM9A1 MZVL21T0HCLR
3626 (3582.77min - 3626.19max) MB/s +40%
Average Gigabyte AG470S1TB-SI B10
  (2519 - 4224, n=10)
3439 MB/s +33%
Average of class Multimedia
  (756 - 4861, n=87, last 2 years)
2872 MB/s +11%
Acer Predator Triton 300 SE
Micron 3400 1TB MTFDKBA1T0TFH
2762 (2451.7min - 2761.95max) MB/s +7%
Gigabyte Aero 14 OLED BMF
Gigabyte AG470S1TB-SI B10
2582 (2345.38min - 2582.01max) MB/s
Acer Swift X SFX14-51G-5876
Micron 3400 MTFDKBA512TFH 512GB
2093 (2049.55min - 2093.38max) MB/s -19%
Asus Zephyrus G14 GA401QM
SK Hynix HFM001TD3JX013N
1984 (1970.32min - 1984.33max) MB/s -23%
seq write
MSI Stealth 14 Studio A13V
Samsung PM9A1 MZVL21T0HCLR
4277 (4221.99min - 4277.39max) MB/s +91%
SCHENKER Vision 14 2022 RTX 3050 Ti
Samsung SSD 980 Pro 1TB MZ-V8P1T0BW
4000 (3970.36min - 3999.69max) MB/s +79%
Acer Swift X SFX14-51G-5876
Micron 3400 MTFDKBA512TFH 512GB
3933 (3781.36min - 3933.21max) MB/s +76%
Lenovo Yoga Pro 7 14IRH G8
Samsung PM9A1 MZVL21T0HCLR
3440 (3380.56min - 3439.75max) MB/s +54%
Acer Predator Triton 300 SE
Micron 3400 1TB MTFDKBA1T0TFH
3266 (1415.26min - 3266.31max) MB/s +46%
Average Gigabyte AG470S1TB-SI B10
  (2200 - 4236, n=10)
3133 MB/s +40%
Average of class Multimedia
  (790 - 5709, n=87, last 2 years)
2977 MB/s +33%
Asus Zephyrus G14 GA401QM
SK Hynix HFM001TD3JX013N
2413 (2401.89min - 2412.77max) MB/s +8%
Gigabyte Aero 14 OLED BMF
Gigabyte AG470S1TB-SI B10
2236 (2165.59min - 2236.4max) MB/s
seq q8 t1 read
MSI Stealth 14 Studio A13V
Samsung PM9A1 MZVL21T0HCLR
7037 (6407.22min - 7036.55max) MB/s +2%
Average Gigabyte AG470S1TB-SI B10
  (6864 - 7112, n=10)
6974 MB/s +2%
SCHENKER Vision 14 2022 RTX 3050 Ti
Samsung SSD 980 Pro 1TB MZ-V8P1T0BW
6876 (6162.32min - 6876.44max) MB/s 0%
Gigabyte Aero 14 OLED BMF
Gigabyte AG470S1TB-SI B10
6868 (5469.58min - 6868.07max) MB/s
Acer Swift X SFX14-51G-5876
Micron 3400 MTFDKBA512TFH 512GB
6487 (6012.88min - 6487.33max) MB/s -6%
Acer Predator Triton 300 SE
Micron 3400 1TB MTFDKBA1T0TFH
6449 (5531.66min - 6449.16max) MB/s -6%
Lenovo Yoga Pro 7 14IRH G8
Samsung PM9A1 MZVL21T0HCLR
6067 (5416.73min - 6067.48max) MB/s -12%
Average of class Multimedia
  (1023 - 7121, n=87, last 2 years)
5217 MB/s -24%
Asus Zephyrus G14 GA401QM
SK Hynix HFM001TD3JX013N
3595 (1909.83min - 3594.73max) MB/s -48%
seq q8 t1 write
MSI Stealth 14 Studio A13V
Samsung PM9A1 MZVL21T0HCLR
5248 (5190.35min - 5248.12max) MB/s +40%
Lenovo Yoga Pro 7 14IRH G8
Samsung PM9A1 MZVL21T0HCLR
5030 (5013.03min - 5029.6max) MB/s +34%
SCHENKER Vision 14 2022 RTX 3050 Ti
Samsung SSD 980 Pro 1TB MZ-V8P1T0BW
4970 (4966.69min - 4970.17max) MB/s +33%
Acer Predator Triton 300 SE
Micron 3400 1TB MTFDKBA1T0TFH
4606 (4445.88min - 4605.99max) MB/s +23%
Average Gigabyte AG470S1TB-SI B10
  (3611 - 4999, n=10)
4259 MB/s +14%
Acer Swift X SFX14-51G-5876
Micron 3400 MTFDKBA512TFH 512GB
3952 (3821.85min - 3951.94max) MB/s +6%
Average of class Multimedia
  (871 - 6761, n=87, last 2 years)
3947 MB/s +5%
Gigabyte Aero 14 OLED BMF
Gigabyte AG470S1TB-SI B10
3742 (3596.76min - 3741.95max) MB/s
Asus Zephyrus G14 GA401QM
SK Hynix HFM001TD3JX013N
3098 (2842.48min - 3098.43max) MB/s -17%
4k q1 t1 read
SCHENKER Vision 14 2022 RTX 3050 Ti
Samsung SSD 980 Pro 1TB MZ-V8P1T0BW
88.6 (88.22min - 88.59max) MB/s +14%
Lenovo Yoga Pro 7 14IRH G8
Samsung PM9A1 MZVL21T0HCLR
81.4 (79.86min - 81.36max) MB/s +4%
MSI Stealth 14 Studio A13V
Samsung PM9A1 MZVL21T0HCLR
81.2 (79.79min - 81.21max) MB/s +4%
Gigabyte Aero 14 OLED BMF
Gigabyte AG470S1TB-SI B10
77.9 (72.17min - 77.89max) MB/s
Average Gigabyte AG470S1TB-SI B10
  (55 - 91, n=10)
75.6 MB/s -3%
Acer Predator Triton 300 SE
Micron 3400 1TB MTFDKBA1T0TFH
70.5 (68.62min - 70.48max) MB/s -9%
Acer Swift X SFX14-51G-5876
Micron 3400 MTFDKBA512TFH 512GB
65.8 (34.98min - 65.78max) MB/s -16%
Average of class Multimedia
  (14.6 - 149.1, n=87, last 2 years)
64.5 MB/s -17%
Asus Zephyrus G14 GA401QM
SK Hynix HFM001TD3JX013N
55 (54.78min - 54.95max) MB/s -29%
4k q1 t1 write
Average Gigabyte AG470S1TB-SI B10
  (201 - 391, n=10)
324 MB/s +4%
Gigabyte Aero 14 OLED BMF
Gigabyte AG470S1TB-SI B10
313 (305.92min - 312.76max) MB/s
Acer Predator Triton 300 SE
Micron 3400 1TB MTFDKBA1T0TFH
259 (255.34min - 258.92max) MB/s -17%
MSI Stealth 14 Studio A13V
Samsung PM9A1 MZVL21T0HCLR
237 (234.46min - 236.6max) MB/s -24%
SCHENKER Vision 14 2022 RTX 3050 Ti
Samsung SSD 980 Pro 1TB MZ-V8P1T0BW
224 (221.2min - 223.61max) MB/s -28%
Average of class Multimedia
  (80.9 - 378, n=87, last 2 years)
178.7 MB/s -43%
Lenovo Yoga Pro 7 14IRH G8
Samsung PM9A1 MZVL21T0HCLR
142.8 (136.31min - 142.75max) MB/s -54%
Asus Zephyrus G14 GA401QM
SK Hynix HFM001TD3JX013N
132 (131.89min - 132.32max) MB/s -58%
Acer Swift X SFX14-51G-5876
Micron 3400 MTFDKBA512TFH 512GB
121.2 (118.65min - 121.24max) MB/s -61%
4k q32 t16 read
Gigabyte Aero 14 OLED BMF
Gigabyte AG470S1TB-SI B10
3543 (3531.54min - 3542.72max) MB/s
Average Gigabyte AG470S1TB-SI B10
  (3318 - 3583, n=10)
3521 MB/s -1%
SCHENKER Vision 14 2022 RTX 3050 Ti
Samsung SSD 980 Pro 1TB MZ-V8P1T0BW
3484 (3457.82min - 3484.34max) MB/s -2%
MSI Stealth 14 Studio A13V
Samsung PM9A1 MZVL21T0HCLR
3387 (3233.01min - 3387.37max) MB/s -4%
Acer Predator Triton 300 SE
Micron 3400 1TB MTFDKBA1T0TFH
2816 (2326.5min - 2816.32max) MB/s -21%
Asus Zephyrus G14 GA401QM
SK Hynix HFM001TD3JX013N
1401 (1395.61min - 1400.83max) MB/s -60%
Average of class Multimedia
  (416 - 4358, n=87, last 2 years)
1350 MB/s -62%
Acer Swift X SFX14-51G-5876
Micron 3400 MTFDKBA512TFH 512GB
1108 (1102.86min - 1108.16max) MB/s -69%
Lenovo Yoga Pro 7 14IRH G8
Samsung PM9A1 MZVL21T0HCLR
1006 (1000.34min - 1005.79max) MB/s -72%
4k q32 t16 write
Gigabyte Aero 14 OLED BMF
Gigabyte AG470S1TB-SI B10
3594 (3143.37min - 3593.51max) MB/s
MSI Stealth 14 Studio A13V
Samsung PM9A1 MZVL21T0HCLR
3545 (3517.45min - 3544.52max) MB/s -1%
Average Gigabyte AG470S1TB-SI B10
  (2584 - 3667, n=10)
3502 MB/s -3%
SCHENKER Vision 14 2022 RTX 3050 Ti
Samsung SSD 980 Pro 1TB MZ-V8P1T0BW
2554 (2537.7min - 2554.39max) MB/s -29%
Acer Swift X SFX14-51G-5876
Micron 3400 MTFDKBA512TFH 512GB
2494 (1643.28min - 2494.15max) MB/s -31%
Acer Predator Triton 300 SE
Micron 3400 1TB MTFDKBA1T0TFH
1556 (1408.86min - 1555.81max) MB/s -57%
Average of class Multimedia
  (192.1 - 4074, n=87, last 2 years)
1067 MB/s -70%
Asus Zephyrus G14 GA401QM
SK Hynix HFM001TD3JX013N
515 (512.99min - 514.96max) MB/s -86%
Lenovo Yoga Pro 7 14IRH G8
Samsung PM9A1 MZVL21T0HCLR
515 (507.16min - 514.77max) MB/s -86%
AS SSD
Score Total
MSI Stealth 14 Studio A13V
Samsung PM9A1 MZVL21T0HCLR
8719 Points +7%
Average Gigabyte AG470S1TB-SI B10
  (5636 - 10783, n=10)
8549 Points +5%
SCHENKER Vision 14 2022 RTX 3050 Ti
Samsung SSD 980 Pro 1TB MZ-V8P1T0BW
8363 Points +3%
Gigabyte Aero 14 OLED BMF
Gigabyte AG470S1TB-SI B10
8118 Points
Acer Swift X SFX14-51G-5876
Micron 3400 MTFDKBA512TFH 512GB
5734 Points -29%
Lenovo Yoga Pro 7 14IRH G8
Samsung PM9A1 MZVL21T0HCLR
5491 Points -32%
Asus Zephyrus G14 GA401QM
SK Hynix HFM001TD3JX013N
5088 Points -37%
Average of class Multimedia
  (2010 - 9972, n=84, last 2 years)
5067 Points -38%
Score Read
MSI Stealth 14 Studio A13V
Samsung PM9A1 MZVL21T0HCLR
3275 Points 0%
Gigabyte Aero 14 OLED BMF
Gigabyte AG470S1TB-SI B10
3263 Points
Average Gigabyte AG470S1TB-SI B10
  (1805 - 3629, n=10)
3256 Points 0%
SCHENKER Vision 14 2022 RTX 3050 Ti
Samsung SSD 980 Pro 1TB MZ-V8P1T0BW
3090 Points -5%
Acer Swift X SFX14-51G-5876
Micron 3400 MTFDKBA512TFH 512GB
1898 Points -42%
Asus Zephyrus G14 GA401QM
SK Hynix HFM001TD3JX013N
1742 Points -47%
Average of class Multimedia
  (669 - 3501, n=84, last 2 years)
1695 Points -48%
Lenovo Yoga Pro 7 14IRH G8
Samsung PM9A1 MZVL21T0HCLR
1465 Points -55%
Score Write
MSI Stealth 14 Studio A13V
Samsung PM9A1 MZVL21T0HCLR
3821 Points +19%
SCHENKER Vision 14 2022 RTX 3050 Ti
Samsung SSD 980 Pro 1TB MZ-V8P1T0BW
3765 Points +17%
Average Gigabyte AG470S1TB-SI B10
  (2849 - 5339, n=10)
3713 Points +16%
Lenovo Yoga Pro 7 14IRH G8
Samsung PM9A1 MZVL21T0HCLR
3367 Points +5%
Gigabyte Aero 14 OLED BMF
Gigabyte AG470S1TB-SI B10
3205 Points
Acer Swift X SFX14-51G-5876
Micron 3400 MTFDKBA512TFH 512GB
2912 Points -9%
Average of class Multimedia
  (545 - 4813, n=84, last 2 years)
2567 Points -20%
Asus Zephyrus G14 GA401QM
SK Hynix HFM001TD3JX013N
2505 Points -22%
Seq Read
MSI Stealth 14 Studio A13V
Samsung PM9A1 MZVL21T0HCLR
5552 MB/s +24%
SCHENKER Vision 14 2022 RTX 3050 Ti
Samsung SSD 980 Pro 1TB MZ-V8P1T0BW
5315 MB/s +18%
Average Gigabyte AG470S1TB-SI B10
  (4494 - 5715, n=10)
5048 MB/s +12%
Lenovo Yoga Pro 7 14IRH G8
Samsung PM9A1 MZVL21T0HCLR
5017 MB/s +12%
Acer Swift X SFX14-51G-5876
Micron 3400 MTFDKBA512TFH 512GB
4704.18 MB/s +5%
Gigabyte Aero 14 OLED BMF
Gigabyte AG470S1TB-SI B10
4493.54 MB/s
Average of class Multimedia
  (1192 - 5730, n=84, last 2 years)
4005 MB/s -11%
Asus Zephyrus G14 GA401QM
SK Hynix HFM001TD3JX013N
2923 MB/s -35%
Seq Write
MSI Stealth 14 Studio A13V
Samsung PM9A1 MZVL21T0HCLR
4474 MB/s +10%
Gigabyte Aero 14 OLED BMF
Gigabyte AG470S1TB-SI B10
4062.33 MB/s
SCHENKER Vision 14 2022 RTX 3050 Ti
Samsung SSD 980 Pro 1TB MZ-V8P1T0BW
3766 MB/s -7%
Acer Swift X SFX14-51G-5876
Micron 3400 MTFDKBA512TFH 512GB
3592.34 MB/s -12%
Average Gigabyte AG470S1TB-SI B10
  (1891 - 4476, n=10)
3202 MB/s -21%
Lenovo Yoga Pro 7 14IRH G8
Samsung PM9A1 MZVL21T0HCLR
2793 MB/s -31%
Average of class Multimedia
  (388 - 5175, n=84, last 2 years)
2553 MB/s -37%
Asus Zephyrus G14 GA401QM
SK Hynix HFM001TD3JX013N
1801 MB/s -56%
4K Read
Average Gigabyte AG470S1TB-SI B10
  (61.3 - 112.1, n=10)
90.5 MB/s +13%
SCHENKER Vision 14 2022 RTX 3050 Ti
Samsung SSD 980 Pro 1TB MZ-V8P1T0BW
80.26 MB/s 0%
MSI Stealth 14 Studio A13V
Samsung PM9A1 MZVL21T0HCLR
80.2 MB/s 0%
Gigabyte Aero 14 OLED BMF
Gigabyte AG470S1TB-SI B10
80.14 MB/s
Lenovo Yoga Pro 7 14IRH G8
Samsung PM9A1 MZVL21T0HCLR
73.6 MB/s -8%
Average of class Multimedia
  (30 - 98.5, n=84, last 2 years)
62.7 MB/s -22%
Acer Swift X SFX14-51G-5876
Micron 3400 MTFDKBA512TFH 512GB
61.99 MB/s -23%
Asus Zephyrus G14 GA401QM
SK Hynix HFM001TD3JX013N
50 MB/s -38%
4K Write
Average Gigabyte AG470S1TB-SI B10
  (206 - 358, n=10)
287 MB/s +39%
Gigabyte Aero 14 OLED BMF
Gigabyte AG470S1TB-SI B10
206.22 MB/s
MSI Stealth 14 Studio A13V
Samsung PM9A1 MZVL21T0HCLR
206 MB/s 0%
SCHENKER Vision 14 2022 RTX 3050 Ti
Samsung SSD 980 Pro 1TB MZ-V8P1T0BW
192.61 MB/s -7%
Average of class Multimedia
  (66.5 - 328, n=84, last 2 years)
188.5 MB/s -9%
Acer Swift X SFX14-51G-5876
Micron 3400 MTFDKBA512TFH 512GB
185.87 MB/s -10%
Lenovo Yoga Pro 7 14IRH G8
Samsung PM9A1 MZVL21T0HCLR
179.8 MB/s -13%
Asus Zephyrus G14 GA401QM
SK Hynix HFM001TD3JX013N
109 MB/s -47%
4K-64 Read
Gigabyte Aero 14 OLED BMF
Gigabyte AG470S1TB-SI B10
2733.5 MB/s
Average Gigabyte AG470S1TB-SI B10
  (1285 - 2964, n=10)
2660 MB/s -3%
MSI Stealth 14 Studio A13V
Samsung PM9A1 MZVL21T0HCLR
2639 MB/s -3%
SCHENKER Vision 14 2022 RTX 3050 Ti
Samsung SSD 980 Pro 1TB MZ-V8P1T0BW
2478.53 MB/s -9%
Asus Zephyrus G14 GA401QM
SK Hynix HFM001TD3JX013N
1400 MB/s -49%
Acer Swift X SFX14-51G-5876
Micron 3400 MTFDKBA512TFH 512GB
1365.43 MB/s -50%
Average of class Multimedia
  (413 - 2989, n=84, last 2 years)
1231 MB/s -55%
Lenovo Yoga Pro 7 14IRH G8
Samsung PM9A1 MZVL21T0HCLR
890 MB/s -67%
4K-64 Write
SCHENKER Vision 14 2022 RTX 3050 Ti
Samsung SSD 980 Pro 1TB MZ-V8P1T0BW
3195.52 MB/s +23%
MSI Stealth 14 Studio A13V
Samsung PM9A1 MZVL21T0HCLR
3167 MB/s +22%
Average Gigabyte AG470S1TB-SI B10
  (2403 - 4533, n=10)
3105 MB/s +20%
Lenovo Yoga Pro 7 14IRH G8
Samsung PM9A1 MZVL21T0HCLR
2908 MB/s +12%
Gigabyte Aero 14 OLED BMF
Gigabyte AG470S1TB-SI B10
2592.88 MB/s
Acer Swift X SFX14-51G-5876
Micron 3400 MTFDKBA512TFH 512GB
2366.95 MB/s -9%
Asus Zephyrus G14 GA401QM
SK Hynix HFM001TD3JX013N
2216 MB/s -15%
Average of class Multimedia
  (281 - 4265, n=84, last 2 years)
2123 MB/s -18%
Access Time Read
Average Gigabyte AG470S1TB-SI B10
  (0.028 - 0.094, n=10)
0.0632 ms * -4%
Gigabyte Aero 14 OLED BMF
Gigabyte AG470S1TB-SI B10
0.061 ms *
Average of class Multimedia
  (0.018 - 0.168, n=84, last 2 years)
0.0578 ms * +5%
Acer Swift X SFX14-51G-5876
Micron 3400 MTFDKBA512TFH 512GB
0.041 ms * +33%
MSI Stealth 14 Studio A13V
Samsung PM9A1 MZVL21T0HCLR
0.041 ms * +33%
Asus Zephyrus G14 GA401QM
SK Hynix HFM001TD3JX013N
0.04 ms * +34%
Lenovo Yoga Pro 7 14IRH G8
Samsung PM9A1 MZVL21T0HCLR
0.026 ms * +57%
SCHENKER Vision 14 2022 RTX 3050 Ti
Samsung SSD 980 Pro 1TB MZ-V8P1T0BW
0.022 ms * +64%
Access Time Write
Asus Zephyrus G14 GA401QM
SK Hynix HFM001TD3JX013N
0.102 ms * -467%
Average of class Multimedia
  (0.013 - 0.414, n=84, last 2 years)
0.05992 ms * -233%
Acer Swift X SFX14-51G-5876
Micron 3400 MTFDKBA512TFH 512GB
0.025 ms * -39%
SCHENKER Vision 14 2022 RTX 3050 Ti
Samsung SSD 980 Pro 1TB MZ-V8P1T0BW
0.022 ms * -22%
Lenovo Yoga Pro 7 14IRH G8
Samsung PM9A1 MZVL21T0HCLR
0.022 ms * -22%
MSI Stealth 14 Studio A13V
Samsung PM9A1 MZVL21T0HCLR
0.02 ms * -11%
Gigabyte Aero 14 OLED BMF
Gigabyte AG470S1TB-SI B10
0.018 ms *
Average Gigabyte AG470S1TB-SI B10
  (0.011 - 0.018, n=10)
0.0135 ms * +25%

* ... smaller is better

Sustained Read Performance: DiskSpd Read Loop, Queue Depth 8

035571010651420177521302485284031953550390542604615497053255680603563906745Tooltip
Gigabyte Aero 14 OLED BMF Gigabyte AG470S1TB-SI B10: Ø6770 (4434.37-6888.93)
SCHENKER Vision 14 2022 RTX 3050 Ti Samsung SSD 980 Pro 1TB MZ-V8P1T0BW: Ø6844 (6600.37-6857.69)
MSI Stealth 14 Studio A13V Samsung PM9A1 MZVL21T0HCLR: Ø6451 (3284.7-7072.44)
Lenovo Yoga Pro 7 14IRH G8 Samsung PM9A1 MZVL21T0HCLR: Ø3882 (3285.33-6067.45)
Acer Predator Triton 300 SE Micron 3400 1TB MTFDKBA1T0TFH: Ø2189 (453.55-6466.22)
Acer Swift X SFX14-51G-5876 Micron 3400 MTFDKBA512TFH 512GB: Ø5815 (5338.72-6485.02)

Placa gráfica

A Nvidia GeForce RTX 4050 em nosso dispositivo de teste é alimentada por 35 watts. Em teoria, a placa de vídeo da mais recente geração Ada Lovelace da Nvidia pode ser alimentada com até 115 watts. Portanto, o Aero 14 não produz realmente nenhuma pontuação alta nos benchmarks com 3DMark, Blender e outros. Mas a placa de vídeo de nível básico ainda é suficiente para o trabalho ideal na renderização de vídeos ou cenas 3D. Felizmente, o desempenho da GPU permanece bastante estável durante longos períodos.

Em contraste com o Core i7, os gráficos da Nvidia mostram um aumento significativo de desempenho em comparação com o antecessor quando os estágios do TGP são levados em consideração. ARTX 3050no Schenker Vision 14 e no Acer Swift X também são fornecidos com 35 watts. Os dois notebooks estão pelo menos 20% atrás em todos os benchmarks do chip gráfico.

3DMark Performance Rating - Percent
MSI Stealth 14 Studio A13V
NVIDIA GeForce RTX 4050 Laptop GPU, Intel Core i7-13700H
99.3 pt
Average NVIDIA GeForce RTX 4050 Laptop GPU
 
97.5 pt
Acer Predator Triton 300 SE
NVIDIA GeForce RTX 3060 Laptop GPU, Intel Core i9-12900H
90.3 pt
Lenovo Yoga Pro 7 14IRH G8 -1!
NVIDIA GeForce RTX 4050 Laptop GPU, Intel Core i7-13700H
79.9 pt
Asus Zephyrus G14 GA401QM
NVIDIA GeForce RTX 3060 Laptop GPU, AMD Ryzen 9 5900HS
77.8 pt
Gigabyte Aero 14 OLED BMF
NVIDIA GeForce RTX 4050 Laptop GPU, Intel Core i7-13700H
72.8 pt
Average of class Multimedia
 
60.3 pt
SCHENKER Vision 14 2022 RTX 3050 Ti -1!
NVIDIA GeForce RTX 3050 Ti Laptop GPU, Intel Core i7-12700H
58.2 pt
Acer Swift X SFX14-51G-5876
NVIDIA GeForce RTX 3050 4GB Laptop GPU, Intel Core i5-1240P
48 pt
3DMark 11 - 1280x720 Performance GPU
MSI Stealth 14 Studio A13V
NVIDIA GeForce RTX 4050 Laptop GPU, Intel Core i7-13700H
30260 Points +48%
Average NVIDIA GeForce RTX 4050 Laptop GPU
  (13339 - 32642, n=36)
28539 Points +39%
Acer Predator Triton 300 SE
NVIDIA GeForce RTX 3060 Laptop GPU, Intel Core i9-12900H
26724 Points +30%
Lenovo Yoga Pro 7 14IRH G8
NVIDIA GeForce RTX 4050 Laptop GPU, Intel Core i7-13700H
23303 Points +14%
Asus Zephyrus G14 GA401QM
NVIDIA GeForce RTX 3060 Laptop GPU, AMD Ryzen 9 5900HS
22063 Points +8%
Gigabyte Aero 14 OLED BMF
NVIDIA GeForce RTX 4050 Laptop GPU, Intel Core i7-13700H
20485 Points
Average of class Multimedia
  (3505 - 60250, n=89, last 2 years)
18929 Points -8%
SCHENKER Vision 14 2022 RTX 3050 Ti
NVIDIA GeForce RTX 3050 Ti Laptop GPU, Intel Core i7-12700H
16904 Points -17%
Acer Swift X SFX14-51G-5876
NVIDIA GeForce RTX 3050 4GB Laptop GPU, Intel Core i5-1240P
13682 Points -33%
3DMark
1280x720 Cloud Gate Standard Graphics
MSI Stealth 14 Studio A13V
NVIDIA GeForce RTX 4050 Laptop GPU, Intel Core i7-13700H
128703 Points +40%
Average NVIDIA GeForce RTX 4050 Laptop GPU
  (51138 - 161152, n=24)
126241 Points +37%
Acer Predator Triton 300 SE
NVIDIA GeForce RTX 3060 Laptop GPU, Intel Core i9-12900H
100864 Points +10%
Gigabyte Aero 14 OLED BMF
NVIDIA GeForce RTX 4050 Laptop GPU, Intel Core i7-13700H
91970 Points
Asus Zephyrus G14 GA401QM
NVIDIA GeForce RTX 3060 Laptop GPU, AMD Ryzen 9 5900HS
77108 Points -16%
Acer Swift X SFX14-51G-5876
NVIDIA GeForce RTX 3050 4GB Laptop GPU, Intel Core i5-1240P
65911 Points -28%
Average of class Multimedia
  (14679 - 150699, n=60, last 2 years)
58293 Points -37%
1920x1080 Fire Strike Graphics
MSI Stealth 14 Studio A13V
NVIDIA GeForce RTX 4050 Laptop GPU, Intel Core i7-13700H
21606 Points +27%
Average NVIDIA GeForce RTX 4050 Laptop GPU
  (13591 - 24007, n=34)
21045 Points +23%
Acer Predator Triton 300 SE
NVIDIA GeForce RTX 3060 Laptop GPU, Intel Core i9-12900H
20405 Points +20%
Asus Zephyrus G14 GA401QM
NVIDIA GeForce RTX 3060 Laptop GPU, AMD Ryzen 9 5900HS
18436 Points +8%
Lenovo Yoga Pro 7 14IRH G8
NVIDIA GeForce RTX 4050 Laptop GPU, Intel Core i7-13700H
17256 Points +1%
Gigabyte Aero 14 OLED BMF
NVIDIA GeForce RTX 4050 Laptop GPU, Intel Core i7-13700H
17061 Points
Average of class Multimedia
  (1835 - 46022, n=90, last 2 years)
14005 Points -18%
SCHENKER Vision 14 2022 RTX 3050 Ti
NVIDIA GeForce RTX 3050 Ti Laptop GPU, Intel Core i7-12700H
12349 Points -28%
Acer Swift X SFX14-51G-5876
NVIDIA GeForce RTX 3050 4GB Laptop GPU, Intel Core i5-1240P
9967 Points -42%
2560x1440 Time Spy Graphics
Acer Predator Triton 300 SE
NVIDIA GeForce RTX 3060 Laptop GPU, Intel Core i9-12900H
7763 Points +37%
Average NVIDIA GeForce RTX 4050 Laptop GPU
  (5107 - 9040, n=34)
7763 Points +37%
MSI Stealth 14 Studio A13V
NVIDIA GeForce RTX 4050 Laptop GPU, Intel Core i7-13700H
7560 Points +33%
Asus Zephyrus G14 GA401QM
NVIDIA GeForce RTX 3060 Laptop GPU, AMD Ryzen 9 5900HS
7234 Points +27%
Lenovo Yoga Pro 7 14IRH G8
NVIDIA GeForce RTX 4050 Laptop GPU, Intel Core i7-13700H
6418 Points +13%
Gigabyte Aero 14 OLED BMF
NVIDIA GeForce RTX 4050 Laptop GPU, Intel Core i7-13700H
5675 Points
Average of class Multimedia
  (622 - 17620, n=90, last 2 years)
5310 Points -6%
SCHENKER Vision 14 2022 RTX 3050 Ti
NVIDIA GeForce RTX 3050 Ti Laptop GPU, Intel Core i7-12700H
4773 Points -16%
Acer Swift X SFX14-51G-5876
NVIDIA GeForce RTX 3050 4GB Laptop GPU, Intel Core i5-1240P
3853 Points -32%
3DMark Ice Storm Standard Score
211524 pontos
3DMark Cloud Gate Standard Score
45695 pontos
3DMark Fire Strike Score
15329 pontos
3DMark Time Spy Score
6151 pontos
Ajuda
Blender
v3.3 Classroom OPTIX/RTX
Acer Swift X SFX14-51G-5876
NVIDIA GeForce RTX 3050 4GB Laptop GPU, Intel Core i5-1240P
60 Seconds * -76%
SCHENKER Vision 14 2022 RTX 3050 Ti
NVIDIA GeForce RTX 3050 Ti Laptop GPU, Intel Core i7-12700H
53 Seconds * -56%
Average of class Multimedia
  (19 - 99, n=45, last 2 years)
41.5 Seconds * -22%
Acer Predator Triton 300 SE
NVIDIA GeForce RTX 3060 Laptop GPU, Intel Core i9-12900H
35 Seconds * -3%
Gigabyte Aero 14 OLED BMF
NVIDIA GeForce RTX 4050 Laptop GPU, Intel Core i7-13700H
34 Seconds *
Lenovo Yoga Pro 7 14IRH G8
NVIDIA GeForce RTX 4050 Laptop GPU, Intel Core i7-13700H
31 Seconds * +9%
Average NVIDIA GeForce RTX 4050 Laptop GPU
  (25 - 37, n=35)
29 Seconds * +15%
MSI Stealth 14 Studio A13V
NVIDIA GeForce RTX 4050 Laptop GPU, Intel Core i7-13700H
28 Seconds * +18%
v3.3 Classroom CUDA
MSI Stealth 14 Studio A13V
NVIDIA GeForce RTX 4050 Laptop GPU, Intel Core i7-13700H
175 Seconds * -182%
Acer Swift X SFX14-51G-5876
NVIDIA GeForce RTX 3050 4GB Laptop GPU, Intel Core i5-1240P
113 Seconds * -82%
SCHENKER Vision 14 2022 RTX 3050 Ti
NVIDIA GeForce RTX 3050 Ti Laptop GPU, Intel Core i7-12700H
91 Seconds * -47%
Average of class Multimedia
  (32 - 172, n=48, last 2 years)
76.5 Seconds * -23%
Gigabyte Aero 14 OLED BMF
NVIDIA GeForce RTX 4050 Laptop GPU, Intel Core i7-13700H
62 Seconds *
Acer Predator Triton 300 SE
NVIDIA GeForce RTX 3060 Laptop GPU, Intel Core i9-12900H
61 Seconds * +2%
Average NVIDIA GeForce RTX 4050 Laptop GPU
  (47 - 175, n=35)
56.7 Seconds * +9%
Lenovo Yoga Pro 7 14IRH G8
NVIDIA GeForce RTX 4050 Laptop GPU, Intel Core i7-13700H
56 Seconds * +10%
v3.3 Classroom CPU
Acer Swift X SFX14-51G-5876
NVIDIA GeForce RTX 3050 4GB Laptop GPU, Intel Core i5-1240P
741 Seconds * -76%
SCHENKER Vision 14 2022 RTX 3050 Ti
NVIDIA GeForce RTX 3050 Ti Laptop GPU, Intel Core i7-12700H
456 Seconds * -9%
Average of class Multimedia
  (190 - 1374, n=83, last 2 years)
447 Seconds * -6%
Gigabyte Aero 14 OLED BMF
NVIDIA GeForce RTX 4050 Laptop GPU, Intel Core i7-13700H
420 Seconds *
Average NVIDIA GeForce RTX 4050 Laptop GPU
  (243 - 907, n=35)
400 Seconds * +5%
Lenovo Yoga Pro 7 14IRH G8
NVIDIA GeForce RTX 4050 Laptop GPU, Intel Core i7-13700H
352 Seconds * +16%
Acer Predator Triton 300 SE
NVIDIA GeForce RTX 3060 Laptop GPU, Intel Core i9-12900H
348 Seconds * +17%
MSI Stealth 14 Studio A13V
NVIDIA GeForce RTX 4050 Laptop GPU, Intel Core i7-13700H
347 Seconds * +17%

* ... smaller is better

Desempenho em jogos

Para um grande número de jogos em resolução FullHD, a RTX 4050é perfeitamente adequada para atingir bons fps, mesmo em configurações de alta qualidade. Somente os jogos mais antigos são realmente jogáveis na resolução total de 3K da tela. No entanto, o traçado de raios, como em F1 2022 ou Hogwarts Legacy, causa uma queda significativa nas taxas de quadros, também em FullHD. Os 6 GB de VRAM da 4050 podem se revelar um gargalo em títulos mais recentes. Mais recentemente, a versão para PC de The Last of Usnos causou frustração por causa de sua alta demanda de memória gráfica. Em última análise, o pequeno laptop pode ser usado para mais do que apenas jogos ocasionais.

Performance Rating - Percent
Acer Predator Triton 300 SE
Intel Core i9-12900H, NVIDIA GeForce RTX 3060 Laptop GPU
99 pt
MSI Stealth 14 Studio A13V
Intel Core i7-13700H, NVIDIA GeForce RTX 4050 Laptop GPU
88.3 pt
Lenovo Yoga Pro 7 14IRH G8 -1!
Intel Core i7-13700H, NVIDIA GeForce RTX 4050 Laptop GPU
86.9 pt
Gigabyte Aero 14 OLED BMF
Intel Core i7-13700H, NVIDIA GeForce RTX 4050 Laptop GPU
81.6 pt
Asus Zephyrus G14 GA401QM
AMD Ryzen 9 5900HS, NVIDIA GeForce RTX 3060 Laptop GPU
79.1 pt
SCHENKER Vision 14 2022 RTX 3050 Ti
Intel Core i7-12700H, NVIDIA GeForce RTX 3050 Ti Laptop GPU
66.8 pt
Average of class Multimedia
 
63.8 pt
Acer Swift X SFX14-51G-5876
Intel Core i5-1240P, NVIDIA GeForce RTX 3050 4GB Laptop GPU
54.8 pt
The Witcher 3 - 1920x1080 Ultra Graphics & Postprocessing (HBAO+)
MSI Stealth 14 Studio A13V
Intel Core i7-13700H, NVIDIA GeForce RTX 4050 Laptop GPU
76.7 (74min, 74P1) fps +8%
Acer Predator Triton 300 SE
Intel Core i9-12900H, NVIDIA GeForce RTX 3060 Laptop GPU
75 (69min) fps +6%
Gigabyte Aero 14 OLED BMF
Intel Core i7-13700H, NVIDIA GeForce RTX 4050 Laptop GPU
71 fps
Gigabyte Aero 14 OLED BMF
Intel Core i7-13700H, NVIDIA GeForce RTX 4050 Laptop GPU
67.7 (63min, 65P1) fps -5%
Asus Zephyrus G14 GA401QM
AMD Ryzen 9 5900HS, NVIDIA GeForce RTX 3060 Laptop GPU
68.3 (63min) fps -4%
Lenovo Yoga Pro 7 14IRH G8
Intel Core i7-13700H, NVIDIA GeForce RTX 4050 Laptop GPU
66 (62min, 63P1) fps -7%
Average of class Multimedia
  (8 - 143.2, n=99, last 2 years)
50.6 fps -29%
SCHENKER Vision 14 2022 RTX 3050 Ti
Intel Core i7-12700H, NVIDIA GeForce RTX 3050 Ti Laptop GPU
44.2 (42min, 42P1) fps -38%
Acer Swift X SFX14-51G-5876
Intel Core i5-1240P, NVIDIA GeForce RTX 3050 4GB Laptop GPU
39.2 (35min, 37P1) fps -45%
GTA V - 1920x1080 Highest Settings possible AA:4xMSAA + FX AF:16x
Acer Predator Triton 300 SE
Intel Core i9-12900H, NVIDIA GeForce RTX 3060 Laptop GPU
99.6 (5.85min, 66.7P1) fps +34%
Asus Zephyrus G14 GA401QM
AMD Ryzen 9 5900HS, NVIDIA GeForce RTX 3060 Laptop GPU
79.6 (8.68min, 55.6P1) fps +7%
Lenovo Yoga Pro 7 14IRH G8
Intel Core i7-13700H, NVIDIA GeForce RTX 4050 Laptop GPU
78.7 (6.43min, 50P1) fps +6%
Gigabyte Aero 14 OLED BMF
Intel Core i7-13700H, NVIDIA GeForce RTX 4050 Laptop GPU
74.3 (2.72min, 47.6P1) fps
SCHENKER Vision 14 2022 RTX 3050 Ti
Intel Core i7-12700H, NVIDIA GeForce RTX 3050 Ti Laptop GPU
67.5 (9.08min, 43.5P1) fps -9%
Average of class Multimedia
  (4.24 - 123, n=88, last 2 years)
56.3 fps -24%
MSI Stealth 14 Studio A13V
Intel Core i7-13700H, NVIDIA GeForce RTX 4050 Laptop GPU
55.9 (17.2min, 29.4P1) fps -25%
Acer Swift X SFX14-51G-5876
Intel Core i5-1240P, NVIDIA GeForce RTX 3050 4GB Laptop GPU
51.5 (9.63min, 33.3P1) fps -31%
Final Fantasy XV Benchmark - 1920x1080 High Quality
MSI Stealth 14 Studio A13V
Intel Core i7-13700H, NVIDIA GeForce RTX 4050 Laptop GPU
82 fps +40%
Acer Predator Triton 300 SE
Intel Core i9-12900H, NVIDIA GeForce RTX 3060 Laptop GPU
79.1 fps +35%
Asus Zephyrus G14 GA401QM
AMD Ryzen 9 5900HS, NVIDIA GeForce RTX 3060 Laptop GPU
68.9 fps +18%
Lenovo Yoga Pro 7 14IRH G8
Intel Core i7-13700H, NVIDIA GeForce RTX 4050 Laptop GPU
59.9 fps +2%
Gigabyte Aero 14 OLED BMF
Intel Core i7-13700H, NVIDIA GeForce RTX 4050 Laptop GPU
58.5 fps
Average of class Multimedia
  (6.53 - 141.8, n=89, last 2 years)
50.6 fps -14%
SCHENKER Vision 14 2022 RTX 3050 Ti
Intel Core i7-12700H, NVIDIA GeForce RTX 3050 Ti Laptop GPU
50.1 fps -14%
Acer Swift X SFX14-51G-5876
Intel Core i5-1240P, NVIDIA GeForce RTX 3050 4GB Laptop GPU
36.6 fps -37%
Strange Brigade - 1920x1080 ultra AA:ultra AF:16
Acer Predator Triton 300 SE
Intel Core i9-12900H, NVIDIA GeForce RTX 3060 Laptop GPU
138.6 (37.8min, 106P1) fps +38%
MSI Stealth 14 Studio A13V
Intel Core i7-13700H, NVIDIA GeForce RTX 4050 Laptop GPU
123.1 (19.3min, 35P1) fps +23%
Asus Zephyrus G14 GA401QM
AMD Ryzen 9 5900HS, NVIDIA GeForce RTX 3060 Laptop GPU
123 (87.3min, 96.9P1) fps +23%
Gigabyte Aero 14 OLED BMF
Intel Core i7-13700H, NVIDIA GeForce RTX 4050 Laptop GPU
100.2 (67.8min, 76.1P1) fps
Average of class Multimedia
  (11 - 233, n=86, last 2 years)
89.9 fps -10%
SCHENKER Vision 14 2022 RTX 3050 Ti
Intel Core i7-12700H, NVIDIA GeForce RTX 3050 Ti Laptop GPU
86 (52.1min, 63.8P1) fps -14%
Acer Swift X SFX14-51G-5876
Intel Core i5-1240P, NVIDIA GeForce RTX 3050 4GB Laptop GPU
65.1 (46.5min, 50.1P1) fps -35%
Dota 2 Reborn - 1920x1080 ultra (3/3) best looking
Acer Predator Triton 300 SE
Intel Core i9-12900H, NVIDIA GeForce RTX 3060 Laptop GPU
153.6 (134.8min) fps +19%
Lenovo Yoga Pro 7 14IRH G8
Intel Core i7-13700H, NVIDIA GeForce RTX 4050 Laptop GPU
148 (129.7min) fps +15%
MSI Stealth 14 Studio A13V
Intel Core i7-13700H, NVIDIA GeForce RTX 4050 Laptop GPU
135.3 (113.4min) fps +5%
Gigabyte Aero 14 OLED BMF
Intel Core i7-13700H, NVIDIA GeForce RTX 4050 Laptop GPU
129.1 (114min) fps
Asus Zephyrus G14 GA401QM
AMD Ryzen 9 5900HS, NVIDIA GeForce RTX 3060 Laptop GPU
110 (93.9min) fps -15%
SCHENKER Vision 14 2022 RTX 3050 Ti
Intel Core i7-12700H, NVIDIA GeForce RTX 3050 Ti Laptop GPU
109.1 (95.7min) fps -15%
Acer Swift X SFX14-51G-5876
Intel Core i5-1240P, NVIDIA GeForce RTX 3050 4GB Laptop GPU
106.4 (92min) fps -18%
Average of class Multimedia
  (26.3 - 171.6, n=90, last 2 years)
101.6 fps -21%
X-Plane 11.11 - 1920x1080 high (fps_test=3)
Acer Predator Triton 300 SE
Intel Core i9-12900H, NVIDIA GeForce RTX 3060 Laptop GPU
101 fps +3%
Lenovo Yoga Pro 7 14IRH G8
Intel Core i7-13700H, NVIDIA GeForce RTX 4050 Laptop GPU
100.9 fps +3%
Gigabyte Aero 14 OLED BMF
Intel Core i7-13700H, NVIDIA GeForce RTX 4050 Laptop GPU
98.2 fps
Gigabyte Aero 14 OLED BMF
Intel Core i7-13700H, NVIDIA GeForce RTX 4050 Laptop GPU
97.6 fps -1%
MSI Stealth 14 Studio A13V
Intel Core i7-13700H, NVIDIA GeForce RTX 4050 Laptop GPU
97.8 fps 0%
SCHENKER Vision 14 2022 RTX 3050 Ti
Intel Core i7-12700H, NVIDIA GeForce RTX 3050 Ti Laptop GPU
82.3 fps -16%
Average of class Multimedia
  (23 - 131.1, n=95, last 2 years)
68.4 fps -30%
Acer Swift X SFX14-51G-5876
Intel Core i5-1240P, NVIDIA GeForce RTX 3050 4GB Laptop GPU
65.8 fps -33%
Asus Zephyrus G14 GA401QM
AMD Ryzen 9 5900HS, NVIDIA GeForce RTX 3060 Laptop GPU
61.9 fps -37%

No teste de longo prazo do site Witcher 3, observamos taxas de quadros bastante estáveis. Os altos e baixos típicos durante o curso dia/noite no jogo são quase imperceptíveis aqui. Após cerca de dois terços do teste, nota-se uma queda menor no desempenho, de cerca de 3 fps.

Witcher 3 FPS chart

05101520253035404550556065707580Tooltip
Gigabyte Aero 14 OLED BMF i7-13700H, NVIDIA GeForce RTX 4050 Laptop GPU: Ø67.7 (63-71)
SCHENKER Vision 14 2022 RTX 3050 Ti i7-12700H, GeForce RTX 3050 Ti Laptop GPU: Ø44.2 (42-48)
MSI Stealth 14 Studio A13V i7-13700H, NVIDIA GeForce RTX 4050 Laptop GPU: Ø76.7 (74-81)
Lenovo Yoga Pro 7 14IRH G8 i7-13700H, NVIDIA GeForce RTX 4050 Laptop GPU: Ø66 (62-70)
Asus Zephyrus G14 GA401QM R9 5900HS, GeForce RTX 3060 Laptop GPU: Ø65.8 (62-70)
Acer Predator Triton 300 SE i9-12900H, GeForce RTX 3060 Laptop GPU: Ø70.8 (61-75)
Acer Swift X SFX14-51G-5876 i5-1240P, GeForce RTX 3050 4GB Laptop GPU: Ø39.1 (35-42)
baixo média alto ultraQHD4K
GTA V (2015) 183.4 180.9 161.6 74.3
The Witcher 3 (2015) 87 67.7
Dota 2 Reborn (2015) 147.6 139.4 135.1 129.1 69.7
Final Fantasy XV Benchmark (2018) 142.6 77.5 58.5 41 22.5
X-Plane 11.11 (2018) 146.6 122.9 98.2 83.2
Strange Brigade (2018) 396 150.5 117 100.2
F1 22 (2022) 157.9 149 100.8 33.3
Hogwarts Legacy (2023) 49.4 44.8 39
The Last of Us (2023) 53.4 44.6 0

Emissões - Ventiladores com assobio

Ruído

Mesmo que os ventiladores do laptop raramente atinjam os 51 dB(A) medidos a uma distância de 15 cm, eles ainda produzem um ruído desagradavelmente alto em muitos casos. O assobio em torno de 2.000 Hz quase sempre pode ser ouvido assim que eles giram um pouco mais rápido. E isso acontece com frequência, infelizmente. Mesmo quando o laptop está ocioso, os ventiladores giram em intervalos regulares.

Há também um zumbido de bobina ligeiramente perceptível quando o teclado fica aceso em um dos níveis de brilho mais baixos por longos períodos de tempo.

Barulho

Ocioso
24 / 24 / 35.71 dB
Carga
/ 51.93 dB
  red to green bar
 
 
30 dB
silencioso
40 dB(A)
audível
50 dB(A)
ruidosamente alto
 
min: dark, med: mid, max: light   Earthworks M23R, Arta (15 cm de distância)   environment noise: 24 dB(A)
dB(A) 0102030405060708090Deep BassMiddle BassHigh BassLower RangeMidsHigher MidsLower HighsMid HighsUpper HighsSuper Highs2031.436.931.42533.738.233.73132.843.332.84029.832.229.85028.329.628.36321.528.121.58017.327.817.310020.82620.812517.922.517.916020.623.320.620023.226.923.225024.929.424.931525.928.825.94002929.12950030.530.430.563034.630.534.680033.531.133.5100036.629.736.6125038.82538.8160040.52740.5200046.226.146.225004226.642315041.626.241.6400038.323.638.3500038.221.238.263003820.138800034.816.734.81000028.513.828.51250024.612.724.61600019.711.519.7SPL51.938.651.9N7.237.2median 33.5median 26.1median 33.5Delta7.14.87.135.132.931.634.831.930.834.733.631.430.833.631.731.63330.426.330.826.626.72627.13028.727.528.830.729.330.627.526.929.327.927.226.62825.123.925.424.724.223.724.32526.634.121.221.121.422.63027.222.12119.219.921.824.623.923.72122.119.823.226.128.622.721.521.519.424.128.930.524.820.220.418.820.925.725.226.319.118.316.919.928.327.826.219.117.417.118.531.831.128.717.315.21417.134.633.629.916.914.612.91634.634.129.117.415.414.216.833.633.728.816.314.812.715.936.235.632.616.614.611.216.637.537.731.416.113.611.316.33836.232.61613.211.215.737.937.533.716.613.911.216.239.538.433.815.813.1111538.137.832.81412.411.313.8393932.614.512.711.613.736.23629.213.712.511.913.135.134.328.213.61312.212.832.630.724.913.713.112.212.828.526.720.314.413.412.51326.224.919.614.314.312.112.721.119.816.114.214.311.612.348.848.243.327.82624.427.46.46.24.310.80.60.9median 33.6median 33.6median 28.7median 16.3median 14.3median 12.2median 165.554.41.91.92.72.9hearing rangehide median Fan NoiseGigabyte Aero 14 OLED BMFSCHENKER Vision 14 2022 RTX 3050 Ti
Gigabyte Aero 14 OLED BMF
NVIDIA GeForce RTX 4050 Laptop GPU, i7-13700H, Gigabyte AG470S1TB-SI B10
SCHENKER Vision 14 2022 RTX 3050 Ti
GeForce RTX 3050 Ti Laptop GPU, i7-12700H, Samsung SSD 980 Pro 1TB MZ-V8P1T0BW
Asus Zephyrus G14 GA401QM
GeForce RTX 3060 Laptop GPU, R9 5900HS, SK Hynix HFM001TD3JX013N
Acer Predator Triton 300 SE
GeForce RTX 3060 Laptop GPU, i9-12900H, Micron 3400 1TB MTFDKBA1T0TFH
Acer Swift X SFX14-51G-5876
GeForce RTX 3050 4GB Laptop GPU, i5-1240P, Micron 3400 MTFDKBA512TFH 512GB
MSI Katana 15 B12VEK
NVIDIA GeForce RTX 4050 Laptop GPU, i7-12650H, Micron 2400 MTFDKBA1T0QFM
Noise
0%
-14%
-8%
0%
2%
off / environment *
24
24.4
-2%
24.8
-3%
23.8
1%
25
-4%
24
-0%
Idle Minimum *
24
24.4
-2%
25.4
-6%
23.8
1%
26.6
-11%
24
-0%
Idle Average *
24
24.4
-2%
34.5
-44%
23.8
1%
26.6
-11%
24
-0%
Idle Maximum *
35.71
27.8
22%
34.5
3%
30.6
14%
27.5
23%
24
33%
Witcher 3 ultra *
40.22
48.2
-20%
52.7
-31%
60.1
-49%
45.75
-14%
Load Maximum *
51.93
48.8
6%
52.3
-1%
60
-16%
49.7
4%
54.55
-5%
Load Average *
43.3
35.4
44.2
49.7
37.71

* ... smaller is better

Temperatura

Com a CPU e a dGPU juntas produzindo até 75 watts de calor residual, não é de surpreender que o pequeno Gigabyte Aero 14 OLED esquente significativamente com o tempo. Após uma hora de teste de estresse, apenas o touchpad permaneceu abaixo de 30 °C. A parte inferior do notebook aquece até 52 °C. Como a unidade básica é feita inteiramente de alumínio, essa temperatura parece desconfortavelmente alta. Por outro lado, o notebook quase sempre permanece em temperatura ambiente durante carga baixa ou em modo inativo.

No entanto, a comparação com a concorrência mostra isso: O Gigabyte Aero 14 permanece relativamente frio. O Asus Zephyrus G14 é o líder aqui, com até 62 °C.

 42 °C42 °C41 °C 
 37 °C39 °C37 °C 
 35 °C29 °C35 °C 
Máximo: 42 °C
Médio: 37.4 °C
48 °C52 °C46 °C
37 °C41 °C38 °C
33 °C34 °C34 °C
Máximo: 52 °C
Médio: 40.3 °C
alimentação elétrica  44 °C | Temperatura do quarto 18 °C | Fluke t3000FC (calibrated), Fluke 62 Mini
(±) The average temperature for the upper side under maximal load is 37.4 °C / 99 F, compared to the average of 31.2 °C / 88 F for the devices in the class Multimedia.
(±) The maximum temperature on the upper side is 42 °C / 108 F, compared to the average of 36.9 °C / 98 F, ranging from 21.1 to 71 °C for the class Multimedia.
(-) The bottom heats up to a maximum of 52 °C / 126 F, compared to the average of 39.1 °C / 102 F
(+) In idle usage, the average temperature for the upper side is 25 °C / 77 F, compared to the device average of 31.2 °C / 88 F.
(±) Playing The Witcher 3, the average temperature for the upper side is 35.2 °C / 95 F, compared to the device average of 31.2 °C / 88 F.
(+) The palmrests and touchpad are reaching skin temperature as a maximum (35 °C / 95 F) and are therefore not hot.
(-) The average temperature of the palmrest area of similar devices was 28.8 °C / 83.8 F (-6.2 °C / -11.2 F).
Teste de estresse: topo
Teste de estresse: fonte de alimentação
Teste de estresse: fundo
Topo do Witcher
Topo do Witcher
Fonte de alimentação Witcher
Fundo Witcher
Fundo Witcher
Gigabyte Aero 14 OLED BMF
Intel Core i7-13700H, NVIDIA GeForce RTX 4050 Laptop GPU
SCHENKER Vision 14 2022 RTX 3050 Ti
Intel Core i7-12700H, NVIDIA GeForce RTX 3050 Ti Laptop GPU
Lenovo Yoga Pro 7 14IRH G8
Intel Core i7-13700H, NVIDIA GeForce RTX 4050 Laptop GPU
Asus Zephyrus G14 GA401QM
AMD Ryzen 9 5900HS, NVIDIA GeForce RTX 3060 Laptop GPU
Acer Predator Triton 300 SE
Intel Core i9-12900H, NVIDIA GeForce RTX 3060 Laptop GPU
Acer Swift X SFX14-51G-5876
Intel Core i5-1240P, NVIDIA GeForce RTX 3050 4GB Laptop GPU
Heat
-10%
-3%
-23%
-1%
-23%
Maximum Upper Side *
42
48.4
-15%
41.6
1%
55.4
-32%
43
-2%
49.8
-19%
Maximum Bottom *
52
57.1
-10%
55.7
-7%
62.2
-20%
46.4
11%
51
2%
Idle Upper Side *
26
28.1
-8%
25.9
-0%
31
-19%
28.2
-8%
39.6
-52%
Idle Bottom *
27
29
-7%
28
-4%
32.4
-20%
28.4
-5%
32.7
-21%

* ... smaller is better

Teste de estresse

O Gigabyte Aero 14 OLED é capaz de manter seu desempenho até certo ponto durante todo o teste de estresse. Após a curta fase de aumento, o clock efetivo do processador flutua entre 2.400 e 2.100 Hz. As perdas reais de desempenho dificilmente estão associadas a isso. O Core i7 precisa de aproximadamente 15 minutos para atingir cerca de 89 °C. Essa temperatura é então mantida quase continuamente.

Registra o teste de estresse e Witcher 3
Srceenshot: teste de estresse

Alto-falantes

Não há um grande sistema de som alojado no pequeno laptop. Com 86 dB(A), os alto-falantes ficam razoavelmente altos, mas claramente não têm potência, especialmente nas baixas frequências. Infelizmente, os sons médios e agudos também não são equilibrados. Sempre há certas frequências que são particularmente enfatizadas, enquanto outras são claramente sub-representadas. Desvios de mais de 10 dB da mediana podem ser determinados nas faixas médias e altas.

dB(A) 0102030405060708090Deep BassMiddle BassHigh BassLower RangeMidsHigher MidsLower HighsMid HighsUpper HighsSuper Highs2031.530.331.52534.138.334.13137.236.237.24029.63129.65027.929.527.96327.529.627.5802514.62510025.618.525.612527.71327.716042.512.442.520049.217.349.225052.617.852.631556.312.356.340059.510.159.550063.29.863.263068.111.568.180073.210.673.2100072.512.672.5125074.410.774.4160066.711.866.7200067.311.867.3250064.21164.2315065.611.565.6400073.31273.3500076.312.276.3630069.612.269.680005612.4561000060.812.260.81250064.812.164.81600046.411.846.4SPL82.72482.7N53.60.553.6median 64.2median 12.1median 64.2Delta8.10.58.130.831.931.633.72627.529.325.526.627.923.726.821.426.519.93219.835.619.440.718.845.416.948.317.1541461.112.969.914.271.912.771.311.270.411.369.511.269.111.272.2117111.374.211.66911.964.212.263.312.261.212.56112.156.511.648.224.481.90.650.6median 12.2median 63.32.710.4hearing rangehide median Pink NoiseGigabyte Aero 14 OLED BMFSCHENKER Vision 14 2022 RTX 3050 Ti
Frequency diagram (checkboxes can be checked and unchecked to compare devices)
Gigabyte Aero 14 OLED BMF audio analysis

(+) | speakers can play relatively loud (82.72 dB)
Bass 100 - 315 Hz
(-) | nearly no bass - on average 21.9% lower than median
(±) | linearity of bass is average (10% delta to prev. frequency)
Mids 400 - 2000 Hz
(±) | higher mids - on average 5.3% higher than median
(+) | mids are linear (6.7% delta to prev. frequency)
Highs 2 - 16 kHz
(±) | higher highs - on average 5.6% higher than median
(±) | linearity of highs is average (11% delta to prev. frequency)
Overall 100 - 16.000 Hz
(±) | linearity of overall sound is average (20% difference to median)
Compared to same class
» 62% of all tested devices in this class were better, 9% similar, 29% worse
» The best had a delta of 5%, average was 18%, worst was 45%
Compared to all devices tested
» 46% of all tested devices were better, 8% similar, 46% worse
» The best had a delta of 4%, average was 25%, worst was 134%

SCHENKER Vision 14 2022 RTX 3050 Ti audio analysis

(±) | speaker loudness is average but good (81.9 dB)
Bass 100 - 315 Hz
(-) | nearly no bass - on average 20.6% lower than median
(±) | linearity of bass is average (9% delta to prev. frequency)
Mids 400 - 2000 Hz
(±) | higher mids - on average 6.7% higher than median
(+) | mids are linear (5.8% delta to prev. frequency)
Highs 2 - 16 kHz
(+) | balanced highs - only 4.3% away from median
(+) | highs are linear (4.9% delta to prev. frequency)
Overall 100 - 16.000 Hz
(±) | linearity of overall sound is average (20.4% difference to median)
Compared to same class
» 60% of all tested devices in this class were better, 8% similar, 31% worse
» The best had a delta of 5%, average was 19%, worst was 53%
Compared to all devices tested
» 48% of all tested devices were better, 8% similar, 44% worse
» The best had a delta of 4%, average was 25%, worst was 134%

Gerenciamento de energia - Econômico

Consumo de energia

O consumo de energia do notebook da Gigabyte é bom. O Aero 14 é mais eficiente do que os dispositivos de comparação em quase todas as medições. A Gigabyte inclui uma fonte de alimentação de 130 watts. O notebook pequeno só exige essa energia por períodos muito curtos durante nossos testes; caso contrário, ele permanece com cerca de 120 watts por longos períodos no teste de estresse. Nos resultados dessa medição, vemos claramente uma queda repentina no consumo de energia. Isso possivelmente se deve à alternância inicialmente observada entre os modos de desempenho.

Consumo de energia
desligadodarklight 0.9 / 4.1 Watt
Ociosodarkmidlight 7.4 / 8.3 / 8.7 Watt
Carga midlight 76 / 132 Watt
 color bar
Key: min: dark, med: mid, max: light        Metrahit Energy
Currently we use the Metrahit Energy, a professional single phase power quality and energy measurement digital multimeter, for our measurements. Find out more about it here. All of our test methods can be found here.
Gigabyte Aero 14 OLED BMF
i7-13700H, NVIDIA GeForce RTX 4050 Laptop GPU, Gigabyte AG470S1TB-SI B10, OLED, 2880x1800, 14.00
SCHENKER Vision 14 2022 RTX 3050 Ti
i7-12700H, GeForce RTX 3050 Ti Laptop GPU, Samsung SSD 980 Pro 1TB MZ-V8P1T0BW, IPS, 2880x1800, 14.00
Asus Zephyrus G14 GA401QM
R9 5900HS, GeForce RTX 3060 Laptop GPU, SK Hynix HFM001TD3JX013N, IPS, 1920x1080, 14.00
Acer Predator Triton 300 SE
i9-12900H, GeForce RTX 3060 Laptop GPU, Micron 3400 1TB MTFDKBA1T0TFH, OLED, 2880x1800, 14.00
Acer Swift X SFX14-51G-5876
i5-1240P, GeForce RTX 3050 4GB Laptop GPU, Micron 3400 MTFDKBA512TFH 512GB, IPS-LED, 2240x1400, 14.00
MSI Katana 15 B12VEK
i7-12650H, NVIDIA GeForce RTX 4050 Laptop GPU, Micron 2400 MTFDKBA1T0QFM, IPS, 1920x1080, 15.60
Average NVIDIA GeForce RTX 4050 Laptop GPU
 
Average of class Multimedia
 
Power Consumption
-14%
-30%
-59%
-2%
-34%
-56%
-21%
Idle Minimum *
7.4
7.5
-1%
5.6
24%
7.6
-3%
7.3
1%
8.5
-15%
10.1 ?(2 - 21.1, n=27)
-36%
Idle Average *
8.3
10.4
-25%
10.4
-25%
12.3
-48%
8.3
-0%
10.2
-23%
15.1 ?(5 - 32, n=27)
-82%
Idle Maximum *
8.7
11.4
-31%
18
-107%
17.6
-102%
13.1
-51%
11.3
-30%
18.3 ?(7.9 - 30.4, n=27)
-110%
Load Average *
76
83.3
-10%
68
11%
111
-46%
70
8%
84
-11%
87.7 ?(52.4 - 151, n=27)
-15%
Witcher 3 ultra *
70
92.7
-32%
113
-61%
117.1
-67%
70.2
-0%
128
-83%
Load Maximum *
132
110.3
16%
158.2
-20%
245.8
-86%
95
28%
189
-43%

* ... smaller is better

Energieaufnahme Witcher 3 / Stresstest

0102030405060708090100110120130Tooltip
Gigabyte Aero 14 OLED BMF; Witcher 3 ultra: Ø70.1 (60.029-112.55)
Gigabyte Aero 14 OLED BMF; 1280x720 Prime95 28.10 and Furmark 1.25: Ø113.9 (83.12-132.02)
Gigabyte Aero 14 OLED BMF; Idle 150cd/m2: Ø8.73 (7.228-13.085)

Power consumption with an external monitor

0102030405060708090100110Tooltip
Gigabyte Aero 14 OLED BMF; Prime95 V2810 Stress (external Monitor): Ø79.1 (69.15-111.02)
Gigabyte Aero 14 OLED BMF; Cinebench R15 Multi (external Monitor): Ø96.7 (64.68-106.43)
Gigabyte Aero 14 OLED BMF; Cinebench R23 Multi (external Monitor): Ø80.2 (63.17-106.42)
Gigabyte Aero 14 OLED BMF; 1280x720 FurMark 1.19 GPU Stress Test (external Monitor): Ø70.1 (67.93-75.02)
Gigabyte Aero 14 OLED BMF; 1920x1080 The Witcher 3 ultra (external Monitor): Ø64.9 (58.588-76.01)
Gigabyte Aero 14 OLED BMF; Idle 1min (external Monitor): Ø13.3 (8.092-20.817)

Duração da bateria

bateria de 63 Wh no Gigabyte Aero 14 OLED

Na melhor das hipóteses, a bateria de 63 Wh no Gigabyte Aero 14 OLED durou mais de 7,5 horas no teste de navegação na web Wi-Fi, mas somente depois que o Gigabyte Control Center foi completamente reinstalado. Antes disso, somente três horas de tempo de funcionamento foram possíveis aqui com um brilho de tela de 150 cd/m². Mesmo que o Aero 14 tenha quase a menor bateria no campo de comparação, ele funciona de forma bastante eficiente.

Tempo de Execução da Bateria
Ocioso (sem WLAN, min brilho)
11h 18min
WiFi Websurfing
7h 37min
Carga (máximo brilho)
1h 32min
Gigabyte Aero 14 OLED BMF
i7-13700H, NVIDIA GeForce RTX 4050 Laptop GPU, 63 Wh
SCHENKER Vision 14 2022 RTX 3050 Ti
i7-12700H, GeForce RTX 3050 Ti Laptop GPU, 99.8 Wh
MSI Stealth 14 Studio A13V
i7-13700H, NVIDIA GeForce RTX 4050 Laptop GPU, 72 Wh
Lenovo Yoga Pro 7 14IRH G8
i7-13700H, NVIDIA GeForce RTX 4050 Laptop GPU, 73 Wh
Asus Zephyrus G14 GA401QM
R9 5900HS, GeForce RTX 3060 Laptop GPU, 76 Wh
Acer Predator Triton 300 SE
i9-12900H, GeForce RTX 3060 Laptop GPU, 76 Wh
Acer Swift X SFX14-51G-5876
i5-1240P, GeForce RTX 3050 4GB Laptop GPU, 58.7 Wh
Average of class Multimedia
 
Battery Runtime
34%
-21%
-9%
43%
-21%
17%
23%
Reader / Idle
678
1262
86%
486
-28%
WiFi v1.3
457
607
33%
378
-17%
595
30%
710
55%
374
-18%
643
41%
Load
92
124
35%
69
-25%
49
-47%
81
-12%
77
-16%
86
-7%
H.264
666
396
742
739

Pro

+ carcaça de alumínio leve, estável e plana
+ teclado robusto
+ alto desempenho do sistema
+ muitas portas em três lados
+ tela OLED brilhante

Contra

- Centro de controle da Gigabyte com peculiaridades
- reprodução de cores precisa apenas até 162 cd/m²
- USB PD não está funcionando

Veredicto - Conceito sólido com muitas desvantagens

Gigabyte Aero 14 OLED BMF - Cortesia da Gigabyte Germany

Analisando o hardware do notebook, o Gigabyte Aero 14 OLED convence com um chassi estável que abriga um processador Core Core i7-13700H e uma GeForce RTX 4050. Ambos não funcionam em seu TDP máximo, mas nossos testes mostram que 40 e 35 watts para a CPU e dGPU, respectivamente, são adequados para oferecer um desempenho sólido. A tela OLED do Areo 14 oferece boa reprodução de cores em determinadas circunstâncias. Entretanto, as limitações de brilho de 162 cd/m² no modo calibrado exigem um ambiente escuro para obter boa legibilidade. Por outro lado, o excelente teclado é um claro ponto positivo. Um deslocamento das teclas de 1,7 mm é uma raridade, especialmente para os portáteis pequenos.

O software de controle da Gigabyte é uma história diferente: o Centro de Controle é simplesmente desanimador. Ele é tão desorganizado quanto propenso a erros. Isso obviamente prejudica nossa impressão geral do notebook. O mesmo se aplica à conectividade em termos de USB-C e PowerDelivery. Outras fontes de alimentação USB-PD simplesmente não querem cooperar com o notebook. Portanto, o fator de mobilidade do notebook é prejudicado aqui.

Com um Intel Core i7-13700H e Nvidia GeForce RTX 4050, o notebook de 14 polegadas tem um hardware poderoso. Apesar de uma fonte de 75 watts, ele ainda oferece um desempenho decente. Em vez disso, o Aero 14 OLED é desacelerado pelo próprio software da Gigabyte.

Basicamente, a Gigabyte posiciona o Aero 14 OLED em um atraente espectro de preço-desempenho: você obtém um dispositivo poderoso por US$ 1.699,00. No entanto, todos os dispositivos de referência do ano passado estão agora disponíveis a preços significativamente mais baixos. O Acer Predator Triton 300 oferece menos desempenho do que o Gigabyte Aero em termos de duração da bateria, mas custa apenas US$ 1.179,99. O Schenker Vision 14 também tem o mesmo preço. Dada a falta de melhorias entre a 12ª e a 13ª gerações da Intel, vale a pena dar uma olhada nos outros notebooks de 14 polegadas do ano passado.

Preço e disponibilidade

O Gigabyte Aero 14 OLED BMF está atualmente listado em Amazon USA por US$1.699,00.

Os compradores interessados em outros países são aconselhados a verificar diretamente através da página oficial do produto da Gigabyte aqui. Clique em "Buy" (Comprar) e selecione seu país na lista suspensa que aparece. Em seguida, você será encaminhado para uma lista de lojas on-line e varejistas aplicáveis no país selecionado.

Os preços são válidos a partir de 05.05.2023 e estão sujeitos a alterações.

Gigabyte Aero 14 OLED BMF - 05/02/2023 v7
Marc Herter

Acabamento
85 / 98 → 87%
Teclado
90%
Mouse
91%
Conectividade
69 / 80 → 86%
Peso
70 / 20-72 → 96%
Bateria
78 / 95 → 82%
Pantalha
93%
Desempenho do jogos
92 / 90 → 100%
Desempenho da aplicação
97 / 90 → 100%
Temperatura
87%
Ruído
78 / 95 → 82%
Audio
71%
Camera
55 / 85 → 65%
Médio
81%
89%
Multimedia - Médio equilibrado

Transparency

The present review sample was made available to the author as a loan by the manufacturer or a shop for the purposes of review. The lender had no influence on this review, nor did the manufacturer receive a copy of this review before publication. There was no obligation to publish this review.

Pricecompare

Please share our article, every link counts!
> Análises e revisões de portáteis e celulares > Análises > Análises > Análise do laptop Gigabyte Aero 14 OLED BMF: Notebook de estúdio compacto com tela true color
Marc Herter, 2023-05- 7 (Update: 2023-05- 7)