Breve Análise do Portátil HP EliteBook 850 G3
| |||||||||||||||||||||||||
iluminação: 85 %
iluminação com acumulador: 294 cd/m²
Contraste: 537:1 (Preto: 0.54 cd/m²)
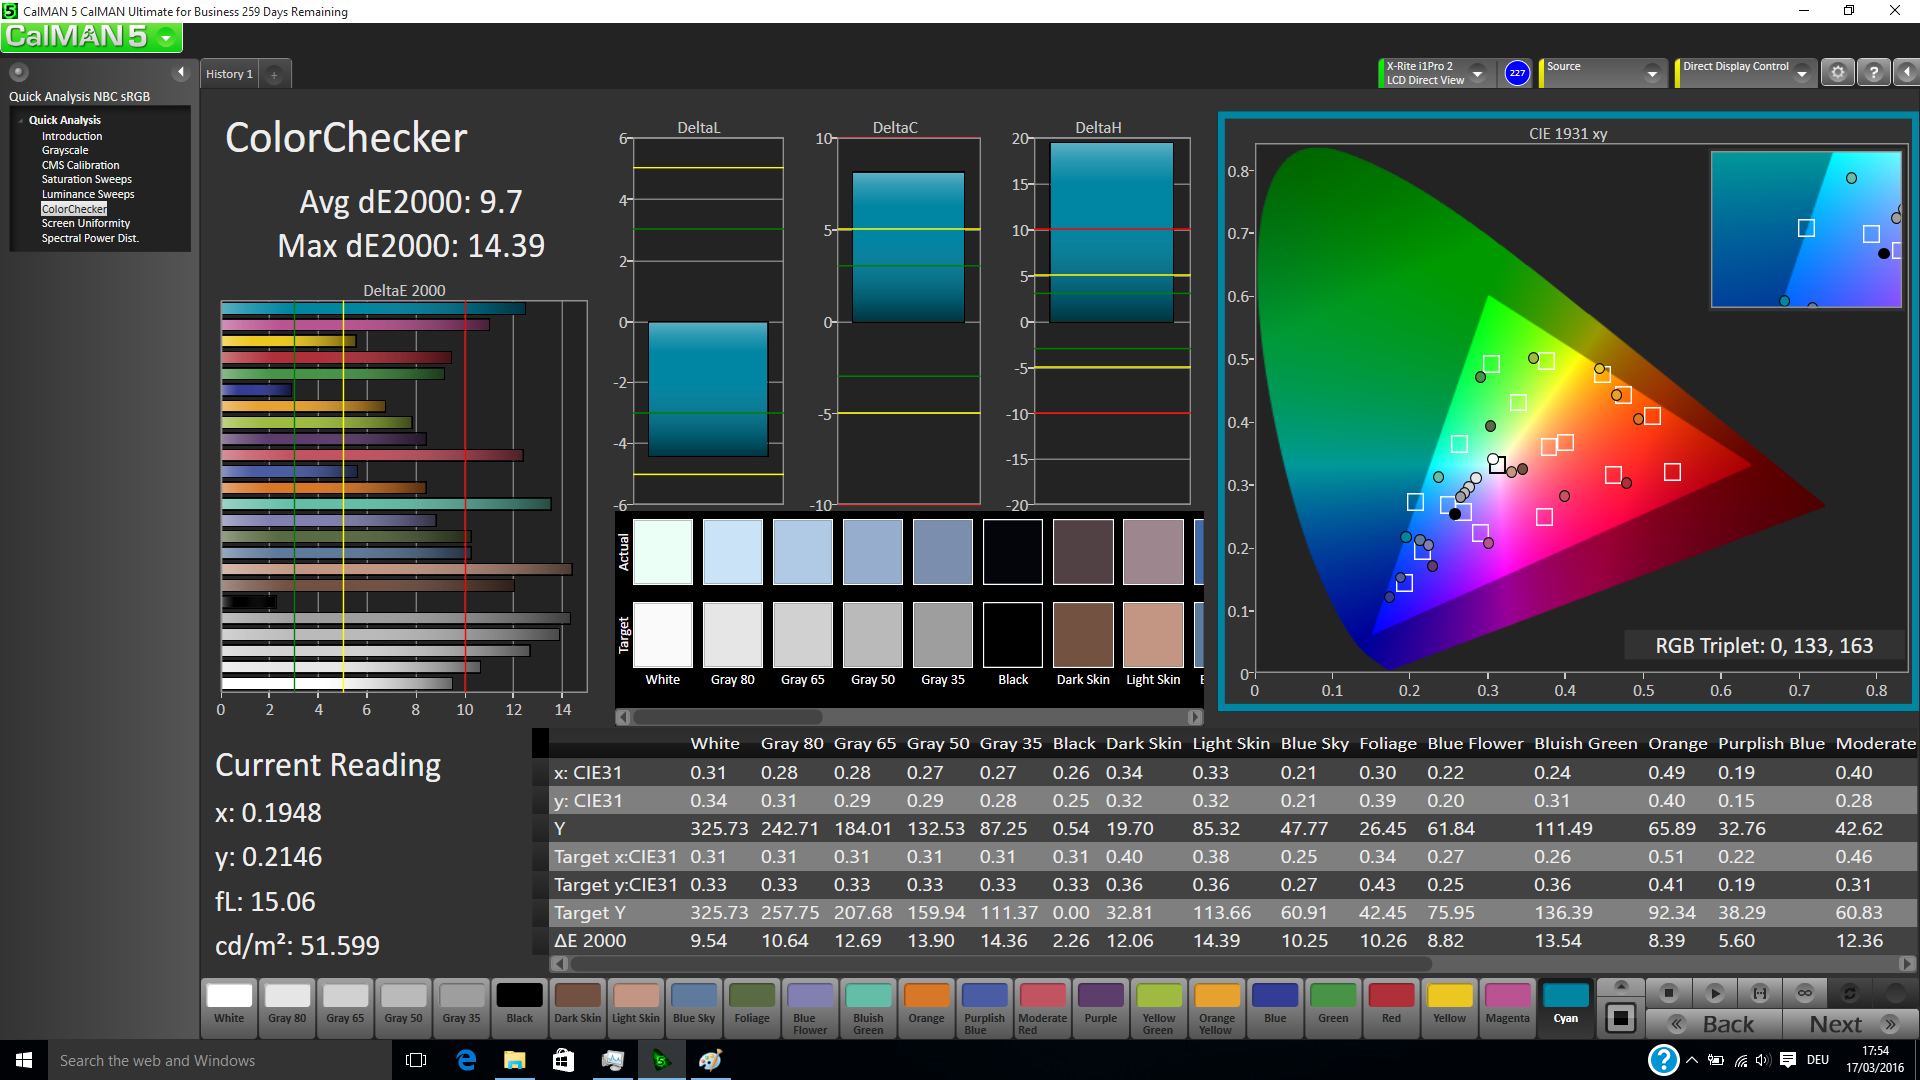
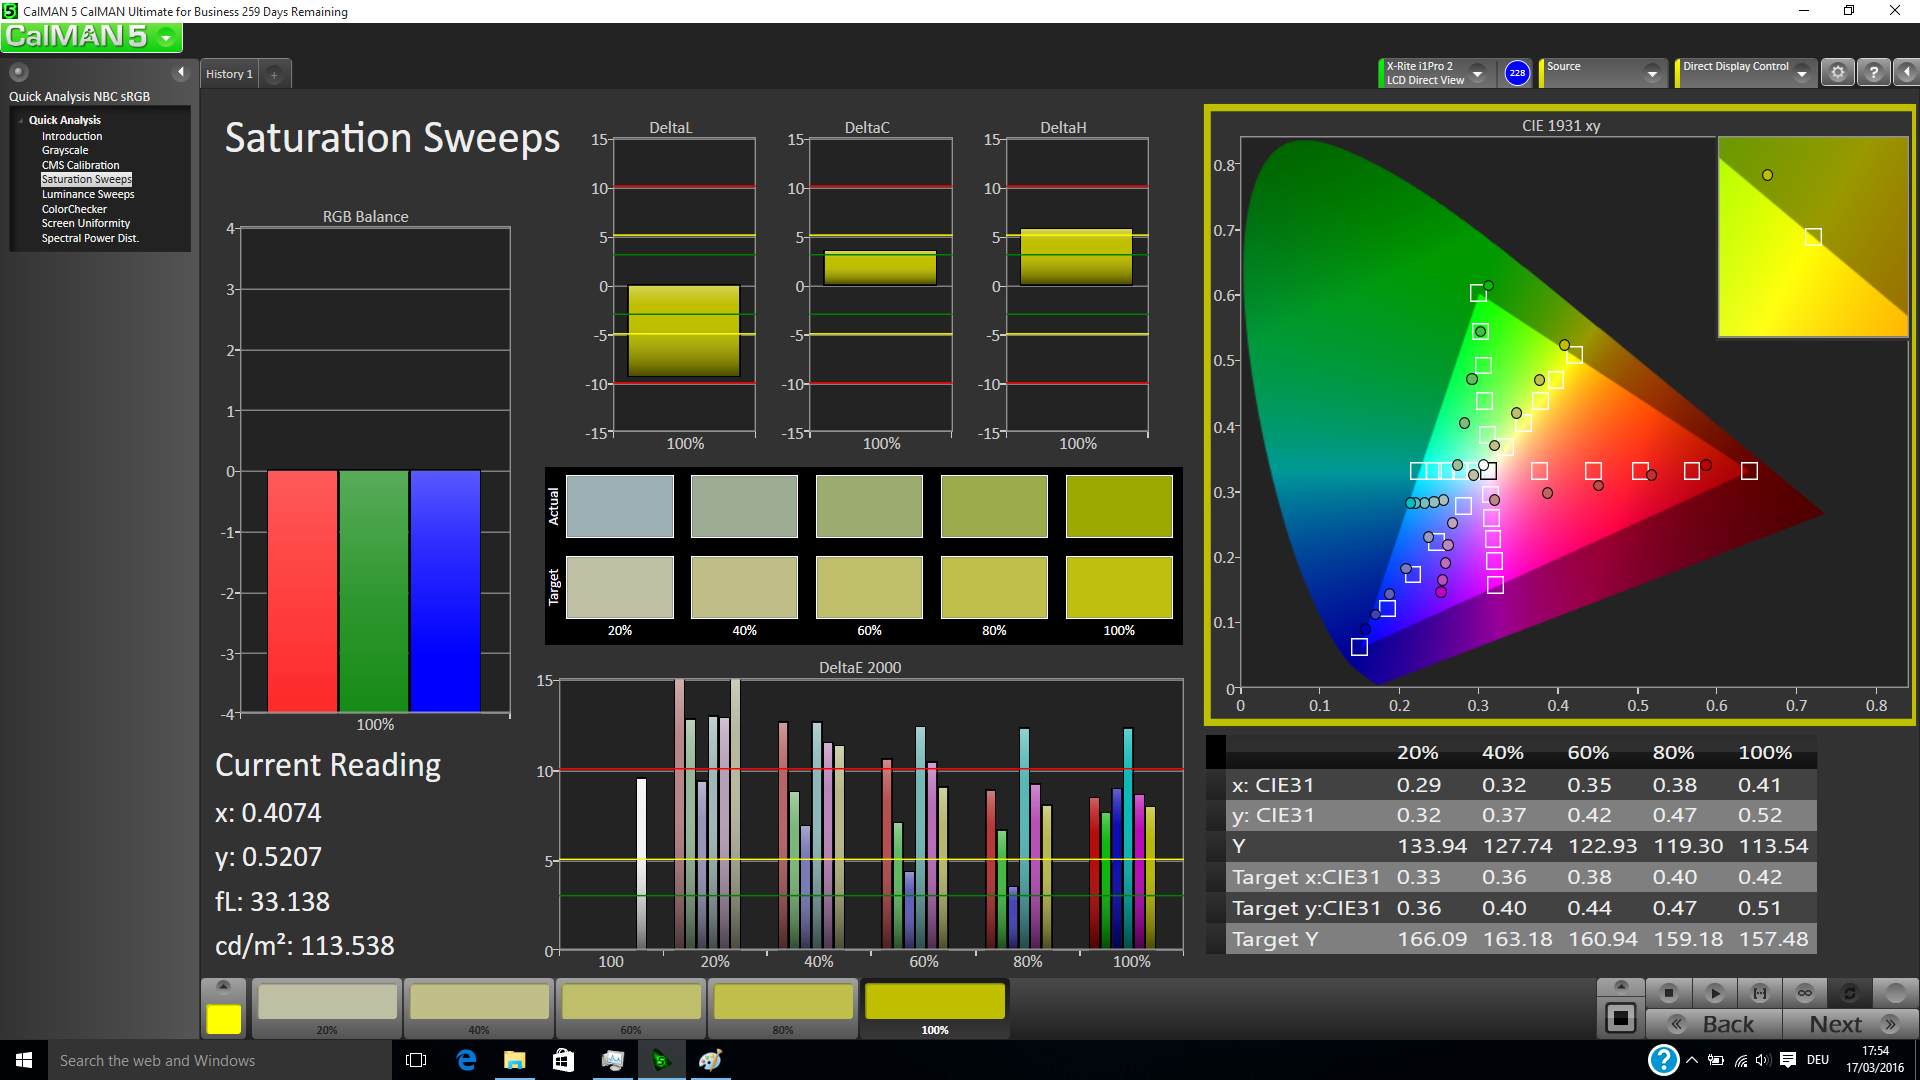
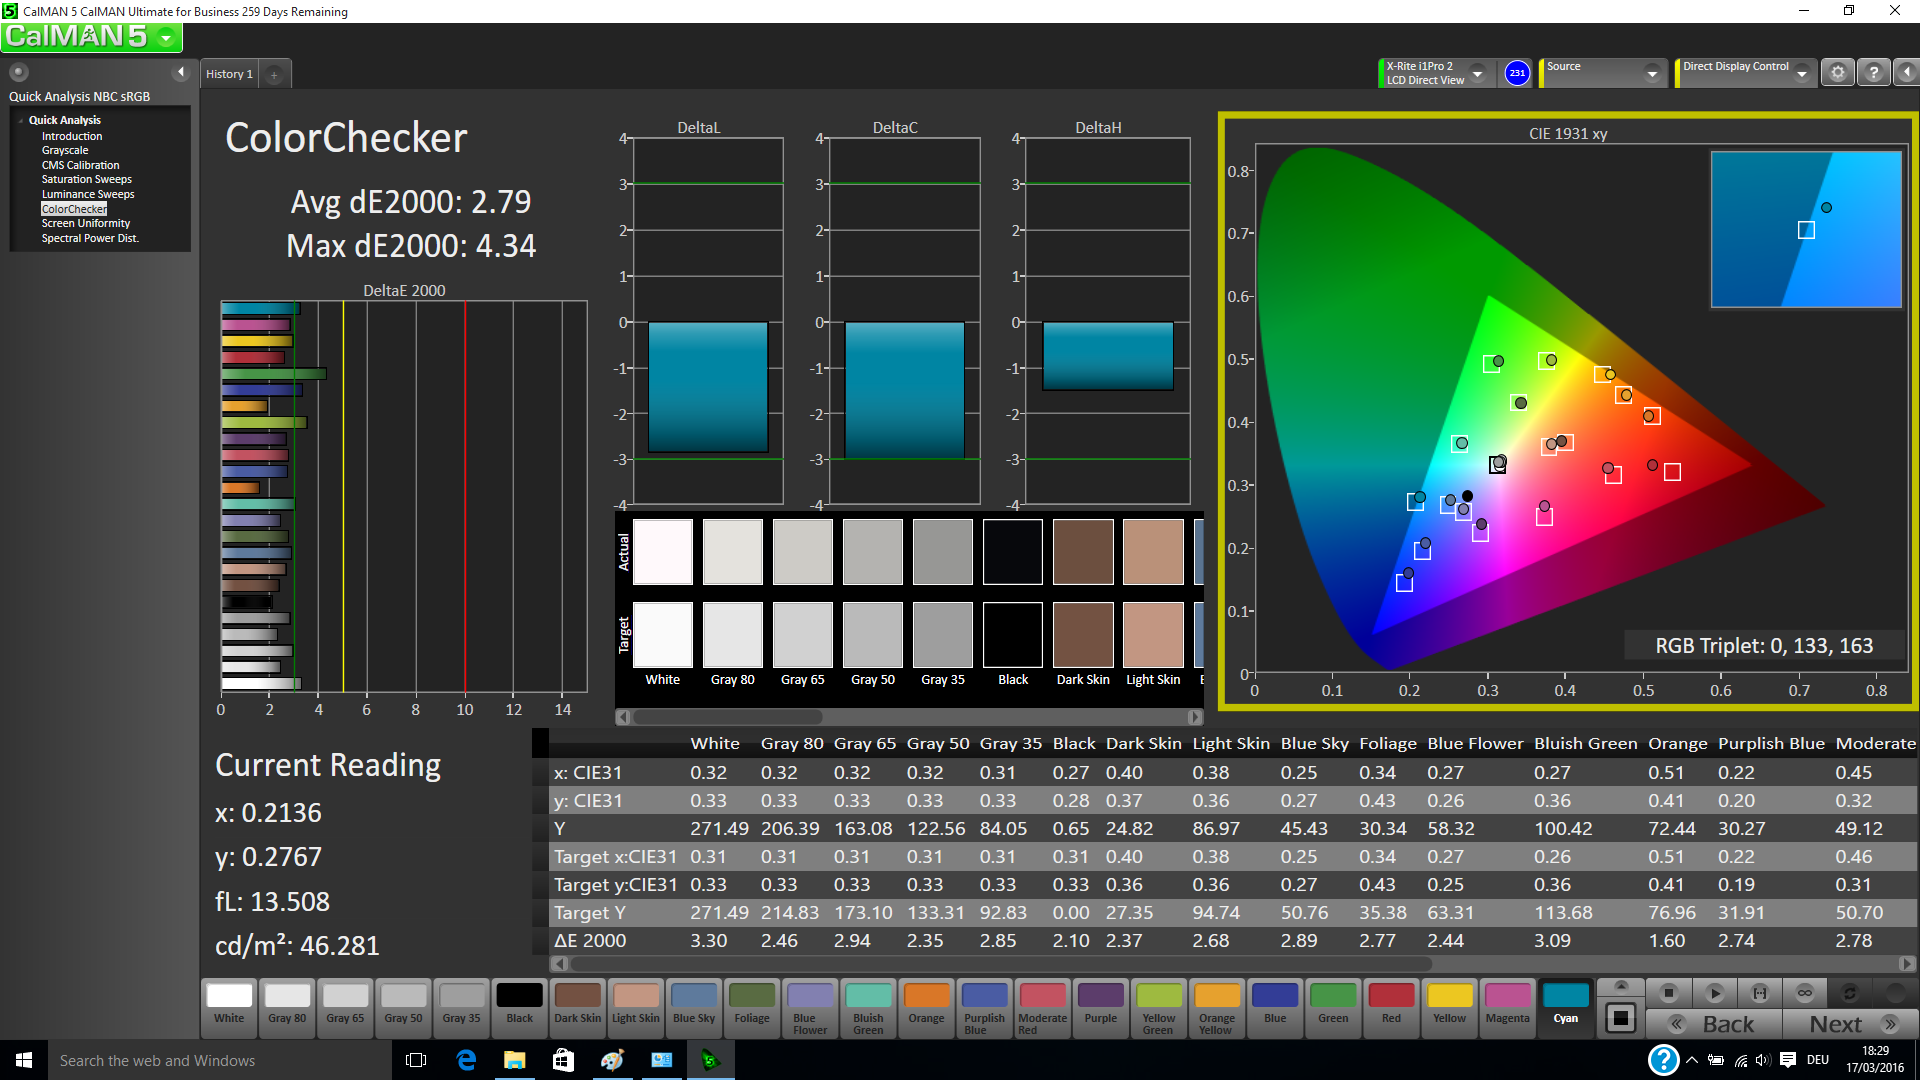
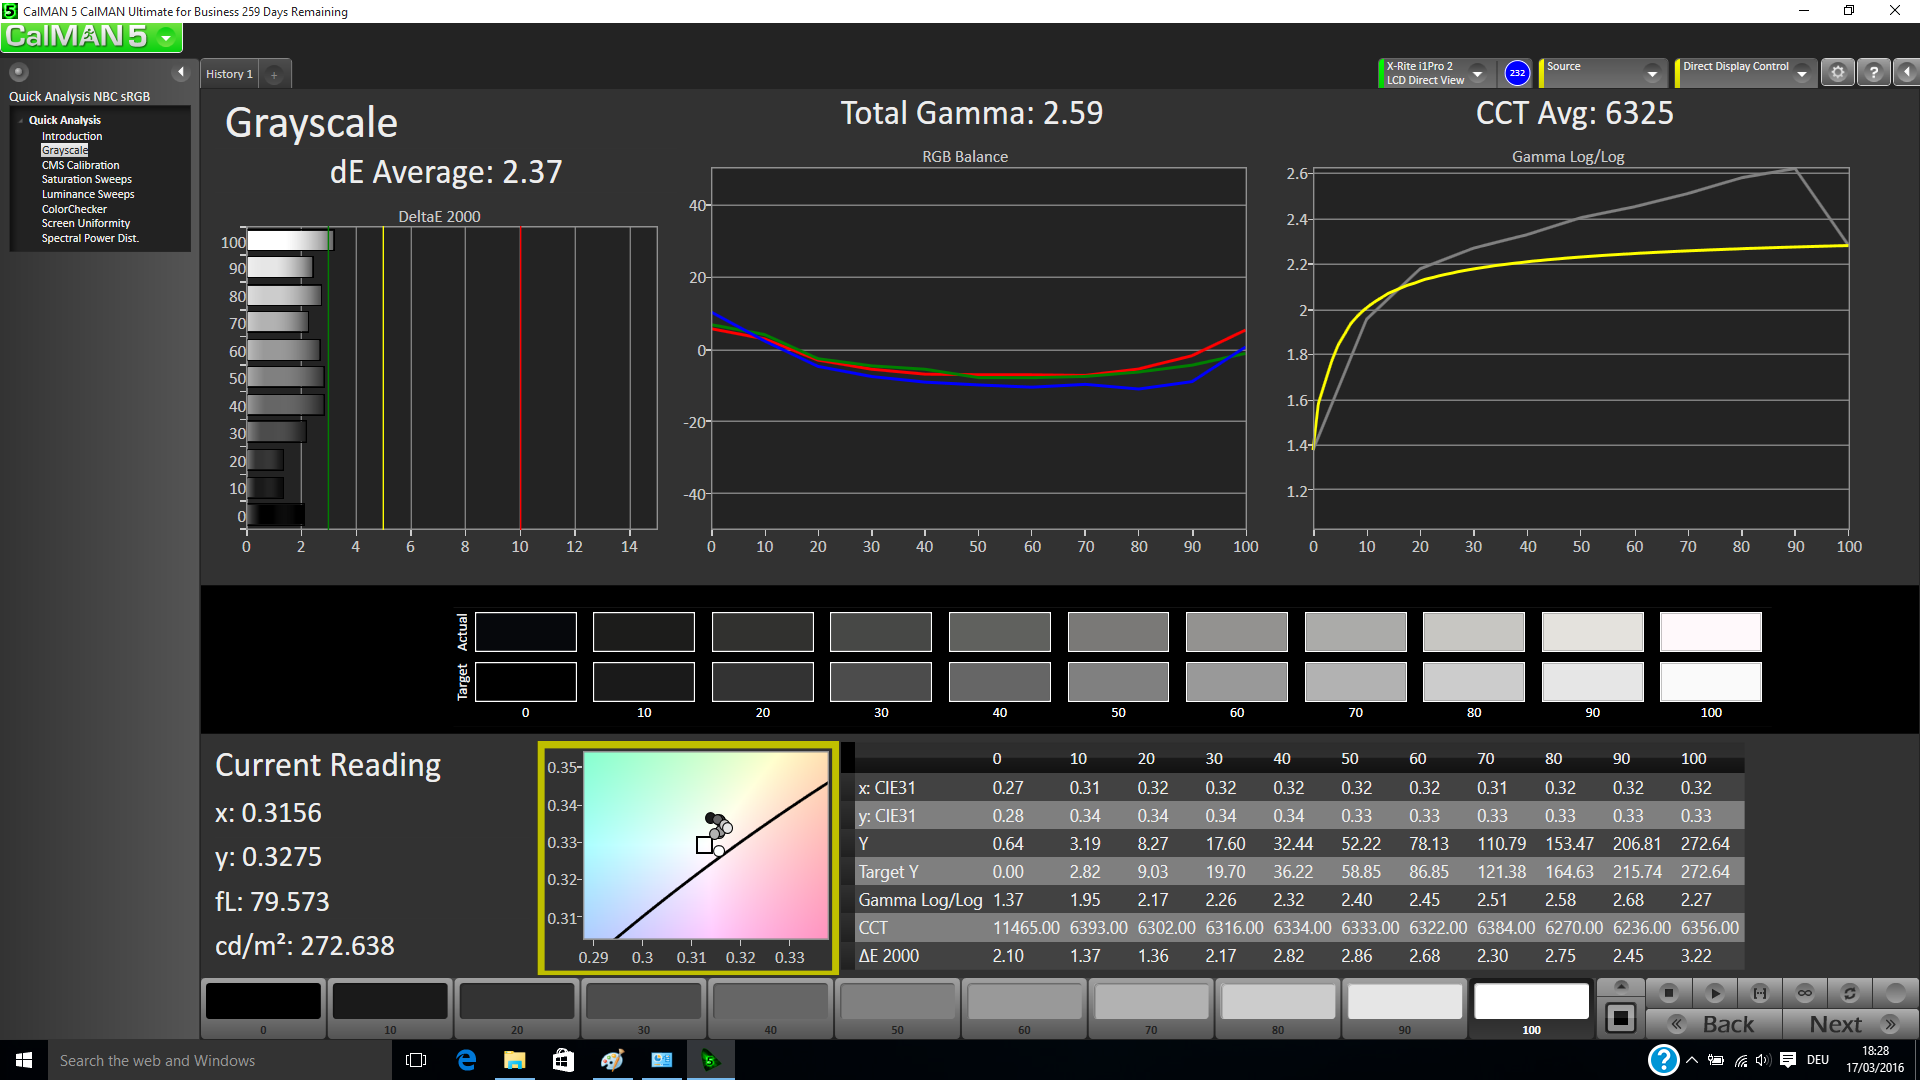
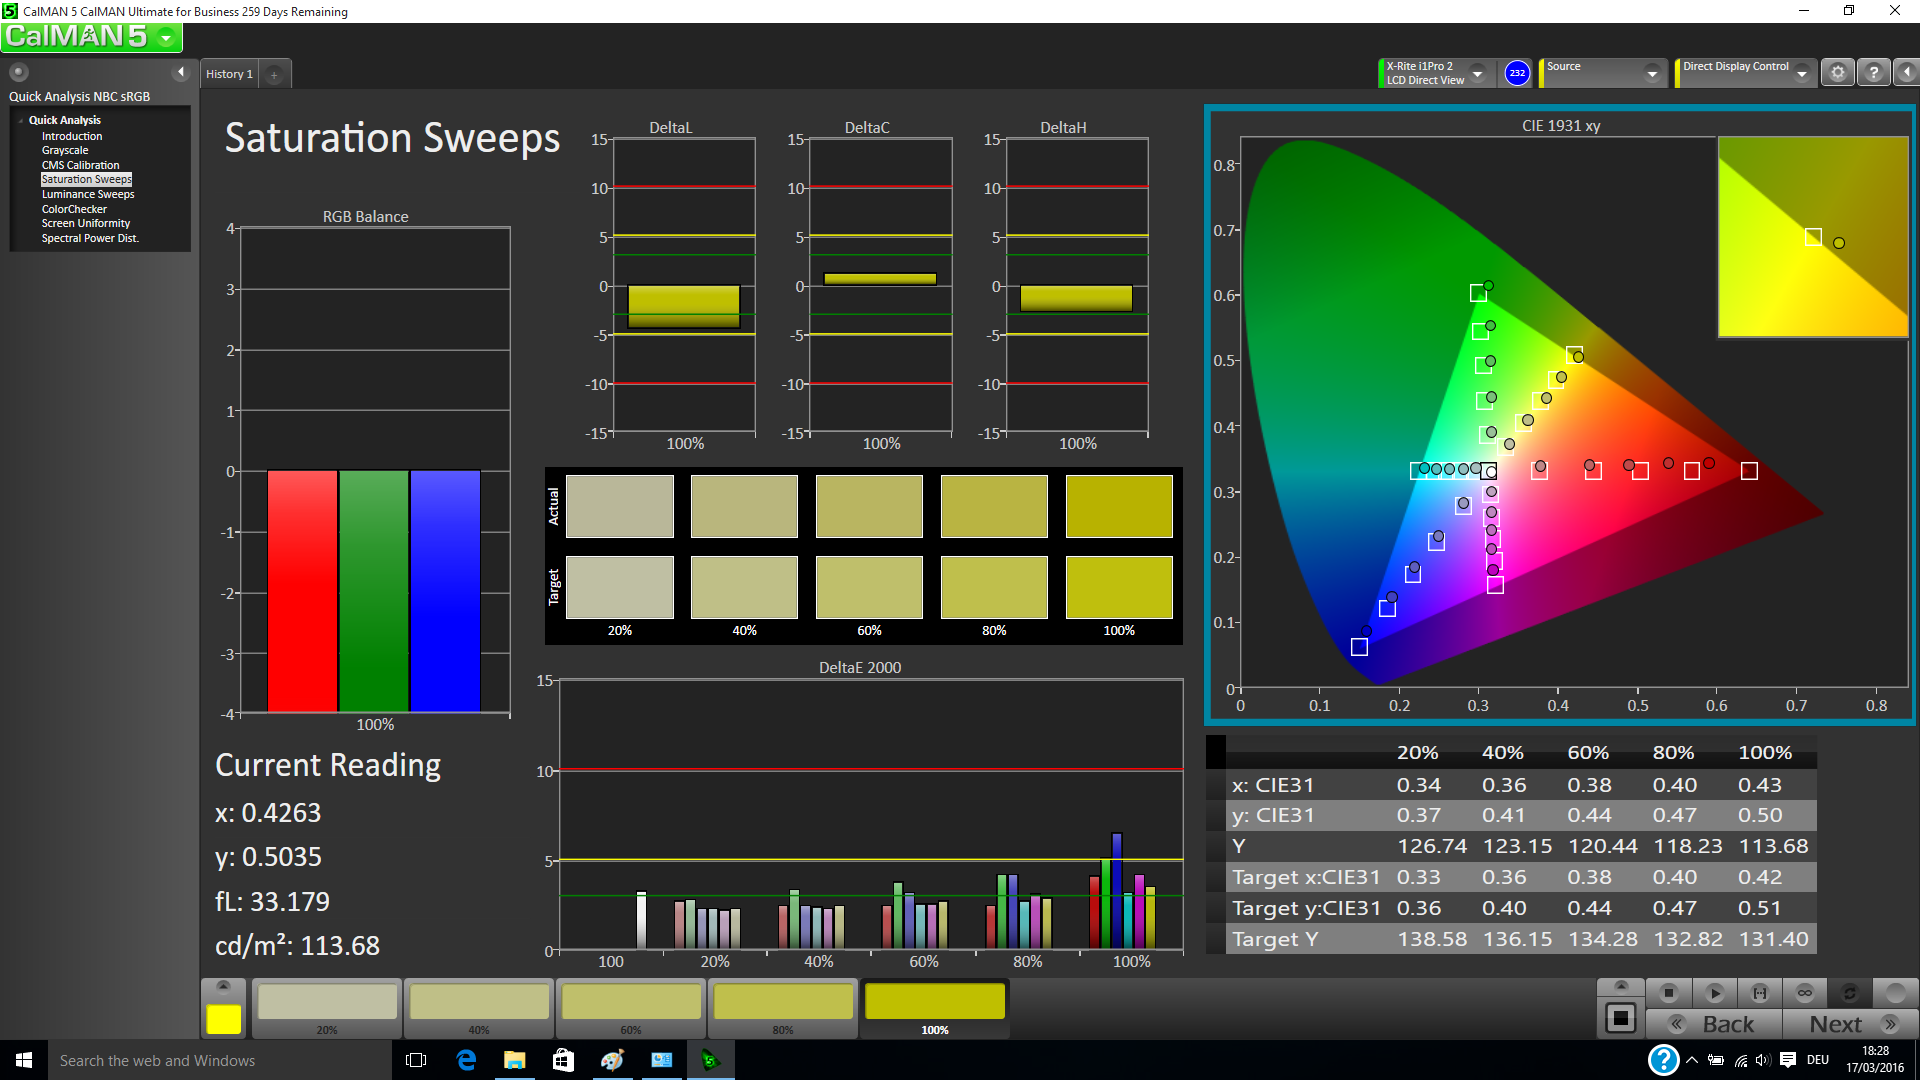
ΔE ColorChecker Calman: 9.7 | ∀{0.5-29.43 Ø4.73}
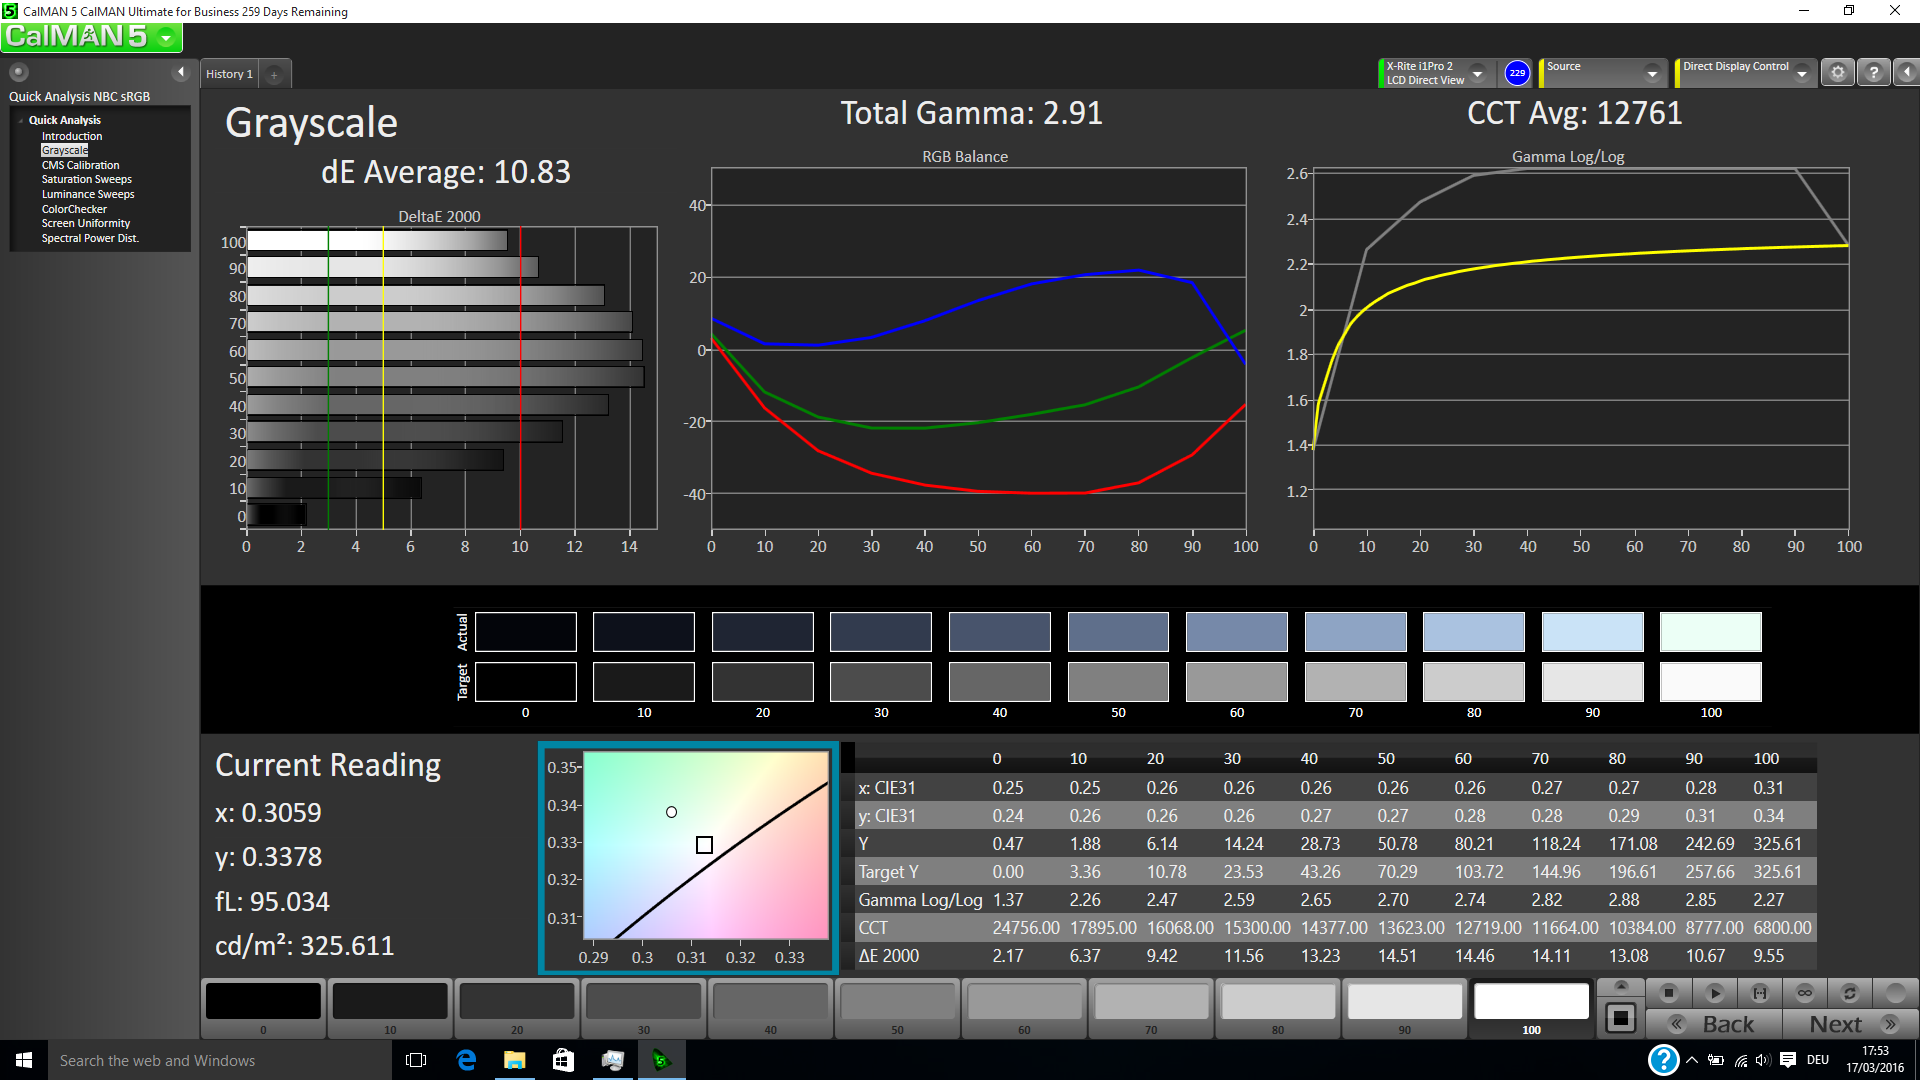
ΔE Greyscale Calman: 10.83 | ∀{0.09-98 Ø4.97}
78.96% sRGB (Argyll 1.6.3 3D)
51.15% AdobeRGB 1998 (Argyll 1.6.3 3D)
56% AdobeRGB 1998 (Argyll 3D)
79.3% sRGB (Argyll 3D)
54.2% Display P3 (Argyll 3D)
Gamma: 2.91
CCT: 12761 K
Cintilação da tela / PWM (modulação por largura de pulso)
| Tela tremeluzindo/PWM detectado | 200 Hz | ≤ 50 % configuração de brilho | 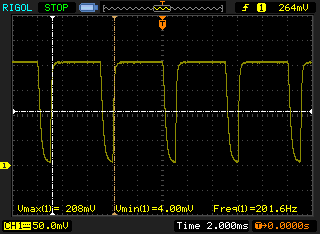 |
A luz de fundo da tela pisca em 200 Hz (pior caso, por exemplo, utilizando PWM) Cintilação detectada em uma configuração de brilho de 50 % e abaixo. Não deve haver cintilação ou PWM acima desta configuração de brilho. A frequência de 200 Hz é relativamente baixa, portanto, usuários sensíveis provavelmente notarão cintilação e sentirão fadiga ocular na configuração de brilho indicada e abaixo. [pwm_comparison] Em comparação: 52 % de todos os dispositivos testados não usam PWM para escurecer a tela. Se PWM foi detectado, uma média de 7798 (mínimo: 5 - máximo: 343500) Hz foi medida. | |||
Exibir tempos de resposta
| ↔ Tempo de resposta preto para branco | ||
|---|---|---|
| 27.2 ms ... ascensão ↗ e queda ↘ combinadas | ↗ 9.2 ms ascensão | 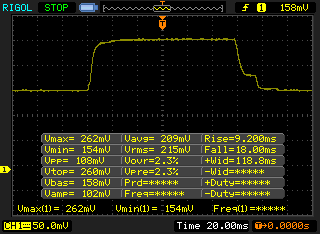 |
| ↘ 18 ms queda | ||
| A tela mostra taxas de resposta relativamente lentas em nossos testes e pode ser muito lenta para os jogadores. Em comparação, todos os dispositivos testados variam de 0.1 (mínimo) a 240 (máximo) ms. » 69 % de todos os dispositivos são melhores. Isso significa que o tempo de resposta medido é pior que a média de todos os dispositivos testados (19.9 ms). | ||
| ↔ Tempo de resposta 50% cinza a 80% cinza | ||
| 46.4 ms ... ascensão ↗ e queda ↘ combinadas | ↗ 22.4 ms ascensão | 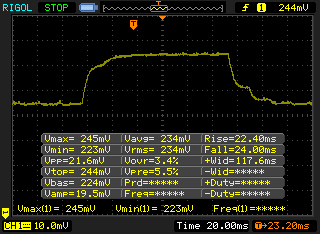 |
| ↘ 24 ms queda | ||
| A tela mostra taxas de resposta lentas em nossos testes e será insatisfatória para os jogadores. Em comparação, todos os dispositivos testados variam de 0.165 (mínimo) a 636 (máximo) ms. » 80 % de todos os dispositivos são melhores. Isso significa que o tempo de resposta medido é pior que a média de todos os dispositivos testados (31.1 ms). | ||
| HP EliteBook 850 G3 TN LED, 1920x1080 | HP EliteBook 850 G2 J8R68EA TN-Panel, 1920x1080 | Lenovo ThinkPad T560-20FH001FGE IPS-Panel, 1920x1080 | Toshiba Tecra Z50-C-10P IPS-Panel, 1920x1080 | Dell Latitude E5550 Broadwell IPS, 1920x1080 | |
|---|---|---|---|---|---|
| Display | 3% | -24% | 13% | 21% | |
| Display P3 Coverage (%) | 54.2 | 56.5 4% | 40.96 -24% | 65.4 21% | 65.6 21% |
| sRGB Coverage (%) | 79.3 | 80.7 2% | 61.3 -23% | 84.6 7% | 95.3 20% |
| AdobeRGB 1998 Coverage (%) | 56 | 58.4 4% | 42.36 -24% | 61.8 10% | 67.6 21% |
| Response Times | -29% | 31% | |||
| Response Time Grey 50% / Grey 80% * (ms) | 46.4 ? | 58 ? -25% | 20 ? 57% | ||
| Response Time Black / White * (ms) | 27.2 ? | 36 ? -32% | 26 ? 4% | ||
| PWM Frequency (Hz) | 200 ? | 220 ? | 50 ? | ||
| Screen | 3% | 8% | 32% | 18% | |
| Brightness middle (cd/m²) | 290 | 314 8% | 243 -16% | 288 -1% | 312 8% |
| Brightness (cd/m²) | 287 | 294 2% | 220 -23% | 277 -3% | 295 3% |
| Brightness Distribution (%) | 85 | 88 4% | 84 -1% | 83 -2% | 77 -9% |
| Black Level * (cd/m²) | 0.54 | 0.66 -22% | 0.27 50% | 0.27 50% | 0.53 2% |
| Contrast (:1) | 537 | 476 -11% | 900 68% | 1067 99% | 589 10% |
| Colorchecker dE 2000 * | 9.7 | 7.43 23% | 7.49 23% | 4.7 52% | 4.32 55% |
| Colorchecker dE 2000 max. * | 14.39 | 15.13 -5% | 11.7 19% | ||
| Greyscale dE 2000 * | 10.83 | 9.25 15% | 7.5 31% | 3.1 71% | 5.34 51% |
| Gamma | 2.91 76% | 2.49 88% | 2.35 94% | 2.7 81% | 2.71 81% |
| CCT | 12761 51% | 10786 60% | 6115 106% | 6603 98% | 6998 93% |
| Color Space (Percent of AdobeRGB 1998) (%) | 51.15 | 52.3 2% | 38.9 -24% | 61.9 21% | 62 21% |
| Color Space (Percent of sRGB) (%) | 78.96 | 60.9 -23% | 90.3 14% | ||
| Média Total (Programa/Configurações) | 3% /
3% | -15% /
-3% | 25% /
28% | 20% /
18% |
* ... menor é melhor


| Cinebench R15 | |
| CPU Multi 64Bit | |
| HP EliteBook 850 G3 | |
| HP EliteBook 850 G2 J8R68EA | |
| Lenovo ThinkPad T560-20FH001FGE | |
| Toshiba Tecra Z50-C-10P | |
| Dell Latitude E5550 Broadwell | |
| CPU Single 64Bit | |
| HP EliteBook 850 G3 | |
| HP EliteBook 850 G2 J8R68EA | |
| Dell Latitude E5550 Broadwell | |
| Lenovo ThinkPad T560-20FH001FGE | |
| Toshiba Tecra Z50-C-10P | |
| Cinebench R10 | |
| Rendering Multiple CPUs 32Bit | |
| HP EliteBook 850 G3 | |
| HP EliteBook 850 G2 J8R68EA | |
| Lenovo ThinkPad T560-20FH001FGE | |
| Dell Latitude E5550 Broadwell | |
| Rendering Single 32Bit | |
| HP EliteBook 850 G3 | |
| HP EliteBook 850 G2 J8R68EA | |
| Dell Latitude E5550 Broadwell | |
| Lenovo ThinkPad T560-20FH001FGE | |
| Geekbench 3 | |
| 32 Bit Single-Core Score | |
| HP EliteBook 850 G3 | |
| HP EliteBook 850 G2 J8R68EA | |
| Dell Latitude E5550 Broadwell | |
| Lenovo ThinkPad T560-20FH001FGE | |
| 32 Bit Multi-Core Score | |
| HP EliteBook 850 G3 | |
| HP EliteBook 850 G2 J8R68EA | |
| Lenovo ThinkPad T560-20FH001FGE | |
| Dell Latitude E5550 Broadwell | |
| Sunspider - 1.0 Total Score | |
| Dell Latitude E5550 Broadwell | |
| HP EliteBook 850 G2 J8R68EA | |
| Lenovo ThinkPad T560-20FH001FGE | |
| HP EliteBook 850 G3 | |
| JetStream 1.1 - 1.1 Total | |
| HP EliteBook 850 G3 | |
| Lenovo ThinkPad T560-20FH001FGE | |
| Toshiba Tecra Z50-C-10P | |
| Mozilla Kraken 1.1 - Total | |
| Dell Latitude E5550 Broadwell | |
| HP EliteBook 850 G2 J8R68EA | |
| Lenovo ThinkPad T560-20FH001FGE | |
| HP EliteBook 850 G3 | |
| Octane V2 - Total Score | |
| HP EliteBook 850 G3 | |
| Lenovo ThinkPad T560-20FH001FGE | |
| HP EliteBook 850 G2 J8R68EA | |
| Dell Latitude E5550 Broadwell | |
| Peacekeeper - --- | |
| HP EliteBook 850 G3 | |
| HP EliteBook 850 G2 J8R68EA | |
| Dell Latitude E5550 Broadwell | |
| Lenovo ThinkPad T560-20FH001FGE | |
* ... menor é melhor
| PCMark 7 Score | 5201 pontos | |
| PCMark 8 Home Score Accelerated v2 | 3202 pontos | |
| PCMark 8 Creative Score Accelerated v2 | 3932 pontos | |
| PCMark 8 Work Score Accelerated v2 | 4232 pontos | |
Ajuda | ||
| PCMark 8 - Work Score Accelerated v2 | |
| HP EliteBook 850 G2 J8R68EA | |
| HP EliteBook 850 G3 | |
| Lenovo ThinkPad T560-20FH001FGE | |
| Dell Latitude E5550 Broadwell | |
| Toshiba Tecra Z50-C-10P | |
| PCMark 7 - Score | |
| HP EliteBook 850 G3 | |
| HP EliteBook 850 G2 J8R68EA | |
| Dell Latitude E5550 Broadwell | |
| Lenovo ThinkPad T560-20FH001FGE | |

| 3DMark 06 Standard Score | 8335 pontos | |
| 3DMark 11 Performance | 1461 pontos | |
| 3DMark Ice Storm Standard Score | 49073 pontos | |
| 3DMark Cloud Gate Standard Score | 5265 pontos | |
| 3DMark Fire Strike Score | 743 pontos | |
Ajuda | ||
| 3DMark 11 - 1280x720 Performance | |
| HP EliteBook 850 G2 J8R68EA | |
| HP EliteBook 850 G3 | |
| Toshiba Tecra Z50-C-10P | |
| Lenovo ThinkPad T560-20FH001FGE | |
| Dell Latitude E5550 Broadwell | |
| 3DMark | |
| 1280x720 Ice Storm Standard Score | |
| HP EliteBook 850 G3 | |
| Dell Latitude E5550 Broadwell | |
| Toshiba Tecra Z50-C-10P | |
| Lenovo ThinkPad T560-20FH001FGE | |
| HP EliteBook 850 G2 J8R68EA | |
| 1280x720 Cloud Gate Standard Score | |
| HP EliteBook 850 G2 J8R68EA | |
| HP EliteBook 850 G3 | |
| Toshiba Tecra Z50-C-10P | |
| Dell Latitude E5550 Broadwell | |
| Lenovo ThinkPad T560-20FH001FGE | |
| 1280x720 Sky Diver Score | |
| HP EliteBook 850 G3 | |
| Dell Latitude E5550 Broadwell | |
| 1920x1080 Fire Strike Score | |
| HP EliteBook 850 G2 J8R68EA | |
| HP EliteBook 850 G3 | |
| Dell Latitude E5550 Broadwell | |
| Toshiba Tecra Z50-C-10P | |
| Lenovo ThinkPad T560-20FH001FGE | |
| 3DMark 06 - 1280x1024 Standard Score AA:0x AF:0x | |
| HP EliteBook 850 G2 J8R68EA | |
| HP EliteBook 850 G3 | |
| Lenovo ThinkPad T560-20FH001FGE | |
| Dell Latitude E5550 Broadwell | |
| baixo | média | alto | ultra | |
|---|---|---|---|---|
| Tomb Raider (2013) | 57 | 28 | 18.3 | 8.8 |
| BioShock Infinite (2013) | 37.4 | 21.7 | 18.2 | 5.5 |
| Battlefield 4 (2013) | 33.4 | 25.3 | 15.1 | 4.1 |
Barulho
| Ocioso |
| 29 / 29 / 29 dB |
| Carga |
| 32.6 / 34.6 dB |
 | ||
30 dB silencioso 40 dB(A) audível 50 dB(A) ruidosamente alto |
||
min: | ||
| HP EliteBook 850 G3 6500U, HD Graphics 520 | HP EliteBook 850 G2 J8R68EA 5500U, Radeon R7 M260X | Lenovo ThinkPad T560-20FH001FGE 6200U, HD Graphics 520 | Toshiba Tecra Z50-C-10P 6200U, HD Graphics 520 | Dell Latitude E5550 Broadwell 5300U, HD Graphics 5500 | |
|---|---|---|---|---|---|
| Noise | -9% | -3% | -7% | -11% | |
| desligado / ambiente * (dB) | 29 | 29 -0% | 31.2 -8% | ||
| Idle Minimum * (dB) | 29 | 28.9 -0% | 30.8 -6% | 32.4 -12% | 29.6 -2% |
| Idle Average * (dB) | 29 | 28.9 -0% | 30.8 -6% | 32.4 -12% | 29.6 -2% |
| Idle Maximum * (dB) | 29 | 28.9 -0% | 30.8 -6% | 32.4 -12% | 29.6 -2% |
| Load Average * (dB) | 32.6 | 40.7 -25% | 33.1 -2% | 33.5 -3% | 38.1 -17% |
| Load Maximum * (dB) | 34.6 | 41.3 -19% | 34.4 1% | 33.5 3% | 46.4 -34% |
* ... menor é melhor
(+) A temperatura máxima no lado superior é 33.4 °C / 92 F, em comparação com a média de 34.3 °C / 94 F , variando de 21.2 a 62.5 °C para a classe Office.
(+) A parte inferior aquece até um máximo de 36.4 °C / 98 F, em comparação com a média de 36.8 °C / 98 F
(+) Em uso inativo, a temperatura média para o lado superior é 27.3 °C / 81 F, em comparação com a média do dispositivo de 29.5 °C / ### class_avg_f### F.
(+) Os apoios para as mãos e o touchpad são mais frios que a temperatura da pele, com um máximo de 26.7 °C / 80.1 F e, portanto, são frios ao toque.
(±) A temperatura média da área do apoio para as mãos de dispositivos semelhantes foi 27.5 °C / 81.5 F (+0.8 °C / 1.4 F).
| HP EliteBook 850 G3 6500U, HD Graphics 520 | HP EliteBook 850 G2 J8R68EA 5500U, Radeon R7 M260X | Lenovo ThinkPad T560-20FH001FGE 6200U, HD Graphics 520 | Toshiba Tecra Z50-C-10P 6200U, HD Graphics 520 | Dell Latitude E5550 Broadwell 5300U, HD Graphics 5500 | |
|---|---|---|---|---|---|
| Heat | -17% | 1% | 0% | -19% | |
| Maximum Upper Side * (°C) | 33.4 | 43.8 -31% | 33.3 -0% | 36 -8% | 42.3 -27% |
| Maximum Bottom * (°C) | 36.4 | 46.5 -28% | 40.1 -10% | 50 -37% | 48 -32% |
| Idle Upper Side * (°C) | 31.4 | 31.7 -1% | 27.4 13% | 23.9 24% | 33.5 -7% |
| Idle Bottom * (°C) | 30.2 | 32.9 -9% | 29.6 2% | 23.8 21% | 33.1 -10% |
* ... menor é melhor
| desligado | |
| Ocioso | |
| Carga |
|
Key:
min: | |
| HP EliteBook 850 G3 6500U, HD Graphics 520 | HP EliteBook 850 G2 J8R68EA 5500U, Radeon R7 M260X | Lenovo ThinkPad T560-20FH001FGE 6200U, HD Graphics 520 | Toshiba Tecra Z50-C-10P 6200U, HD Graphics 520 | Dell Latitude E5550 Broadwell 5300U, HD Graphics 5500 | |
|---|---|---|---|---|---|
| Power Consumption | -5% | 12% | 1% | -12% | |
| Idle Minimum * (Watt) | 5 | 3 40% | 4.3 14% | 4.7 6% | 4.7 6% |
| Idle Average * (Watt) | 7.8 | 6.3 19% | 7.3 6% | 8 -3% | 8 -3% |
| Idle Maximum * (Watt) | 8.4 | 7 17% | 7.8 7% | 9.8 -17% | 10.3 -23% |
| Load Average * (Watt) | 28.8 | 43.7 -52% | 26.3 9% | 29.7 -3% | 40.3 -40% |
| Load Maximum * (Watt) | 43 | 63.7 -48% | 32 26% | 32.6 24% | 43.5 -1% |
* ... menor é melhor
| HP EliteBook 850 G3 46 Wh | HP EliteBook 850 G2 J8R68EA 50 Wh | Lenovo ThinkPad T560-20FH001FGE 67 Wh | Dell Latitude E5550 Broadwell 51 Wh | |
|---|---|---|---|---|
| Duração da bateria | -14% | 41% | -29% | |
| Reader / Idle (h) | 15.3 | 14.6 -5% | 18.1 18% | 12 -22% |
| H.264 (h) | 7.2 | 5.5 -24% | 9.5 32% | 6.5 -10% |
| WiFi v1.3 (h) | 7 | 6.6 -6% | 11 57% | |
| Load (h) | 2.4 | 1.9 -21% | 3.8 58% | 1.1 -54% |
| WiFi (h) | 6.4 |
Pro
Contra
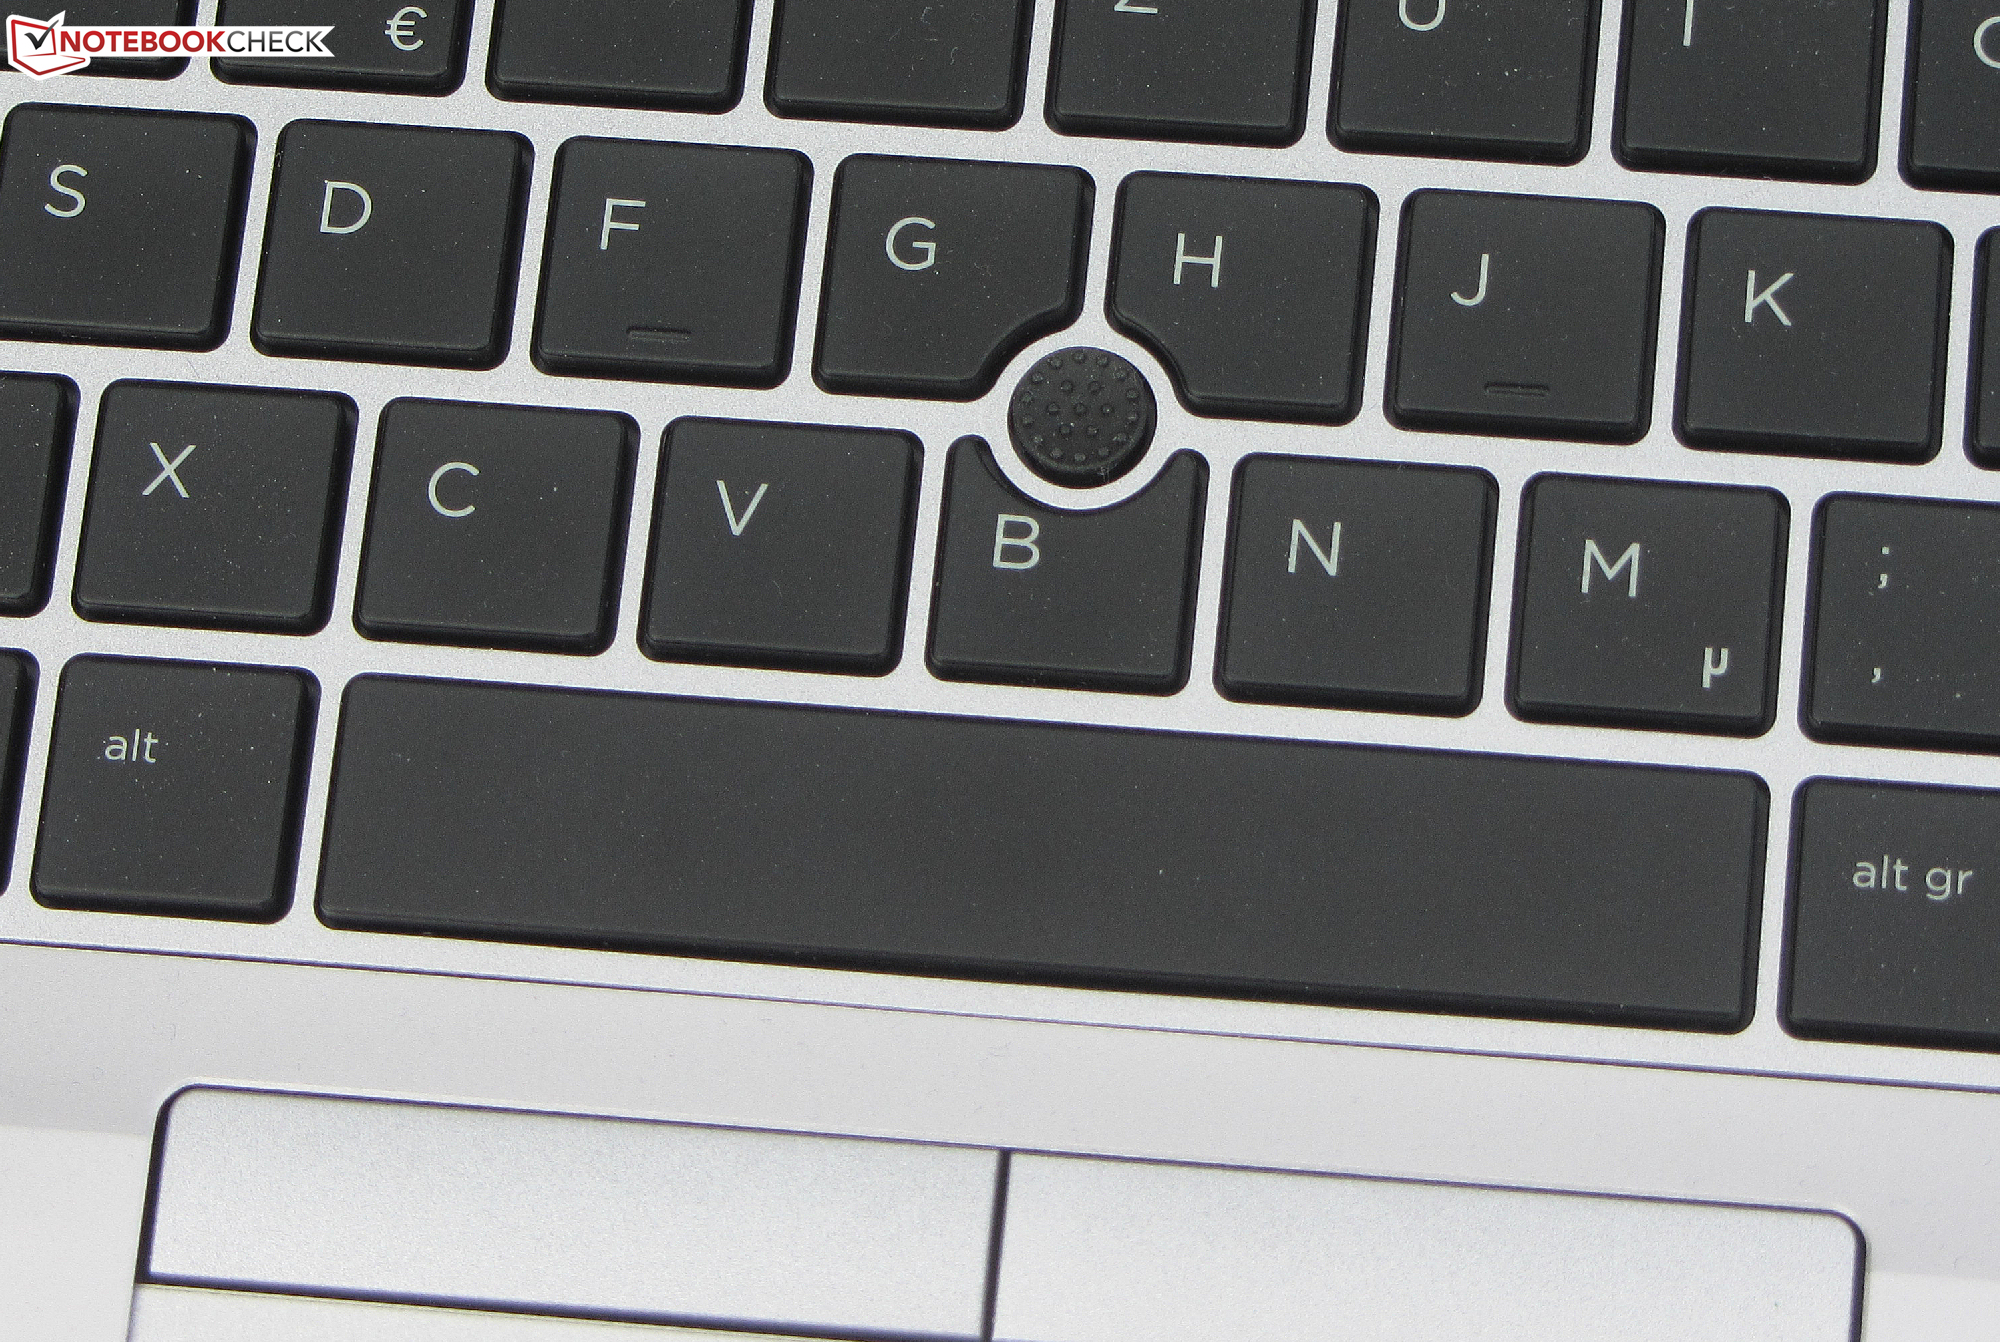
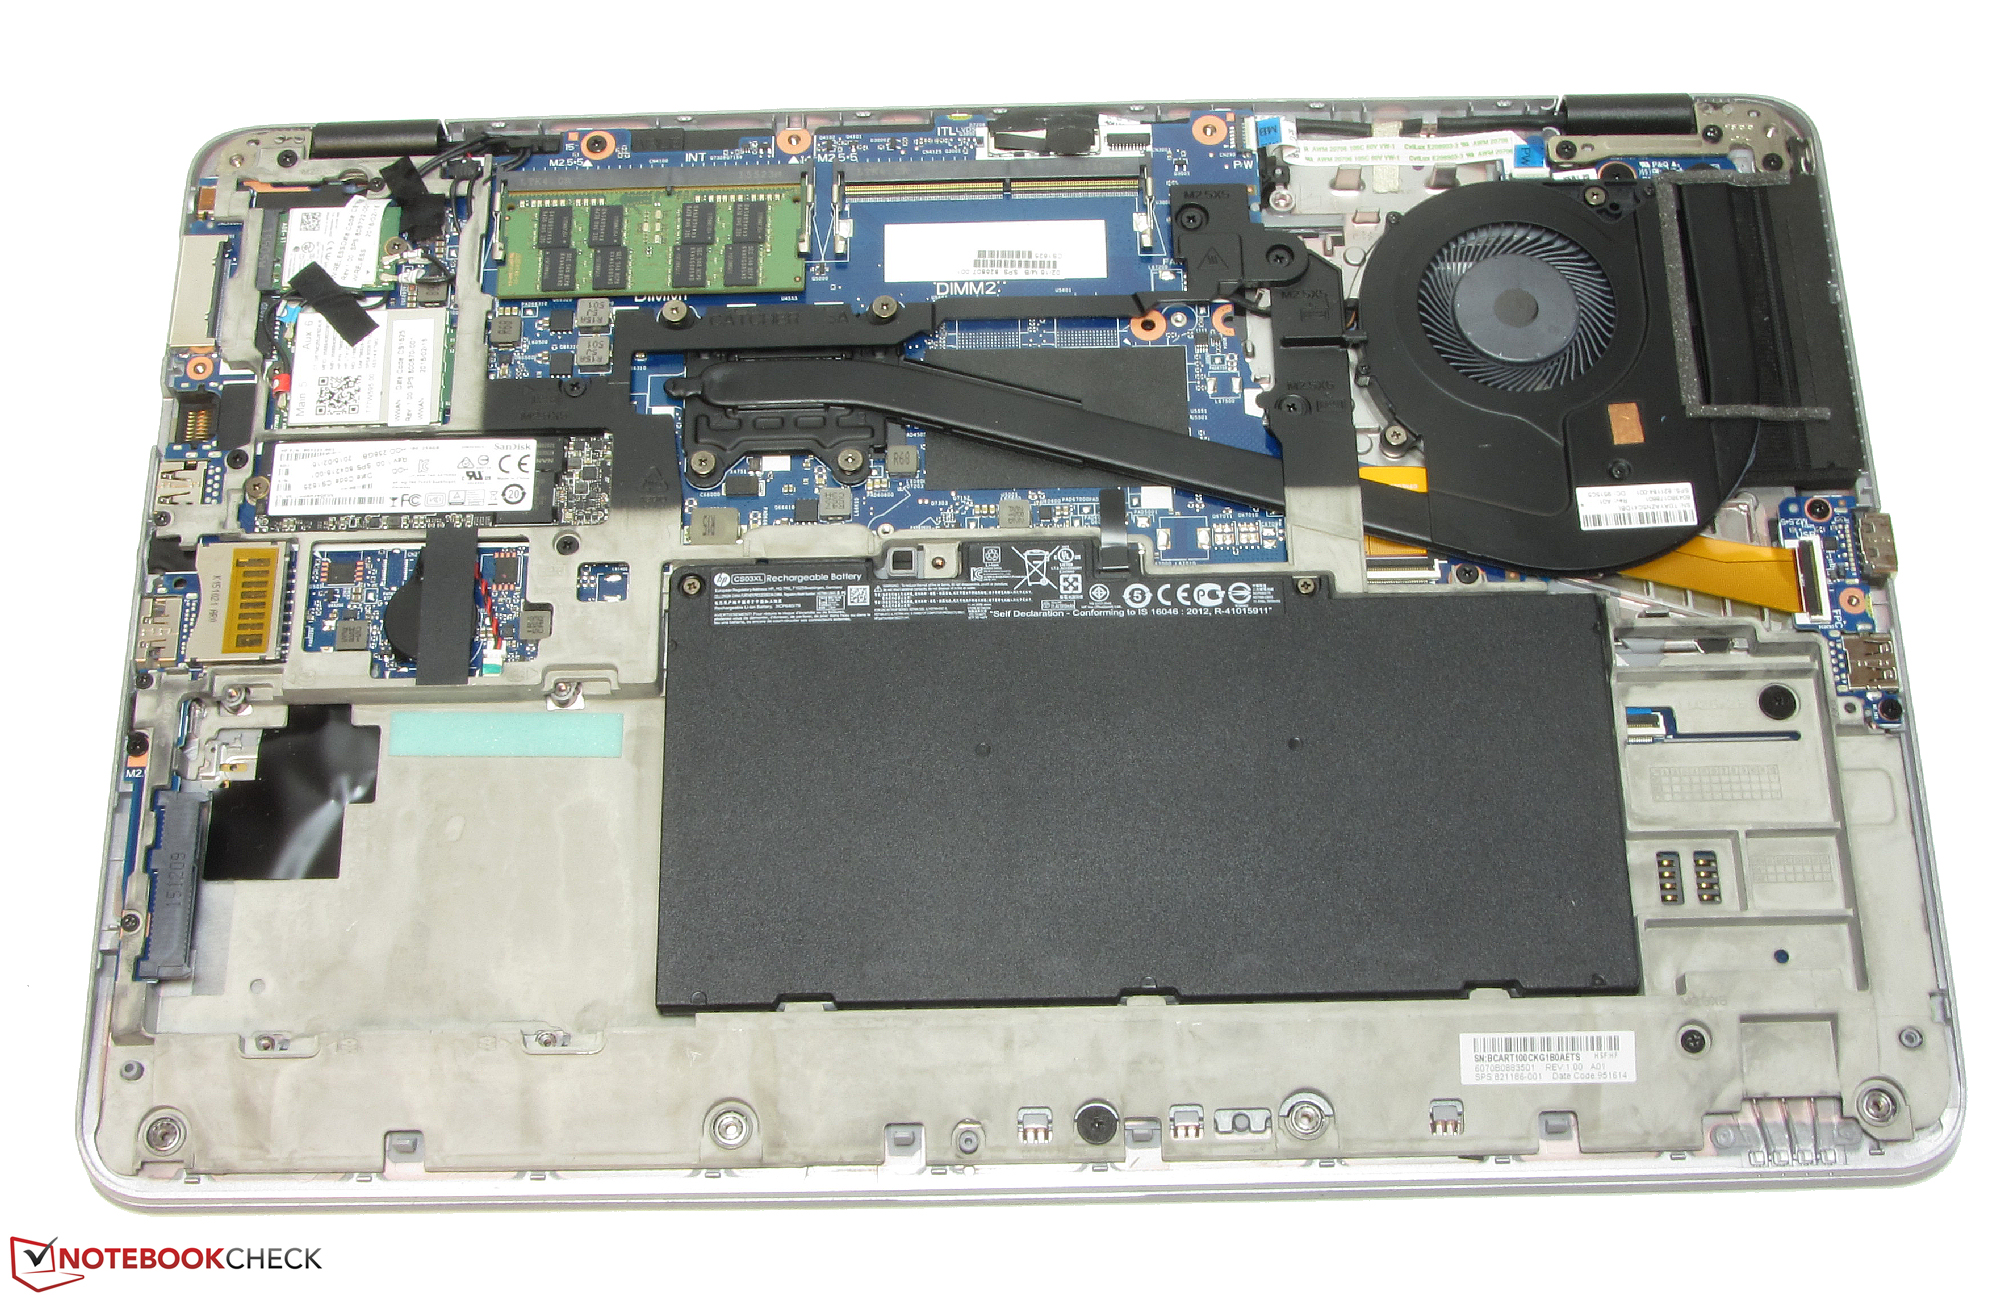
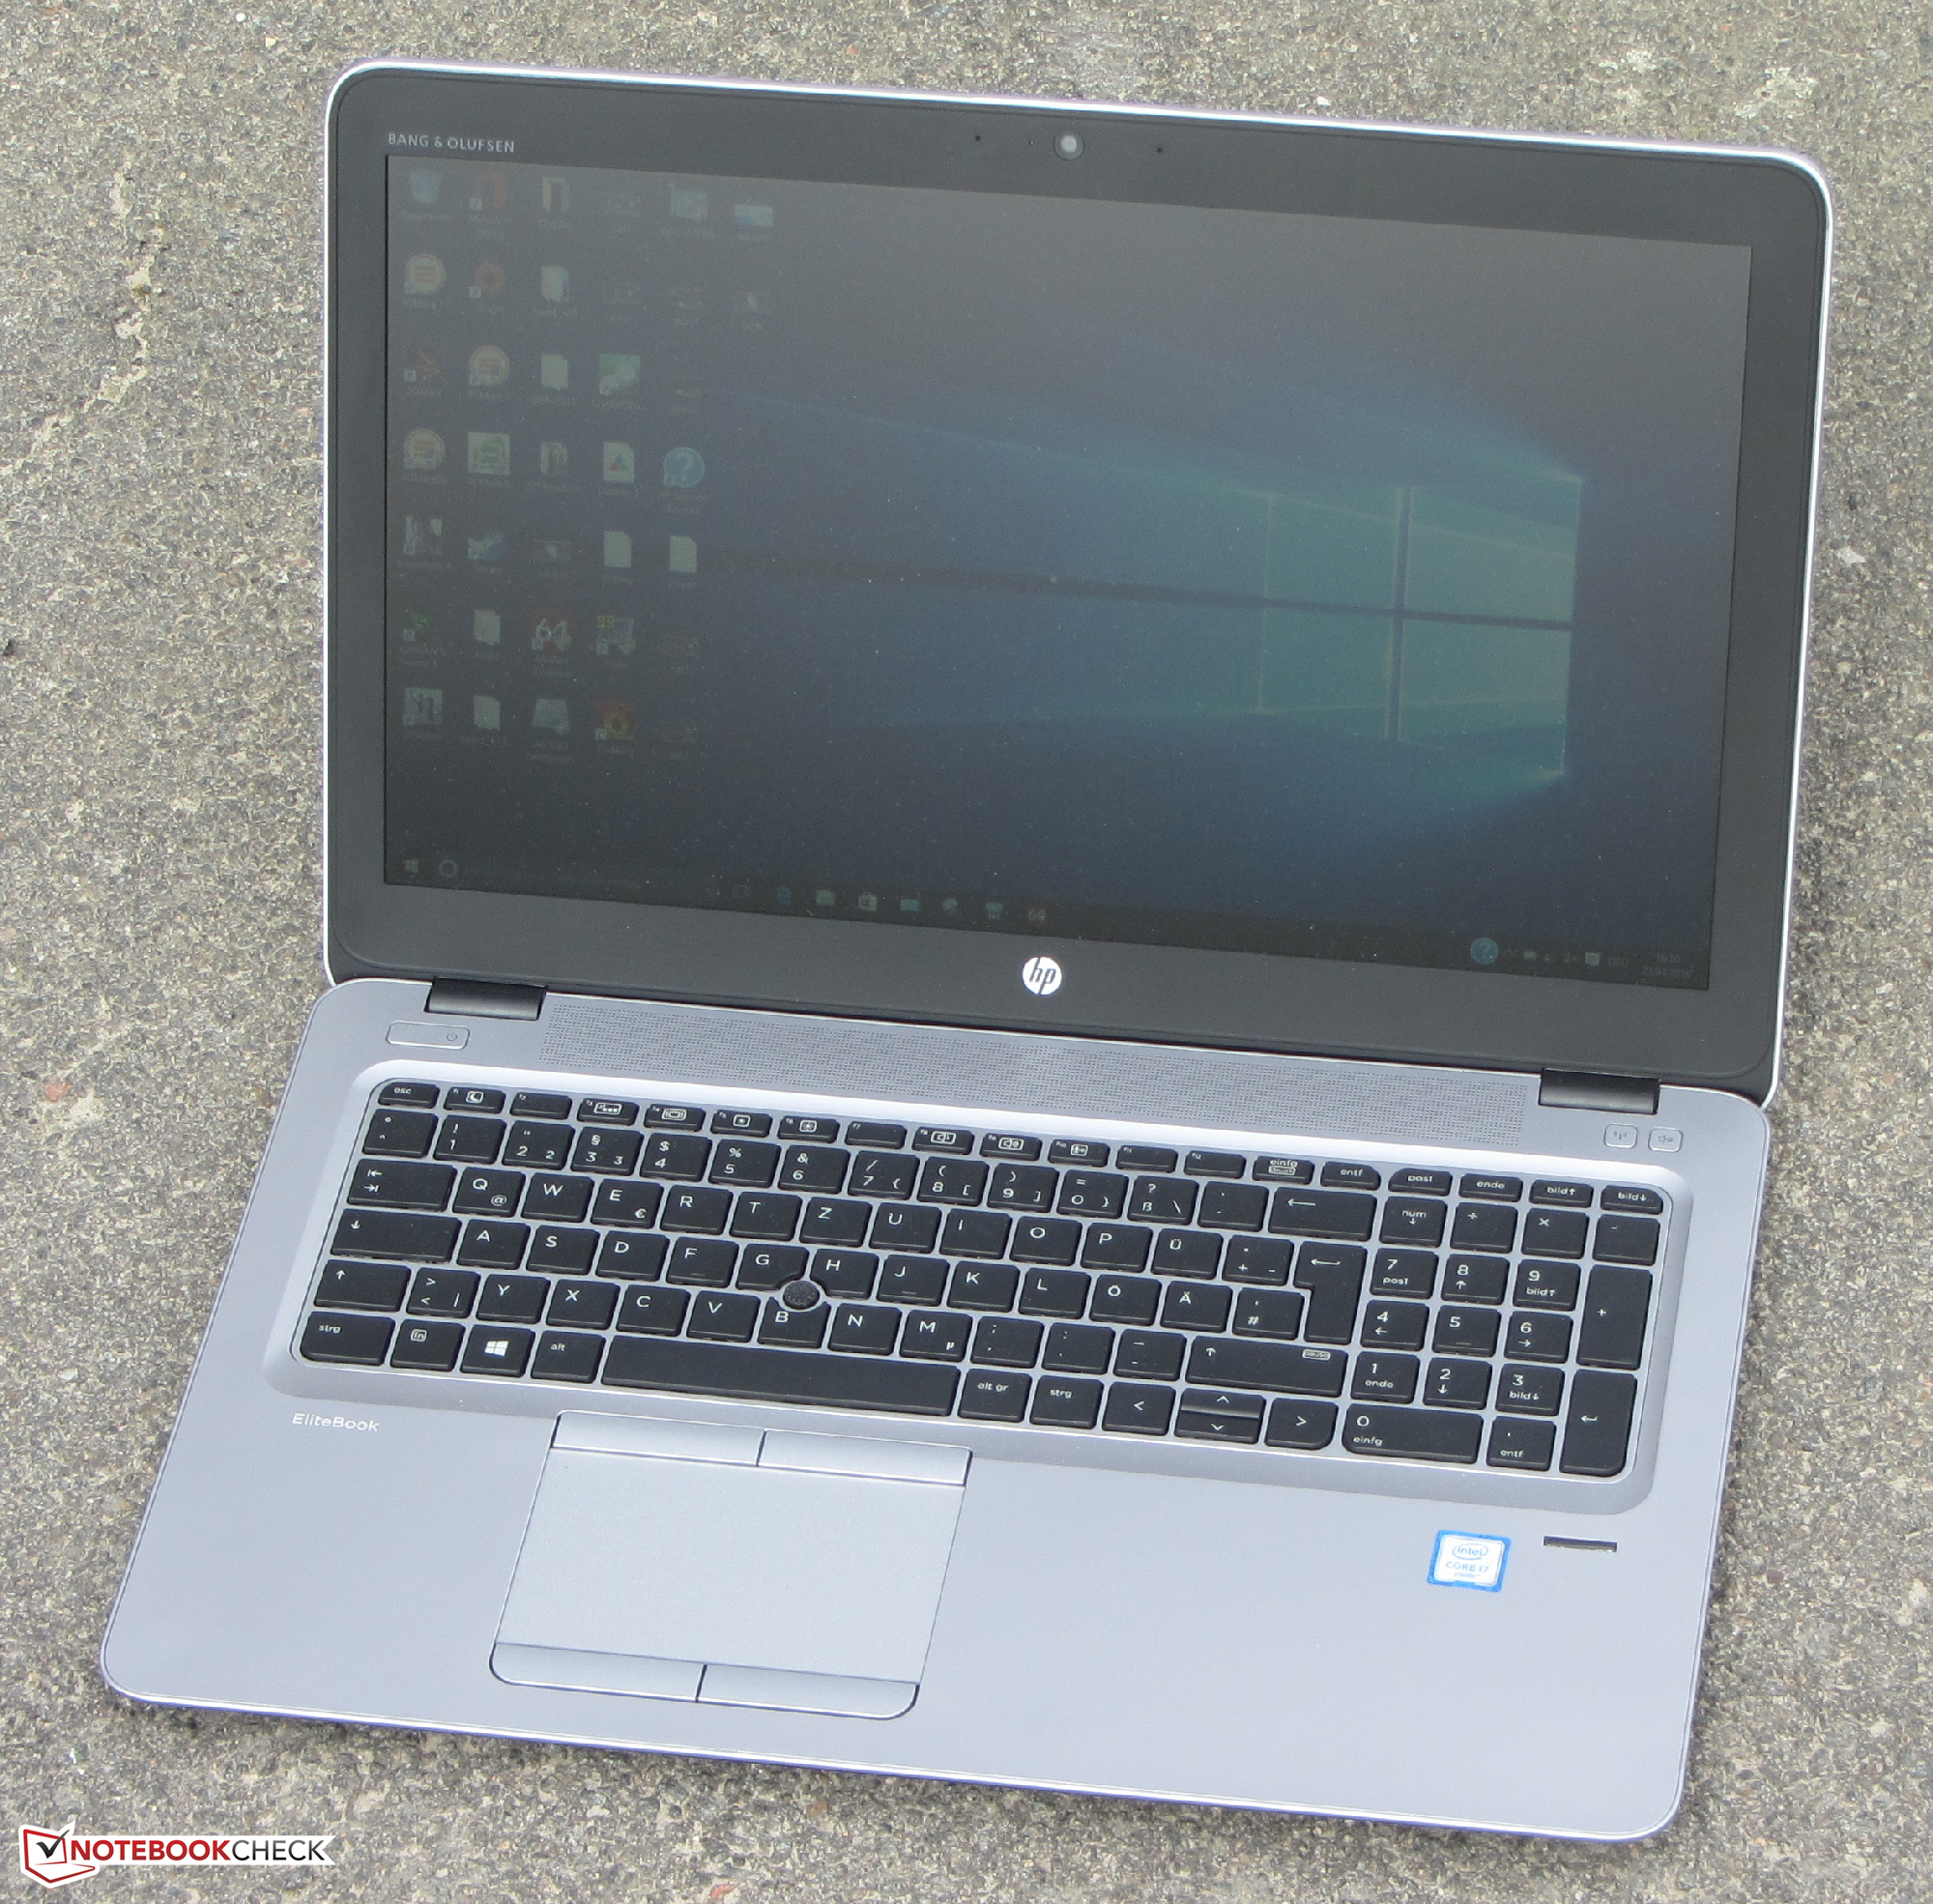
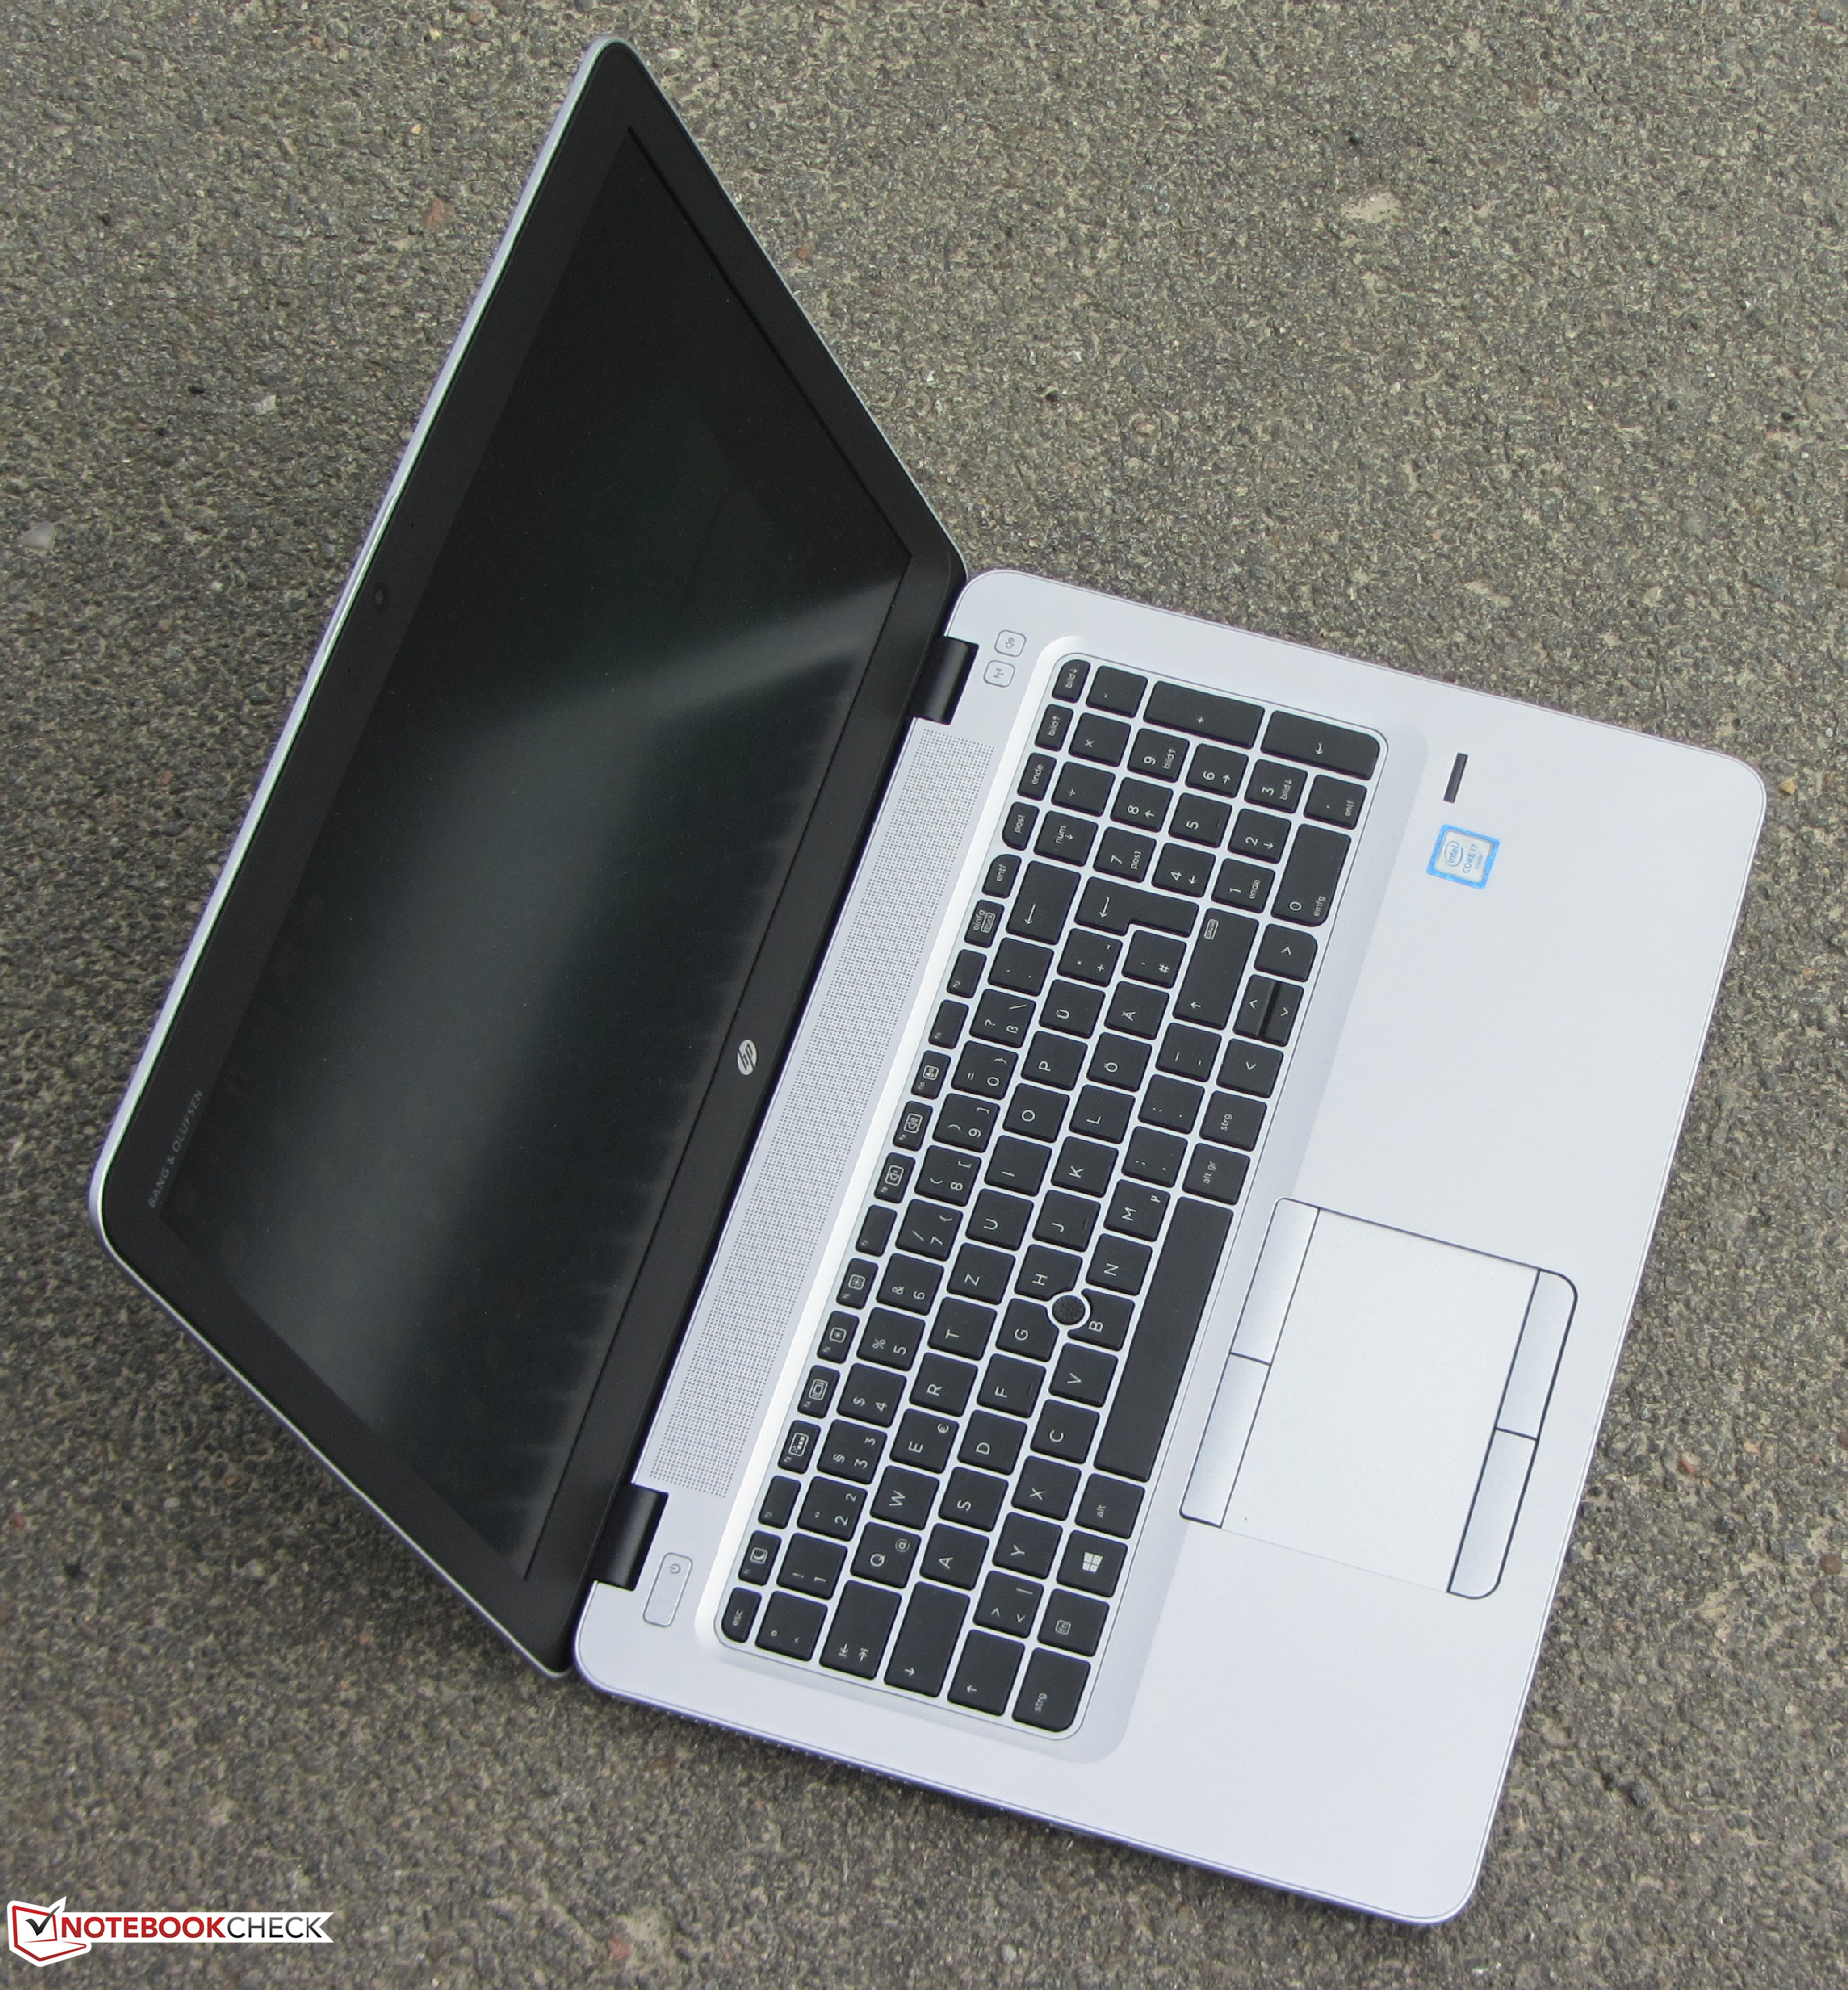
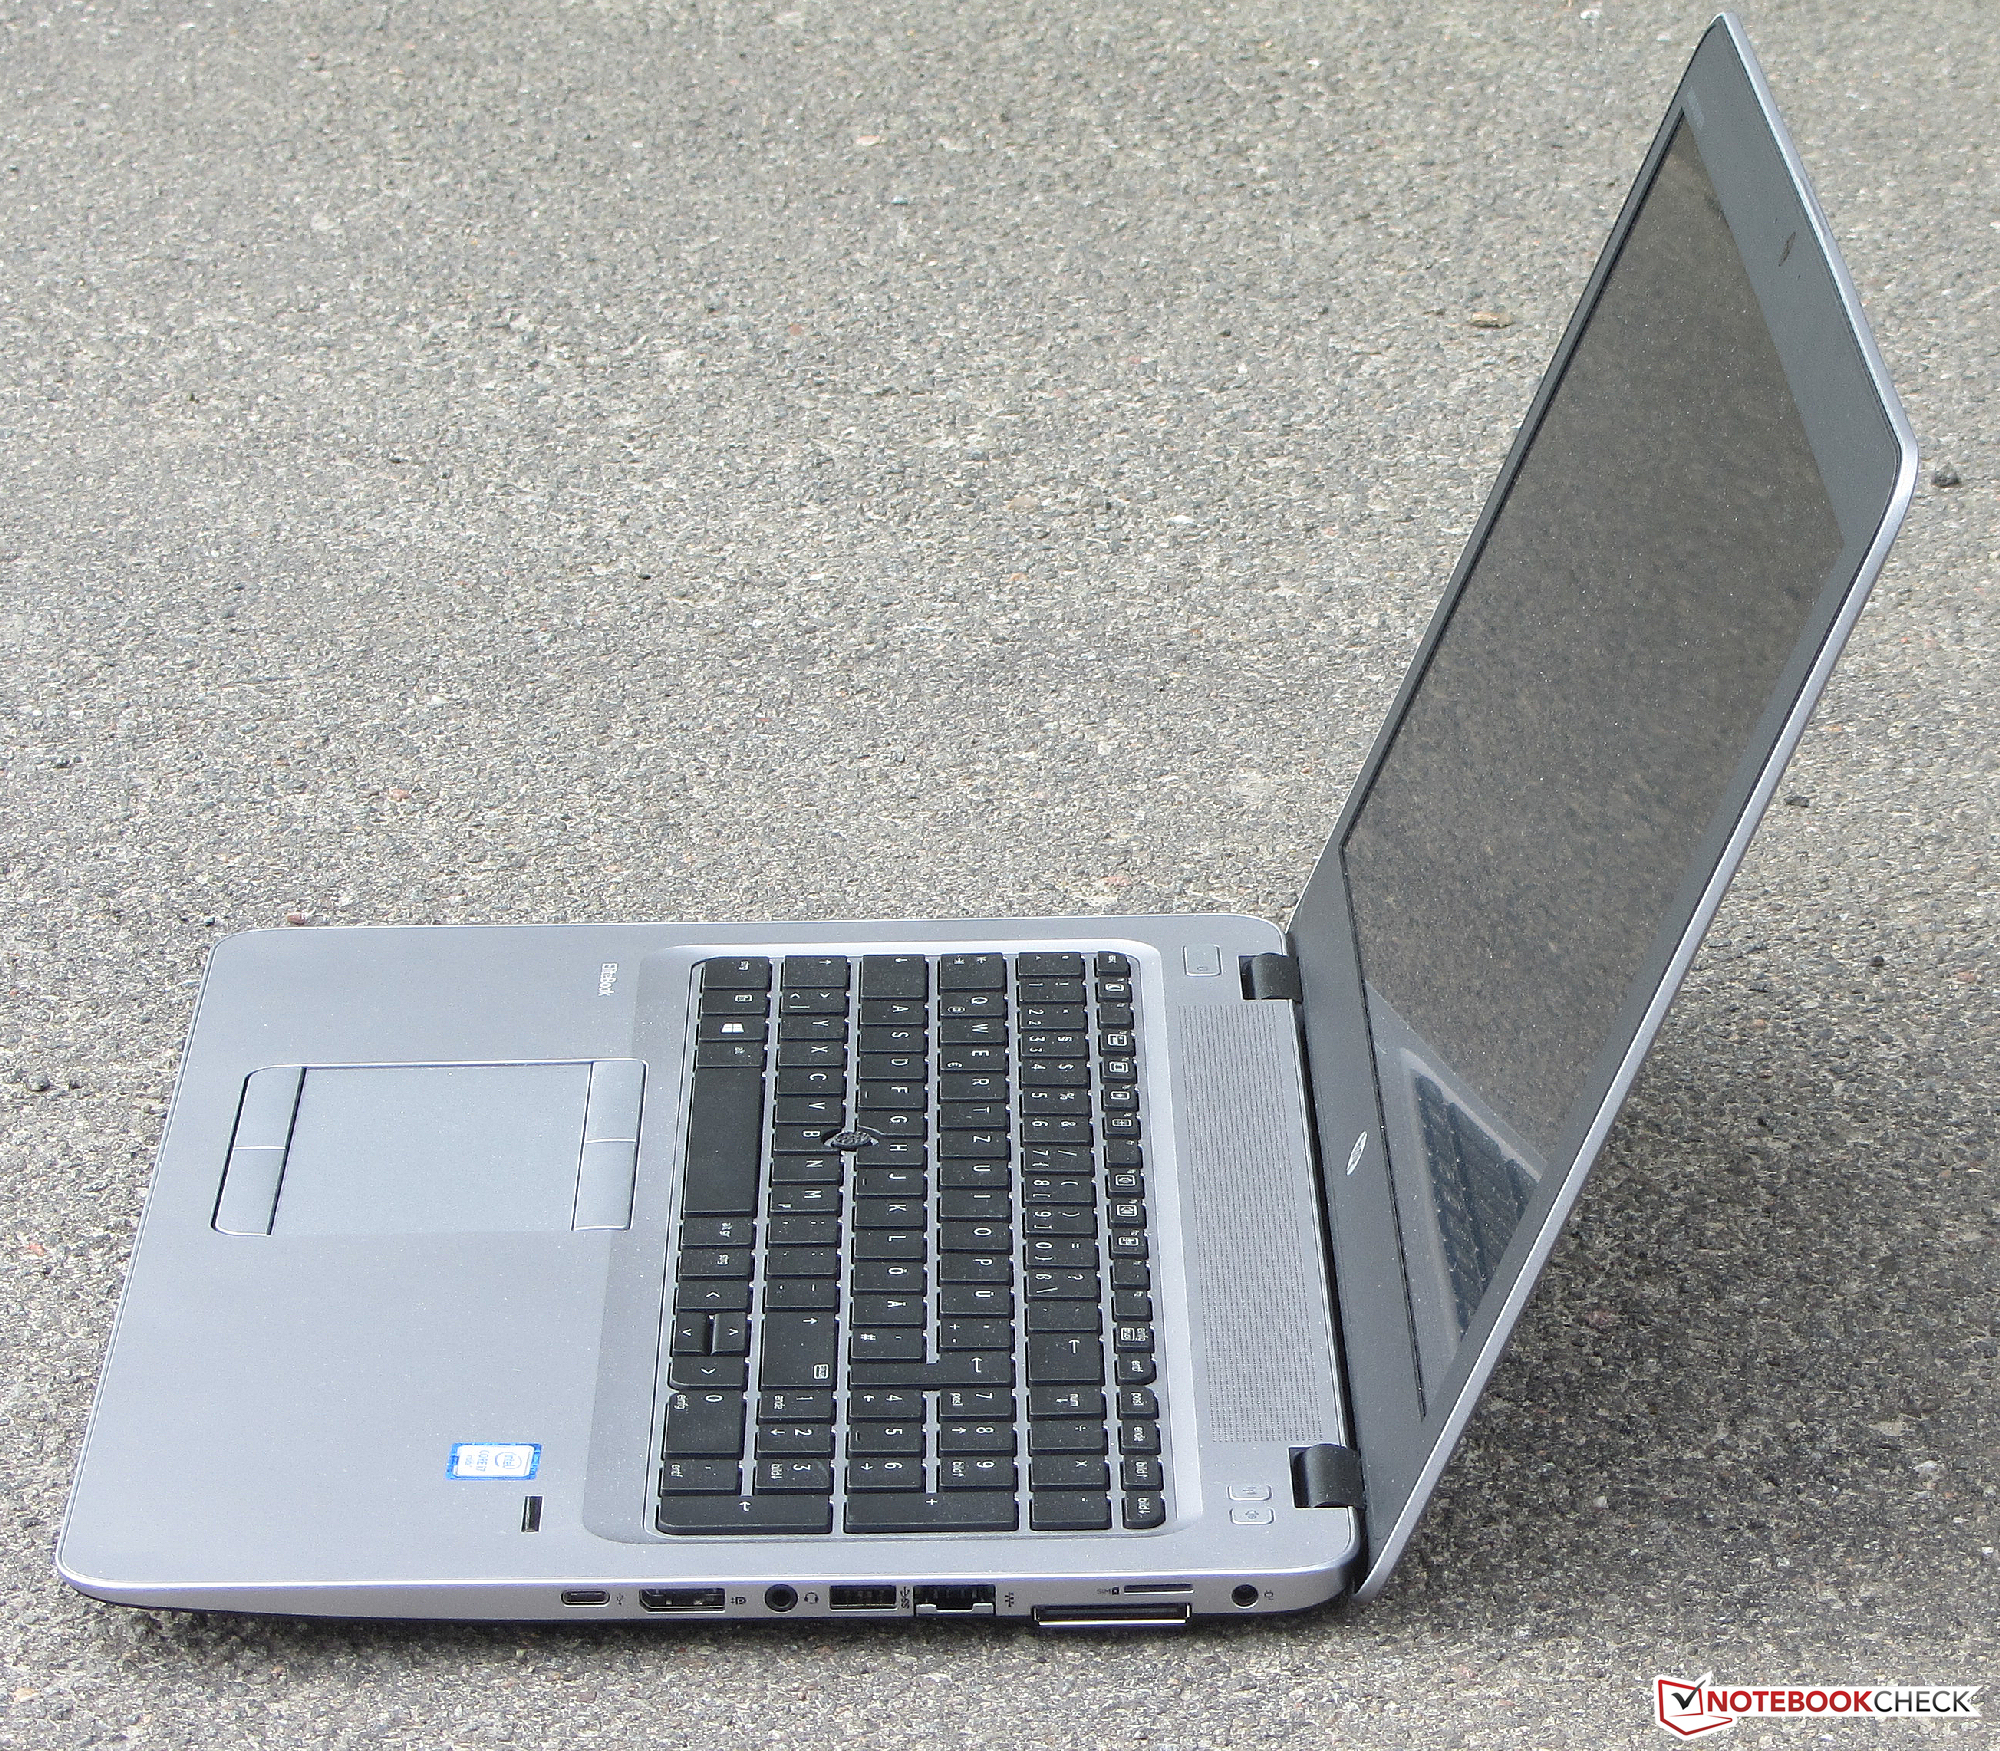
A HP mais uma vez coloca a tecnologia do seu novo EliteBook 850 G3 em uma carcaça de metal de alta qualidade. O aparelho tem uma aparência mais elegante que a do seu predecessor graças à sua aparência mais fina. No entanto, a dieta tem o seu preço: A escotilha de manutenção foi omitida, tornando necessário abrir a carcaça para a manutenção/atualização. O EliteBook possui um poderoso processador Skylake com suficiente poder para todos os campos de aplicação. O portátil sempre roda de forma silenciosa e quase não esquenta, ao mesmo tempo. É possível expandi o portátil mediante um disco rígido de 2,5-polegadas adicional. Os dispositivos de entrada no modelo EliteBook G3 também são muito atraentes. O teclado do portátil é adequado para escritores frequentes. A muito boa duração da bateria complementa isso. No entanto, não é mais possível adicionar uma bateria adicional embaixo do aparelho - em contraste com o predecessor.
O EliteBook 850 G3 é um aparelho de escritório de alta qualidade para usuários que não precisam pensar em economizar cada centavo. No entanto, o portátil tem desvantagens, apesar do seu preço alto. Os usuários também valoram a fácil manutenção / opções de atualização e não querem renunciar a um segundo de bateria, tal vez estarão mais contentes com o EliteBook 850 G2.
Infelizmente, a HP também repete uma fraqueza típica da HP neste portátil: a tela. Os compradores que pagam mais de 1500 Euros (~$1724) por um portátil esperam uma excelente tela. No entanto, não encontrarão isso aqui. A qualidade mais positiva da tela é sua superfície mate. O brilho pode ser chamado de satisfatório, mas não o contraste, nem a reprodução de cores. Além disso, é uma tela dependente dos ângulos de visão.
Esta é uma versão reduzida da análise original. Você pode ler a análise completa em inglês aqui.
HP EliteBook 850 G3
- 04/25/2016 v5.1 (old)
Sascha Mölck