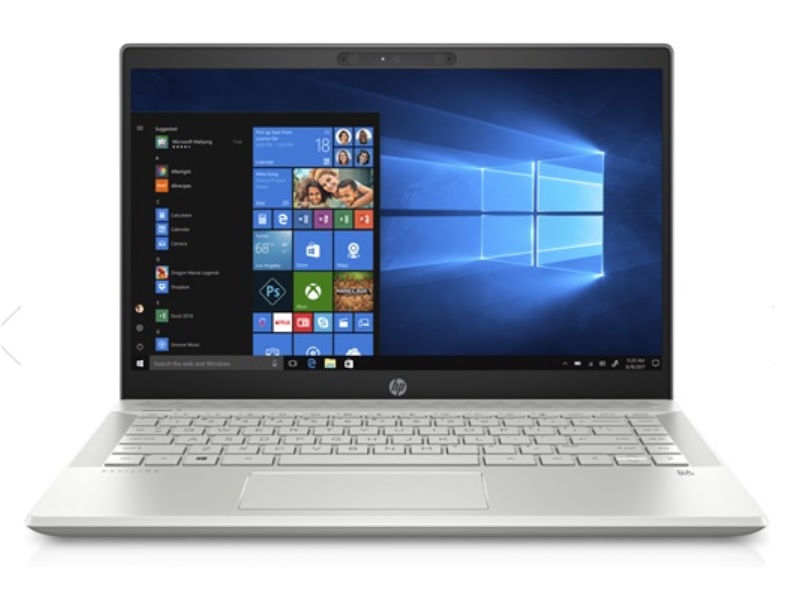
Breve Análise do Portátil HP Pavilion 14: Um polivalente elegante com uma tela brilhante
Avaliação | Data | Modelo | Peso | Altura | Size | Resolução | Preço |
|---|---|---|---|---|---|---|---|
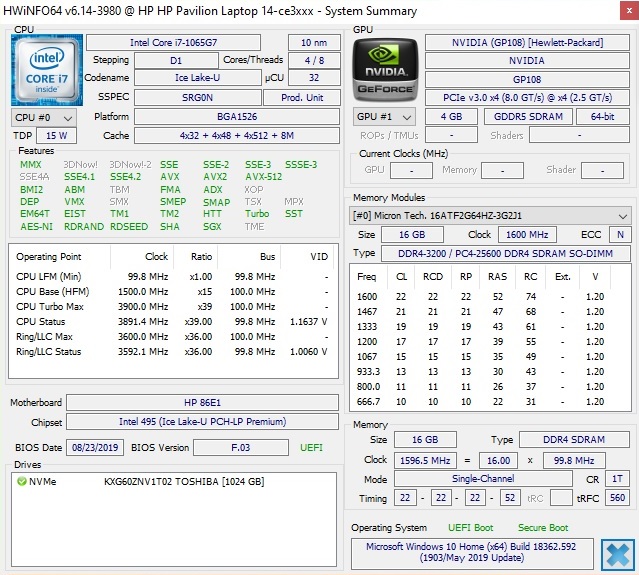
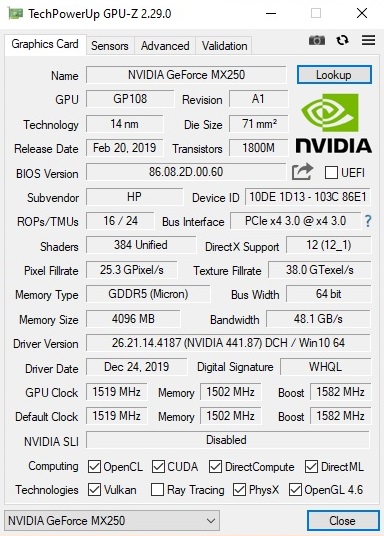
| 77.8 % v7 (old) | 01/2020 | HP Pavilion 14-ce3040ng i7-1065G7, GeForce MX250 | 1.6 kg | 18 mm | 14.00" | 1920x1080 | |
| 84.9 % v6 (old) | 07/2019 | Lenovo IdeaPad S540-14IWL i5-8265U, GeForce MX250 | 1.4 kg | 15.9 mm | 14.00" | 1920x1080 | |
| 84.2 % v7 (old) | 04/2019 | Acer Aspire 5 A515-52G-723L i7-8565U, GeForce MX250 | 1.8 kg | 17.95 mm | 15.60" | 1920x1080 | |
| 82.6 % v6 (old) | 07/2019 | Asus VivoBook S15 S532F i7-8565U, GeForce MX250 | 1.8 kg | 18 mm | 15.60" | 1920x1080 |
| SD Card Reader | |
| average JPG Copy Test (av. of 3 runs) | |
| Média da turma Multimedia (23 - 531, n=36, últimos 2 anos) | |
| Lenovo IdeaPad S540-14IWL (Toshiba Exceria Pro SDXC 64 GB UHS-II) | |
| Acer Aspire 5 A515-52G-723L (Toshiba Exceria Pro SDXC 64 GB UHS-II) | |
| Asus VivoBook S15 S532F (Toshiba Exceria Pro UHS-II) | |
| HP Pavilion 14-ce3040ng (Toshiba Exceria Pro SDXC 64 GB UHS-II) | |
| maximum AS SSD Seq Read Test (1GB) | |
| Média da turma Multimedia (37.3 - 1455, n=35, últimos 2 anos) | |
| Lenovo IdeaPad S540-14IWL (Toshiba Exceria Pro SDXC 64 GB UHS-II) | |
| Acer Aspire 5 A515-52G-723L (Toshiba Exceria Pro SDXC 64 GB UHS-II) | |
| Asus VivoBook S15 S532F (Toshiba Exceria Pro UHS-II) | |
| HP Pavilion 14-ce3040ng (Toshiba Exceria Pro SDXC 64 GB UHS-II) | |
| |||||||||||||||||||||||||
iluminação: 91 %
iluminação com acumulador: 395 cd/m²
Contraste: 1519:1 (Preto: 0.26 cd/m²)
ΔE ColorChecker Calman: 5.92 | ∀{0.5-29.43 Ø4.71}
calibrated: 0.91
ΔE Greyscale Calman: 6.69 | ∀{0.09-98 Ø4.96}
98% sRGB (Argyll 1.6.3 3D)
63% AdobeRGB 1998 (Argyll 1.6.3 3D)
68.2% AdobeRGB 1998 (Argyll 3D)
98.4% sRGB (Argyll 3D)
66.5% Display P3 (Argyll 3D)
Gamma: 2.78
CCT: 7596 K
| HP Pavilion 14-ce3040ng AUO543D, IPS, 1920x1080, 14" | Lenovo IdeaPad S540-14IWL NV140FHM-N48, IPS, 1920x1080, 14" | Acer Aspire 5 A515-52G-723L BOE NV156FHM-N48, IPS, 1920x1080, 15.6" | Asus VivoBook S15 S532F LG Philips LP156WFC-SPD1, IPS, 1920x1080, 15.6" | |
|---|---|---|---|---|
| Display | -40% | -40% | -44% | |
| Display P3 Coverage (%) | 66.5 | 40.1 -40% | 40.02 -40% | 37.12 -44% |
| sRGB Coverage (%) | 98.4 | 59.2 -40% | 58.5 -41% | 55.9 -43% |
| AdobeRGB 1998 Coverage (%) | 68.2 | 41.43 -39% | 41.34 -39% | 38.35 -44% |
| Response Times | 14% | 8% | 39% | |
| Response Time Grey 50% / Grey 80% * (ms) | 60.8 ? | 39.6 ? 35% | 45 ? 26% | 24.8 ? 59% |
| Response Time Black / White * (ms) | 29.6 ? | 32 ? -8% | 33 ? -11% | 24 ? 19% |
| PWM Frequency (Hz) | 352.1 ? | 250 ? | ||
| Screen | -55% | -50% | -69% | |
| Brightness middle (cd/m²) | 395 | 316 -20% | 278 -30% | 262.3 -34% |
| Brightness (cd/m²) | 375 | 301 -20% | 271 -28% | 250 -33% |
| Brightness Distribution (%) | 91 | 88 -3% | 89 -2% | 89 -2% |
| Black Level * (cd/m²) | 0.26 | 0.28 -8% | 0.26 -0% | 0.43 -65% |
| Contrast (:1) | 1519 | 1129 -26% | 1069 -30% | 610 -60% |
| Colorchecker dE 2000 * | 5.92 | 5.3 10% | 4.73 20% | 5.81 2% |
| Colorchecker dE 2000 max. * | 9.79 | 18.5 -89% | 8.38 14% | 14.7 -50% |
| Colorchecker dE 2000 calibrated * | 0.91 | 4.8 -427% | 5.17 -468% | 5.36 -489% |
| Greyscale dE 2000 * | 6.69 | 2.4 64% | 2.59 61% | 2.8 58% |
| Gamma | 2.78 79% | 2.05 107% | 2.38 92% | 2.15 102% |
| CCT | 7596 86% | 6644 98% | 6160 106% | 7016 93% |
| Color Space (Percent of AdobeRGB 1998) (%) | 63 | 37.6 -40% | 36 -43% | 35.2 -44% |
| Color Space (Percent of sRGB) (%) | 98 | 58.3 -41% | 58 -41% | 55.6 -43% |
| Média Total (Programa/Configurações) | -27% /
-43% | -27% /
-41% | -25% /
-51% |
* ... menor é melhor
Exibir tempos de resposta
| ↔ Tempo de resposta preto para branco | ||
|---|---|---|
| 29.6 ms ... ascensão ↗ e queda ↘ combinadas | ↗ 13.2 ms ascensão | 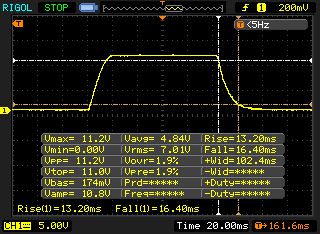 |
| ↘ 16.4 ms queda | ||
| A tela mostra taxas de resposta relativamente lentas em nossos testes e pode ser muito lenta para os jogadores. Em comparação, todos os dispositivos testados variam de 0.1 (mínimo) a 240 (máximo) ms. » 79 % de todos os dispositivos são melhores. Isso significa que o tempo de resposta medido é pior que a média de todos os dispositivos testados (19.8 ms). | ||
| ↔ Tempo de resposta 50% cinza a 80% cinza | ||
| 60.8 ms ... ascensão ↗ e queda ↘ combinadas | ↗ 29.2 ms ascensão | 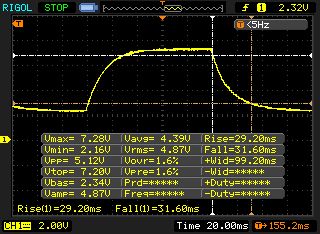 |
| ↘ 31.6 ms queda | ||
| A tela mostra taxas de resposta lentas em nossos testes e será insatisfatória para os jogadores. Em comparação, todos os dispositivos testados variam de 0.165 (mínimo) a 636 (máximo) ms. » 96 % de todos os dispositivos são melhores. Isso significa que o tempo de resposta medido é pior que a média de todos os dispositivos testados (30.9 ms). | ||
Cintilação da tela / PWM (modulação por largura de pulso)
| Tela tremeluzindo / PWM não detectado | 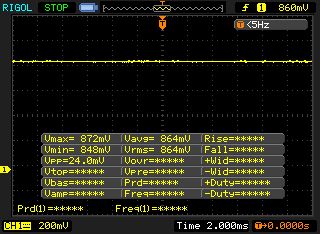 | ||
[pwm_comparison] Em comparação: 52 % de todos os dispositivos testados não usam PWM para escurecer a tela. Se PWM foi detectado, uma média de 7744 (mínimo: 5 - máximo: 343500) Hz foi medida. | |||
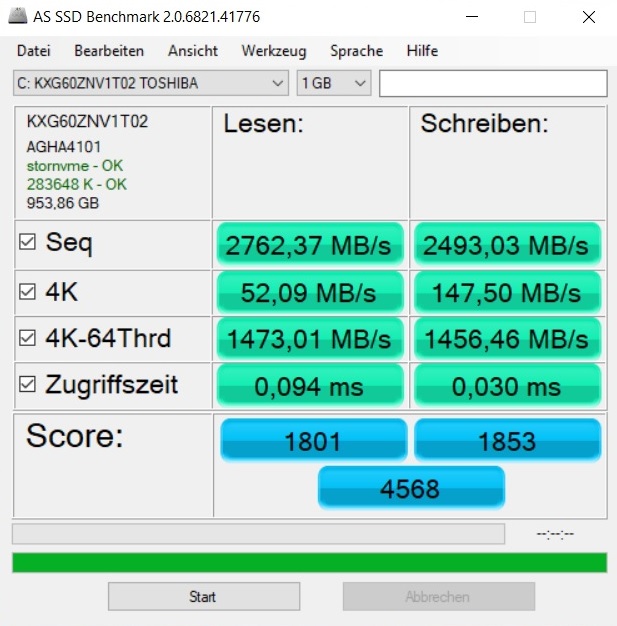
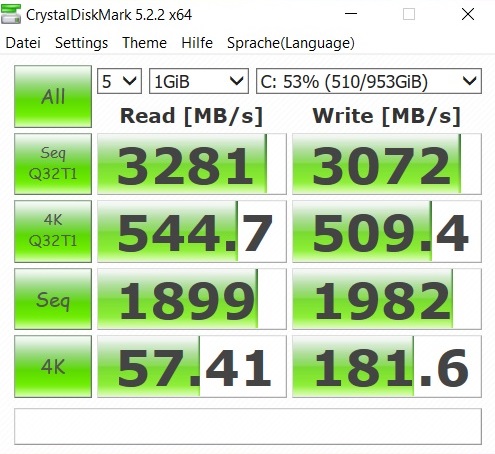
| HP Pavilion 14-ce3040ng Toshiba XG6 KXG60ZNV1T02 | Lenovo IdeaPad S540-14IWL Samsung SSD PM981 MZVLB512HAJQ | Acer Aspire 5 A515-52G-723L WDC PC SN520 SDAPNUW-512G | Asus VivoBook S15 S532F WDC PC SN520 SDAPNUW-256G | |
|---|---|---|---|---|
| CrystalDiskMark 5.2 / 6 | -22% | -39% | -36% | |
| Write 4K (MB/s) | 181.6 | 157.6 -13% | 130.1 -28% | 149.9 -17% |
| Read 4K (MB/s) | 57.4 | 46.39 -19% | 27.64 -52% | 46.13 -20% |
| Write Seq (MB/s) | 1982 | 1214 -39% | 1438 -27% | 970 -51% |
| Read Seq (MB/s) | 1899 | 1295 -32% | 1319 -31% | 1085 -43% |
| Write 4K Q32T1 (MB/s) | 509 | 370.7 -27% | 323.3 -36% | 460.8 -9% |
| Read 4K Q32T1 (MB/s) | 545 | 461.1 -15% | 359.9 -34% | 410.3 -25% |
| Write Seq Q32T1 (MB/s) | 3072 | 1888 -39% | 1454 -53% | 662 -78% |
| Read Seq Q32T1 (MB/s) | 3281 | 3540 8% | 1740 -47% | 1728 -47% |

| 3DMark 11 Performance | 4850 pontos | |
| 3DMark Time Spy Score | 1223 pontos | |
Ajuda | ||
| 3DMark 11 - 1280x720 Performance GPU | |
| Média da turma Multimedia (3749 - 60002, n=54, últimos 2 anos) | |
| Lenovo IdeaPad S540-14IWL | |
| Asus VivoBook S15 S532F | |
| Acer Aspire 5 A515-52G-723L | |
| HP Pavilion 14-ce3040ng | |
| The Witcher 3 | |
| 1366x768 Medium Graphics & Postprocessing | |
| Média da turma Multimedia (41 - 73, n=2, últimos 2 anos) | |
| Acer Aspire 5 A515-52G-723L | |
| Asus VivoBook S15 S532F | |
| Lenovo IdeaPad S540-14IWL | |
| HP Pavilion 14-ce3040ng | |
| 1920x1080 High Graphics & Postprocessing (Nvidia HairWorks Off) | |
| Média da turma Multimedia (22 - 157, n=5, últimos 2 anos) | |
| Acer Aspire 5 A515-52G-723L | |
| Lenovo IdeaPad S540-14IWL | |
| Asus VivoBook S15 S532F | |
| HP Pavilion 14-ce3040ng | |
| baixo | média | alto | ultra | |
|---|---|---|---|---|
| The Witcher 3 (2015) | 56.4 | 33.5 | 18.8 | 10.9 |
| Resident Evil 7 (2017) | 118 | 53.9 | 32.1 | 27 |
| Prey (2017) | 108 | 46.2 | 36.4 | 30.1 |
| Middle-earth: Shadow of War (2017) | 64 | 27 | 19 | 15 |
| ELEX (2017) | 53.9 | 25.4 | 20.6 | 15.6 |
| Star Wars Battlefront 2 (2017) | 79.1 | 25.4 | 21.8 | 18.7 |
| Kingdom Come: Deliverance (2018) | 50.7 | 21.9 | 18.7 | 12.7 |
| The Crew 2 (2018) | 43.9 | 20.2 | 19.5 | 16.5 |
| Control (2019) | 41 | 14 | 10.1 | |
| Borderlands 3 (2019) | 52.9 | 20.7 | 13.4 | 10.2 |
| FIFA 20 (2019) | 120 | 82.4 | 76.8 | 62.5 |
| Ghost Recon Breakpoint (2019) | 36 | 19 | 17 | 12 |
| GRID 2019 (2019) | 65.2 | 25.2 | 20.3 | 11.8 |
| Call of Duty Modern Warfare 2019 (2019) | 41.7 | 23.3 | 19.4 | 15.9 |
| Need for Speed Heat (2019) | 41.1 | 20.2 | 18.4 | 15.3 |
| Star Wars Jedi Fallen Order (2019) | 29.4 | 22.5 | 18.1 | |
| Red Dead Redemption 2 (2019) | 20.9 | 15.2 | 9.8 | 6.2 |
Barulho
| Ocioso |
| 31 / 36 / 41 dB |
| Carga |
| 49 / 49 dB |
 | ||
30 dB silencioso 40 dB(A) audível 50 dB(A) ruidosamente alto |
||
min: | ||
| HP Pavilion 14-ce3040ng i7-1065G7, GeForce MX250 | Lenovo IdeaPad S540-14IWL i5-8265U, GeForce MX250 | Acer Aspire 5 A515-52G-723L i7-8565U, GeForce MX250 | Asus VivoBook S15 S532F i7-8565U, GeForce MX250 | Média da turma Multimedia | |
|---|---|---|---|---|---|
| Noise | 20% | 13% | 16% | 23% | |
| desligado / ambiente * (dB) | 30 | 29.3 2% | 29.9 -0% | 28 7% | 24.1 ? 20% |
| Idle Minimum * (dB) | 31 | 29.3 5% | 29.9 4% | 28 10% | 24.3 ? 22% |
| Idle Average * (dB) | 36 | 29.3 19% | 29.9 17% | 28 22% | 24.6 ? 32% |
| Idle Maximum * (dB) | 41 | 29.3 29% | 29.9 27% | 30 27% | 26.2 ? 36% |
| Load Average * (dB) | 49 | 34.4 30% | 41.7 15% | 41.4 16% | 37.3 ? 24% |
| Witcher 3 ultra * (dB) | 47 | 34.4 27% | 41.5 12% | ||
| Load Maximum * (dB) | 49 | 34.9 29% | 41.7 15% | 41.5 15% | 46 ? 6% |
* ... menor é melhor
(-) A temperatura máxima no lado superior é 47 °C / 117 F, em comparação com a média de 36.8 °C / 98 F , variando de 21 a 71 °C para a classe Multimedia.
(-) A parte inferior aquece até um máximo de 47 °C / 117 F, em comparação com a média de 39.1 °C / 102 F
(+) Em uso inativo, a temperatura média para o lado superior é 24 °C / 75 F, em comparação com a média do dispositivo de 31.3 °C / ### class_avg_f### F.
(-) Jogando The Witcher 3, a temperatura média para o lado superior é 38.6 °C / 101 F, em comparação com a média do dispositivo de 31.3 °C / ## #class_avg_f### F.
(+) Os apoios para as mãos e o touchpad estão atingindo a temperatura máxima da pele (32 °C / 89.6 F) e, portanto, não estão quentes.
(-) A temperatura média da área do apoio para as mãos de dispositivos semelhantes foi 28.7 °C / 83.7 F (-3.3 °C / -5.9 F).
| HP Pavilion 14-ce3040ng i7-1065G7, GeForce MX250 | Lenovo IdeaPad S540-14IWL i5-8265U, GeForce MX250 | Acer Aspire 5 A515-52G-723L i7-8565U, GeForce MX250 | Asus VivoBook S15 S532F i7-8565U, GeForce MX250 | Média da turma Multimedia | |
|---|---|---|---|---|---|
| Heat | 5% | -15% | -6% | 2% | |
| Maximum Upper Side * (°C) | 47 | 41.8 11% | 53.7 -14% | 45.4 3% | 41 ? 13% |
| Maximum Bottom * (°C) | 47 | 43.3 8% | 56 -19% | 40.8 13% | 43.4 ? 8% |
| Idle Upper Side * (°C) | 25 | 25.1 -0% | 28.4 -14% | 29.6 -18% | 26.9 ? -8% |
| Idle Bottom * (°C) | 26 | 25.4 2% | 28.9 -11% | 31.2 -20% | 27.8 ? -7% |
* ... menor é melhor
HP Pavilion 14-ce3040ng análise de áudio
(+) | os alto-falantes podem tocar relativamente alto (###valor### dB)
Graves 100 - 315Hz
(-) | quase nenhum baixo - em média 25.8% menor que a mediana
(±) | a linearidade dos graves é média (10.3% delta para a frequência anterior)
Médios 400 - 2.000 Hz
(+) | médios equilibrados - apenas 2.9% longe da mediana
(+) | médios são lineares (6.8% delta para frequência anterior)
Altos 2 - 16 kHz
(+) | agudos equilibrados - apenas 3.9% longe da mediana
(+) | os máximos são lineares (4.9% delta da frequência anterior)
Geral 100 - 16.000 Hz
(±) | a linearidade do som geral é média (18.6% diferença em relação à mediana)
Comparado com a mesma classe
» 57% de todos os dispositivos testados nesta classe foram melhores, 8% semelhantes, 35% piores
» O melhor teve um delta de 5%, a média foi 17%, o pior foi 45%
Comparado com todos os dispositivos testados
» 42% de todos os dispositivos testados foram melhores, 8% semelhantes, 50% piores
» O melhor teve um delta de 4%, a média foi 23%, o pior foi 134%
Lenovo IdeaPad S540-14IWL análise de áudio
(-) | alto-falantes não muito altos (###valor### dB)
Graves 100 - 315Hz
(±) | graves reduzidos - em média 10.7% menor que a mediana
(±) | a linearidade dos graves é média (12.7% delta para a frequência anterior)
Médios 400 - 2.000 Hz
(±) | médios mais altos - em média 5% maior que a mediana
(±) | a linearidade dos médios é média (8.3% delta para frequência anterior)
Altos 2 - 16 kHz
(±) | máximos reduzidos - em média 5.5% menor que a mediana
(±) | a linearidade dos máximos é média (9.4% delta para frequência anterior)
Geral 100 - 16.000 Hz
(±) | a linearidade do som geral é média (23% diferença em relação à mediana)
Comparado com a mesma classe
» 81% de todos os dispositivos testados nesta classe foram melhores, 5% semelhantes, 14% piores
» O melhor teve um delta de 5%, a média foi 17%, o pior foi 45%
Comparado com todos os dispositivos testados
» 69% de todos os dispositivos testados foram melhores, 5% semelhantes, 26% piores
» O melhor teve um delta de 4%, a média foi 23%, o pior foi 134%
| desligado | |
| Ocioso | |
| Carga |
|
Key:
min: | |
| HP Pavilion 14-ce3040ng i7-1065G7, GeForce MX250 | Lenovo IdeaPad S540-14IWL i5-8265U, GeForce MX250 | Acer Aspire 5 A515-52G-723L i7-8565U, GeForce MX250 | Asus VivoBook S15 S532F i7-8565U, GeForce MX250 | Média da turma Multimedia | |
|---|---|---|---|---|---|
| Power Consumption | 12% | 1% | -25% | -38% | |
| Idle Minimum * (Watt) | 4 | 2.74 31% | 4.4 -10% | 6 -50% | 5.62 ? -41% |
| Idle Average * (Watt) | 7 | 5.64 19% | 6.9 1% | 10.3 -47% | 10.2 ? -46% |
| Idle Maximum * (Watt) | 10 | 8.4 16% | 9.9 1% | 10.5 -5% | 12.5 ? -25% |
| Load Average * (Watt) | 62 | 61.3 1% | 55 11% | 69.1 -11% | 65 ? -5% |
| Witcher 3 ultra * (Watt) | 58 | 49.2 15% | 57.8 -0% | ||
| Load Maximum * (Watt) | 64 | 69.4 -8% | 63.4 1% | 88 -38% | 111.9 ? -75% |
* ... menor é melhor
| HP Pavilion 14-ce3040ng i7-1065G7, GeForce MX250, 41 Wh | Lenovo IdeaPad S540-14IWL i5-8265U, GeForce MX250, 48 Wh | Acer Aspire 5 A515-52G-723L i7-8565U, GeForce MX250, 48 Wh | Asus VivoBook S15 S532F i7-8565U, GeForce MX250, 42 Wh | Média da turma Multimedia | |
|---|---|---|---|---|---|
| Duração da bateria | 49% | 30% | -2% | 85% | |
| Reader / Idle (h) | 11.6 | 21.4 84% | 12.9 11% | 10.9 -6% | 24.9 ? 115% |
| WiFi v1.3 (h) | 6.1 | 8.4 38% | 6.9 13% | 5.1 -16% | 12.3 ? 102% |
| Load (h) | 1.2 | 1.5 25% | 2 67% | 1.4 17% | 1.645 ? 37% |
| H.264 (h) | 8.3 | 6.5 | 16.8 ? |
Pro
Contra
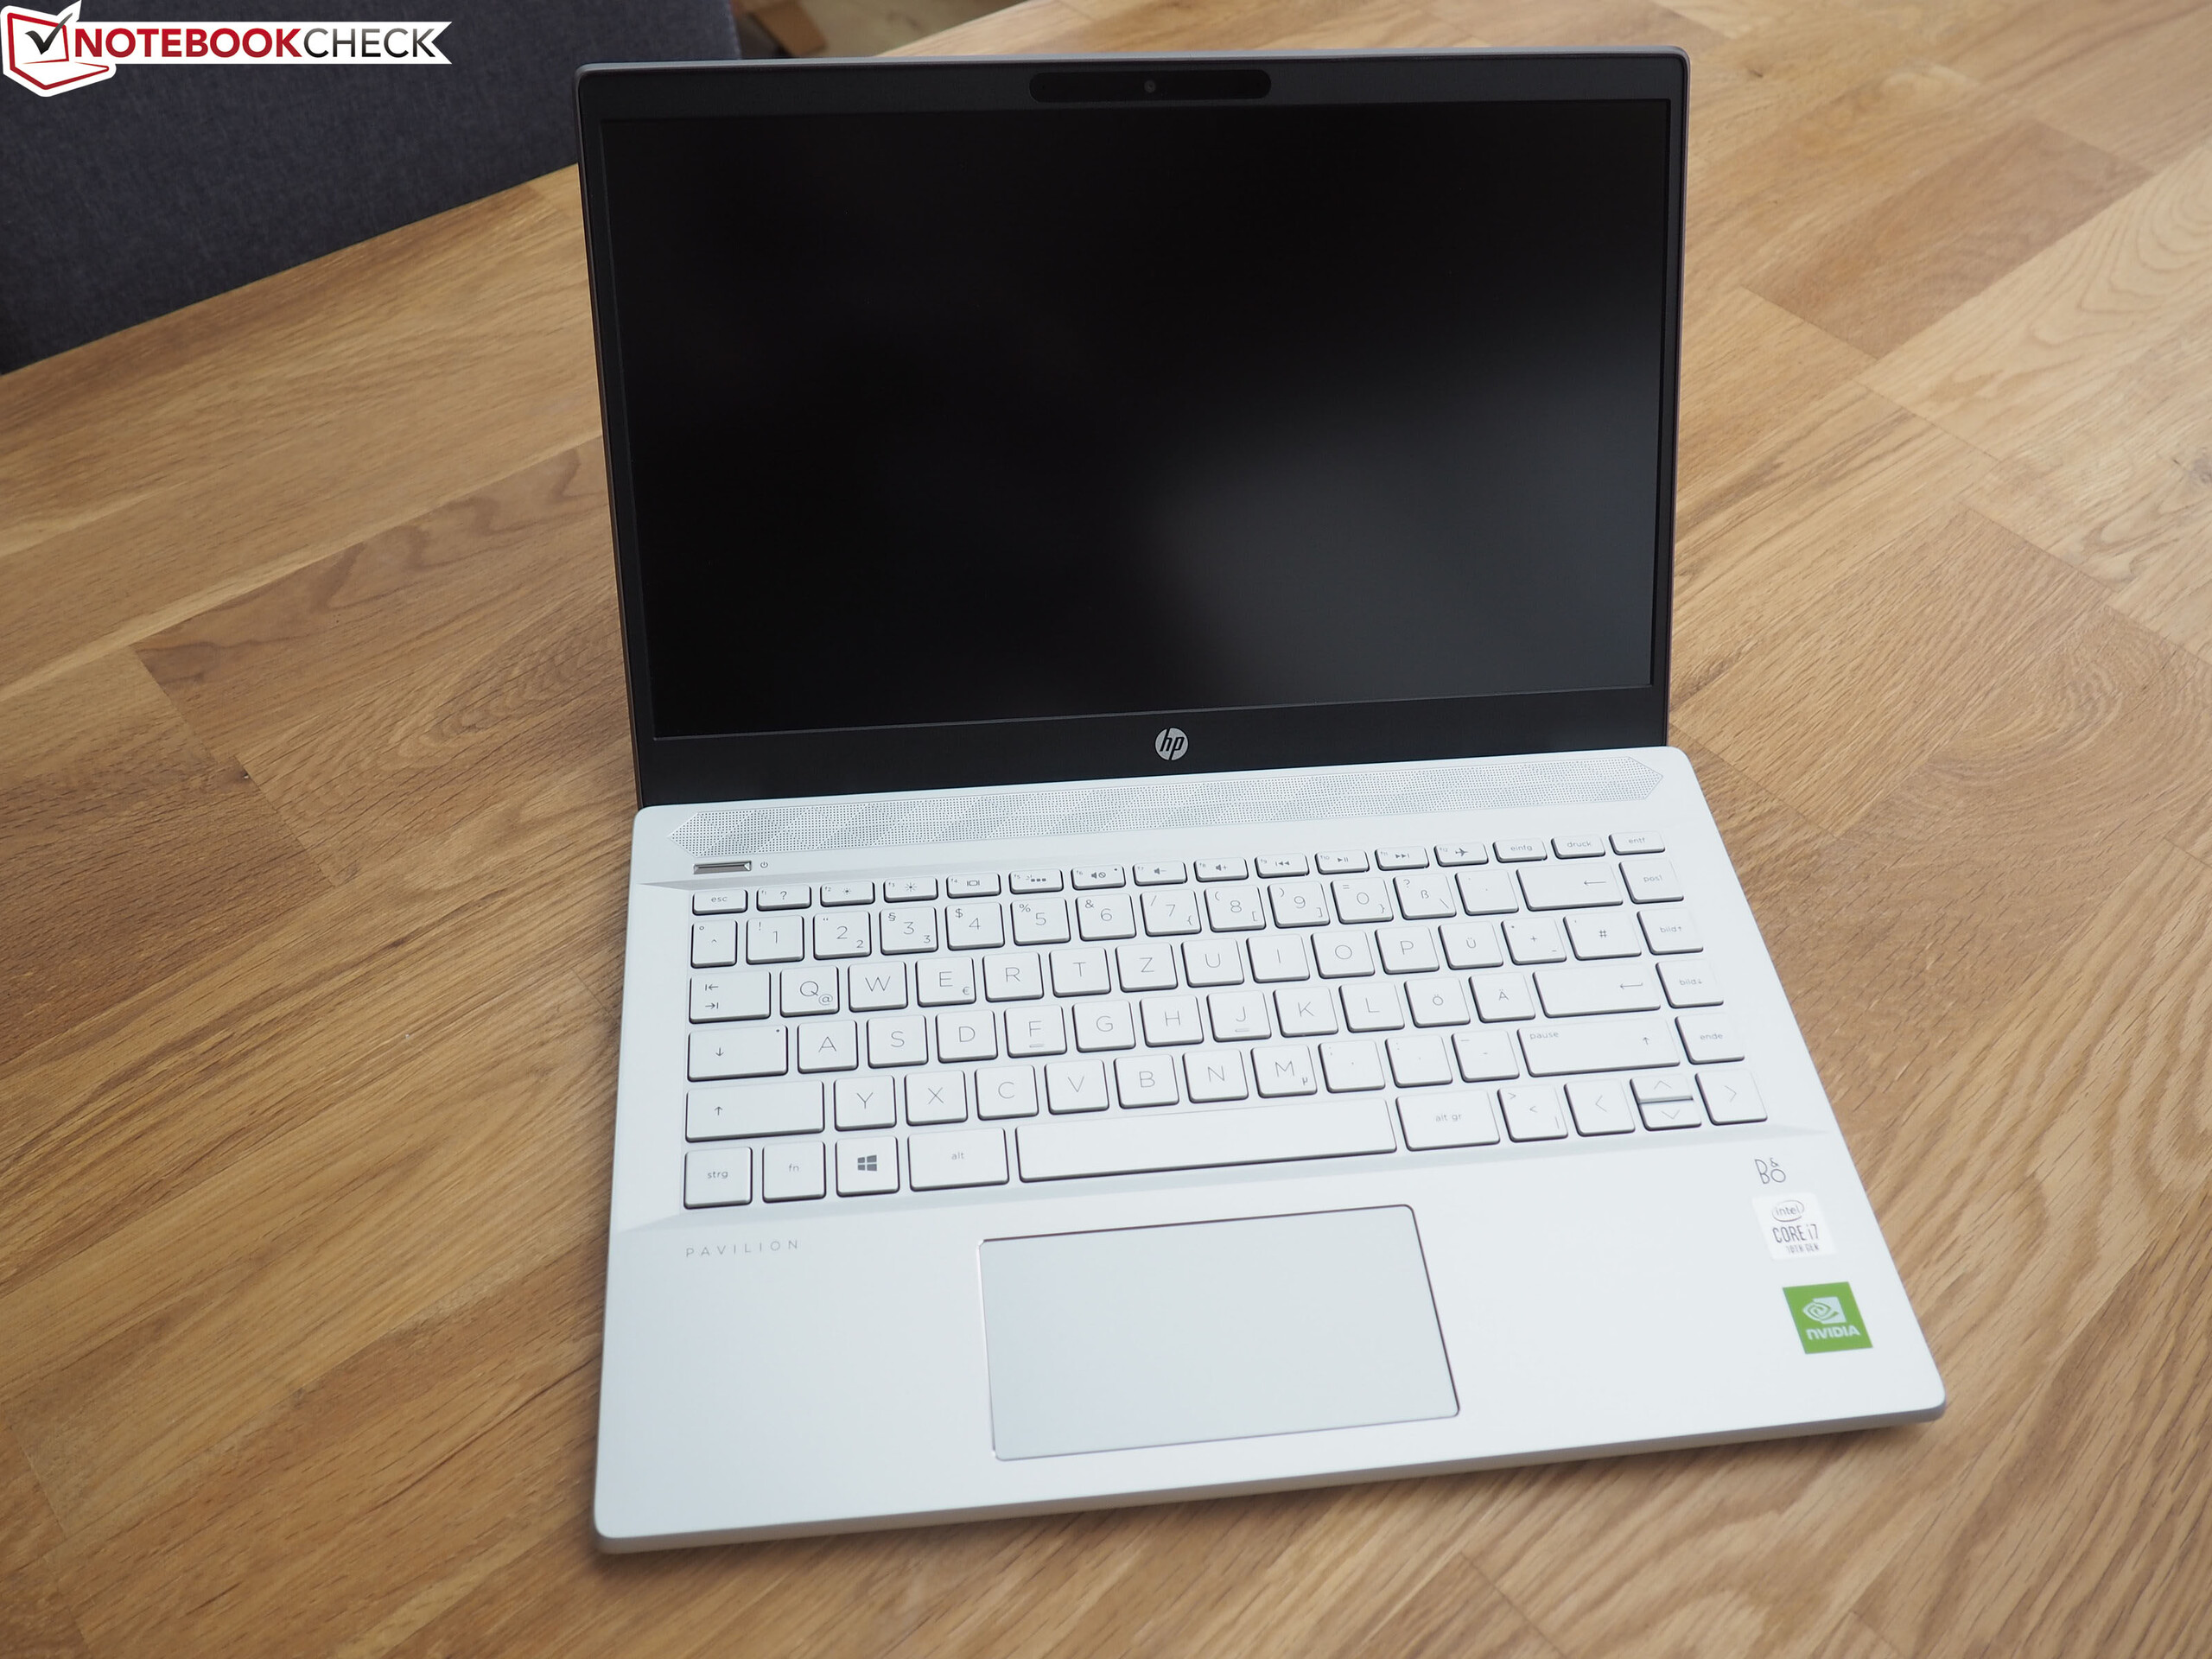
À primeira vista, o Pavilion 14-ce3040ng dá uma boa impressão.
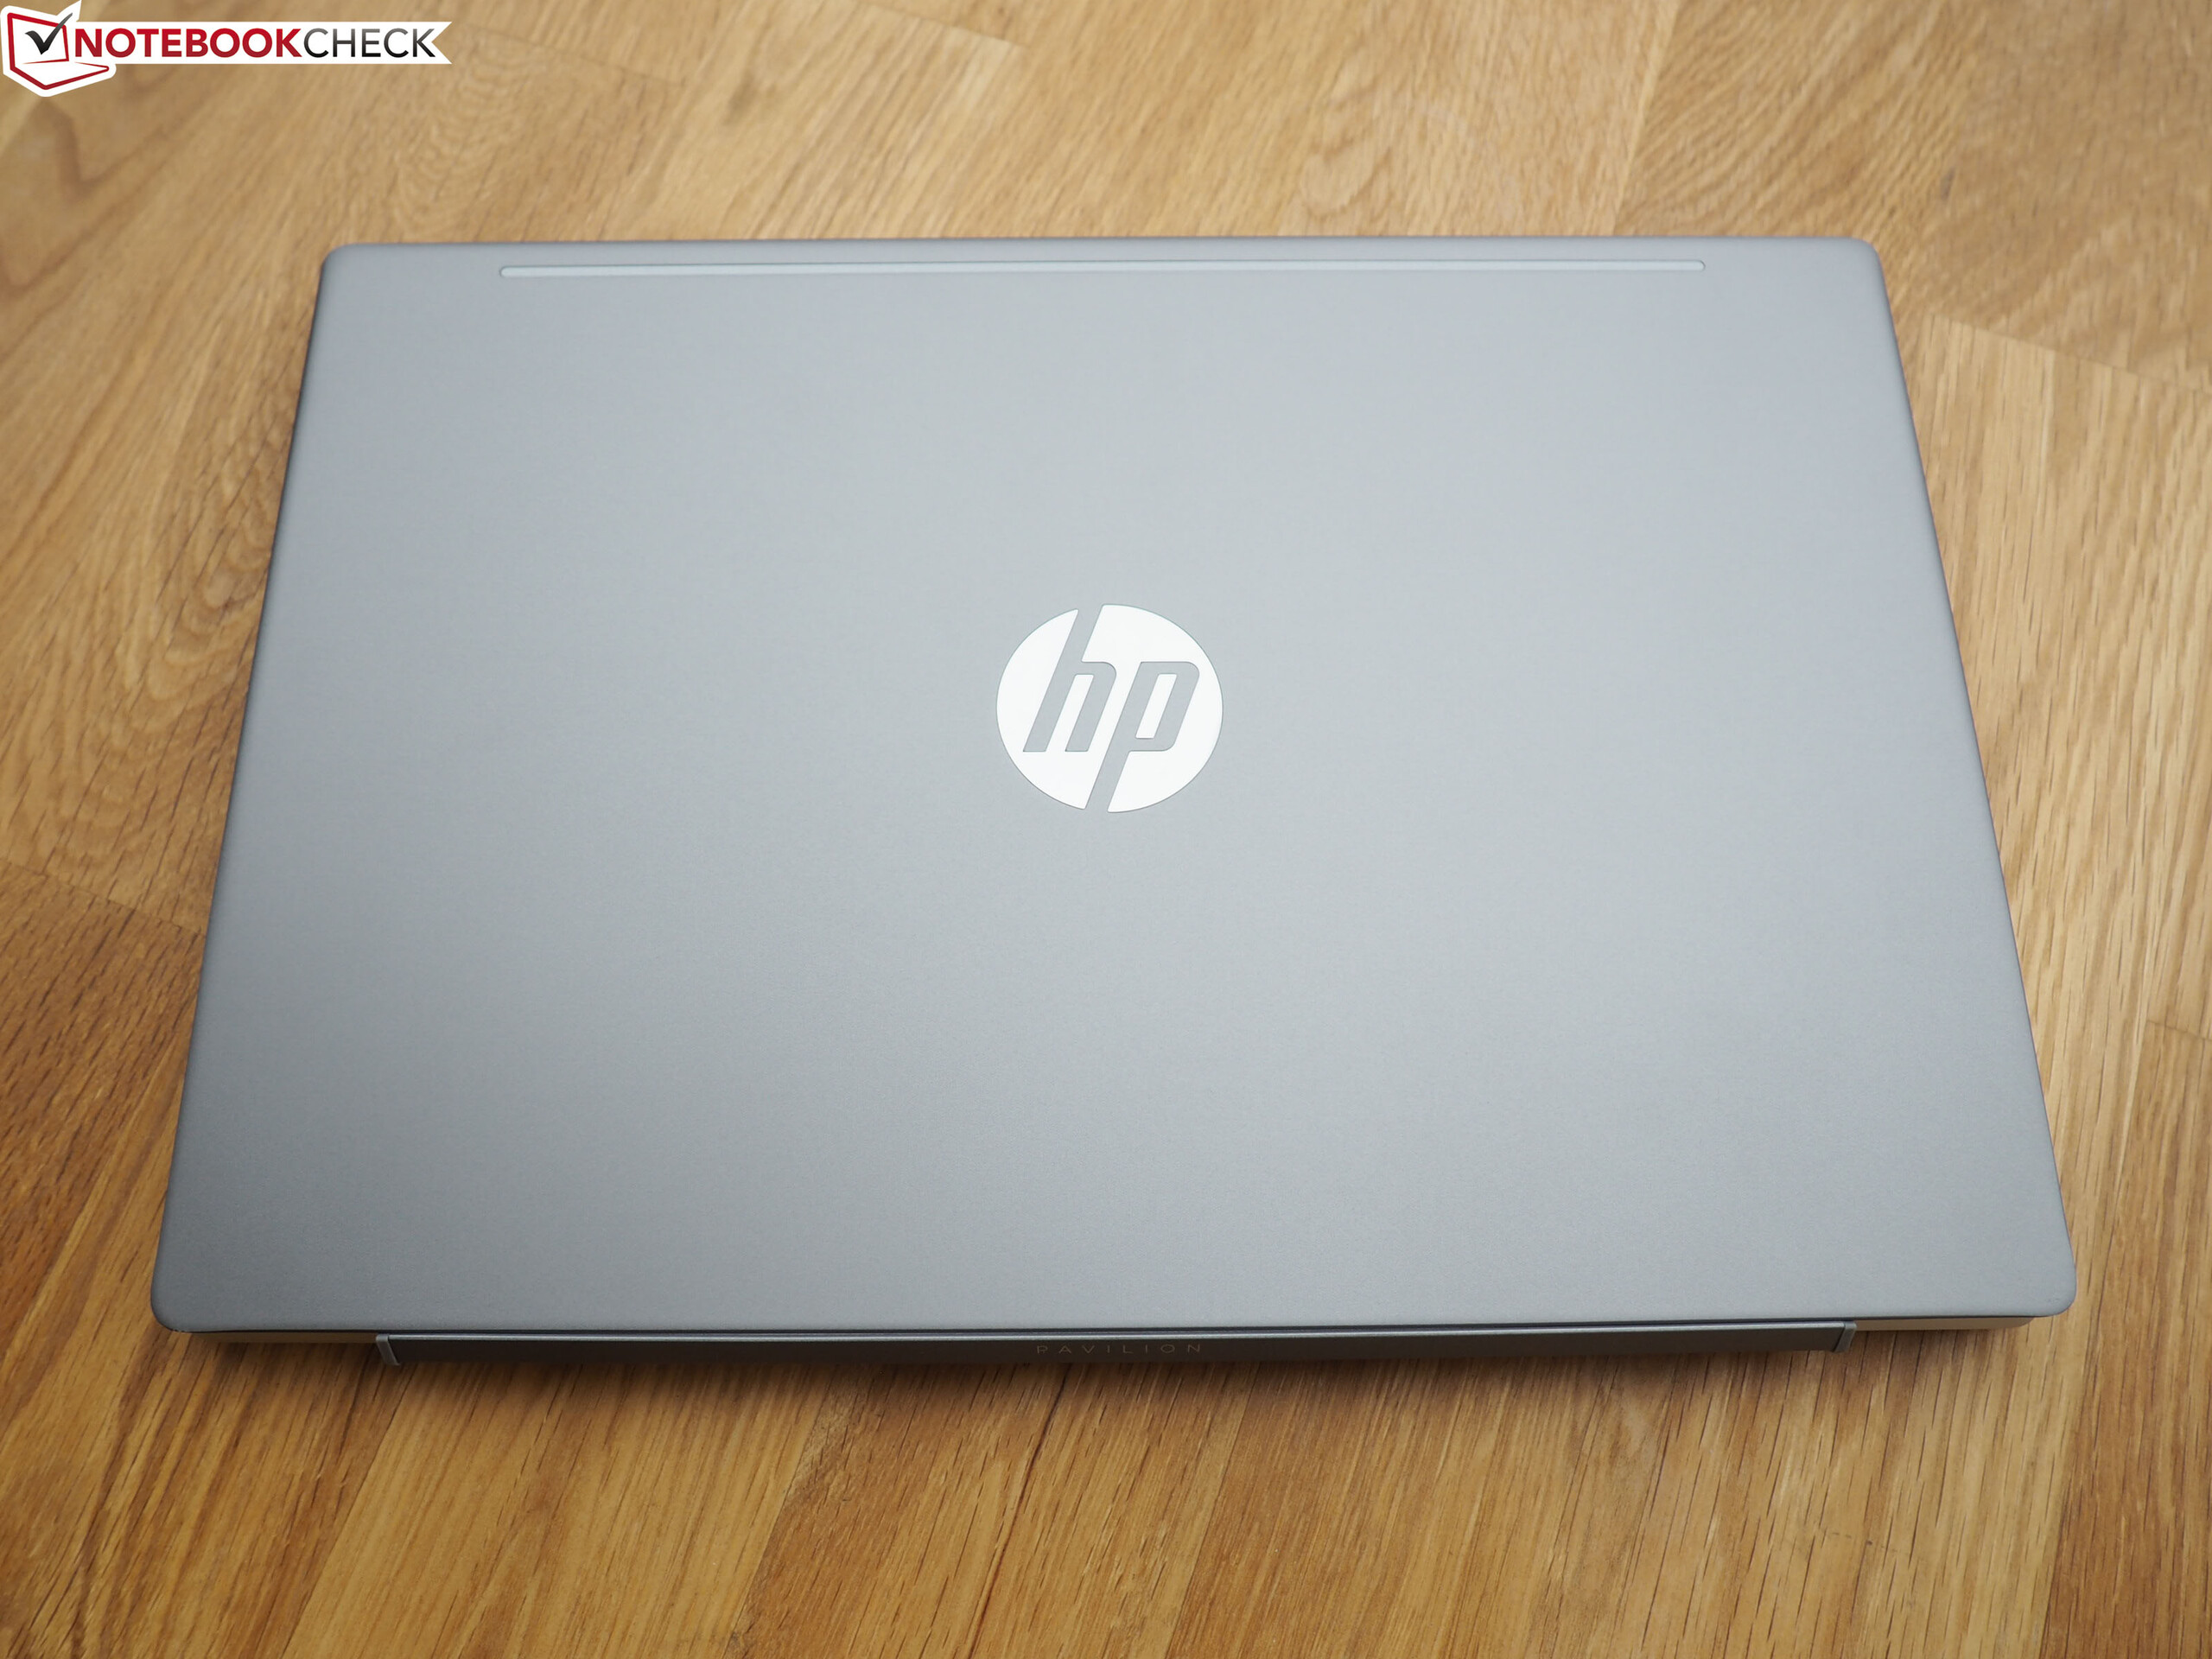
O design elegante, em parte feito de alumínio, nos impressionou por ser leve e compacto. Isso torna o dispositivo particularmente adequado para uso frequente em movimento.
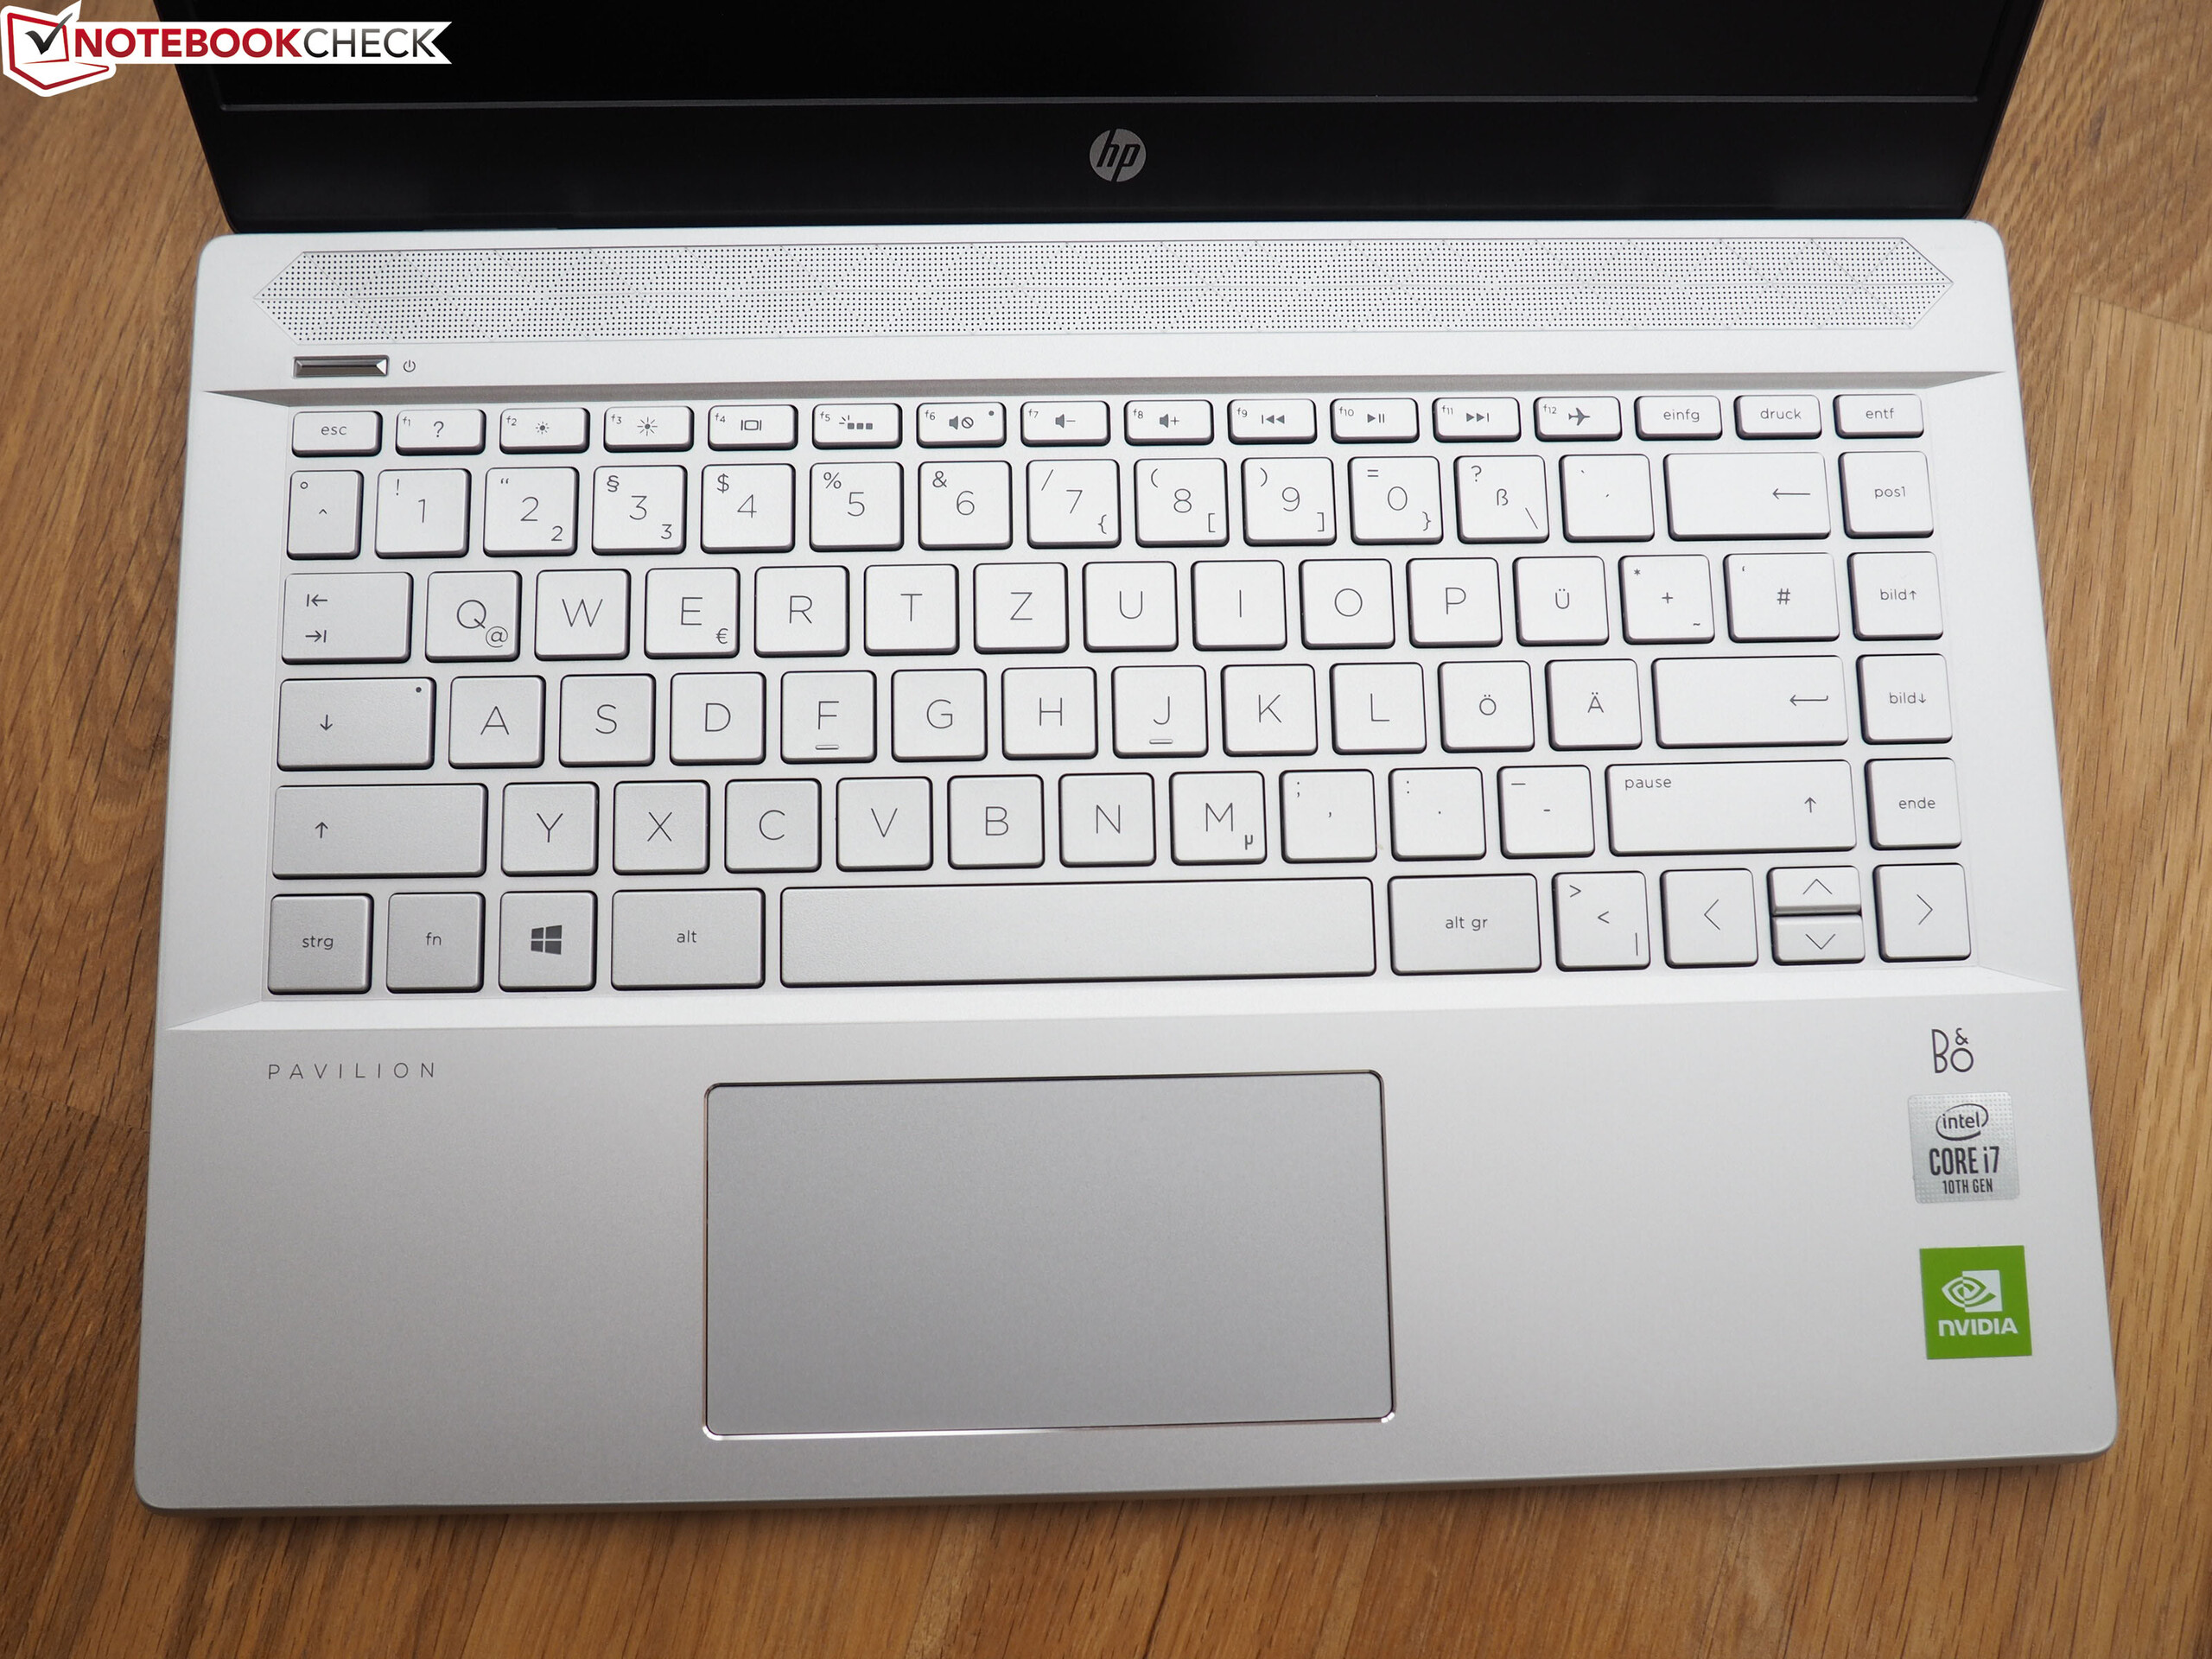
Sua tela brilhante e rica em contraste é outro ponto de venda e diferencia o dispositivo de 14 polegadas da concorrência. Por outro lado, seus dispositivos de entrada, conectividade e duração da bateria são bons o suficiente apenas para a metade do pacote.
No entanto, a HP cometeu um erro decisivo com a curva do ventilador. O ventilador atinge 40 dB(A), mesmo no modo inativo e quase 50 dB(A) sob uso intenso. Em seu estado atual, recomendamos que você procure outra coisa, a menos que não se deixe desanimar por ventiladores irritantes e barulhentos.
HP Pavilion 14-ce3040ng
- 05/14/2020 v7 (old)
Florian Glaser
Price comparison