Breve Análise do Portátil HP ProBook 430 G7: Sem grandes melhorias com Comet Lake
Avaliação | Data | Modelo | Peso | Altura | Size | Resolução | Preço |
|---|---|---|---|---|---|---|---|
| 84.5 % v7 (old) | 05/2020 | HP ProBook 430 G7-8VU53EA i7-10510U, UHD Graphics 620 | 1.4 kg | 18 mm | 13.30" | 1920x1080 | |
| 83.8 % v7 (old) | 03/2019 | HP ProBook 430 G6-5TJ89EA i5-8265U, UHD Graphics 620 | 1.4 kg | 18 mm | 13.30" | 1920x1080 | |
| 88.2 % v6 (old) | 05/2018 | HP EliteBook 830 G5-3JX74EA i5-8550U, UHD Graphics 620 | 1.3 kg | 17.7 mm | 13.30" | 1920x1080 | |
| 88.4 % v6 (old) | 02/2019 | Lenovo ThinkPad L390-20NR0013GE i5-8265U, UHD Graphics 620 | 1.5 kg | 18.8 mm | 13.30" | 1920x1080 | |
| 84.9 % v7 (old) | Dell Latitude 5300 i5-8365U, UHD Graphics 620 | 1.4 kg | 19 mm | 13.30" | 1920x1080 |
| SD Card Reader | |
| average JPG Copy Test (av. of 3 runs) | |
| Dell Latitude 5300 (Toshiba Exceria Pro M501 64 GB UHS-II) | |
| Lenovo ThinkPad L390-20NR0013GE (Toshiba Exceria Pro M501 UHS-II) | |
| HP ProBook 430 G6-5TJ89EA (Toshiba Exceria Pro SDXC 64 GB UHS-II) | |
| HP ProBook 430 G7-8VU53EA | |
| Média da turma Office (19.8 - 198.5, n=21, últimos 2 anos) | |
| maximum AS SSD Seq Read Test (1GB) | |
| Dell Latitude 5300 (Toshiba Exceria Pro M501 64 GB UHS-II) | |
| Lenovo ThinkPad L390-20NR0013GE (Toshiba Exceria Pro M501 UHS-II) | |
| HP ProBook 430 G7-8VU53EA (Toshiba Exceria Pro SDXC 64 GB UHS-II) | |
| HP ProBook 430 G6-5TJ89EA (Toshiba Exceria Pro SDXC 64 GB UHS-II) | |
| Média da turma Office (27.4 - 249, n=20, últimos 2 anos) | |
| Networking | |
| iperf3 transmit AX12 | |
| HP ProBook 430 G7-8VU53EA | |
| Média Intel Wi-Fi 6 AX201 (49.8 - 1775, n=324) | |
| Lenovo ThinkPad L390-20NR0013GE | |
| Dell Latitude 5300 | |
| HP ProBook 430 G6-5TJ89EA | |
| HP EliteBook 830 G5-3JX74EA | |
| iperf3 receive AX12 | |
| HP ProBook 430 G7-8VU53EA | |
| Média Intel Wi-Fi 6 AX201 (136 - 1743, n=324) | |
| Lenovo ThinkPad L390-20NR0013GE | |
| HP ProBook 430 G6-5TJ89EA | |
| Dell Latitude 5300 | |
| HP EliteBook 830 G5-3JX74EA | |


| |||||||||||||||||||||||||
iluminação: 90 %
iluminação com acumulador: 296 cd/m²
Contraste: 1200:1 (Preto: 0.25 cd/m²)
ΔE ColorChecker Calman: 5.9 | ∀{0.5-29.43 Ø4.72}
calibrated: 4.6
ΔE Greyscale Calman: 4 | ∀{0.09-98 Ø4.97}
62.4% sRGB (Calman 2D)
62.4% sRGB (Argyll 1.6.3 3D)
40.4% AdobeRGB 1998 (Argyll 1.6.3 3D)
44.21% AdobeRGB 1998 (Argyll 3D)
62.8% sRGB (Argyll 3D)
42.79% Display P3 (Argyll 3D)
Gamma: 2.23
CCT: 7154 K
| HP ProBook 430 G7-8VU53EA BOE08A6, IPS LED, 1920x1080, 13.3" | HP ProBook 430 G6-5TJ89EA CMN1375, IPS LED, 1920x1080, 13.3" | HP EliteBook 830 G5-3JX74EA IVO M133NVF3-R0, IPS LED, 1920x1080, 13.3" | Lenovo ThinkPad L390-20NR0013GE LP133WF2-SPL8, IPS LED, 1920x1080, 13.3" | Dell Latitude 5300 LGD05ED-133WF6, IPS, 1920x1080, 13.3" | |
|---|---|---|---|---|---|
| Display | -1% | 46% | -5% | 55% | |
| Display P3 Coverage (%) | 42.79 | 41.87 -2% | 64.2 50% | 40.42 -6% | 68.2 59% |
| sRGB Coverage (%) | 62.8 | 62.6 0% | 89.2 42% | 60.4 -4% | 94.4 50% |
| AdobeRGB 1998 Coverage (%) | 44.21 | 43.3 -2% | 65.2 47% | 41.8 -5% | 68.7 55% |
| Response Times | 11% | 24% | 9% | 19% | |
| Response Time Grey 50% / Grey 80% * (ms) | 48.8 ? | 40.8 ? 16% | 36 ? 26% | 42.8 ? 12% | 38 ? 22% |
| Response Time Black / White * (ms) | 32 ? | 30.4 ? 5% | 24.8 ? 22% | 30 ? 6% | 27.2 ? 15% |
| PWM Frequency (Hz) | 1000 ? | 26040 ? | 1020 ? | 30490 ? | |
| Screen | 3% | 21% | -14% | 28% | |
| Brightness middle (cd/m²) | 300 | 255 -15% | 316 5% | 298 -1% | 326 9% |
| Brightness (cd/m²) | 285 | 238 -16% | 326 14% | 278 -2% | 313 10% |
| Brightness Distribution (%) | 90 | 88 -2% | 85 -6% | 81 -10% | 87 -3% |
| Black Level * (cd/m²) | 0.25 | 0.18 28% | 0.19 24% | 0.33 -32% | 0.27 -8% |
| Contrast (:1) | 1200 | 1417 18% | 1663 39% | 903 -25% | 1207 1% |
| Colorchecker dE 2000 * | 5.9 | 5.4 8% | 4.5 24% | 6.5 -10% | 3.2 46% |
| Colorchecker dE 2000 max. * | 20 | 19.5 2% | 12.1 39% | 23.9 -19% | 6.3 68% |
| Colorchecker dE 2000 calibrated * | 4.6 | 4.1 11% | 2.9 37% | 4.9 -7% | 1.6 65% |
| Greyscale dE 2000 * | 4 | 3.8 5% | 5 -25% | 5.6 -40% | 3.8 5% |
| Gamma | 2.23 99% | 2.41 91% | 2.22 99% | 2.08 106% | 2.14 103% |
| CCT | 7154 91% | 7100 92% | 6018 108% | 6669 97% | 6900 94% |
| Color Space (Percent of AdobeRGB 1998) (%) | 40.4 | 39.4 -2% | 57.9 43% | 38.4 -5% | 63.8 58% |
| Color Space (Percent of sRGB) (%) | 62.4 | 62.5 0% | 87.3 40% | 60.1 -4% | 94.8 52% |
| Média Total (Programa/Configurações) | 4% /
3% | 30% /
26% | -3% /
-10% | 34% /
32% |
* ... menor é melhor
Exibir tempos de resposta
| ↔ Tempo de resposta preto para branco | ||
|---|---|---|
| 32 ms ... ascensão ↗ e queda ↘ combinadas | ↗ 16.4 ms ascensão | 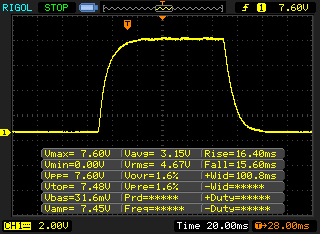 |
| ↘ 15.6 ms queda | ||
| A tela mostra taxas de resposta lentas em nossos testes e será insatisfatória para os jogadores. Em comparação, todos os dispositivos testados variam de 0.1 (mínimo) a 240 (máximo) ms. » 86 % de todos os dispositivos são melhores. Isso significa que o tempo de resposta medido é pior que a média de todos os dispositivos testados (19.8 ms). | ||
| ↔ Tempo de resposta 50% cinza a 80% cinza | ||
| 48.8 ms ... ascensão ↗ e queda ↘ combinadas | ↗ 24.4 ms ascensão | 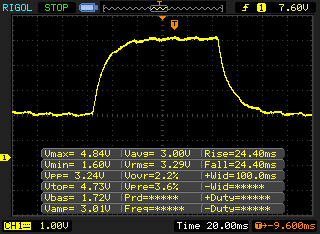 |
| ↘ 24.4 ms queda | ||
| A tela mostra taxas de resposta lentas em nossos testes e será insatisfatória para os jogadores. Em comparação, todos os dispositivos testados variam de 0.165 (mínimo) a 636 (máximo) ms. » 84 % de todos os dispositivos são melhores. Isso significa que o tempo de resposta medido é pior que a média de todos os dispositivos testados (31 ms). | ||
Cintilação da tela / PWM (modulação por largura de pulso)
| Tela tremeluzindo/PWM detectado | 1000 Hz | ≤ 99 % configuração de brilho | 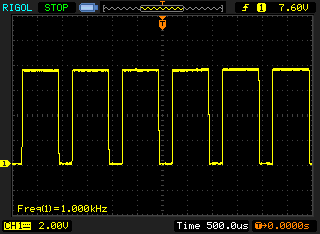 |
A luz de fundo da tela pisca em 1000 Hz (pior caso, por exemplo, utilizando PWM) Cintilação detectada em uma configuração de brilho de 99 % e abaixo. Não deve haver cintilação ou PWM acima desta configuração de brilho. A frequência de 1000 Hz é bastante alta, então a maioria dos usuários sensíveis ao PWM não deve notar nenhuma oscilação. [pwm_comparison] Em comparação: 52 % de todos os dispositivos testados não usam PWM para escurecer a tela. Se PWM foi detectado, uma média de 7763 (mínimo: 5 - máximo: 343500) Hz foi medida. | |||
| PCMark 8 Home Score Accelerated v2 | 3494 pontos | |
| PCMark 8 Work Score Accelerated v2 | 5045 pontos | |
| PCMark 10 Score | 4005 pontos | |
Ajuda | ||
| DPC Latencies / LatencyMon - interrupt to process latency (max), Web, Youtube, Prime95 | |
| HP ProBook 430 G7-8VU53EA | |
* ... menor é melhor
| HP ProBook 430 G7-8VU53EA Toshiba KBG30ZMV256G | HP ProBook 430 G6-5TJ89EA WDC PC SN520 SDAPNUW-256G | HP EliteBook 830 G5-3JX74EA Samsung SSD PM961 1TB M.2 PCIe 3.0 x4 NVMe (MZVLW1T0) | Lenovo ThinkPad L390-20NR0013GE Samsung SSD PM981 MZVLB256HAHQ | Dell Latitude 5300 SK Hynix PC401 512GB M.2 (HFS512GD9TNG) | Média Toshiba KBG30ZMV256G | |
|---|---|---|---|---|---|---|
| CrystalDiskMark 5.2 / 6 | 16% | 47% | 50% | 36% | -5% | |
| Write 4K (MB/s) | 124.7 | 101.8 -18% | 108.5 -13% | 99.6 -20% | 119.2 -4% | 114.9 ? -8% |
| Read 4K (MB/s) | 48.17 | 41.35 -14% | 40.53 -16% | 37.22 -23% | 41.43 -14% | 48 ? 0% |
| Write Seq (MB/s) | 694 | 929 34% | 1026 48% | 1432 106% | 1240 79% | 727 ? 5% |
| Read Seq (MB/s) | 757 | 1388 83% | 2080 175% | 2072 174% | 1668 120% | 885 ? 17% |
| Write 4K Q32T1 (MB/s) | 311 | 453.5 46% | 451 45% | 439.7 41% | 381.7 23% | 253 ? -19% |
| Read 4K Q32T1 (MB/s) | 495.5 | 286.2 -42% | 269.7 -46% | 264.8 -47% | 371.5 -25% | 400 ? -19% |
| Write Seq Q32T1 (MB/s) | 1017 | 1302 28% | 1770 74% | 1549 52% | 1369 35% | 849 ? -17% |
| Read Seq Q32T1 (MB/s) | 1530 | 1751 14% | 3214 110% | 3318 117% | 2652 73% | 1493 ? -2% |

| 3DMark 11 - 1280x720 Performance GPU | |
| Média da turma Office (2551 - 18313, n=69, últimos 2 anos) | |
| Dell Latitude 5300 | |
| HP ProBook 430 G7-8VU53EA | |
| Média Intel UHD Graphics 620 (1144 - 3432, n=244) | |
| HP EliteBook 830 G5-3JX74EA | |
| Lenovo ThinkPad L390-20NR0013GE | |
| HP ProBook 430 G6-5TJ89EA | |
| 3DMark 11 Performance | 2006 pontos | |
| 3DMark Cloud Gate Standard Score | 7853 pontos | |
| 3DMark Fire Strike Score | 1019 pontos | |
| 3DMark Time Spy Score | 435 pontos | |
Ajuda | ||
| baixo | média | alto | ultra | |
|---|---|---|---|---|
| BioShock Infinite (2013) | 59 | 32.7 | 25.7 | 8.4 |
| Dota 2 Reborn (2015) | 68.6 | 41.6 | 18.1 | 15.8 |
| X-Plane 11.11 (2018) | 21.6 | 14.1 | 12.8 | |
| Shadow of the Tomb Raider (2018) | 14 | |||
| Total War: Three Kingdoms (2019) | 22.4 |
Barulho
| Ocioso |
| 29.7 / 29.7 / 30.3 dB |
| Carga |
| 30.4 / 31.2 dB |
 | ||
30 dB silencioso 40 dB(A) audível 50 dB(A) ruidosamente alto |
||
min: | ||
(+) A temperatura máxima no lado superior é 39.2 °C / 103 F, em comparação com a média de 34.3 °C / 94 F , variando de 21.2 a 62.5 °C para a classe Office.
(-) A parte inferior aquece até um máximo de 47.8 °C / 118 F, em comparação com a média de 36.8 °C / 98 F
(+) Em uso inativo, a temperatura média para o lado superior é 24.6 °C / 76 F, em comparação com a média do dispositivo de 29.5 °C / ### class_avg_f### F.
(+) Os apoios para as mãos e o touchpad são mais frios que a temperatura da pele, com um máximo de 27.8 °C / 82 F e, portanto, são frios ao toque.
(±) A temperatura média da área do apoio para as mãos de dispositivos semelhantes foi 27.5 °C / 81.5 F (-0.3 °C / -0.5 F).
HP ProBook 430 G7-8VU53EA análise de áudio
(±) | o volume do alto-falante é médio, mas bom (###valor### dB)
Graves 100 - 315Hz
(-) | quase nenhum baixo - em média 18.8% menor que a mediana
(±) | a linearidade dos graves é média (10.9% delta para a frequência anterior)
Médios 400 - 2.000 Hz
(+) | médios equilibrados - apenas 2.2% longe da mediana
(+) | médios são lineares (6.4% delta para frequência anterior)
Altos 2 - 16 kHz
(+) | agudos equilibrados - apenas 2.8% longe da mediana
(+) | os máximos são lineares (4.8% delta da frequência anterior)
Geral 100 - 16.000 Hz
(±) | a linearidade do som geral é média (19.3% diferença em relação à mediana)
Comparado com a mesma classe
» 38% de todos os dispositivos testados nesta classe foram melhores, 7% semelhantes, 54% piores
» O melhor teve um delta de 7%, a média foi 21%, o pior foi 53%
Comparado com todos os dispositivos testados
» 47% de todos os dispositivos testados foram melhores, 8% semelhantes, 46% piores
» O melhor teve um delta de 4%, a média foi 24%, o pior foi 134%
Apple MacBook 12 (Early 2016) 1.1 GHz análise de áudio
(+) | os alto-falantes podem tocar relativamente alto (###valor### dB)
Graves 100 - 315Hz
(±) | graves reduzidos - em média 11.3% menor que a mediana
(±) | a linearidade dos graves é média (14.2% delta para a frequência anterior)
Médios 400 - 2.000 Hz
(+) | médios equilibrados - apenas 2.4% longe da mediana
(+) | médios são lineares (5.5% delta para frequência anterior)
Altos 2 - 16 kHz
(+) | agudos equilibrados - apenas 2% longe da mediana
(+) | os máximos são lineares (4.5% delta da frequência anterior)
Geral 100 - 16.000 Hz
(+) | o som geral é linear (10.2% diferença em relação à mediana)
Comparado com a mesma classe
» 7% de todos os dispositivos testados nesta classe foram melhores, 2% semelhantes, 91% piores
» O melhor teve um delta de 5%, a média foi 18%, o pior foi 53%
Comparado com todos os dispositivos testados
» 5% de todos os dispositivos testados foram melhores, 1% semelhantes, 94% piores
» O melhor teve um delta de 4%, a média foi 24%, o pior foi 134%
| desligado | |
| Ocioso | |
| Carga |
|
Key:
min: | |
| HP ProBook 430 G7-8VU53EA i7-10510U, UHD Graphics 620, Toshiba KBG30ZMV256G, IPS LED, 1920x1080, 13.3" | HP EliteBook 830 G5-3JX74EA i5-8550U, UHD Graphics 620, Samsung SSD PM961 1TB M.2 PCIe 3.0 x4 NVMe (MZVLW1T0), IPS LED, 1920x1080, 13.3" | HP ProBook 430 G6-5TJ89EA i5-8265U, UHD Graphics 620, WDC PC SN520 SDAPNUW-256G, IPS LED, 1920x1080, 13.3" | Lenovo ThinkPad L390-20NR0013GE i5-8265U, UHD Graphics 620, Samsung SSD PM981 MZVLB256HAHQ, IPS LED, 1920x1080, 13.3" | Dell Latitude 5300 i5-8365U, UHD Graphics 620, SK Hynix PC401 512GB M.2 (HFS512GD9TNG), IPS, 1920x1080, 13.3" | Média Intel UHD Graphics 620 | Média da turma Office | |
|---|---|---|---|---|---|---|---|
| Power Consumption | -22% | -2% | -12% | -18% | -10% | -28% | |
| Idle Minimum * (Watt) | 3.3 | 4.5 -36% | 3.5 -6% | 3.8 -15% | 3.8 -15% | 3.81 ? -15% | 4.4 ? -33% |
| Idle Average * (Watt) | 6.1 | 6.4 -5% | 5.76 6% | 6.8 -11% | 6.9 -13% | 6.94 ? -14% | 7.35 ? -20% |
| Idle Maximum * (Watt) | 8.6 | 9.2 -7% | 8.3 3% | 9.8 -14% | 7.5 13% | 8.75 ? -2% | 8.57 ? -0% |
| Load Average * (Watt) | 32.4 | 35.7 -10% | 34.8 -7% | 32.4 -0% | 41.4 -28% | 35 ? -8% | 43.5 ? -34% |
| Load Maximum * (Watt) | 42.7 | 65.4 -53% | 45.7 -7% | 52 -22% | 63.1 -48% | 47.5 ? -11% | 64.5 ? -51% |
* ... menor é melhor
| HP ProBook 430 G7-8VU53EA i7-10510U, UHD Graphics 620, 45 Wh | HP ProBook 430 G6-5TJ89EA i5-8265U, UHD Graphics 620, 45 Wh | HP EliteBook 830 G5-3JX74EA i5-8550U, UHD Graphics 620, 49 Wh | Lenovo ThinkPad L390-20NR0013GE i5-8265U, UHD Graphics 620, 45 Wh | Dell Latitude 5300 i5-8365U, UHD Graphics 620, 60 Wh | Média da turma Office | |
|---|---|---|---|---|---|---|
| Duração da bateria | -0% | -15% | -22% | 5% | 27% | |
| H.264 (h) | 9.8 | 9.1 -7% | 8 -18% | 9.4 -4% | 15.1 ? 54% | |
| WiFi v1.3 (h) | 7.9 | 9.5 20% | 7.1 -10% | 7 -11% | 8.3 5% | 12.9 ? 63% |
| Load (h) | 2.8 | 2.4 -14% | 2.3 -18% | 1.4 -50% | 1.795 ? -36% | |
| Reader / Idle (h) | 16.2 | 12.8 | 16.2 | 23.7 ? |
Pro
Contra
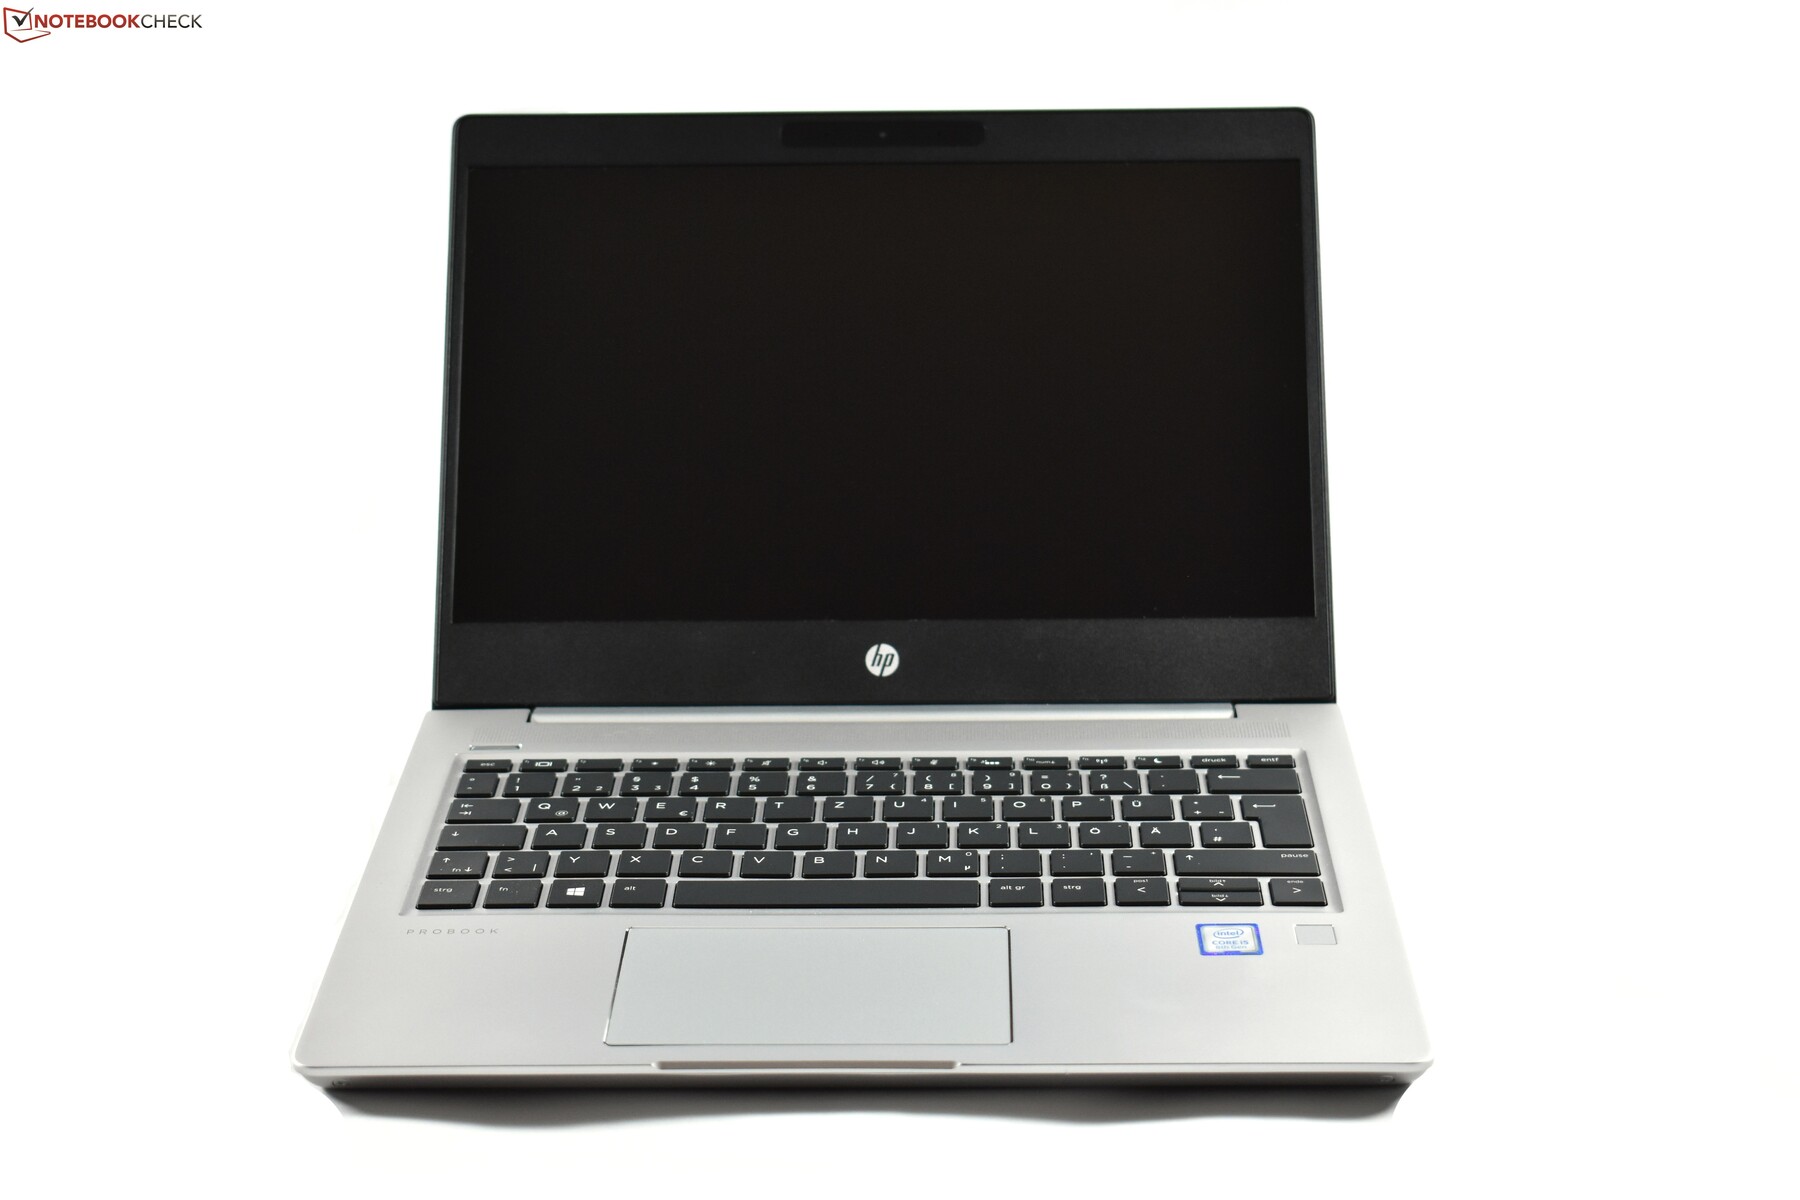
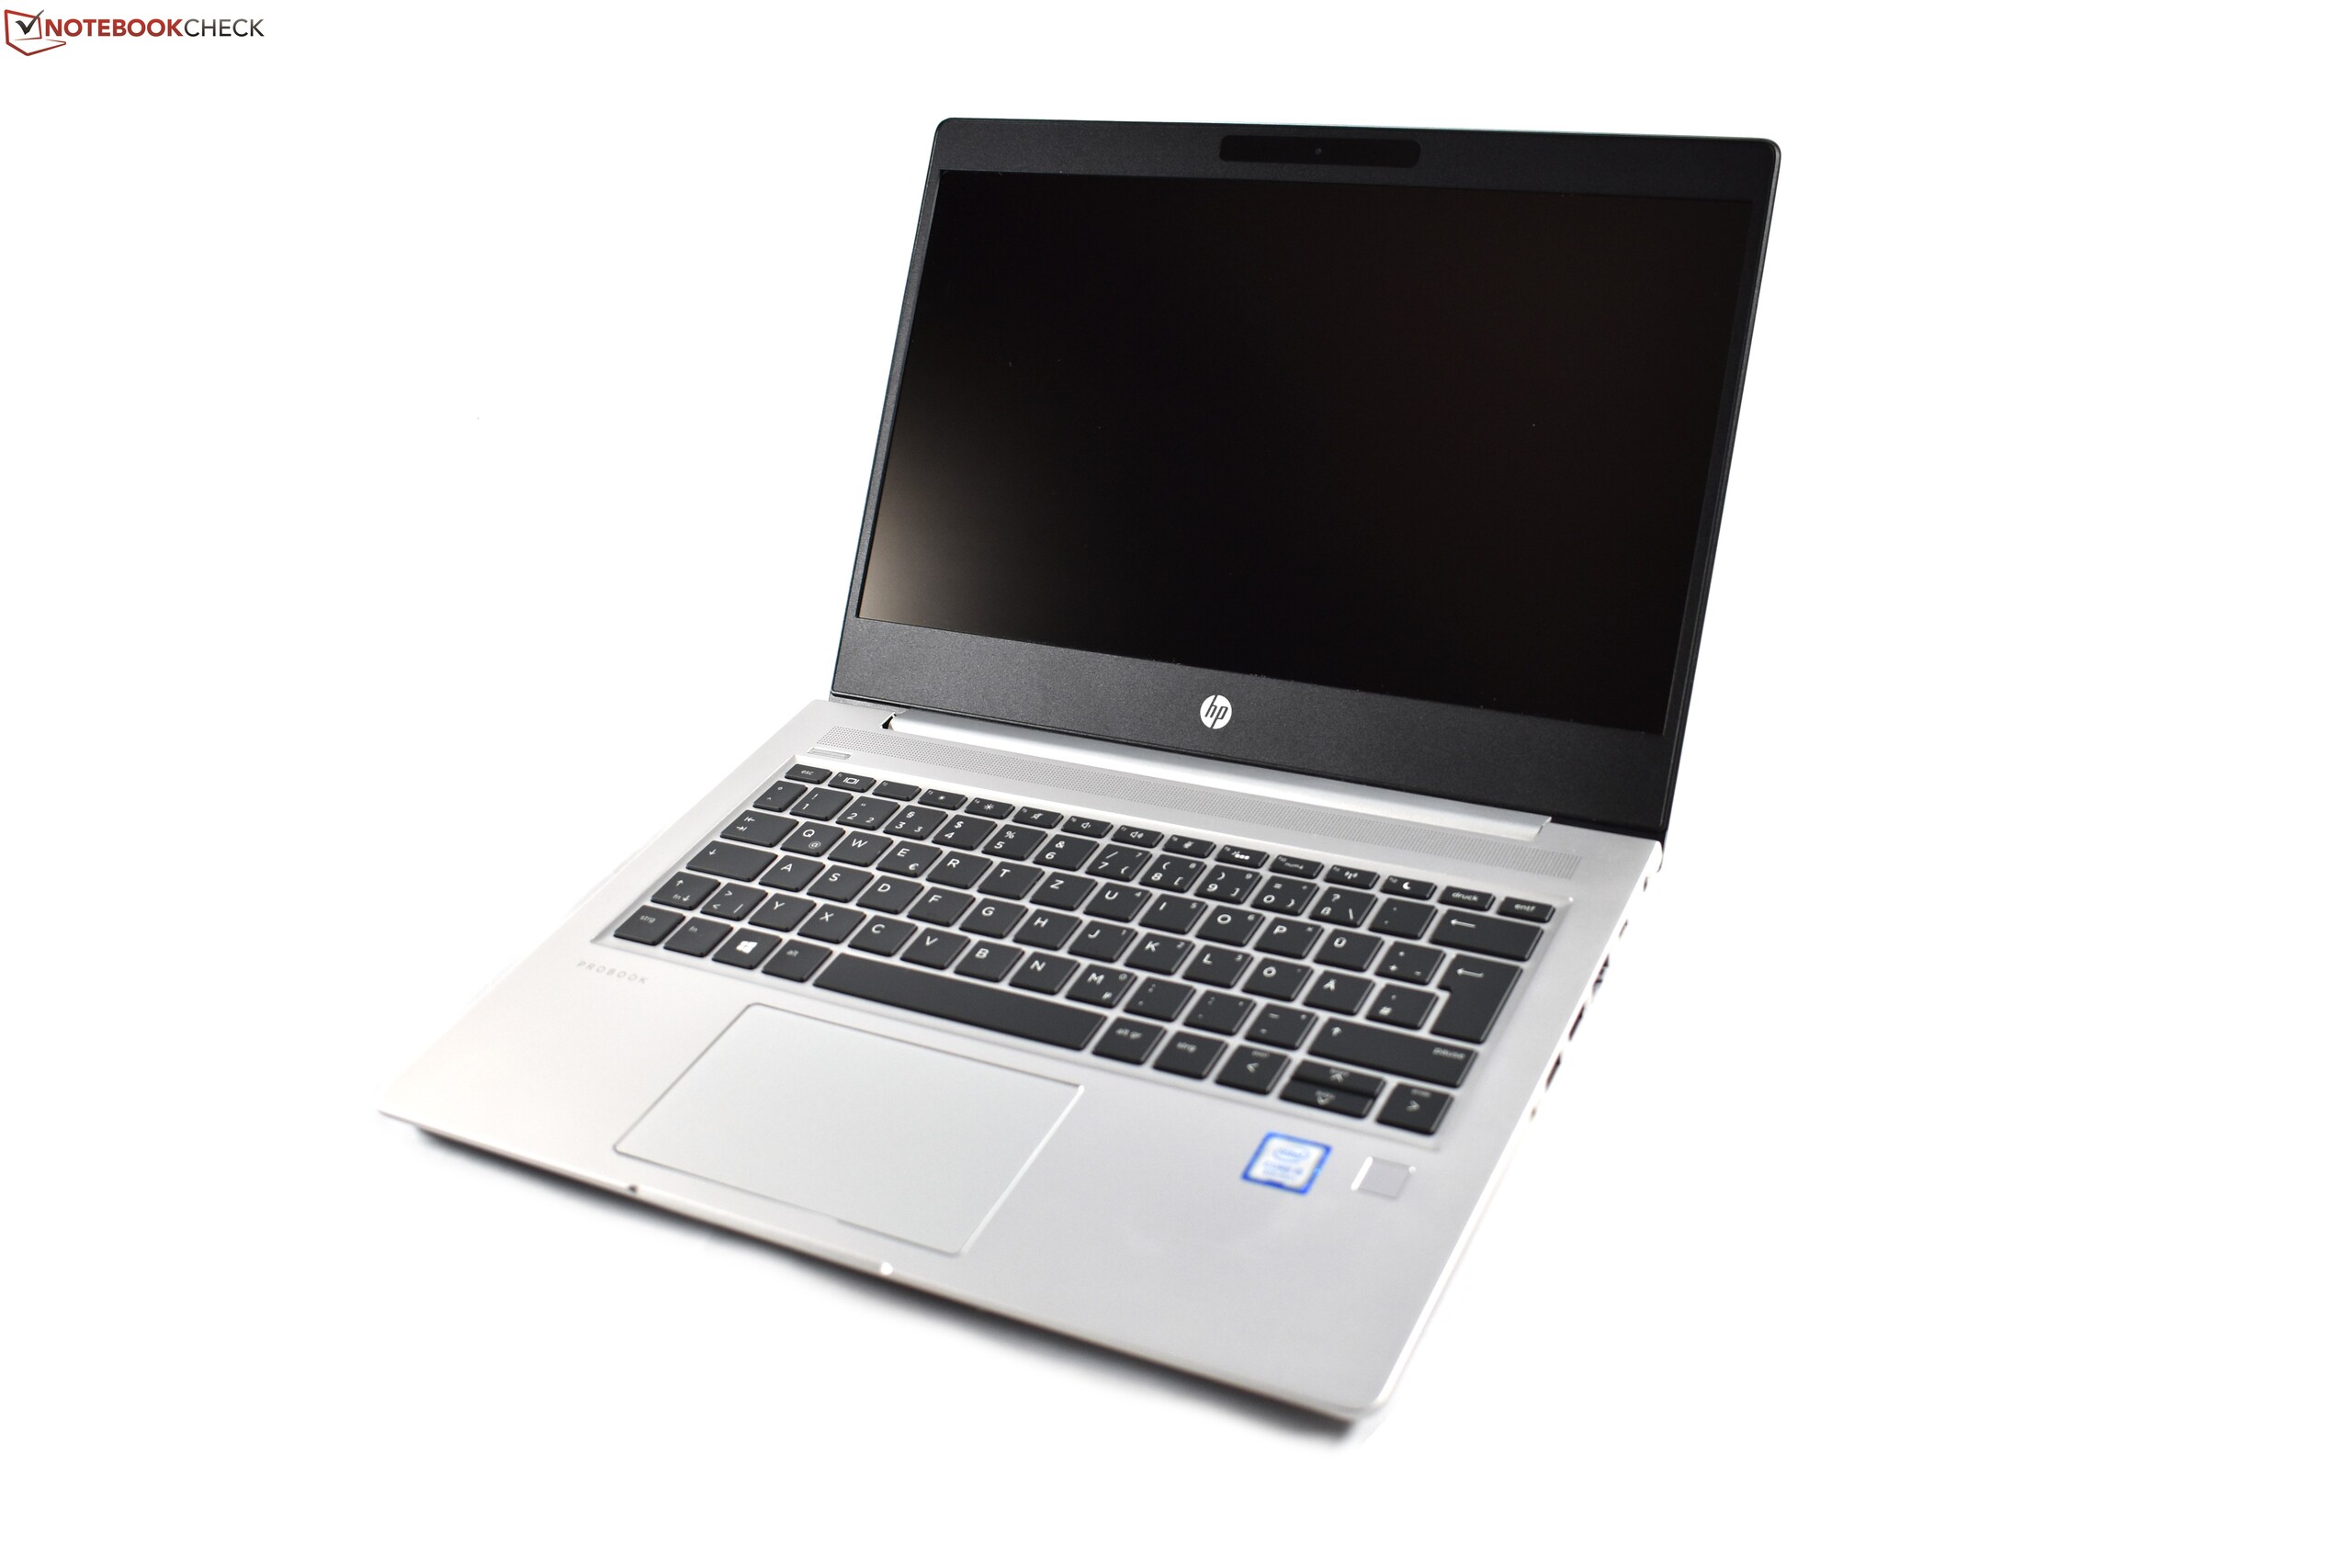
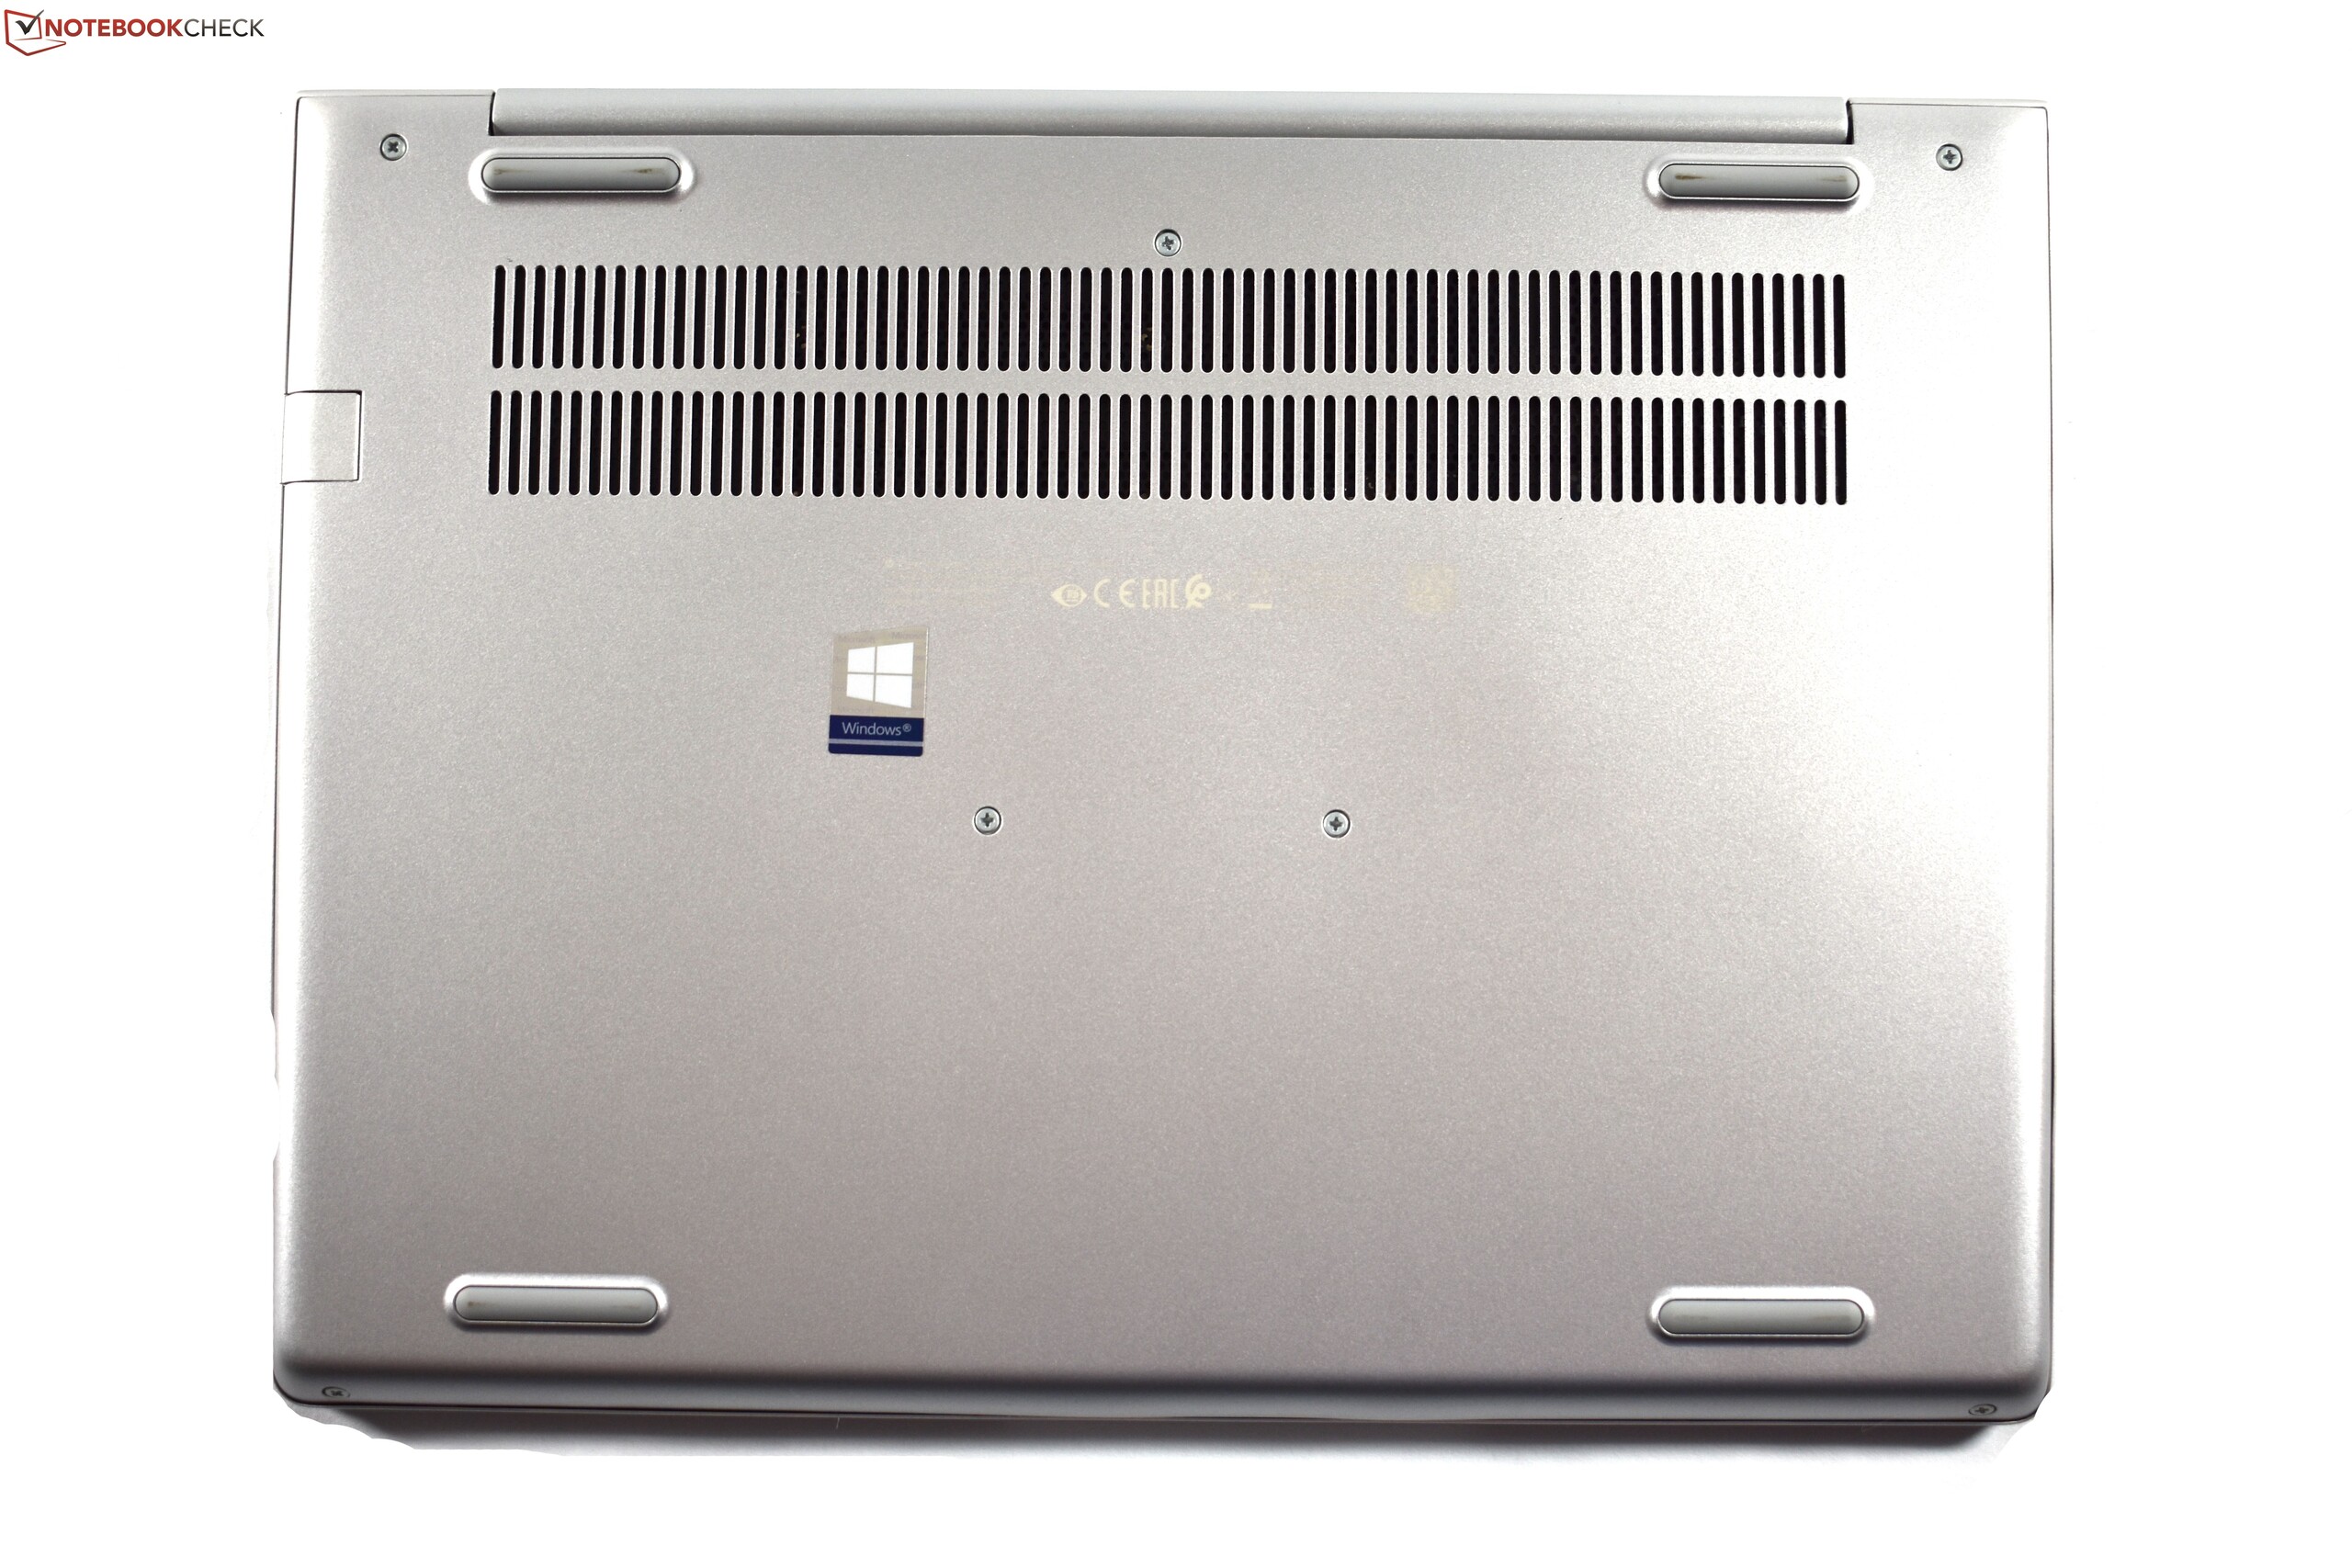
A HP permanece com o design estabelecido do modelo do ano passado e faz apenas algumas modificações "sob o capô".
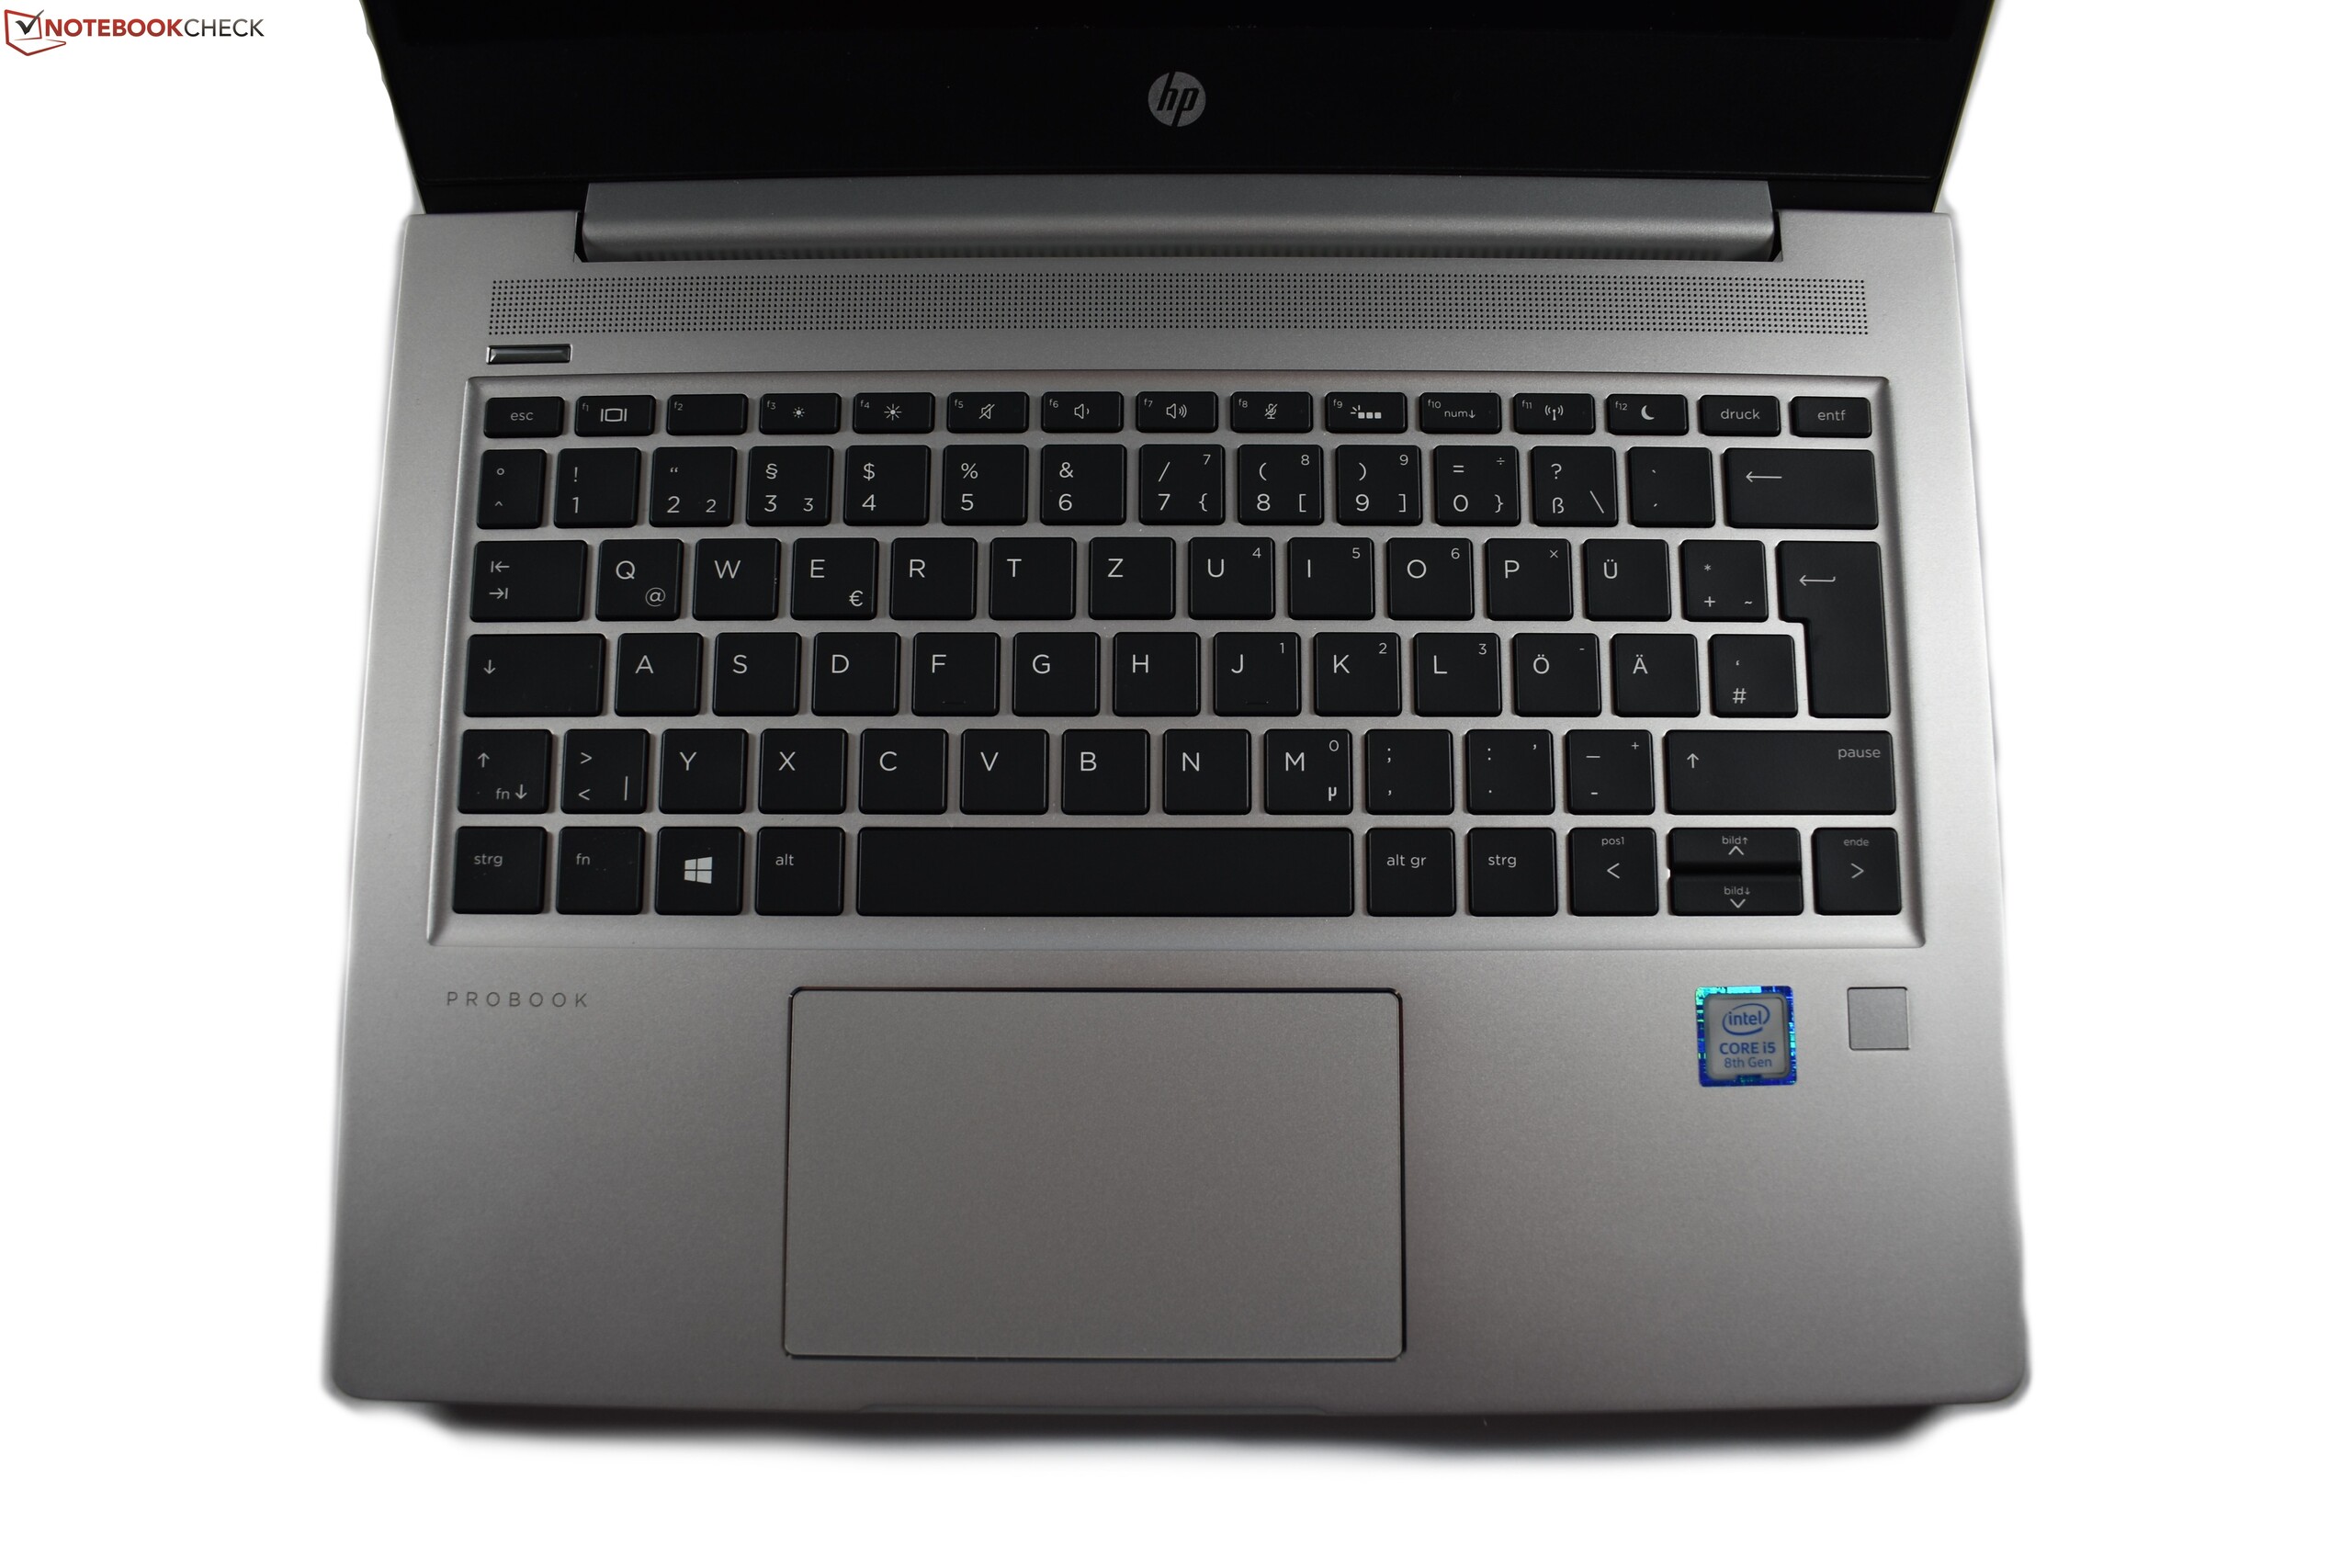
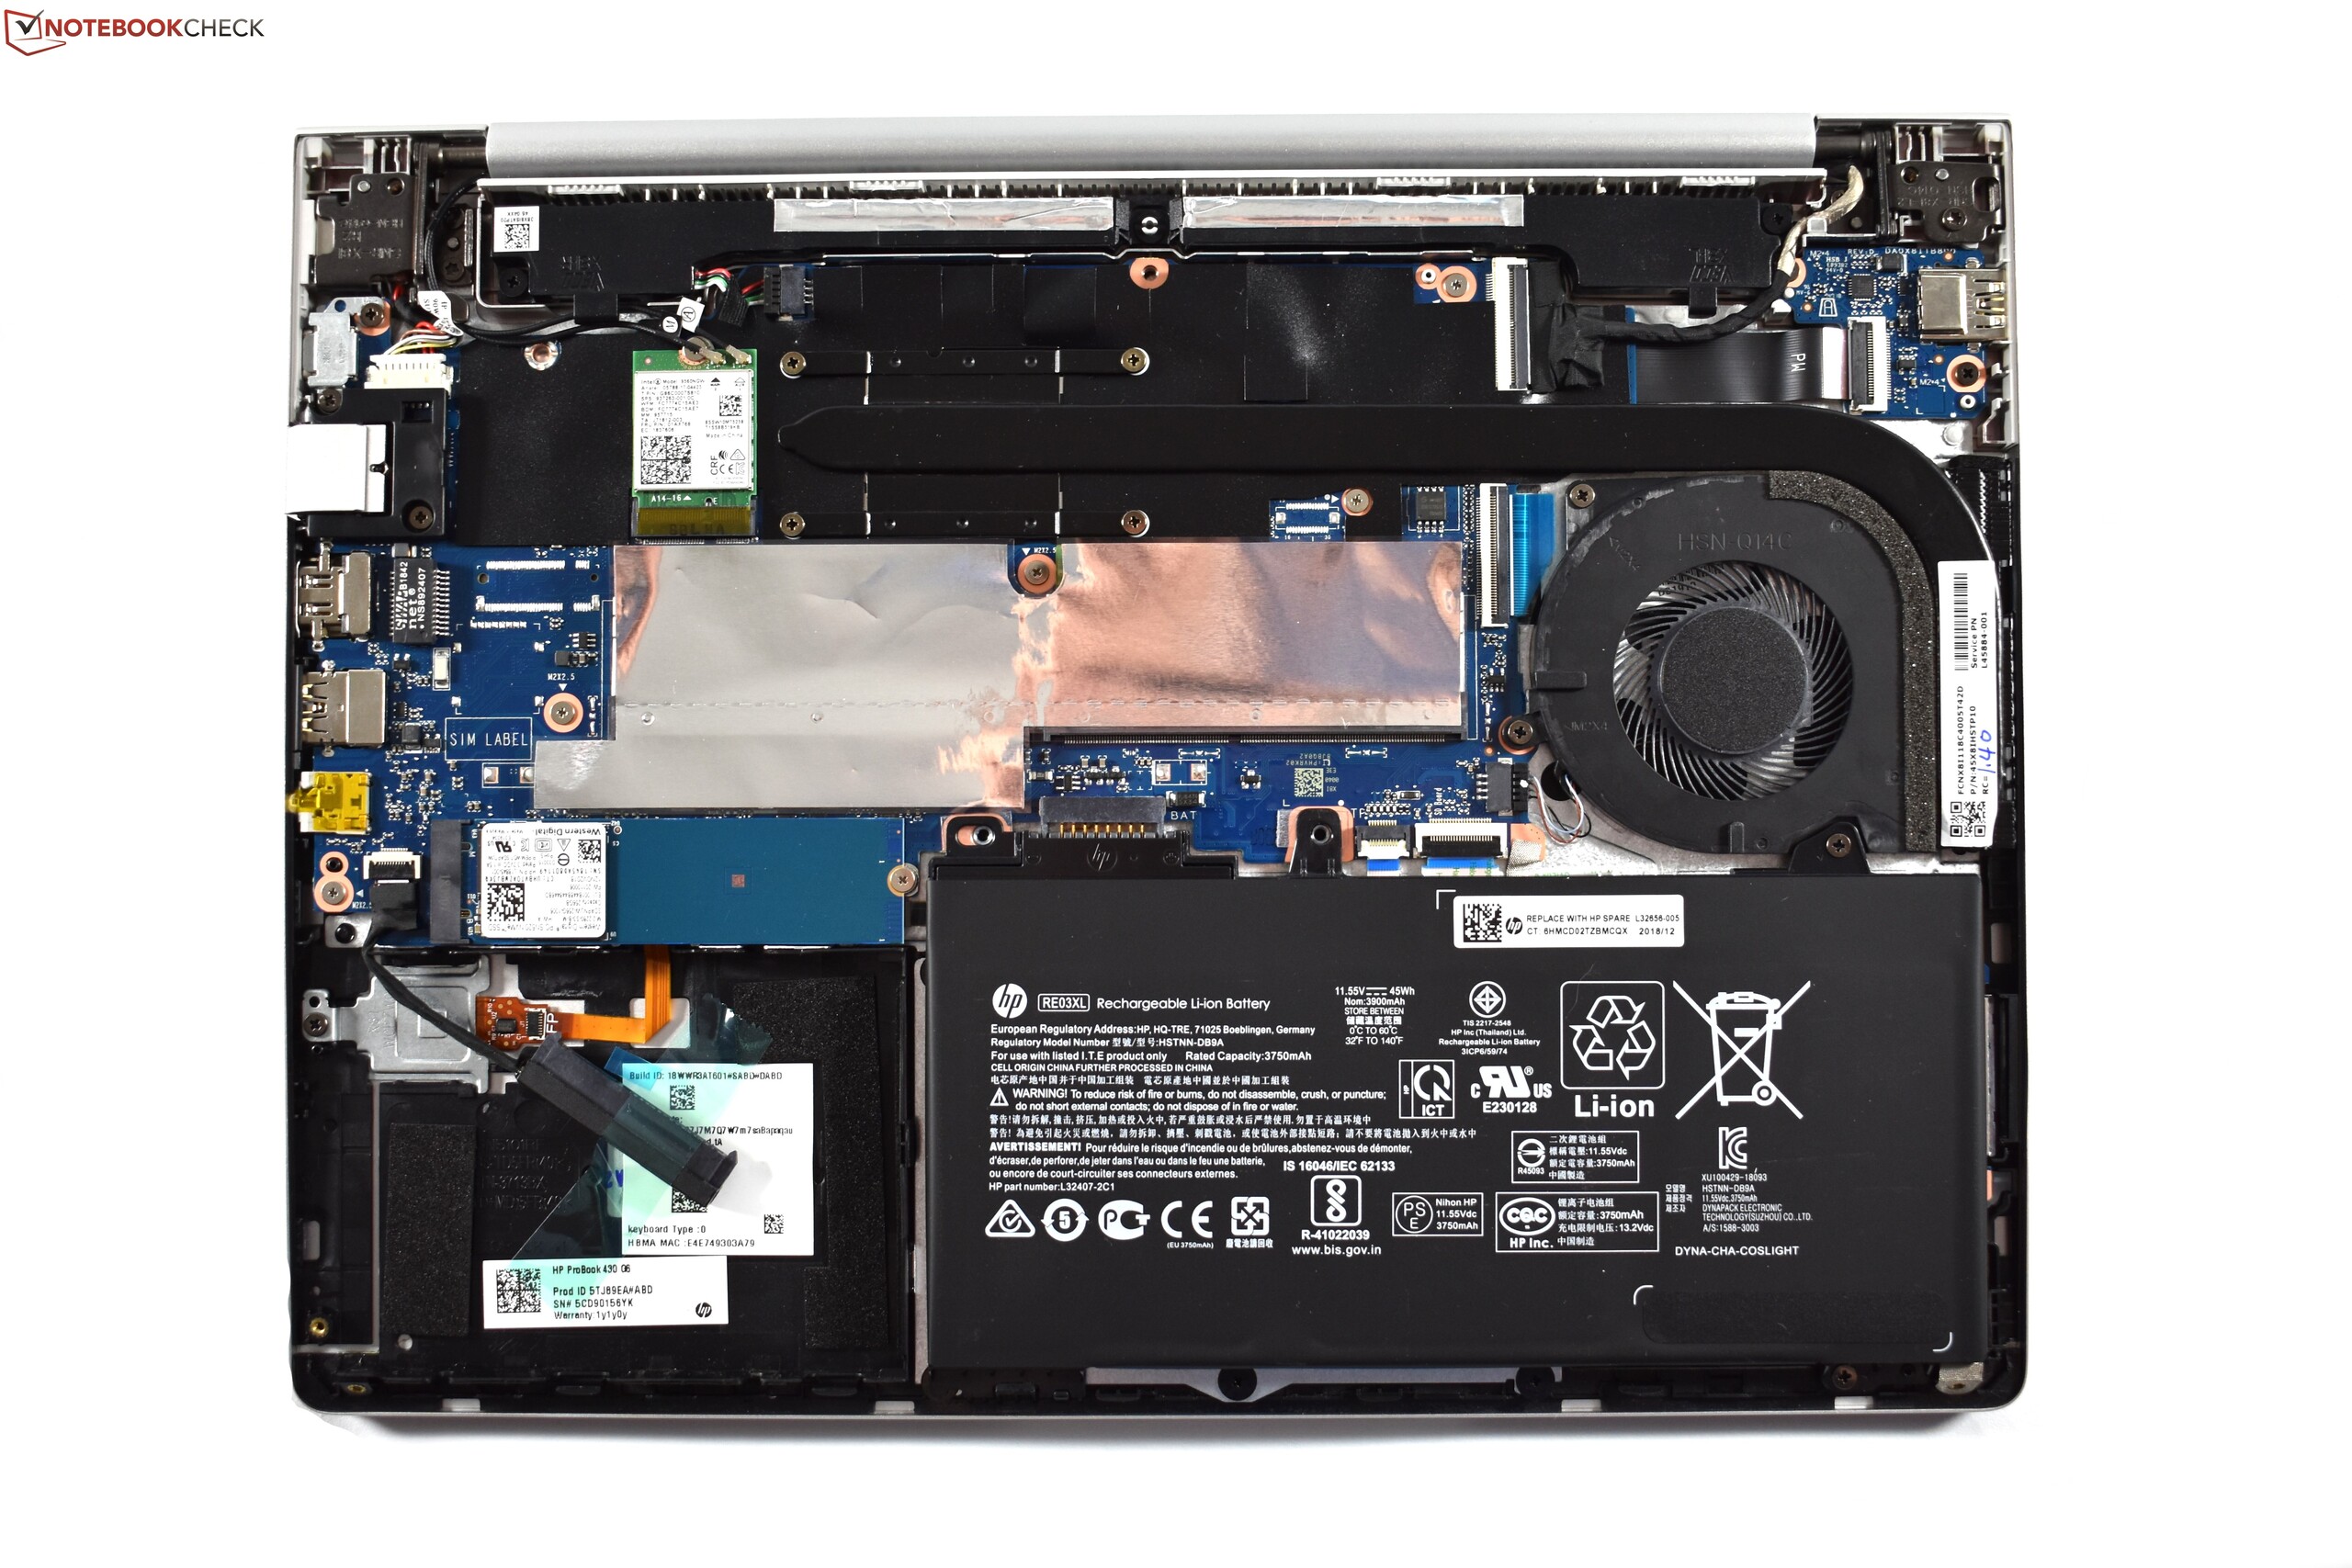
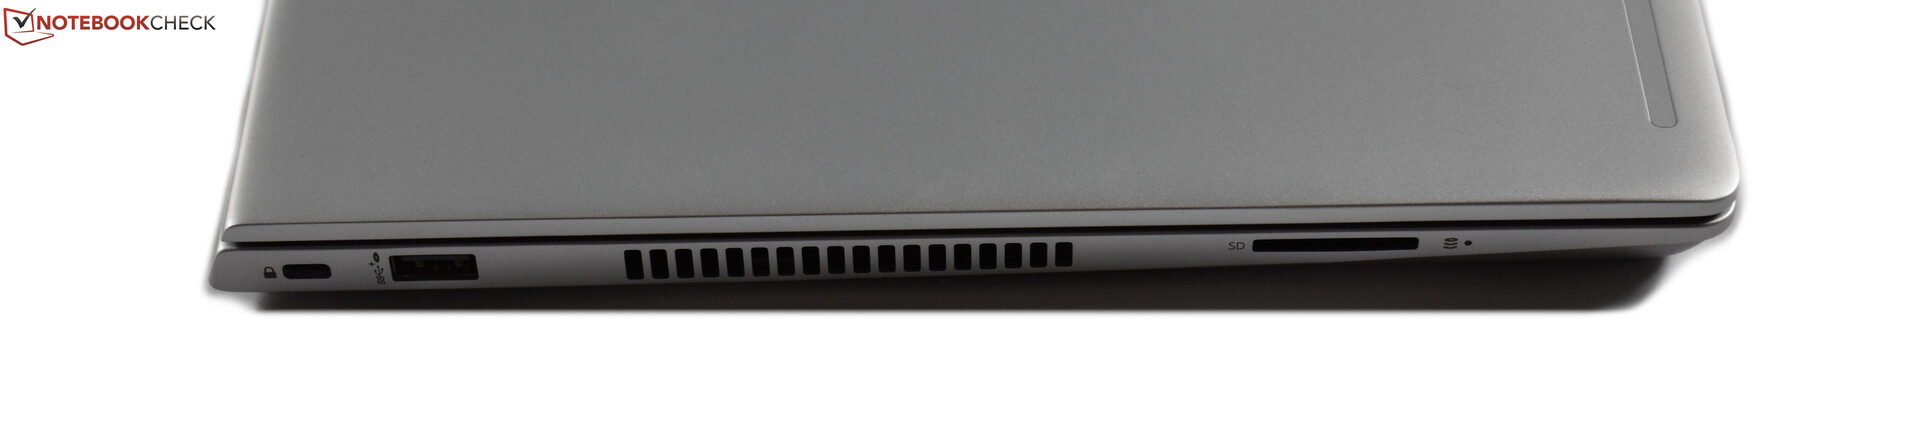
O veredicto básico do HP ProBook 430 G6 é verdade. O portátil de escritório, comparativamente acessível, tem muitos pontos positivos do seu lado: O teclado confortável, a excelente capacidade de atualização ou o leitor de cartões SD. Todos estes pontos devem ser suficientes para tornar o ProBook um dispositivo companheiro ideal para muitos estudantes ou usuários autônomos.
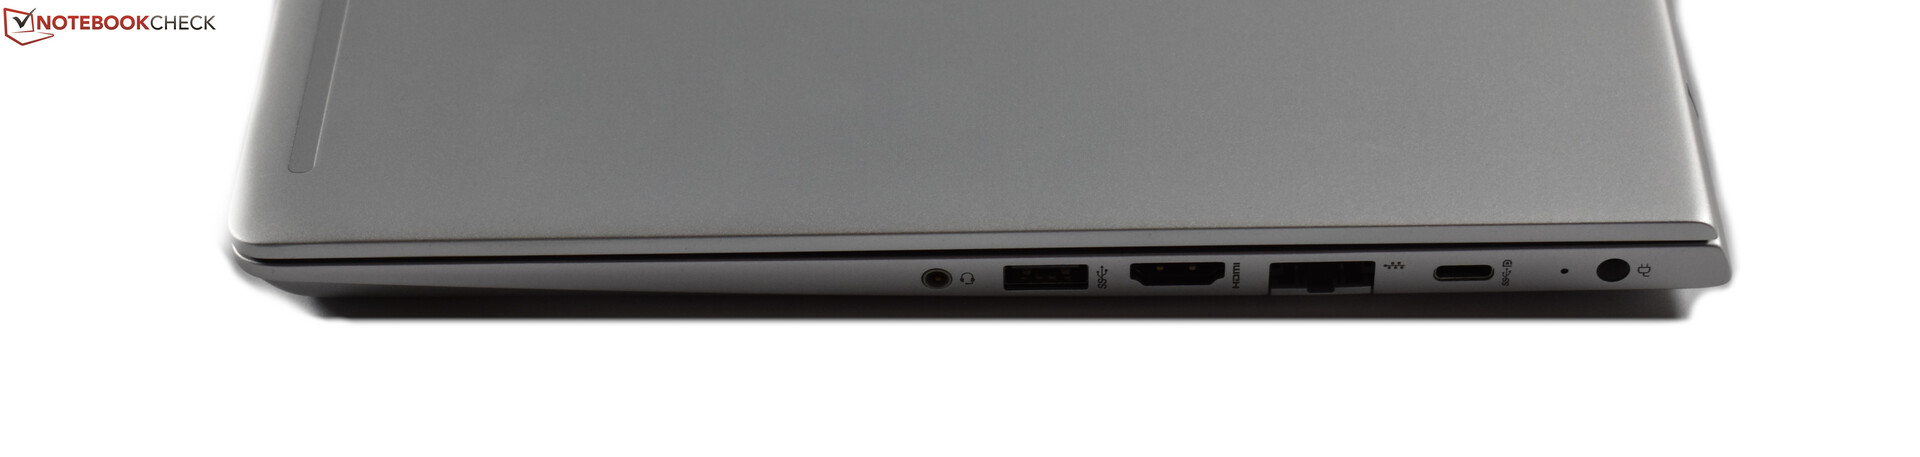
As mudanças internas são, ao mesmo tempo, positivas e negativas. Sem dúvida o Wi-Fi 6 é uma grande melhoria. Já o mais novo processador Comet Lake não consegue superar o antigo predecessor Whiskey Lake. Apesar da estagnação do desempenho, o ProBook funciona mais quente do que o modelo mais antigo e é menos duradouro quando se trata da duração da bateria. Esses não são ruins o suficiente, mas também não são aspectos realmente positivos. Existem outros novos problemas: O ventilador pulsante e o problema de latência do DPC. Fora isso, os pontos negativos do modelo antigo permanecem: A tela tem uma fraca cobertura de gama de cores, falta o Thunderbolt e recursos empresariais, não há pointing-stick e o ProBook tem apenas um ano de garantia.
O HP ProBook 430 G7 não é uma grande atualização de forma alguma. Mas também não foi realmente necessária, pois o modelo mais antigo já era um bom portátil de escritório.
Os proprietários do ProBook 430 G6 deveriam atualizar? Não exatamente Em geral, recomendamos o ProBook, mas a HP deve ao menos consertar o irritante ventilador pulsante com uma atualização do firmware.
HP ProBook 430 G7-8VU53EA
- 05/13/2020 v7 (old)
Benjamin Herzig
Price comparison
