Breve Análise do Portátil HP ProBook 430 G6 (Core i5-8265U, 8 GB RAM, 256 GB SSD, FHD)
| SD Card Reader | |
| average JPG Copy Test (av. of 3 runs) | |
| Dell XPS 13 9380 2019 (Toshiba Exceria Pro SDXC 64 GB UHS-II) | |
| Dell Latitude 7390 (Toshiba Exceria Pro M501) | |
| HP ProBook 430 G5-3KX72ES (Toshiba Exceria Pro SDXC 64 GB UHS-II) | |
| Lenovo ThinkPad L390-20NR0013GE (Toshiba Exceria Pro M501 UHS-II) | |
| HP ProBook 430 G6-5TJ89EA (Toshiba Exceria Pro SDXC 64 GB UHS-II) | |
| Média da turma Office (19.8 - 198.5, n=22, últimos 2 anos) | |
| maximum AS SSD Seq Read Test (1GB) | |
| Dell Latitude 7390 (Toshiba Exceria Pro M501) | |
| Dell XPS 13 9380 2019 (Toshiba Exceria Pro SDXC 64 GB UHS-II) | |
| HP ProBook 430 G5-3KX72ES (Toshiba Exceria Pro SDXC 64 GB UHS-II) | |
| Lenovo ThinkPad L390-20NR0013GE (Toshiba Exceria Pro M501 UHS-II) | |
| HP ProBook 430 G6-5TJ89EA (Toshiba Exceria Pro SDXC 64 GB UHS-II) | |
| Média da turma Office (27.4 - 249, n=21, últimos 2 anos) | |
| Networking | |
| iperf3 transmit AX12 | |
| Lenovo ThinkPad L390-20NR0013GE | |
| HP ProBook 430 G6-5TJ89EA | |
| HP ProBook 430 G5-3KX72ES | |
| Dell XPS 13 9380 2019 | |
| HP EliteBook 830 G5-3JX74EA | |
| Dell Latitude 7390 | |
| iperf3 receive AX12 | |
| Lenovo ThinkPad L390-20NR0013GE | |
| HP ProBook 430 G6-5TJ89EA | |
| HP ProBook 430 G5-3KX72ES | |
| HP EliteBook 830 G5-3JX74EA | |
| Dell Latitude 7390 | |
| Dell XPS 13 9380 2019 | |
| |||||||||||||||||||||||||
iluminação: 88 %
iluminação com acumulador: 254 cd/m²
Contraste: 1417:1 (Preto: 0.18 cd/m²)
ΔE ColorChecker Calman: 5.4 | ∀{0.5-29.43 Ø4.71}
calibrated: 4.1
ΔE Greyscale Calman: 3.8 | ∀{0.09-98 Ø4.96}
62.5% sRGB (Argyll 1.6.3 3D)
39.4% AdobeRGB 1998 (Argyll 1.6.3 3D)
43.3% AdobeRGB 1998 (Argyll 3D)
62.6% sRGB (Argyll 3D)
41.87% Display P3 (Argyll 3D)
Gamma: 2.41
CCT: 7100 K
| HP ProBook 430 G6-5TJ89EA CMN1375, , 1920x1080, 13.3" | Lenovo ThinkPad L390-20NR0013GE LP133WF2-SPL8, , 1920x1080, 13.3" | HP ProBook 430 G5-3KX72ES LGD052D, , 1920x1080, 13.3" | HP EliteBook 830 G5-3JX74EA IVO M133NVF3-R0, , 1920x1080, 13.3" | Dell Latitude 7390 AU Optronics AUO462D / B133HAN [DELL P/N:F7VDJ], , 1920x1080, 13.3" | Dell XPS 13 9380 2019 ID: AUO 282B B133ZAN Dell: 90NTH, , 3840x2160, 13.3" | |
|---|---|---|---|---|---|---|
| Display | -3% | -4% | 49% | 51% | 52% | |
| Display P3 Coverage (%) | 41.87 | 40.42 -3% | 40.23 -4% | 64.2 53% | 65.1 55% | 64.7 55% |
| sRGB Coverage (%) | 62.6 | 60.4 -4% | 60.3 -4% | 89.2 42% | 90.8 45% | 93.1 49% |
| AdobeRGB 1998 Coverage (%) | 43.3 | 41.8 -3% | 41.59 -4% | 65.2 51% | 65.9 52% | 65.3 51% |
| Response Times | -2% | 5% | 15% | -18% | -30% | |
| Response Time Grey 50% / Grey 80% * (ms) | 40.8 ? | 42.8 ? -5% | 41.6 ? -2% | 36 ? 12% | 48.8 ? -20% | 58 ? -42% |
| Response Time Black / White * (ms) | 30.4 ? | 30 ? 1% | 27.2 ? 11% | 24.8 ? 18% | 35.2 ? -16% | 36 ? -18% |
| PWM Frequency (Hz) | 26040 ? | 30490 ? | 20490 ? | 1020 ? | ||
| Screen | -19% | -12% | 19% | 22% | 20% | |
| Brightness middle (cd/m²) | 255 | 298 17% | 262 3% | 316 24% | 329 29% | 404 58% |
| Brightness (cd/m²) | 238 | 278 17% | 253 6% | 326 37% | 316 33% | 389 63% |
| Brightness Distribution (%) | 88 | 81 -8% | 82 -7% | 85 -3% | 92 5% | 85 -3% |
| Black Level * (cd/m²) | 0.18 | 0.33 -83% | 0.28 -56% | 0.19 -6% | 0.25 -39% | 0.37 -106% |
| Contrast (:1) | 1417 | 903 -36% | 936 -34% | 1663 17% | 1316 -7% | 1092 -23% |
| Colorchecker dE 2000 * | 5.4 | 6.5 -20% | 5.7 -6% | 4.5 17% | 4.3 20% | 3.72 31% |
| Colorchecker dE 2000 max. * | 19.5 | 23.9 -23% | 22.4 -15% | 12.1 38% | 7.8 60% | 7.38 62% |
| Colorchecker dE 2000 calibrated * | 4.1 | 4.9 -20% | 4.8 -17% | 2.9 29% | 2.5 39% | 2.06 50% |
| Greyscale dE 2000 * | 3.8 | 5.6 -47% | 3.6 5% | 5 -32% | 3.6 5% | 4.44 -17% |
| Gamma | 2.41 91% | 2.08 106% | 2.15 102% | 2.22 99% | 2.43 91% | 2.34 94% |
| CCT | 7100 92% | 6669 97% | 7096 92% | 6018 108% | 6928 94% | 7095 92% |
| Color Space (Percent of AdobeRGB 1998) (%) | 39.4 | 38.4 -3% | 38.3 -3% | 57.9 47% | 59.1 50% | 60 52% |
| Color Space (Percent of sRGB) (%) | 62.5 | 60.1 -4% | 60.1 -4% | 87.3 40% | 90.6 45% | 93 49% |
| Média Total (Programa/Configurações) | -8% /
-14% | -4% /
-8% | 28% /
24% | 18% /
22% | 14% /
19% |
* ... menor é melhor
Exibir tempos de resposta
| ↔ Tempo de resposta preto para branco | ||
|---|---|---|
| 30.4 ms ... ascensão ↗ e queda ↘ combinadas | ↗ 16.4 ms ascensão | 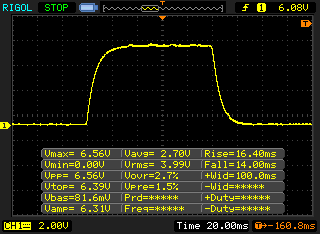 |
| ↘ 14 ms queda | ||
| A tela mostra taxas de resposta lentas em nossos testes e será insatisfatória para os jogadores. Em comparação, todos os dispositivos testados variam de 0.1 (mínimo) a 240 (máximo) ms. » 82 % de todos os dispositivos são melhores. Isso significa que o tempo de resposta medido é pior que a média de todos os dispositivos testados (19.8 ms). | ||
| ↔ Tempo de resposta 50% cinza a 80% cinza | ||
| 40.8 ms ... ascensão ↗ e queda ↘ combinadas | ↗ 22.8 ms ascensão | 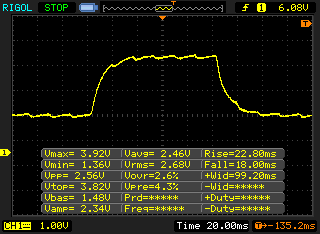 |
| ↘ 18 ms queda | ||
| A tela mostra taxas de resposta lentas em nossos testes e será insatisfatória para os jogadores. Em comparação, todos os dispositivos testados variam de 0.165 (mínimo) a 636 (máximo) ms. » 64 % de todos os dispositivos são melhores. Isso significa que o tempo de resposta medido é pior que a média de todos os dispositivos testados (30.9 ms). | ||
Cintilação da tela / PWM (modulação por largura de pulso)
| Tela tremeluzindo/PWM detectado | 26040 Hz | ≤ 40 % configuração de brilho | 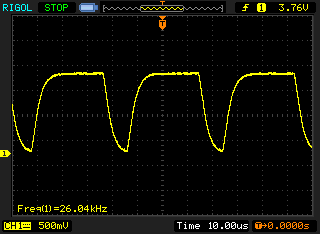 |
A luz de fundo da tela pisca em 26040 Hz (pior caso, por exemplo, utilizando PWM) Cintilação detectada em uma configuração de brilho de 40 % e abaixo. Não deve haver cintilação ou PWM acima desta configuração de brilho. A frequência de 26040 Hz é bastante alta, então a maioria dos usuários sensíveis ao PWM não deve notar nenhuma oscilação. [pwm_comparison] Em comparação: 52 % de todos os dispositivos testados não usam PWM para escurecer a tela. Se PWM foi detectado, uma média de 7744 (mínimo: 5 - máximo: 343500) Hz foi medida. | |||
| Cinebench R15 | |
| CPU Single 64Bit | |
| Média da turma Office (99.5 - 316, n=77, últimos 2 anos) | |
| HP EliteBook 830 G5-3JX74EA | |
| Lenovo ThinkPad L390-20NR0013GE | |
| Média Intel Core i5-8265U (111 - 164, n=35) | |
| HP ProBook 430 G6-5TJ89EA | |
| Dell Latitude 7390 | |
| Dell XPS 13 9380 2019 | |
| HP ProBook 430 G5-3KX72ES | |
| CPU Multi 64Bit | |
| Média da turma Office (250 - 3380, n=77, últimos 2 anos) | |
| Dell XPS 13 9380 2019 | |
| Dell Latitude 7390 | |
| Lenovo ThinkPad L390-20NR0013GE | |
| HP ProBook 430 G6-5TJ89EA | |
| Média Intel Core i5-8265U (457 - 750, n=38) | |
| HP ProBook 430 G5-3KX72ES | |
| HP EliteBook 830 G5-3JX74EA | |
| PCMark 8 | |
| Home Score Accelerated v2 | |
| Média da turma Office (n=1últimos 2 anos) | |
| HP EliteBook 830 G5-3JX74EA | |
| HP ProBook 430 G5-3KX72ES | |
| Dell Latitude 7390 | |
| Dell XPS 13 9380 2019 | |
| Média Intel Core i5-8265U, Intel UHD Graphics 620 (2747 - 4244, n=24) | |
| Lenovo ThinkPad L390-20NR0013GE | |
| HP ProBook 430 G6-5TJ89EA | |
| Work Score Accelerated v2 | |
| Média da turma Office (n=1últimos 2 anos) | |
| HP EliteBook 830 G5-3JX74EA | |
| HP ProBook 430 G6-5TJ89EA | |
| Dell Latitude 7390 | |
| Lenovo ThinkPad L390-20NR0013GE | |
| HP ProBook 430 G5-3KX72ES | |
| Média Intel Core i5-8265U, Intel UHD Graphics 620 (3132 - 4927, n=23) | |
| Dell XPS 13 9380 2019 | |
| PCMark 8 Home Score Accelerated v2 | 3342 pontos | |
| PCMark 8 Work Score Accelerated v2 | 4887 pontos | |
| PCMark 10 Score | 3753 pontos | |
Ajuda | ||
| HP ProBook 430 G6-5TJ89EA WDC PC SN520 SDAPNUW-256G | Lenovo ThinkPad L390-20NR0013GE Samsung SSD PM981 MZVLB256HAHQ | HP ProBook 430 G5-3KX72ES Toshiba XG5 KXG50ZNV512G | HP EliteBook 830 G5-3JX74EA Samsung SSD PM961 1TB M.2 PCIe 3.0 x4 NVMe (MZVLW1T0) | Dell XPS 13 9380 2019 SK hynix PC401 HFS256GD9TNG | Média WDC PC SN520 SDAPNUW-256G | |
|---|---|---|---|---|---|---|
| CrystalDiskMark 5.2 / 6 | 24% | -9% | 22% | -14% | -1% | |
| Write 4K (MB/s) | 101.8 | 99.6 -2% | 111.3 9% | 108.5 7% | 84.6 -17% | 118.5 ? 16% |
| Read 4K (MB/s) | 41.35 | 37.22 -10% | 32.46 -21% | 40.53 -2% | 38.52 -7% | 42 ? 2% |
| Write Seq (MB/s) | 929 | 1432 54% | 526 -43% | 1026 10% | 557 -40% | 1123 ? 21% |
| Read Seq (MB/s) | 1388 | 2072 49% | 1430 3% | 2080 50% | 1393 0% | 1208 ? -13% |
| Write 4K Q32T1 (MB/s) | 453.5 | 439.7 -3% | 516 14% | 451 -1% | 339.5 -25% | 324 ? -29% |
| Read 4K Q32T1 (MB/s) | 286.2 | 264.8 -7% | 366.6 28% | 269.7 -6% | 255.4 -11% | 322 ? 13% |
| Write Seq Q32T1 (MB/s) | 1302 | 1549 19% | 524 -60% | 1770 36% | 558 -57% | 1091 ? -16% |
| Read Seq Q32T1 (MB/s) | 1751 | 3318 89% | 1783 2% | 3214 84% | 2541 45% | 1729 ? -1% |

| 3DMark 11 - 1280x720 Performance GPU | |
| Média da turma Office (2551 - 18313, n=72, últimos 2 anos) | |
| Dell XPS 13 9380 2019 | |
| Média Intel UHD Graphics 620 (1144 - 3432, n=244) | |
| HP EliteBook 830 G5-3JX74EA | |
| Lenovo ThinkPad L390-20NR0013GE | |
| HP ProBook 430 G6-5TJ89EA | |
| HP ProBook 430 G5-3KX72ES | |
| Dell Latitude 7390 | |
| 3DMark | |
| 1280x720 Cloud Gate Standard Graphics | |
| Média da turma Office (11640 - 118515, n=38, últimos 2 anos) | |
| Dell XPS 13 9380 2019 | |
| HP EliteBook 830 G5-3JX74EA | |
| Média Intel UHD Graphics 620 (6205 - 16400, n=225) | |
| HP ProBook 430 G5-3KX72ES | |
| HP ProBook 430 G6-5TJ89EA | |
| Lenovo ThinkPad L390-20NR0013GE | |
| Dell Latitude 7390 | |
| 1920x1080 Fire Strike Graphics | |
| Média da turma Office (736 - 21871, n=75, últimos 2 anos) | |
| HP EliteBook 830 G5-3JX74EA | |
| Média Intel UHD Graphics 620 (557 - 2608, n=213) | |
| HP ProBook 430 G5-3KX72ES | |
| HP ProBook 430 G6-5TJ89EA | |
| Lenovo ThinkPad L390-20NR0013GE | |
| Dell Latitude 7390 | |
| 3DMark 11 Performance | 1851 pontos | |
| 3DMark Cloud Gate Standard Score | 7644 pontos | |
| 3DMark Fire Strike Score | 969 pontos | |
Ajuda | ||
| baixo | média | alto | ultra | |
|---|---|---|---|---|
| BioShock Infinite (2013) | 54.7 | 30.19 | 24.32 | 7.36 |
| The Witcher 3 (2015) | 15.2 | |||
| Dota 2 Reborn (2015) | 63.8 | 38.2 | 18.1 | 16.2 |
| Civilization 6 (2016) | 43.8 | 16 | ||
| X-Plane 11.11 (2018) | 30.3 | 22.7 | 19.1 |
Barulho
| Ocioso |
| 29.4 / 29.4 / 30 dB |
| Carga |
| 32.5 / 32.5 dB |
 | ||
30 dB silencioso 40 dB(A) audível 50 dB(A) ruidosamente alto |
||
min: | ||
(+) A temperatura máxima no lado superior é 38.3 °C / 101 F, em comparação com a média de 34.3 °C / 94 F , variando de 21.2 a 62.5 °C para a classe Office.
(±) A parte inferior aquece até um máximo de 41.1 °C / 106 F, em comparação com a média de 36.8 °C / 98 F
(+) Em uso inativo, a temperatura média para o lado superior é 23.2 °C / 74 F, em comparação com a média do dispositivo de 29.5 °C / ### class_avg_f### F.
(+) Os apoios para as mãos e o touchpad são mais frios que a temperatura da pele, com um máximo de 25.2 °C / 77.4 F e, portanto, são frios ao toque.
(+) A temperatura média da área do apoio para as mãos de dispositivos semelhantes foi 27.6 °C / 81.7 F (+2.4 °C / 4.3 F).
HP ProBook 430 G6-5TJ89EA análise de áudio
(±) | o volume do alto-falante é médio, mas bom (###valor### dB)
Graves 100 - 315Hz
(-) | quase nenhum baixo - em média 19.7% menor que a mediana
(±) | a linearidade dos graves é média (10.2% delta para a frequência anterior)
Médios 400 - 2.000 Hz
(+) | médios equilibrados - apenas 3.1% longe da mediana
(+) | médios são lineares (5.6% delta para frequência anterior)
Altos 2 - 16 kHz
(+) | agudos equilibrados - apenas 3.7% longe da mediana
(+) | os máximos são lineares (6.3% delta da frequência anterior)
Geral 100 - 16.000 Hz
(±) | a linearidade do som geral é média (21.3% diferença em relação à mediana)
Comparado com a mesma classe
» 52% de todos os dispositivos testados nesta classe foram melhores, 9% semelhantes, 39% piores
» O melhor teve um delta de 7%, a média foi 21%, o pior foi 53%
Comparado com todos os dispositivos testados
» 60% de todos os dispositivos testados foram melhores, 7% semelhantes, 33% piores
» O melhor teve um delta de 4%, a média foi 23%, o pior foi 134%
Lenovo ThinkPad L390-20NR0013GE análise de áudio
(±) | o volume do alto-falante é médio, mas bom (###valor### dB)
Graves 100 - 315Hz
(-) | quase nenhum baixo - em média 18.2% menor que a mediana
(±) | a linearidade dos graves é média (11.5% delta para a frequência anterior)
Médios 400 - 2.000 Hz
(+) | médios equilibrados - apenas 2.1% longe da mediana
(+) | médios são lineares (6.3% delta para frequência anterior)
Altos 2 - 16 kHz
(±) | máximos mais altos - em média 7.1% maior que a mediana
(+) | os máximos são lineares (4.2% delta da frequência anterior)
Geral 100 - 16.000 Hz
(±) | a linearidade do som geral é média (22% diferença em relação à mediana)
Comparado com a mesma classe
» 58% de todos os dispositivos testados nesta classe foram melhores, 8% semelhantes, 34% piores
» O melhor teve um delta de 7%, a média foi 21%, o pior foi 53%
Comparado com todos os dispositivos testados
» 64% de todos os dispositivos testados foram melhores, 6% semelhantes, 30% piores
» O melhor teve um delta de 4%, a média foi 23%, o pior foi 134%
HP EliteBook 830 G5-3JX74EA análise de áudio
(+) | os alto-falantes podem tocar relativamente alto (###valor### dB)
Graves 100 - 315Hz
(-) | quase nenhum baixo - em média 19.9% menor que a mediana
(±) | a linearidade dos graves é média (11.3% delta para a frequência anterior)
Médios 400 - 2.000 Hz
(+) | médios equilibrados - apenas 2.3% longe da mediana
(+) | médios são lineares (4.8% delta para frequência anterior)
Altos 2 - 16 kHz
(+) | agudos equilibrados - apenas 4% longe da mediana
(+) | os máximos são lineares (5.6% delta da frequência anterior)
Geral 100 - 16.000 Hz
(±) | a linearidade do som geral é média (17% diferença em relação à mediana)
Comparado com a mesma classe
» 44% de todos os dispositivos testados nesta classe foram melhores, 8% semelhantes, 48% piores
» O melhor teve um delta de 5%, a média foi 18%, o pior foi 53%
Comparado com todos os dispositivos testados
» 31% de todos os dispositivos testados foram melhores, 8% semelhantes, 61% piores
» O melhor teve um delta de 4%, a média foi 23%, o pior foi 134%
| desligado | |
| Ocioso | |
| Carga |
|
Key:
min: | |
| HP ProBook 430 G6-5TJ89EA i5-8265U, UHD Graphics 620, WDC PC SN520 SDAPNUW-256G, IPS LED, 1920x1080, 13.3" | Lenovo ThinkPad L390-20NR0013GE i5-8265U, UHD Graphics 620, Samsung SSD PM981 MZVLB256HAHQ, IPS LED, 1920x1080, 13.3" | HP ProBook 430 G5-3KX72ES i5-8250U, UHD Graphics 620, Toshiba XG5 KXG50ZNV512G, IPS LED, 1920x1080, 13.3" | HP EliteBook 830 G5-3JX74EA i5-8550U, UHD Graphics 620, Samsung SSD PM961 1TB M.2 PCIe 3.0 x4 NVMe (MZVLW1T0), IPS LED, 1920x1080, 13.3" | Dell Latitude 7390 i5-8350U, UHD Graphics 620, SK hynix SC311 M.2, IPS, 1920x1080, 13.3" | Dell XPS 13 9380 2019 i5-8265U, UHD Graphics 620, SK hynix PC401 HFS256GD9TNG, IPS, 3840x2160, 13.3" | Média Intel UHD Graphics 620 | Média da turma Office | |
|---|---|---|---|---|---|---|---|---|
| Power Consumption | -10% | -12% | -19% | -3% | -25% | -8% | -24% | |
| Idle Minimum * (Watt) | 3.5 | 3.8 -9% | 4.5 -29% | 4.5 -29% | 2.34 33% | 4.8 -37% | 3.81 ? -9% | 4.25 ? -21% |
| Idle Average * (Watt) | 5.76 | 6.8 -18% | 6.8 -18% | 6.4 -11% | 5.6 3% | 8.6 -49% | 6.94 ? -20% | 7.3 ? -27% |
| Idle Maximum * (Watt) | 8.3 | 9.8 -18% | 8.8 -6% | 9.2 -11% | 6.5 22% | 10.4 -25% | 8.75 ? -5% | 8.57 ? -3% |
| Load Average * (Watt) | 34.8 | 32.4 7% | 36.8 -6% | 35.7 -3% | 43 -24% | 37.9 -9% | 35 ? -1% | 43.8 ? -26% |
| Load Maximum * (Watt) | 45.7 | 52 -14% | 46.2 -1% | 65.4 -43% | 67.4 -47% | 48.5 -6% | 47.5 ? -4% | 64.5 ? -41% |
* ... menor é melhor
| HP ProBook 430 G6-5TJ89EA i5-8265U, UHD Graphics 620, 45 Wh | Lenovo ThinkPad L390-20NR0013GE i5-8265U, UHD Graphics 620, 45 Wh | HP ProBook 430 G5-3KX72ES i5-8250U, UHD Graphics 620, 48 Wh | HP EliteBook 830 G5-3JX74EA i5-8550U, UHD Graphics 620, 49 Wh | Dell Latitude 7390 i5-8350U, UHD Graphics 620, 60 Wh | Dell XPS 13 9380 2019 i5-8265U, UHD Graphics 620, 52 Wh | Média da turma Office | |
|---|---|---|---|---|---|---|---|
| Duração da bateria | -16% | -26% | -16% | 24% | -2% | 30% | |
| Reader / Idle (h) | 16.2 | 16.2 0% | 12.8 -21% | 27.7 71% | 17.2 6% | 22.2 ? 37% | |
| H.264 (h) | 9.1 | 9.4 3% | 8 -12% | 12.5 37% | 15.4 ? 69% | ||
| WiFi v1.3 (h) | 9.5 | 7 -26% | 7 -26% | 7.1 -25% | 8.3 -13% | 13.2 ? 39% | |
| Load (h) | 2.4 | 1.4 -42% | 2.3 -4% | 1.5 -37% | 2.4 0% | 1.808 ? -25% |
Pro
Contra
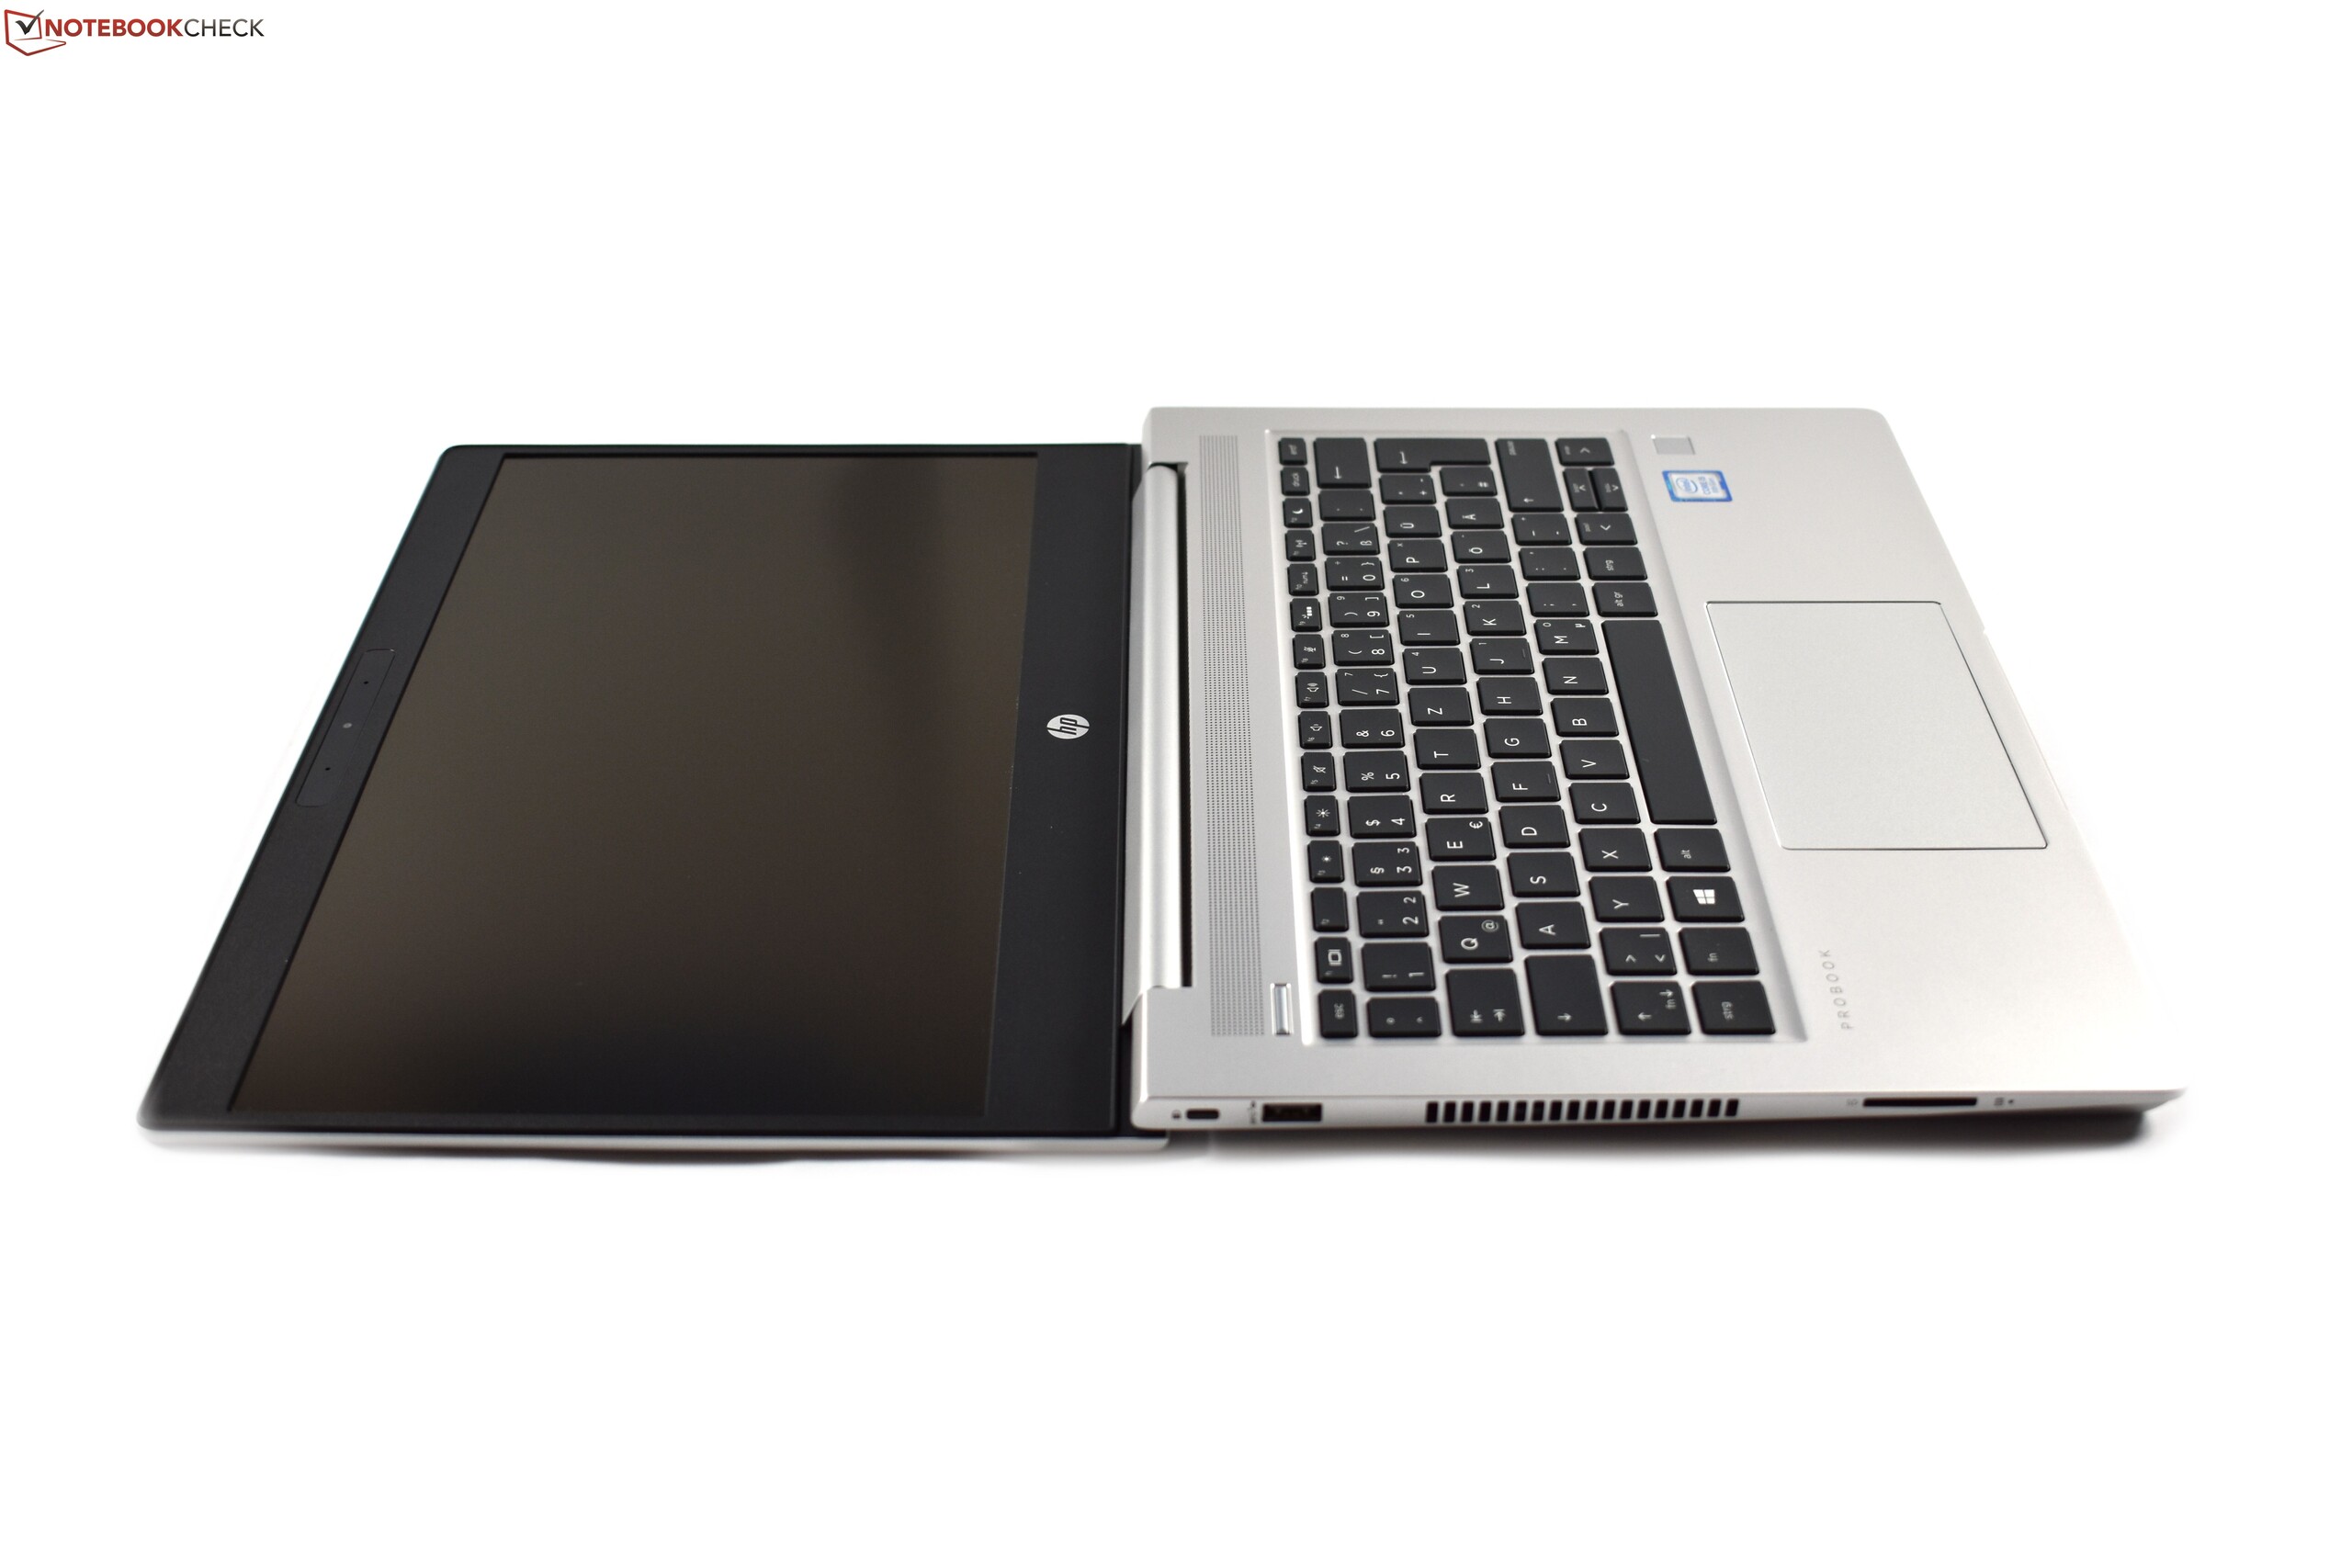
Resumindo, o HP ProBook 430 G6 é um triunfo. Assemelha-se aos seus irmãos EliteBook mais caros, mantendo-se acessível, mas a HP manteve os compromissos ao mínimo, o que é ainda mais impressionante, considerando o abismo de preços entre o ProBook 430 G6 e o EliteBook 830 G5.
O ProBook 430 G6 possui muitos pontos fortes, um destaque destes é sua excelente capacidade de atualização, com sua RAM SSD e baia de 2,5 polegadas substituíveis. O portátil de nível de entrada inclusive supera alguns portáteis maiores e mais caros. Além disso, o ProBook também pode superar a concorrência com seu leitor de cartões SD de tamanho completo, que nem o EliteBook 830 G5 nem o Lenovo ThinkPad L390 oferecem. Nossa unidade de teste também possui excelente duração de bateria graças ao baixo consumo de energia. Outros pontos positivos incluem sua carcaça sólida, seus dispositivos de entrada decentes e suas baixas temperaturas. Além disso, a nova CPU Whiskey Lake supera também seus predecessores Kaby Lake R, que impulsionam o ProBook 430 G5 e o EliteBook 830 G5.
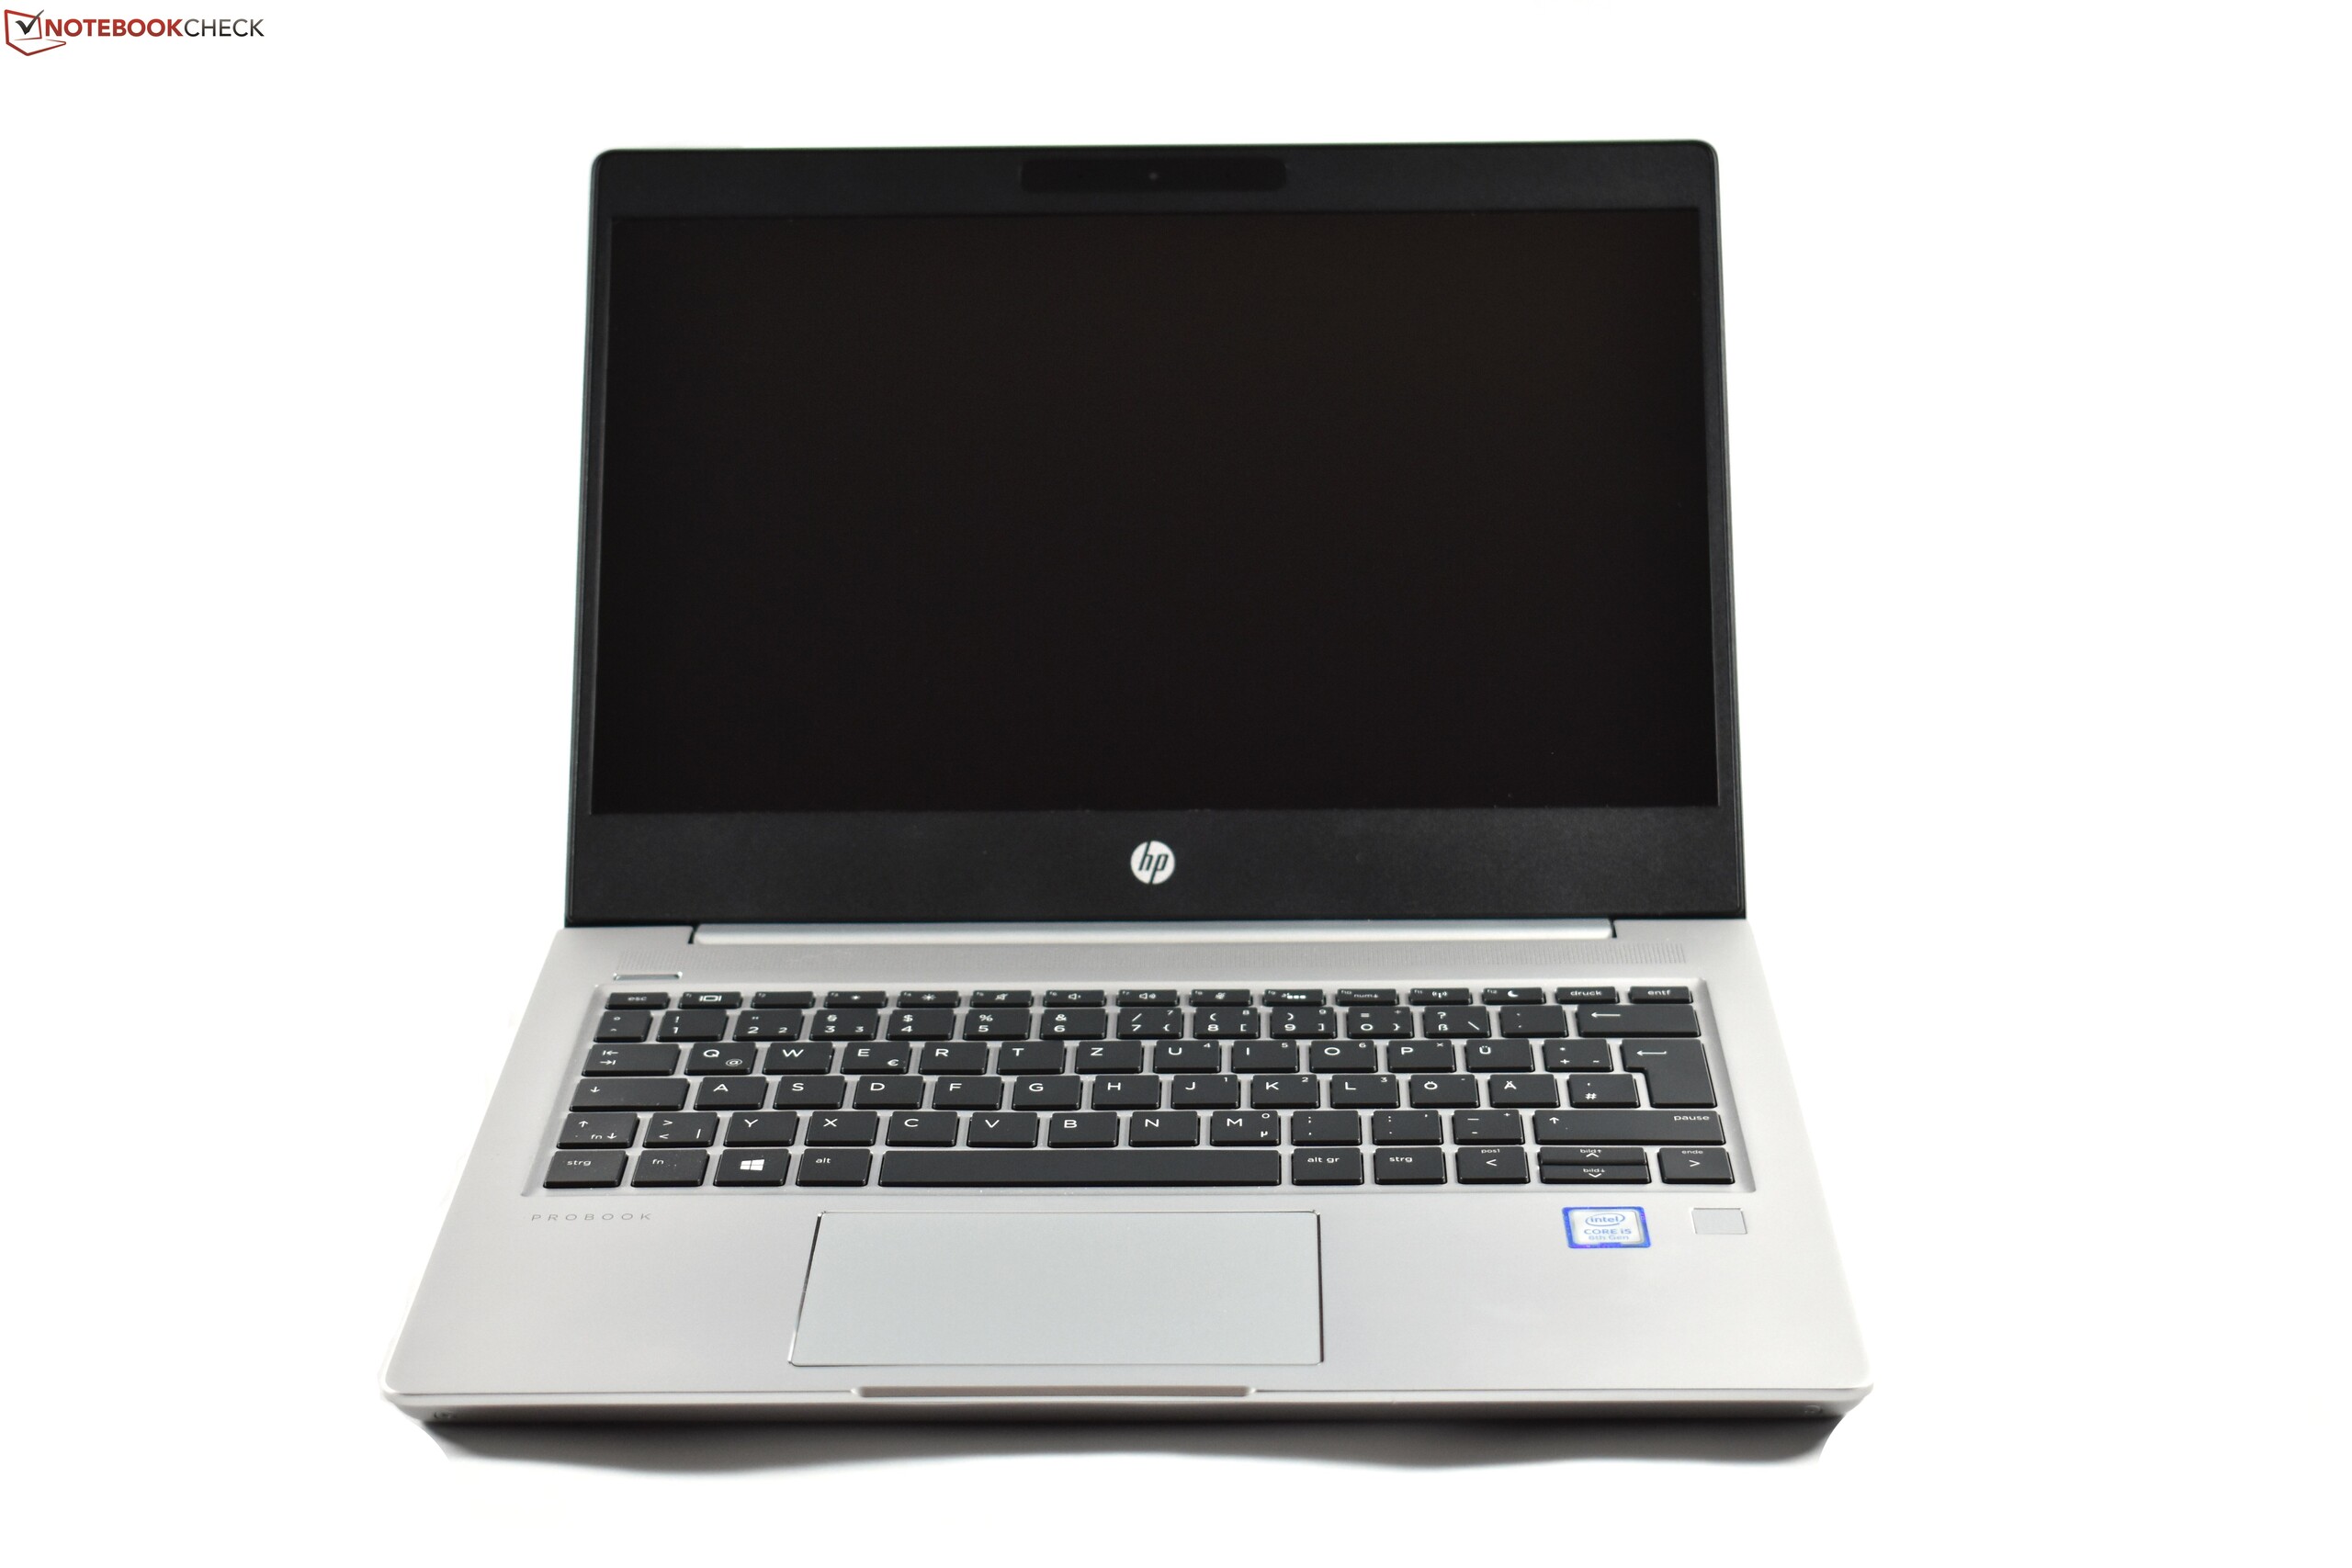
O maior ponto fraco do ProBook 430 G6 é sua tela. O painel IPS é muito escuro para nosso gosto e sua cobertura de espaço de cor é decepcionantemente ruim. A HP também não oferece uma tela melhor, o que é uma pena. Infelizmente, também temos algumas outras queixas menores. A garantia de 1 ano é muito curta para um portátil de negócios e é uma jogada barata da HP, embora teria sido bom que a empresa tivesse pelo menos listado um bastão apontador como uma opção configurável.
Além disso, estão faltando alguns recursos empresariais como um leitor de cartão inteligente. Finalmente, o trackpad na nossa unidade de análise foi mal instalado, mas assumimos que isso é apenas um descuido e não um problema generalizado. Ainda assim, é desanimador.
O HP ProBook 430 G6 é uma excelente opção para estudantes e pequenas empresas. Sua duração de bateria, capacidade de atualização e design leve e robusto nos impressionaram durante nossos testes, mas é prejudicado pela sua tela escura.
O importante é que você deve comprometer uma tela abaixo da média em comparação com concorrentes como o ThinkPad L390, mas o ProBook 430 G6 oferece melhor duração de bateria, capacidade de atualização e temperaturas mais baixas, além de um leitor de cartão SD de tamanho normal. O L390 possui dispositivos de entrada um pouco melhores e uma tela mais brilhante, mas o ProBook é mais abrangente para nós.
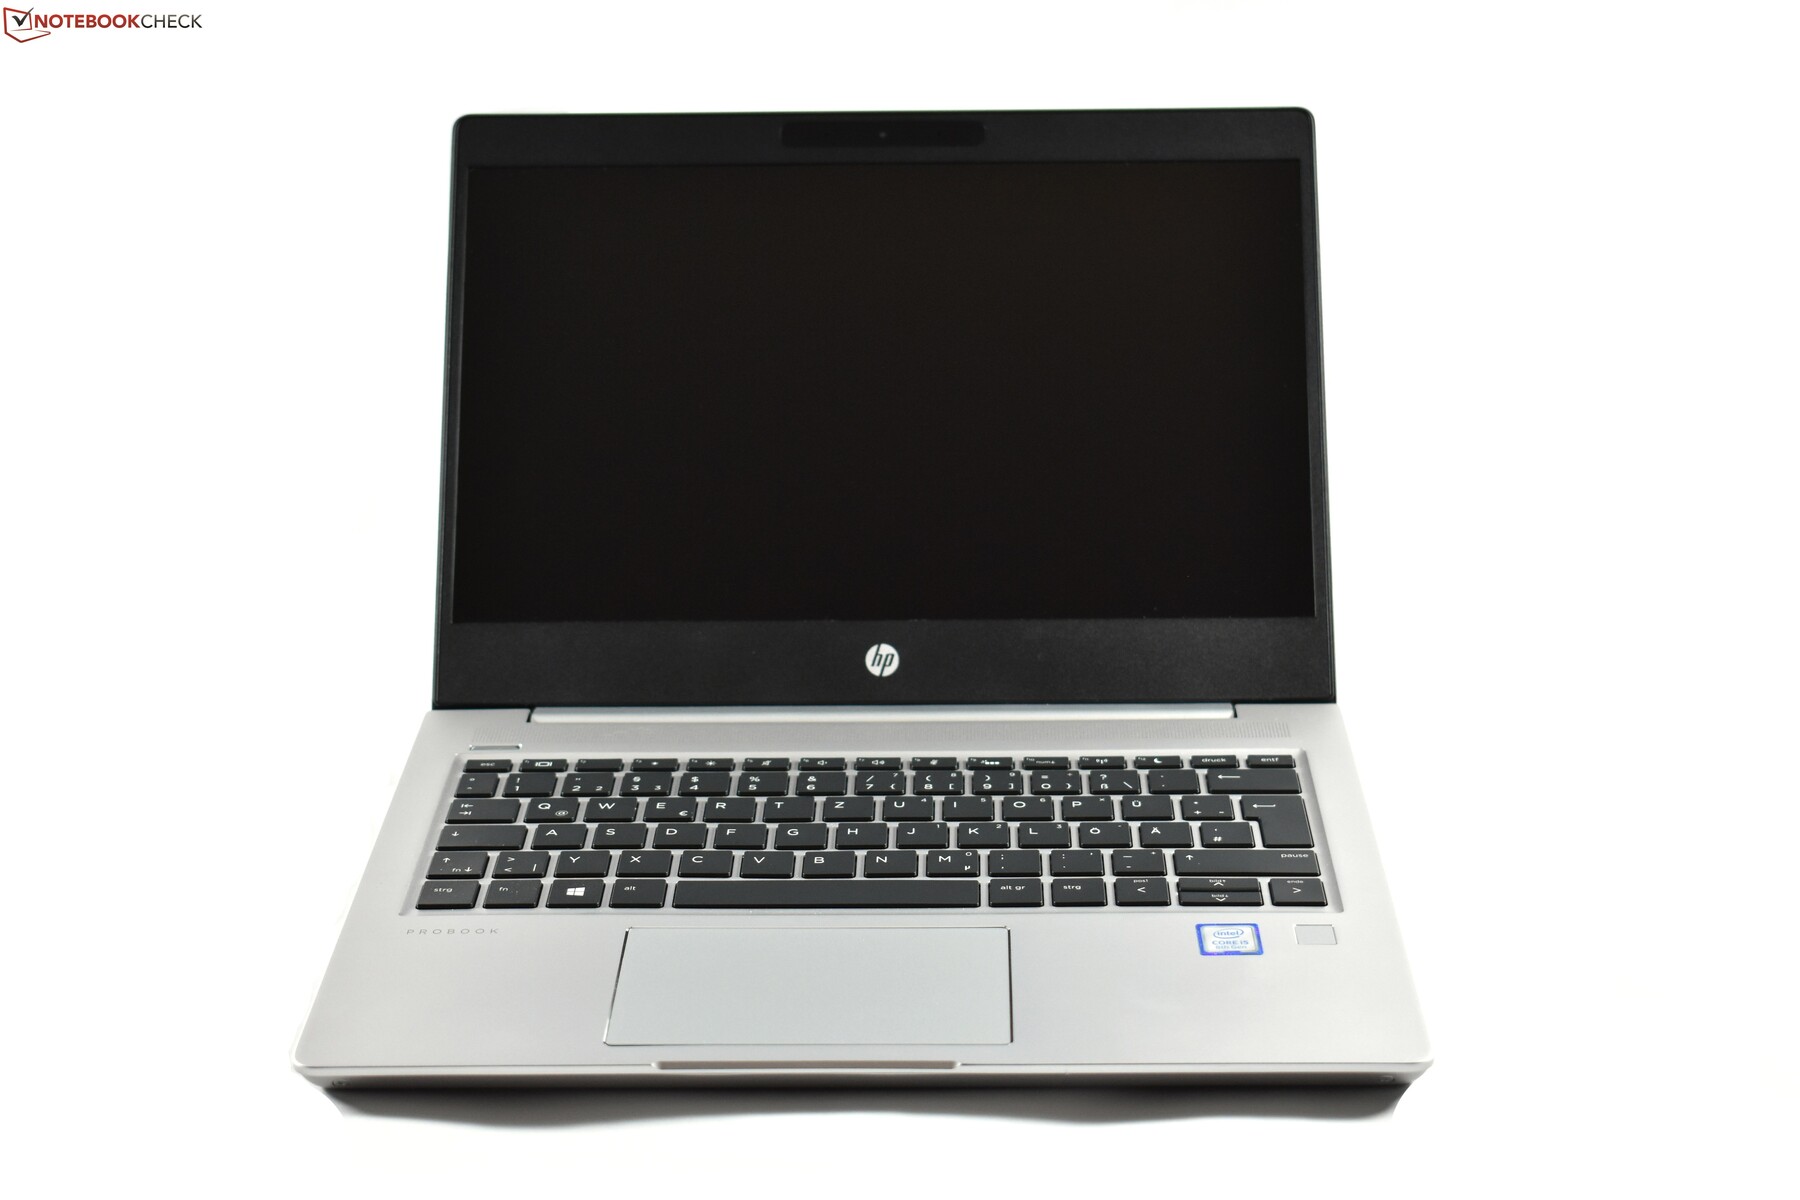
HP ProBook 430 G6-5TJ89EA
- 09/26/2019 v7 (old)
Benjamin Herzig
Price comparison
