Breve Análise do Portátil Lenovo ThinkPad L390 (i5-8265U, FHD)

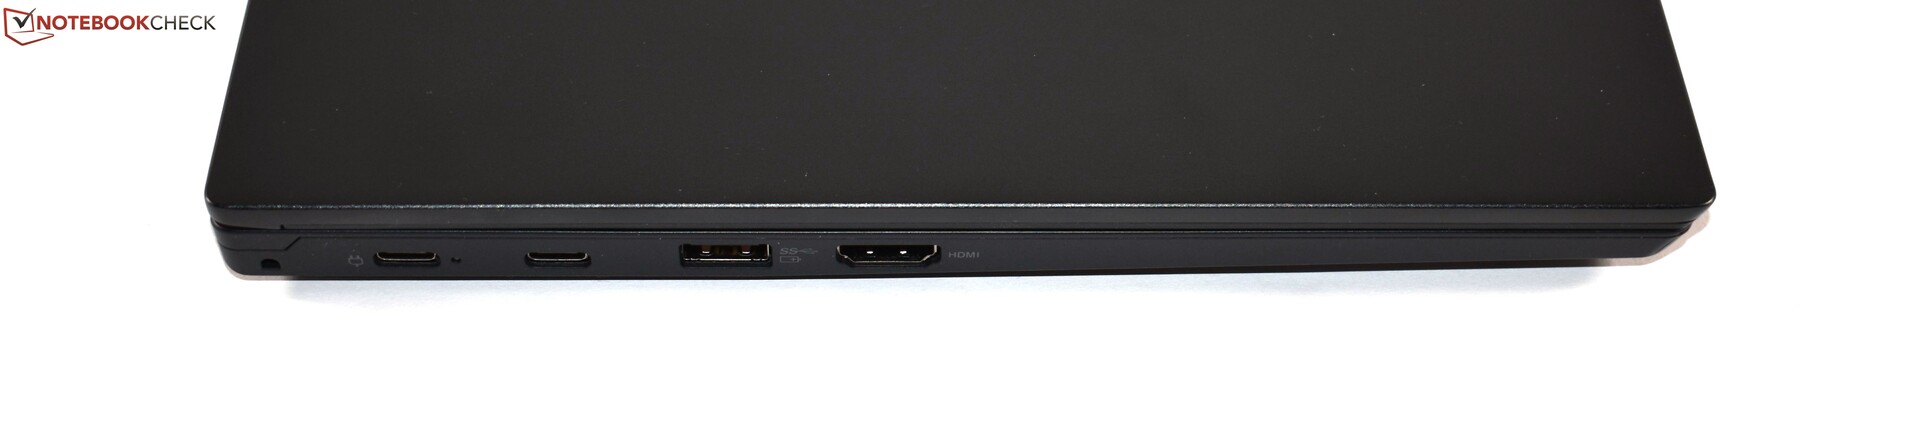
Connectivity
| SD Card Reader | |
| average JPG Copy Test (av. of 3 runs) | |
| Dell XPS 13 9380 2019 (Toshiba Exceria Pro SDXC 64 GB UHS-II) | |
| Dell Latitude 7390 (Toshiba Exceria Pro M501 UHS-II) | |
| HP ProBook 430 G5-3KX72ES (Toshiba Exceria Pro SDXC 64 GB UHS-II) | |
| Lenovo ThinkPad L390-20NR0013GE (Toshiba Exceria Pro M501 UHS-II) | |
| Lenovo ThinkPad L380-20M5000WGE (Toshiba Exceria Pro M501 microSDXC 64GB) | |
| Média da turma Office (19.8 - 198.5, n=22, últimos 2 anos) | |
| maximum AS SSD Seq Read Test (1GB) | |
| Dell Latitude 7390 (Toshiba Exceria Pro M501 UHS-II) | |
| Dell XPS 13 9380 2019 (Toshiba Exceria Pro SDXC 64 GB UHS-II) | |
| HP ProBook 430 G5-3KX72ES (Toshiba Exceria Pro SDXC 64 GB UHS-II) | |
| Lenovo ThinkPad L390-20NR0013GE (Toshiba Exceria Pro M501 UHS-II) | |
| Lenovo ThinkPad L380-20M5000WGE (Toshiba Exceria Pro M501 microSDXC 64GB) | |
| Média da turma Office (27.4 - 249, n=21, últimos 2 anos) | |
| Networking | |
| iperf3 transmit AX12 | |
| Lenovo ThinkPad L380-20M5000WGE | |
| Lenovo ThinkPad L390-20NR0013GE | |
| HP ProBook 430 G5-3KX72ES | |
| Dell XPS 13 9380 2019 | |
| HP EliteBook 830 G5-3JX74EA | |
| iperf3 receive AX12 | |
| Lenovo ThinkPad L390-20NR0013GE | |
| HP ProBook 430 G5-3KX72ES | |
| HP EliteBook 830 G5-3JX74EA | |
| Lenovo ThinkPad L380-20M5000WGE | |
| Dell XPS 13 9380 2019 | |
| |||||||||||||||||||||||||
iluminação: 81 %
iluminação com acumulador: 300 cd/m²
Contraste: 903:1 (Preto: 0.33 cd/m²)
ΔE ColorChecker Calman: 6.5 | ∀{0.5-29.43 Ø4.71}
calibrated: 4.9
ΔE Greyscale Calman: 5.6 | ∀{0.09-98 Ø4.96}
60.1% sRGB (Argyll 1.6.3 3D)
38.4% AdobeRGB 1998 (Argyll 1.6.3 3D)
41.8% AdobeRGB 1998 (Argyll 3D)
60.4% sRGB (Argyll 3D)
40.42% Display P3 (Argyll 3D)
Gamma: 2.08
CCT: 6669 K
| Lenovo ThinkPad L390-20NR0013GE LP133WF2-SPL8, , 1920x1080, 13.3" | HP ProBook 430 G5-3KX72ES LGD052D, , 1920x1080, 13.3" | HP EliteBook 830 G5-3JX74EA IVO M133NVF3-R0, , 1920x1080, 13.3" | Dell Latitude 7390 LGD059B, , 1920x1080, 13.3" | Lenovo ThinkPad L380-20M5000WGE Lenovo LEN4094, , 1920x1080, 13.3" | Dell XPS 13 9370 FHD i5 SHP1484, , 1920x1080, 13.3" | |
|---|---|---|---|---|---|---|
| Display | -0% | 54% | 62% | 0% | 66% | |
| Display P3 Coverage (%) | 40.42 | 40.23 0% | 64.2 59% | 67.8 68% | 40.34 0% | 68.9 70% |
| sRGB Coverage (%) | 60.4 | 60.3 0% | 89.2 48% | 95.1 57% | 60.7 0% | 96.6 60% |
| AdobeRGB 1998 Coverage (%) | 41.8 | 41.59 -1% | 65.2 56% | 67.8 62% | 41.69 0% | 69.6 67% |
| Response Times | 6% | 17% | 7% | 5% | -49% | |
| Response Time Grey 50% / Grey 80% * (ms) | 42.8 ? | 41.6 ? 3% | 36 ? 16% | 36.8 ? 14% | 44 ? -3% | 62.4 ? -46% |
| Response Time Black / White * (ms) | 30 ? | 27.2 ? 9% | 24.8 ? 17% | 30.4 ? -1% | 26 ? 13% | 45.6 ? -52% |
| PWM Frequency (Hz) | 30490 ? | 20490 ? | 1020 ? | 1008 ? | ||
| Screen | 5% | 35% | 34% | 2% | 46% | |
| Brightness middle (cd/m²) | 298 | 262 -12% | 316 6% | 303.8 2% | 271 -9% | 428 44% |
| Brightness (cd/m²) | 278 | 253 -9% | 326 17% | 289 4% | 253 -9% | 405 46% |
| Brightness Distribution (%) | 81 | 82 1% | 85 5% | 86 6% | 89 10% | 87 7% |
| Black Level * (cd/m²) | 0.33 | 0.28 15% | 0.19 42% | 0.31 6% | 0.17 48% | 0.26 21% |
| Contrast (:1) | 903 | 936 4% | 1663 84% | 980 9% | 1594 77% | 1646 82% |
| Colorchecker dE 2000 * | 6.5 | 5.7 12% | 4.5 31% | 2.9 55% | 14.89 -129% | 3.8 42% |
| Colorchecker dE 2000 max. * | 23.9 | 22.4 6% | 12.1 49% | 5.79 76% | 31.08 -30% | 7.2 70% |
| Colorchecker dE 2000 calibrated * | 4.9 | 4.8 2% | 2.9 41% | 1.72 65% | 4.43 10% | |
| Greyscale dE 2000 * | 5.6 | 3.6 36% | 5 11% | 3.7 34% | 2.51 55% | 4.4 21% |
| Gamma | 2.08 106% | 2.15 102% | 2.22 99% | 2.118 104% | 2.14 103% | 2.21 100% |
| CCT | 6669 97% | 7096 92% | 6018 108% | 6323 103% | 6455 101% | 7067 92% |
| Color Space (Percent of AdobeRGB 1998) (%) | 38.4 | 38.3 0% | 57.9 51% | 63 64% | 38 -1% | 62.8 64% |
| Color Space (Percent of sRGB) (%) | 60.1 | 60.1 0% | 87.3 45% | 95 58% | 60 0% | 96.4 60% |
| Média Total (Programa/Configurações) | 4% /
4% | 35% /
36% | 34% /
36% | 2% /
2% | 21% /
37% |
* ... menor é melhor
Exibir tempos de resposta
| ↔ Tempo de resposta preto para branco | ||
|---|---|---|
| 30 ms ... ascensão ↗ e queda ↘ combinadas | ↗ 15.2 ms ascensão | 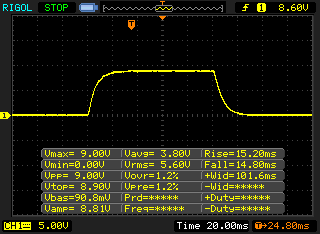 |
| ↘ 14.8 ms queda | ||
| A tela mostra taxas de resposta lentas em nossos testes e será insatisfatória para os jogadores. Em comparação, todos os dispositivos testados variam de 0.1 (mínimo) a 240 (máximo) ms. » 80 % de todos os dispositivos são melhores. Isso significa que o tempo de resposta medido é pior que a média de todos os dispositivos testados (19.8 ms). | ||
| ↔ Tempo de resposta 50% cinza a 80% cinza | ||
| 42.8 ms ... ascensão ↗ e queda ↘ combinadas | ↗ 22.8 ms ascensão | 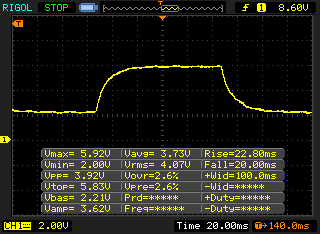 |
| ↘ 20 ms queda | ||
| A tela mostra taxas de resposta lentas em nossos testes e será insatisfatória para os jogadores. Em comparação, todos os dispositivos testados variam de 0.165 (mínimo) a 636 (máximo) ms. » 70 % de todos os dispositivos são melhores. Isso significa que o tempo de resposta medido é pior que a média de todos os dispositivos testados (31 ms). | ||
Cintilação da tela / PWM (modulação por largura de pulso)
| Tela tremeluzindo/PWM detectado | 30490 Hz | ≤ 99 % configuração de brilho | 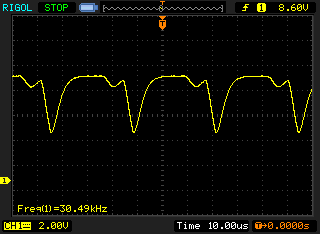 |
A luz de fundo da tela pisca em 30490 Hz (pior caso, por exemplo, utilizando PWM) Cintilação detectada em uma configuração de brilho de 99 % e abaixo. Não deve haver cintilação ou PWM acima desta configuração de brilho. A frequência de 30490 Hz é bastante alta, então a maioria dos usuários sensíveis ao PWM não deve notar nenhuma oscilação. [pwm_comparison] Em comparação: 52 % de todos os dispositivos testados não usam PWM para escurecer a tela. Se PWM foi detectado, uma média de 7754 (mínimo: 5 - máximo: 343500) Hz foi medida. | |||
| PCMark 8 | |
| Home Score Accelerated v2 | |
| Média da turma Office (n=1últimos 2 anos) | |
| HP EliteBook 830 G5-3JX74EA | |
| Dell Latitude 7390 | |
| HP ProBook 430 G5-3KX72ES | |
| Lenovo ThinkPad L380-20M5000WGE | |
| Dell XPS 13 9380 2019 | |
| Média Intel Core i5-8265U, Intel UHD Graphics 620 (2747 - 4244, n=24) | |
| Lenovo ThinkPad L390-20NR0013GE | |
| Work Score Accelerated v2 | |
| Média da turma Office (n=1últimos 2 anos) | |
| Dell Latitude 7390 | |
| HP EliteBook 830 G5-3JX74EA | |
| Lenovo ThinkPad L390-20NR0013GE | |
| HP ProBook 430 G5-3KX72ES | |
| Média Intel Core i5-8265U, Intel UHD Graphics 620 (3132 - 4927, n=23) | |
| Lenovo ThinkPad L380-20M5000WGE | |
| Dell XPS 13 9380 2019 | |
| PCMark 8 Home Score Accelerated v2 | 3378 pontos | |
| PCMark 8 Work Score Accelerated v2 | 4737 pontos | |
| PCMark 10 Score | 3787 pontos | |
Ajuda | ||
| Lenovo ThinkPad L390-20NR0013GE Samsung SSD PM981 MZVLB256HAHQ | HP ProBook 430 G5-3KX72ES Toshiba XG5 KXG50ZNV512G | HP EliteBook 830 G5-3JX74EA Samsung SSD PM961 1TB M.2 PCIe 3.0 x4 NVMe (MZVLW1T0) | Dell Latitude 7390 Samsung PM961 MZVLW256HEHP | Dell XPS 13 9380 2019 SK hynix PC401 HFS256GD9TNG | Lenovo ThinkPad L380-20M5000WGE Samsung PM961 MZVLW256HEHP | Média Samsung SSD PM981 MZVLB256HAHQ | |
|---|---|---|---|---|---|---|---|
| CrystalDiskMark 5.2 / 6 | -19% | 1% | 11% | -28% | 6% | 54% | |
| Write 4K (MB/s) | 99.6 | 111.3 12% | 108.5 9% | 139.4 40% | 84.6 -15% | 121.3 22% | 116.1 ? 17% |
| Read 4K (MB/s) | 37.22 | 32.46 -13% | 40.53 9% | 43.18 16% | 38.52 3% | 41.89 13% | 189.5 ? 409% |
| Write Seq (MB/s) | 1432 | 526 -63% | 1026 -28% | 1075 -25% | 557 -61% | 878 -39% | 1409 ? -2% |
| Read Seq (MB/s) | 2072 | 1430 -31% | 2080 0% | 1639 -21% | 1393 -33% | 1963 -5% | 1624 ? -22% |
| Write 4K Q32T1 (MB/s) | 439.7 | 516 17% | 451 3% | 662 51% | 339.5 -23% | 543 23% | 360 ? -18% |
| Read 4K Q32T1 (MB/s) | 264.8 | 366.6 38% | 269.7 2% | 413.9 56% | 255.4 -4% | 397.7 50% | 396 ? 50% |
| Write Seq Q32T1 (MB/s) | 1549 | 524 -66% | 1770 14% | 1195 -23% | 558 -64% | 1204 -22% | 1492 ? -4% |
| Read Seq Q32T1 (MB/s) | 3318 | 1783 -46% | 3214 -3% | 3116 -6% | 2541 -23% | 3387 2% | 3313 ? 0% |

| 3DMark 11 - 1280x720 Performance GPU | |
| Média da turma Office (2551 - 18313, n=72, últimos 2 anos) | |
| Dell XPS 13 9380 2019 | |
| Média Intel UHD Graphics 620 (1144 - 3432, n=244) | |
| HP EliteBook 830 G5-3JX74EA | |
| Lenovo ThinkPad L390-20NR0013GE | |
| Dell Latitude 7390 | |
| HP ProBook 430 G5-3KX72ES | |
| Lenovo ThinkPad L380-20M5000WGE | |
| 3DMark | |
| 1280x720 Cloud Gate Standard Graphics | |
| Média da turma Office (11640 - 118515, n=38, últimos 2 anos) | |
| Dell XPS 13 9380 2019 | |
| HP EliteBook 830 G5-3JX74EA | |
| Média Intel UHD Graphics 620 (6205 - 16400, n=225) | |
| HP ProBook 430 G5-3KX72ES | |
| Dell Latitude 7390 | |
| Lenovo ThinkPad L390-20NR0013GE | |
| Lenovo ThinkPad L380-20M5000WGE | |
| 1920x1080 Fire Strike Graphics | |
| Média da turma Office (736 - 21871, n=75, últimos 2 anos) | |
| HP EliteBook 830 G5-3JX74EA | |
| Média Intel UHD Graphics 620 (557 - 2608, n=213) | |
| HP ProBook 430 G5-3KX72ES | |
| Lenovo ThinkPad L390-20NR0013GE | |
| Lenovo ThinkPad L380-20M5000WGE | |
| Dell Latitude 7390 | |
| 3DMark 11 Performance | 1863 pontos | |
| 3DMark Cloud Gate Standard Score | 7458 pontos | |
| 3DMark Fire Strike Score | 934 pontos | |
Ajuda | ||
| baixo | média | alto | ultra | |
|---|---|---|---|---|
| BioShock Infinite (2013) | 54.7 | 28.33 | 23.19 | |
| The Witcher 3 (2015) | 14.7 | |||
| Rise of the Tomb Raider (2016) | 20.1 |
Barulho
| Ocioso |
| 29.5 / 29.5 / 29.5 dB |
| Carga |
| 30.6 / 31.5 dB |
 | ||
30 dB silencioso 40 dB(A) audível 50 dB(A) ruidosamente alto |
||
min: | ||
(-) A temperatura máxima no lado superior é 47.5 °C / 118 F, em comparação com a média de 34.3 °C / 94 F , variando de 21.2 a 62.5 °C para a classe Office.
(-) A parte inferior aquece até um máximo de 51.3 °C / 124 F, em comparação com a média de 36.8 °C / 98 F
(+) Em uso inativo, a temperatura média para o lado superior é 24 °C / 75 F, em comparação com a média do dispositivo de 29.5 °C / ### class_avg_f### F.
(+) Os apoios para as mãos e o touchpad são mais frios que a temperatura da pele, com um máximo de 25.1 °C / 77.2 F e, portanto, são frios ao toque.
(+) A temperatura média da área do apoio para as mãos de dispositivos semelhantes foi 27.5 °C / 81.5 F (+2.4 °C / 4.3 F).
Lenovo ThinkPad L390-20NR0013GE análise de áudio
(±) | o volume do alto-falante é médio, mas bom (###valor### dB)
Graves 100 - 315Hz
(-) | quase nenhum baixo - em média 18.2% menor que a mediana
(±) | a linearidade dos graves é média (11.5% delta para a frequência anterior)
Médios 400 - 2.000 Hz
(+) | médios equilibrados - apenas 2.1% longe da mediana
(+) | médios são lineares (6.3% delta para frequência anterior)
Altos 2 - 16 kHz
(±) | máximos mais altos - em média 7.1% maior que a mediana
(+) | os máximos são lineares (4.2% delta da frequência anterior)
Geral 100 - 16.000 Hz
(±) | a linearidade do som geral é média (22% diferença em relação à mediana)
Comparado com a mesma classe
» 58% de todos os dispositivos testados nesta classe foram melhores, 8% semelhantes, 34% piores
» O melhor teve um delta de 7%, a média foi 21%, o pior foi 53%
Comparado com todos os dispositivos testados
» 64% de todos os dispositivos testados foram melhores, 6% semelhantes, 30% piores
» O melhor teve um delta de 4%, a média foi 23%, o pior foi 134%
HP EliteBook 830 G5-3JX74EA análise de áudio
(+) | os alto-falantes podem tocar relativamente alto (###valor### dB)
Graves 100 - 315Hz
(-) | quase nenhum baixo - em média 19.9% menor que a mediana
(±) | a linearidade dos graves é média (11.3% delta para a frequência anterior)
Médios 400 - 2.000 Hz
(+) | médios equilibrados - apenas 2.3% longe da mediana
(+) | médios são lineares (4.8% delta para frequência anterior)
Altos 2 - 16 kHz
(+) | agudos equilibrados - apenas 4% longe da mediana
(+) | os máximos são lineares (5.6% delta da frequência anterior)
Geral 100 - 16.000 Hz
(±) | a linearidade do som geral é média (17% diferença em relação à mediana)
Comparado com a mesma classe
» 44% de todos os dispositivos testados nesta classe foram melhores, 8% semelhantes, 49% piores
» O melhor teve um delta de 5%, a média foi 18%, o pior foi 53%
Comparado com todos os dispositivos testados
» 31% de todos os dispositivos testados foram melhores, 8% semelhantes, 61% piores
» O melhor teve um delta de 4%, a média foi 23%, o pior foi 134%
| desligado | |
| Ocioso | |
| Carga |
|
Key:
min: | |
| Lenovo ThinkPad L390-20NR0013GE i5-8265U, UHD Graphics 620, Samsung SSD PM981 MZVLB256HAHQ, IPS LED, 1920x1080, 13.3" | HP ProBook 430 G5-3KX72ES i5-8250U, UHD Graphics 620, Toshiba XG5 KXG50ZNV512G, IPS LED, 1920x1080, 13.3" | HP EliteBook 830 G5-3JX74EA i5-8550U, UHD Graphics 620, Samsung SSD PM961 1TB M.2 PCIe 3.0 x4 NVMe (MZVLW1T0), IPS LED, 1920x1080, 13.3" | Dell Latitude 7390 i7-8650U, UHD Graphics 620, Samsung PM961 MZVLW256HEHP, IPS, 1920x1080, 13.3" | Dell XPS 13 9380 2019 i5-8265U, UHD Graphics 620, SK hynix PC401 HFS256GD9TNG, IPS, 3840x2160, 13.3" | Lenovo ThinkPad L380-20M5000WGE i5-8250U, UHD Graphics 620, Samsung PM961 MZVLW256HEHP, IPS, 1920x1080, 13.3" | Média Intel UHD Graphics 620 | Média da turma Office | |
|---|---|---|---|---|---|---|---|---|
| Power Consumption | -2% | -8% | 9% | -14% | 20% | 2% | -13% | |
| Idle Minimum * (Watt) | 3.8 | 4.5 -18% | 4.5 -18% | 3.3 13% | 4.8 -26% | 2.7 29% | 3.81 ? -0% | 4.26 ? -12% |
| Idle Average * (Watt) | 6.8 | 6.8 -0% | 6.4 6% | 5.9 13% | 8.6 -26% | 5.6 18% | 6.94 ? -2% | 7.31 ? -8% |
| Idle Maximum * (Watt) | 9.8 | 8.8 10% | 9.2 6% | 6.2 37% | 10.4 -6% | 9.2 6% | 8.75 ? 11% | 8.55 ? 13% |
| Load Average * (Watt) | 32.4 | 36.8 -14% | 35.7 -10% | 43.2 -33% | 37.9 -17% | 30 7% | 35 ? -8% | 43.8 ? -35% |
| Load Maximum * (Watt) | 52 | 46.2 11% | 65.4 -26% | 45.2 13% | 48.5 7% | 30.4 42% | 47.5 ? 9% | 64.5 ? -24% |
* ... menor é melhor
| Lenovo ThinkPad L390-20NR0013GE i5-8265U, UHD Graphics 620, 45 Wh | HP ProBook 430 G5-3KX72ES i5-8250U, UHD Graphics 620, 48 Wh | HP EliteBook 830 G5-3JX74EA i5-8550U, UHD Graphics 620, 49 Wh | Dell Latitude 7390 i7-8650U, UHD Graphics 620, 60 Wh | Dell XPS 13 9380 2019 i5-8265U, UHD Graphics 620, 52 Wh | Lenovo ThinkPad L380-20M5000WGE i5-8250U, UHD Graphics 620, 45 Wh | Média da turma Office | |
|---|---|---|---|---|---|---|---|
| Duração da bateria | 0% | 7% | 59% | 32% | 42% | 59% | |
| Reader / Idle (h) | 16.2 | 12.8 -21% | 17.2 6% | 18.8 16% | 24.5 ? 51% | ||
| H.264 (h) | 9.4 | 8 -15% | 15.5 ? 65% | ||||
| WiFi v1.3 (h) | 7 | 7 0% | 7.1 1% | 11.1 59% | 8.3 19% | 11.6 66% | 13.2 ? 89% |
| Load (h) | 1.4 | 2.3 64% | 2.4 71% | 2 43% | 1.808 ? 29% |
Pro
Contra
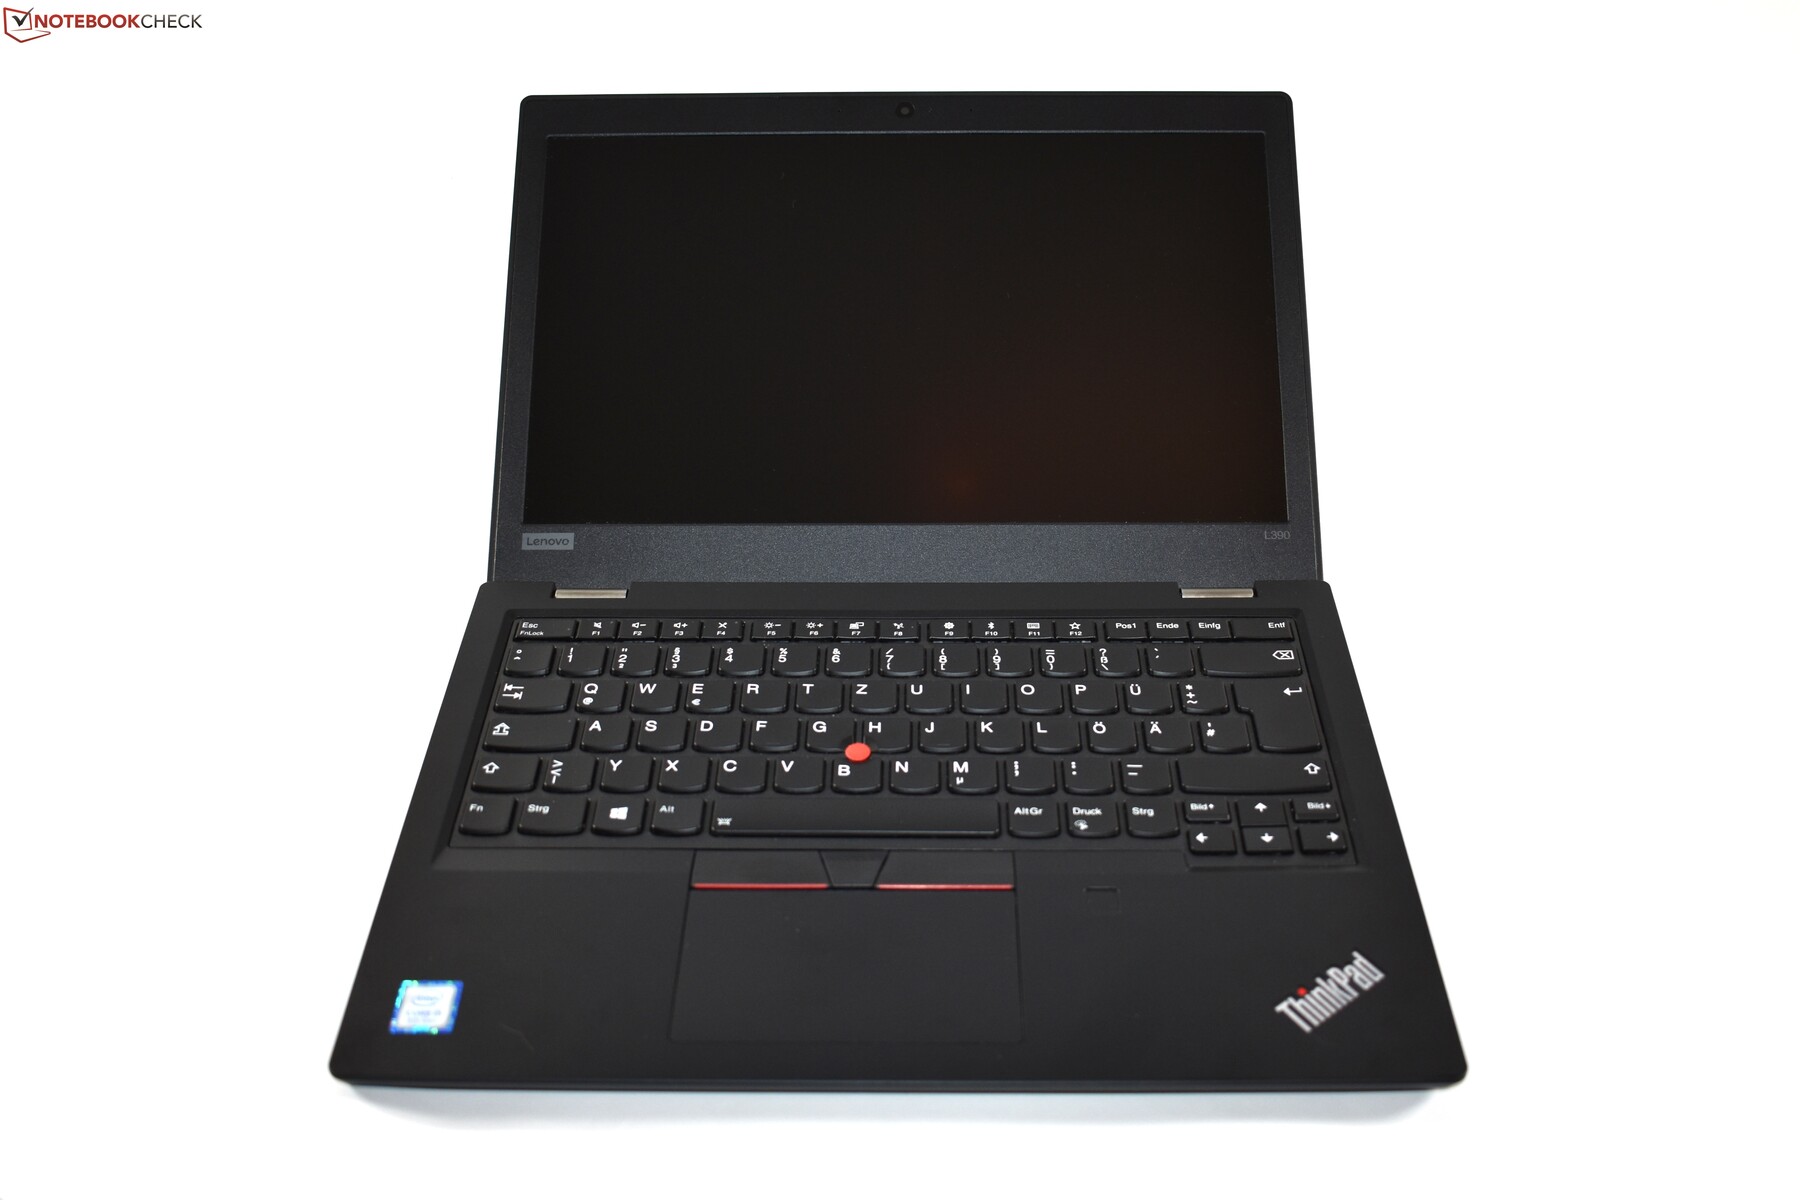
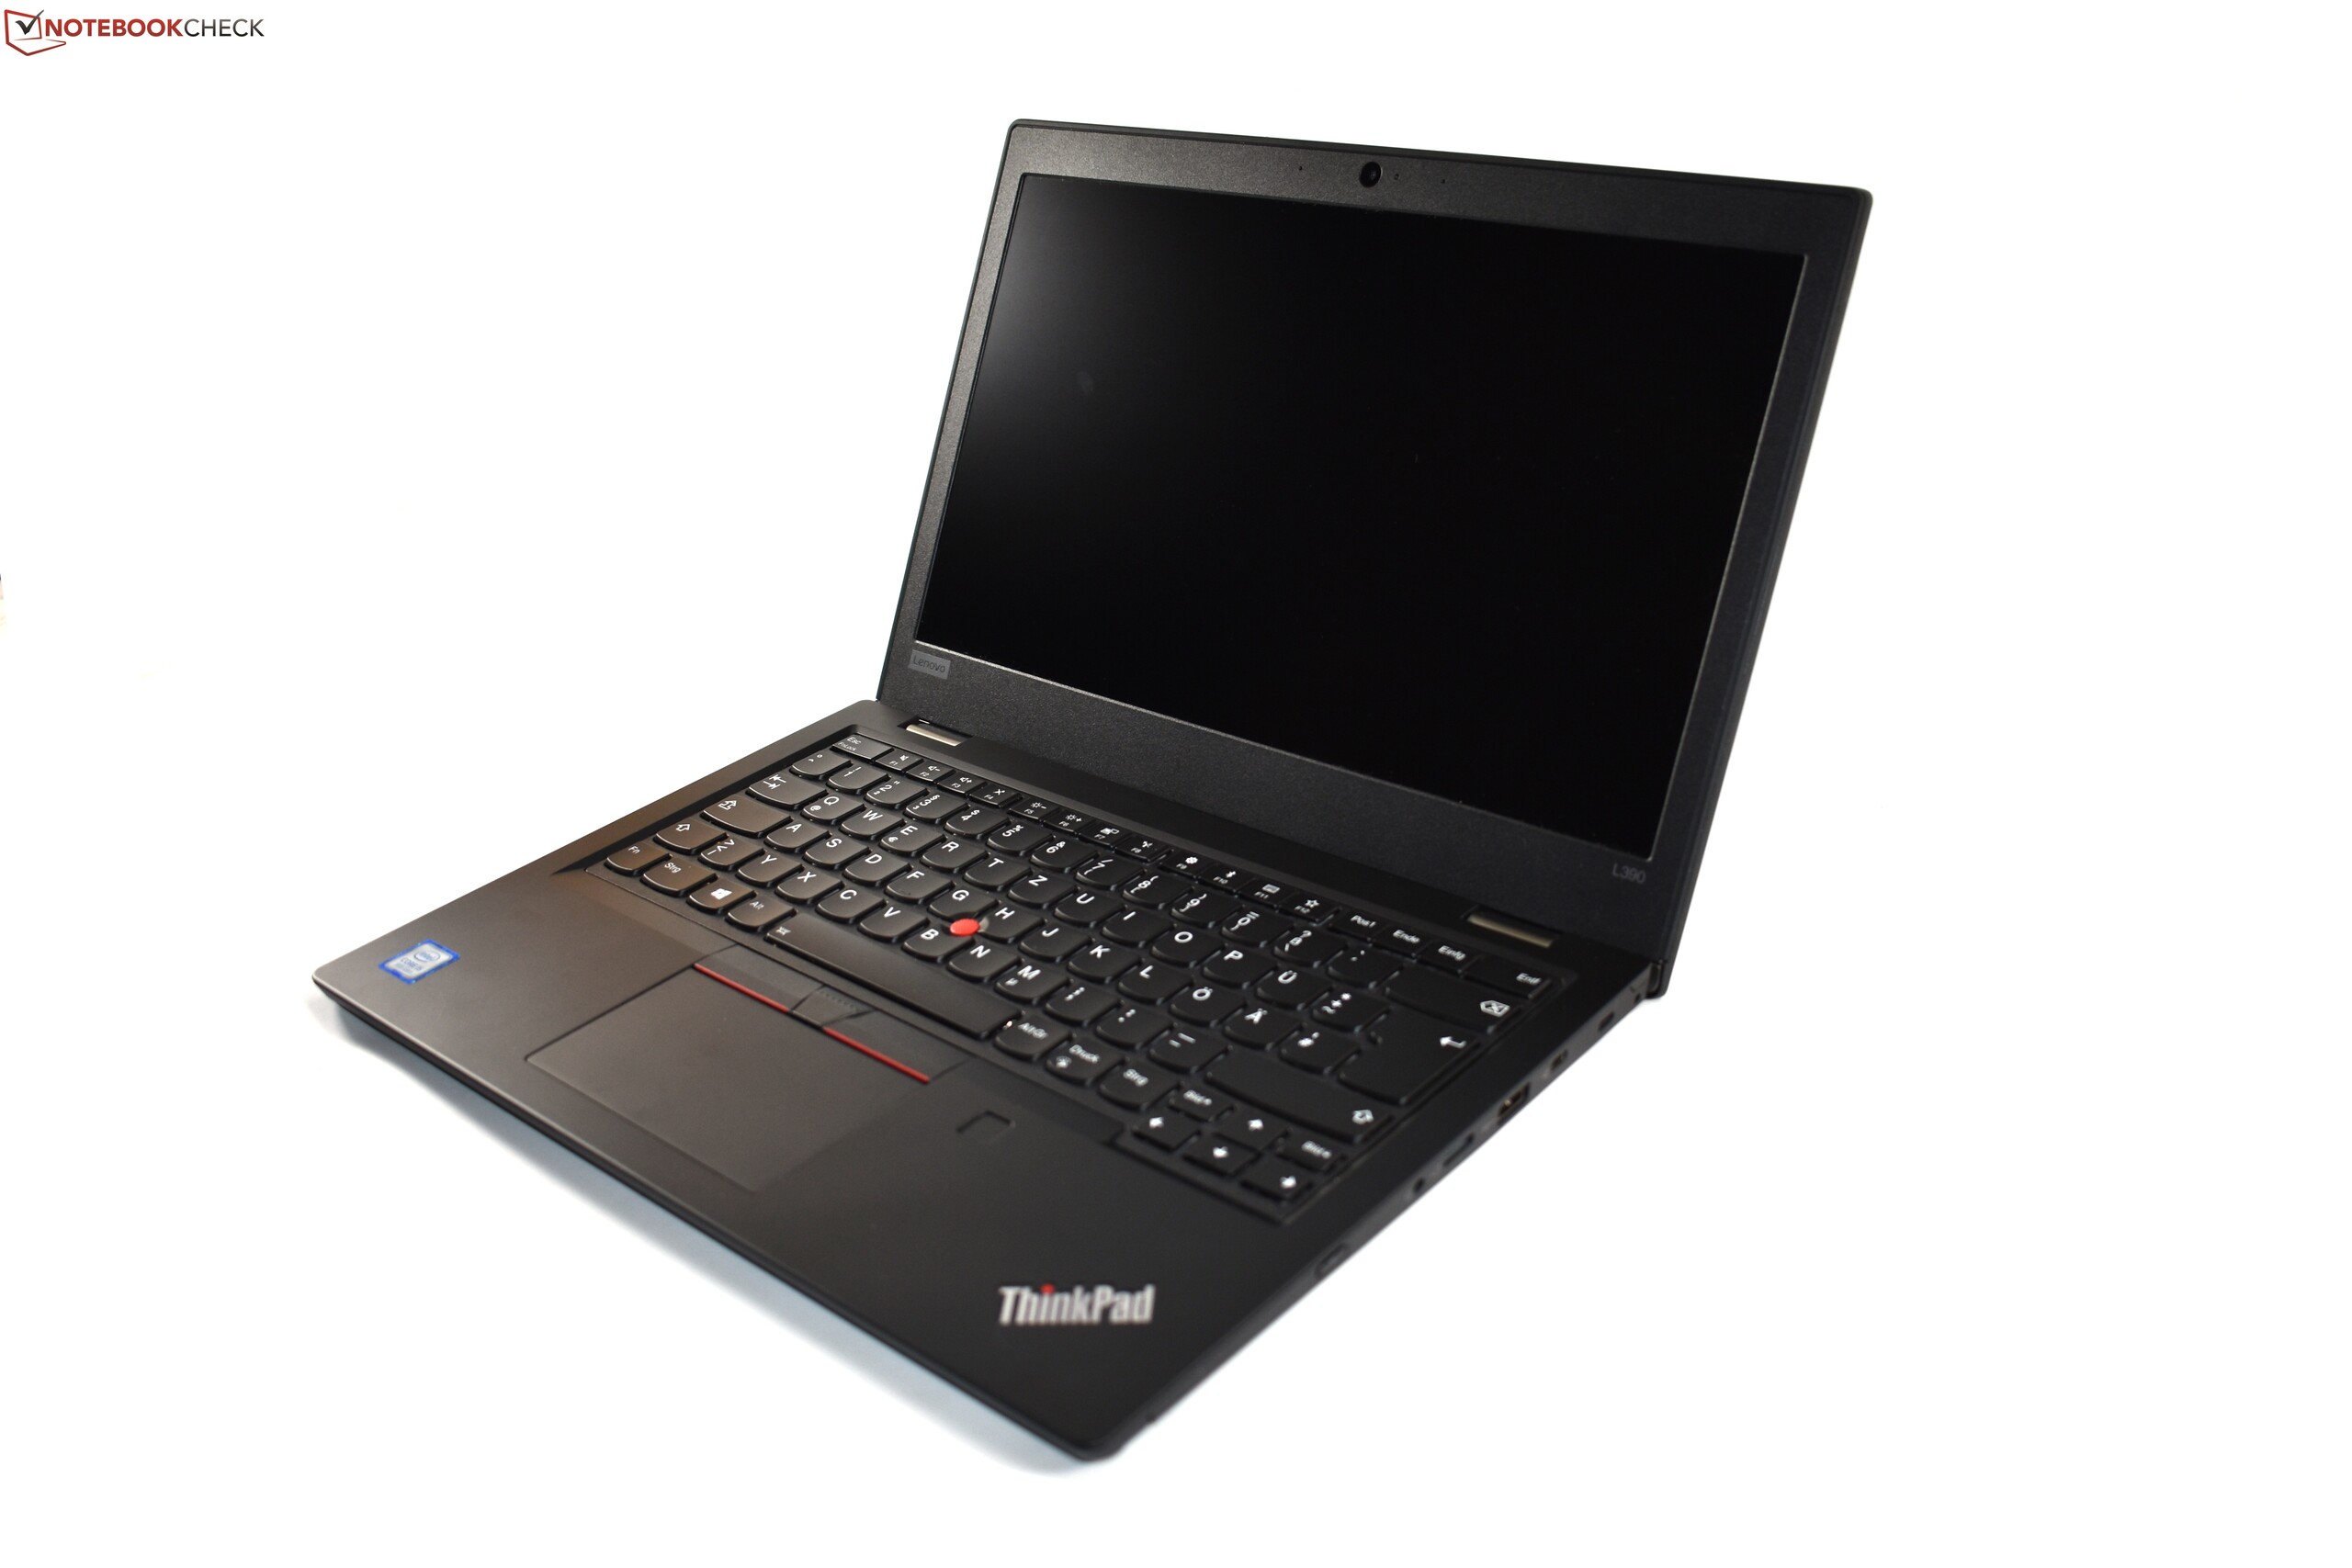
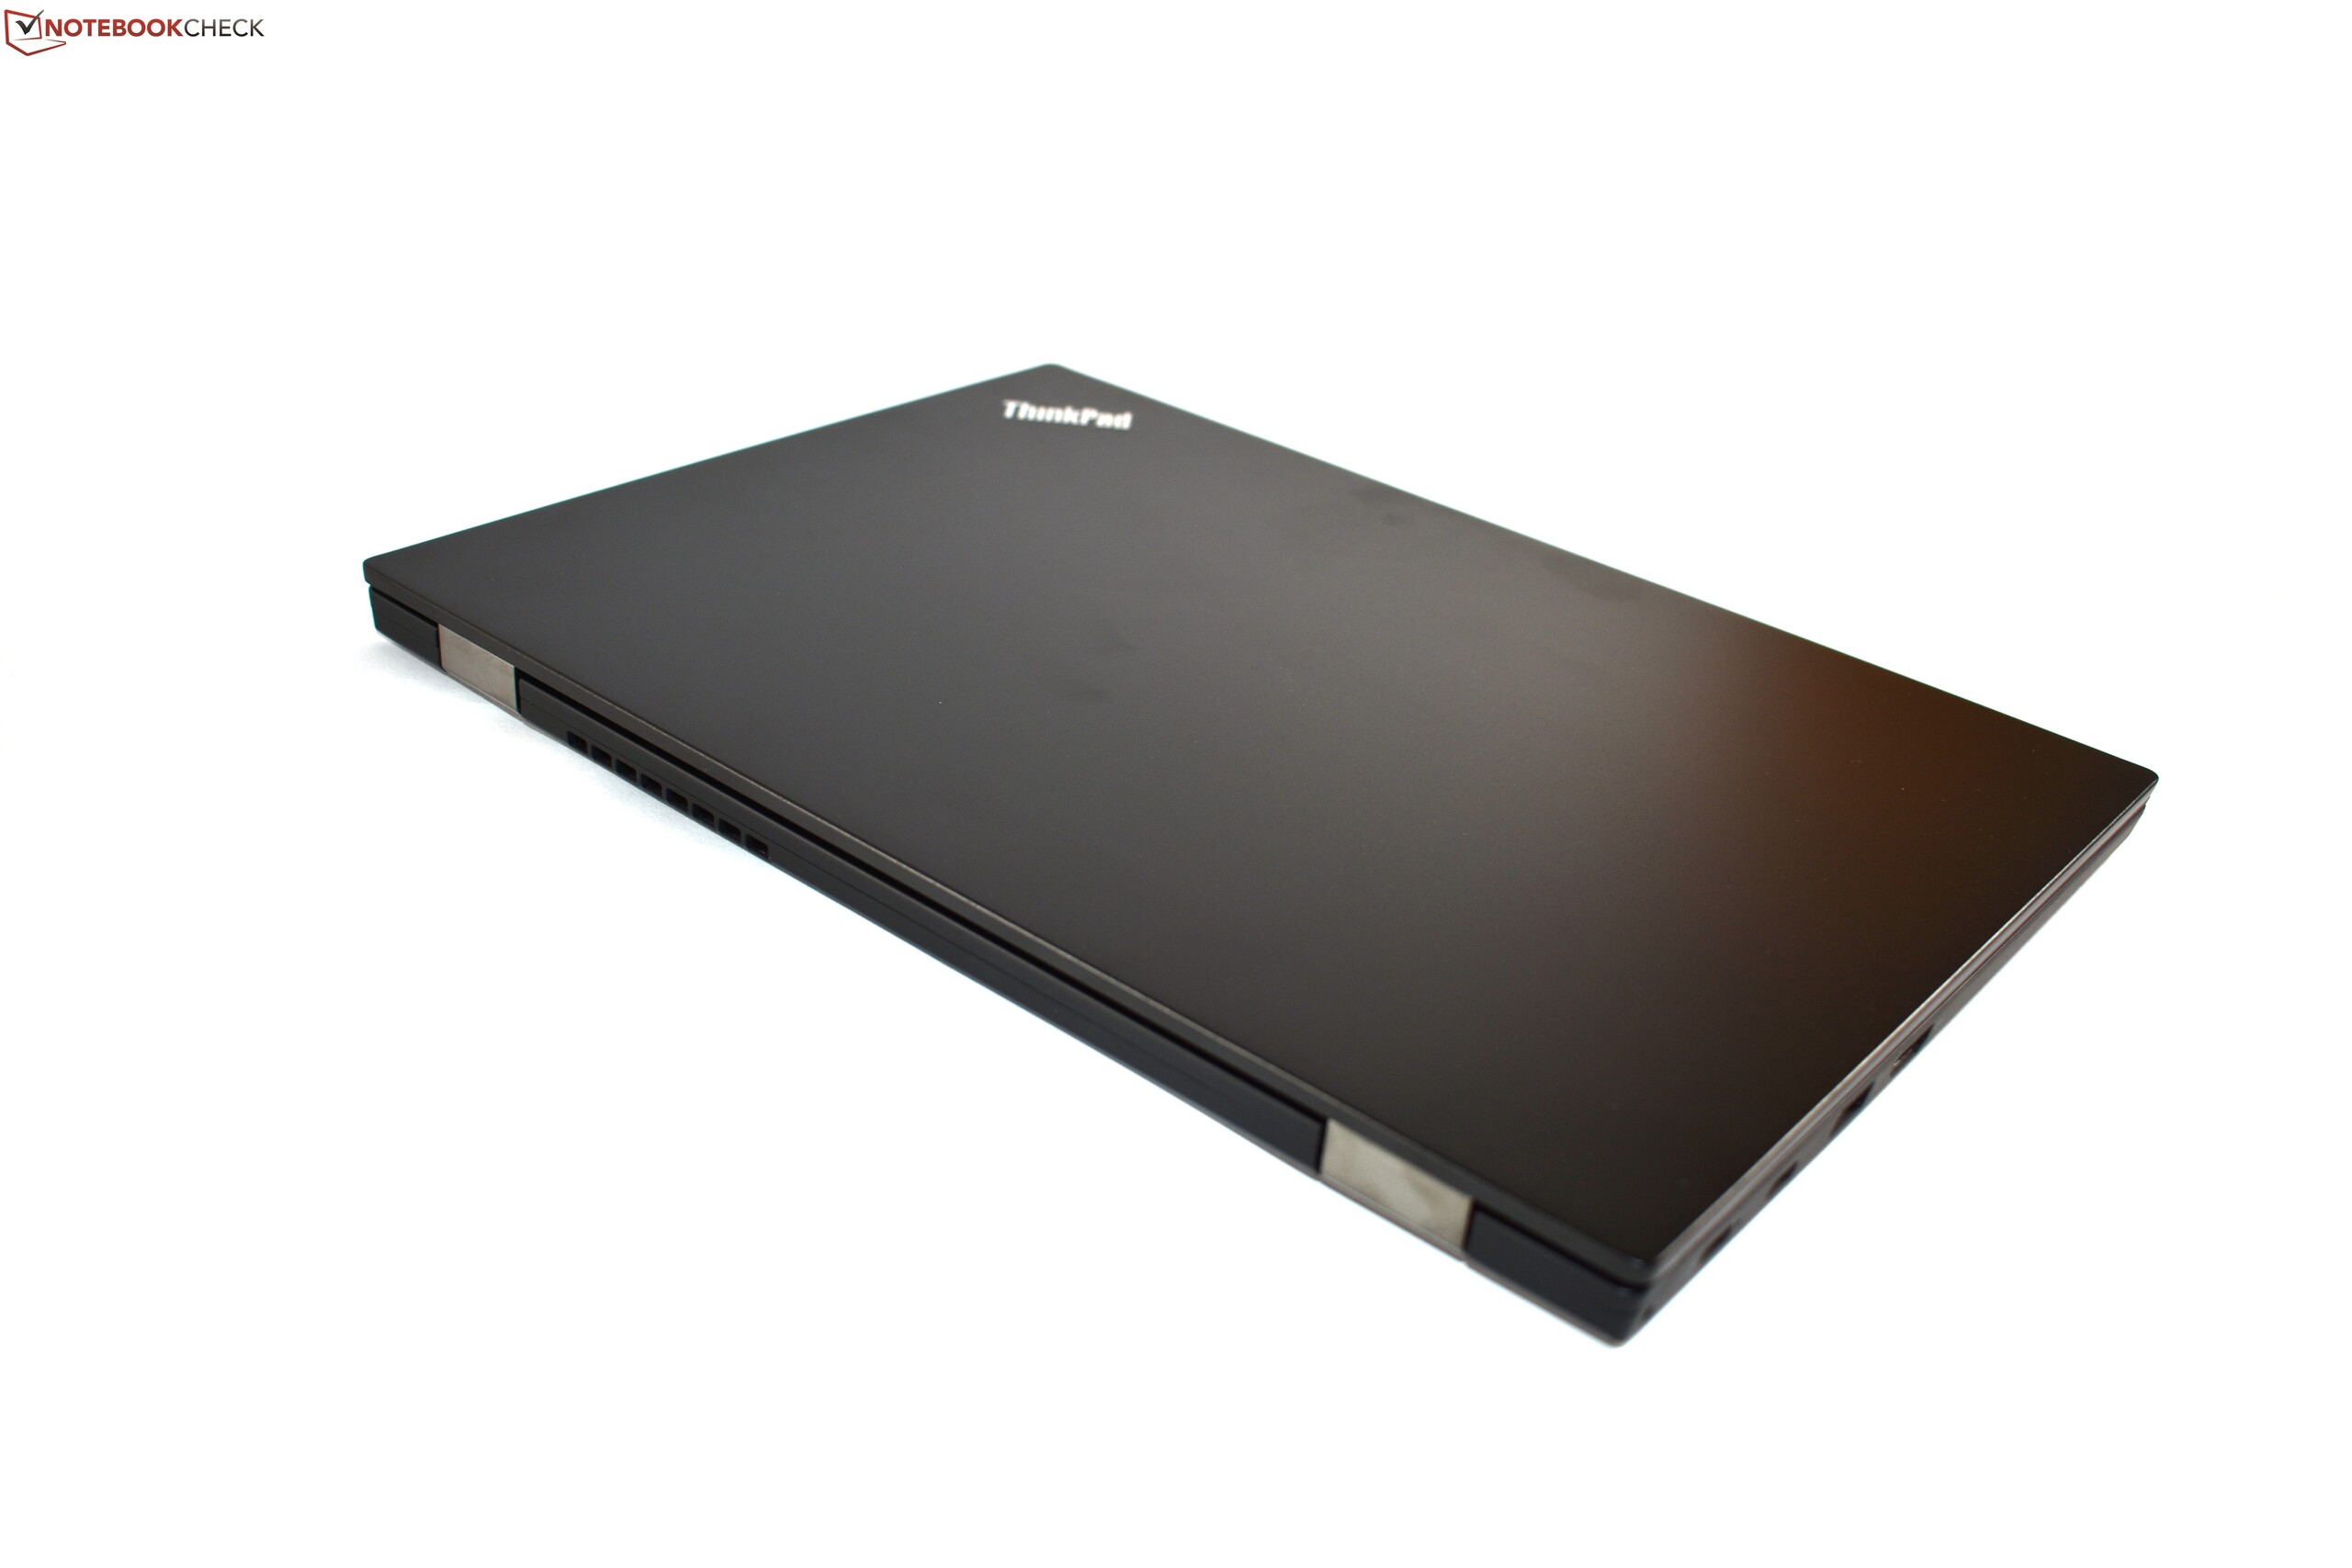
O Lenovo ThinkPad L390 é uma atualização direta do anterior ThinkPad L380. Enquanto o modelo mais novo embala uma nova plataforma no interior, o exterior permanece completamente inalterado.
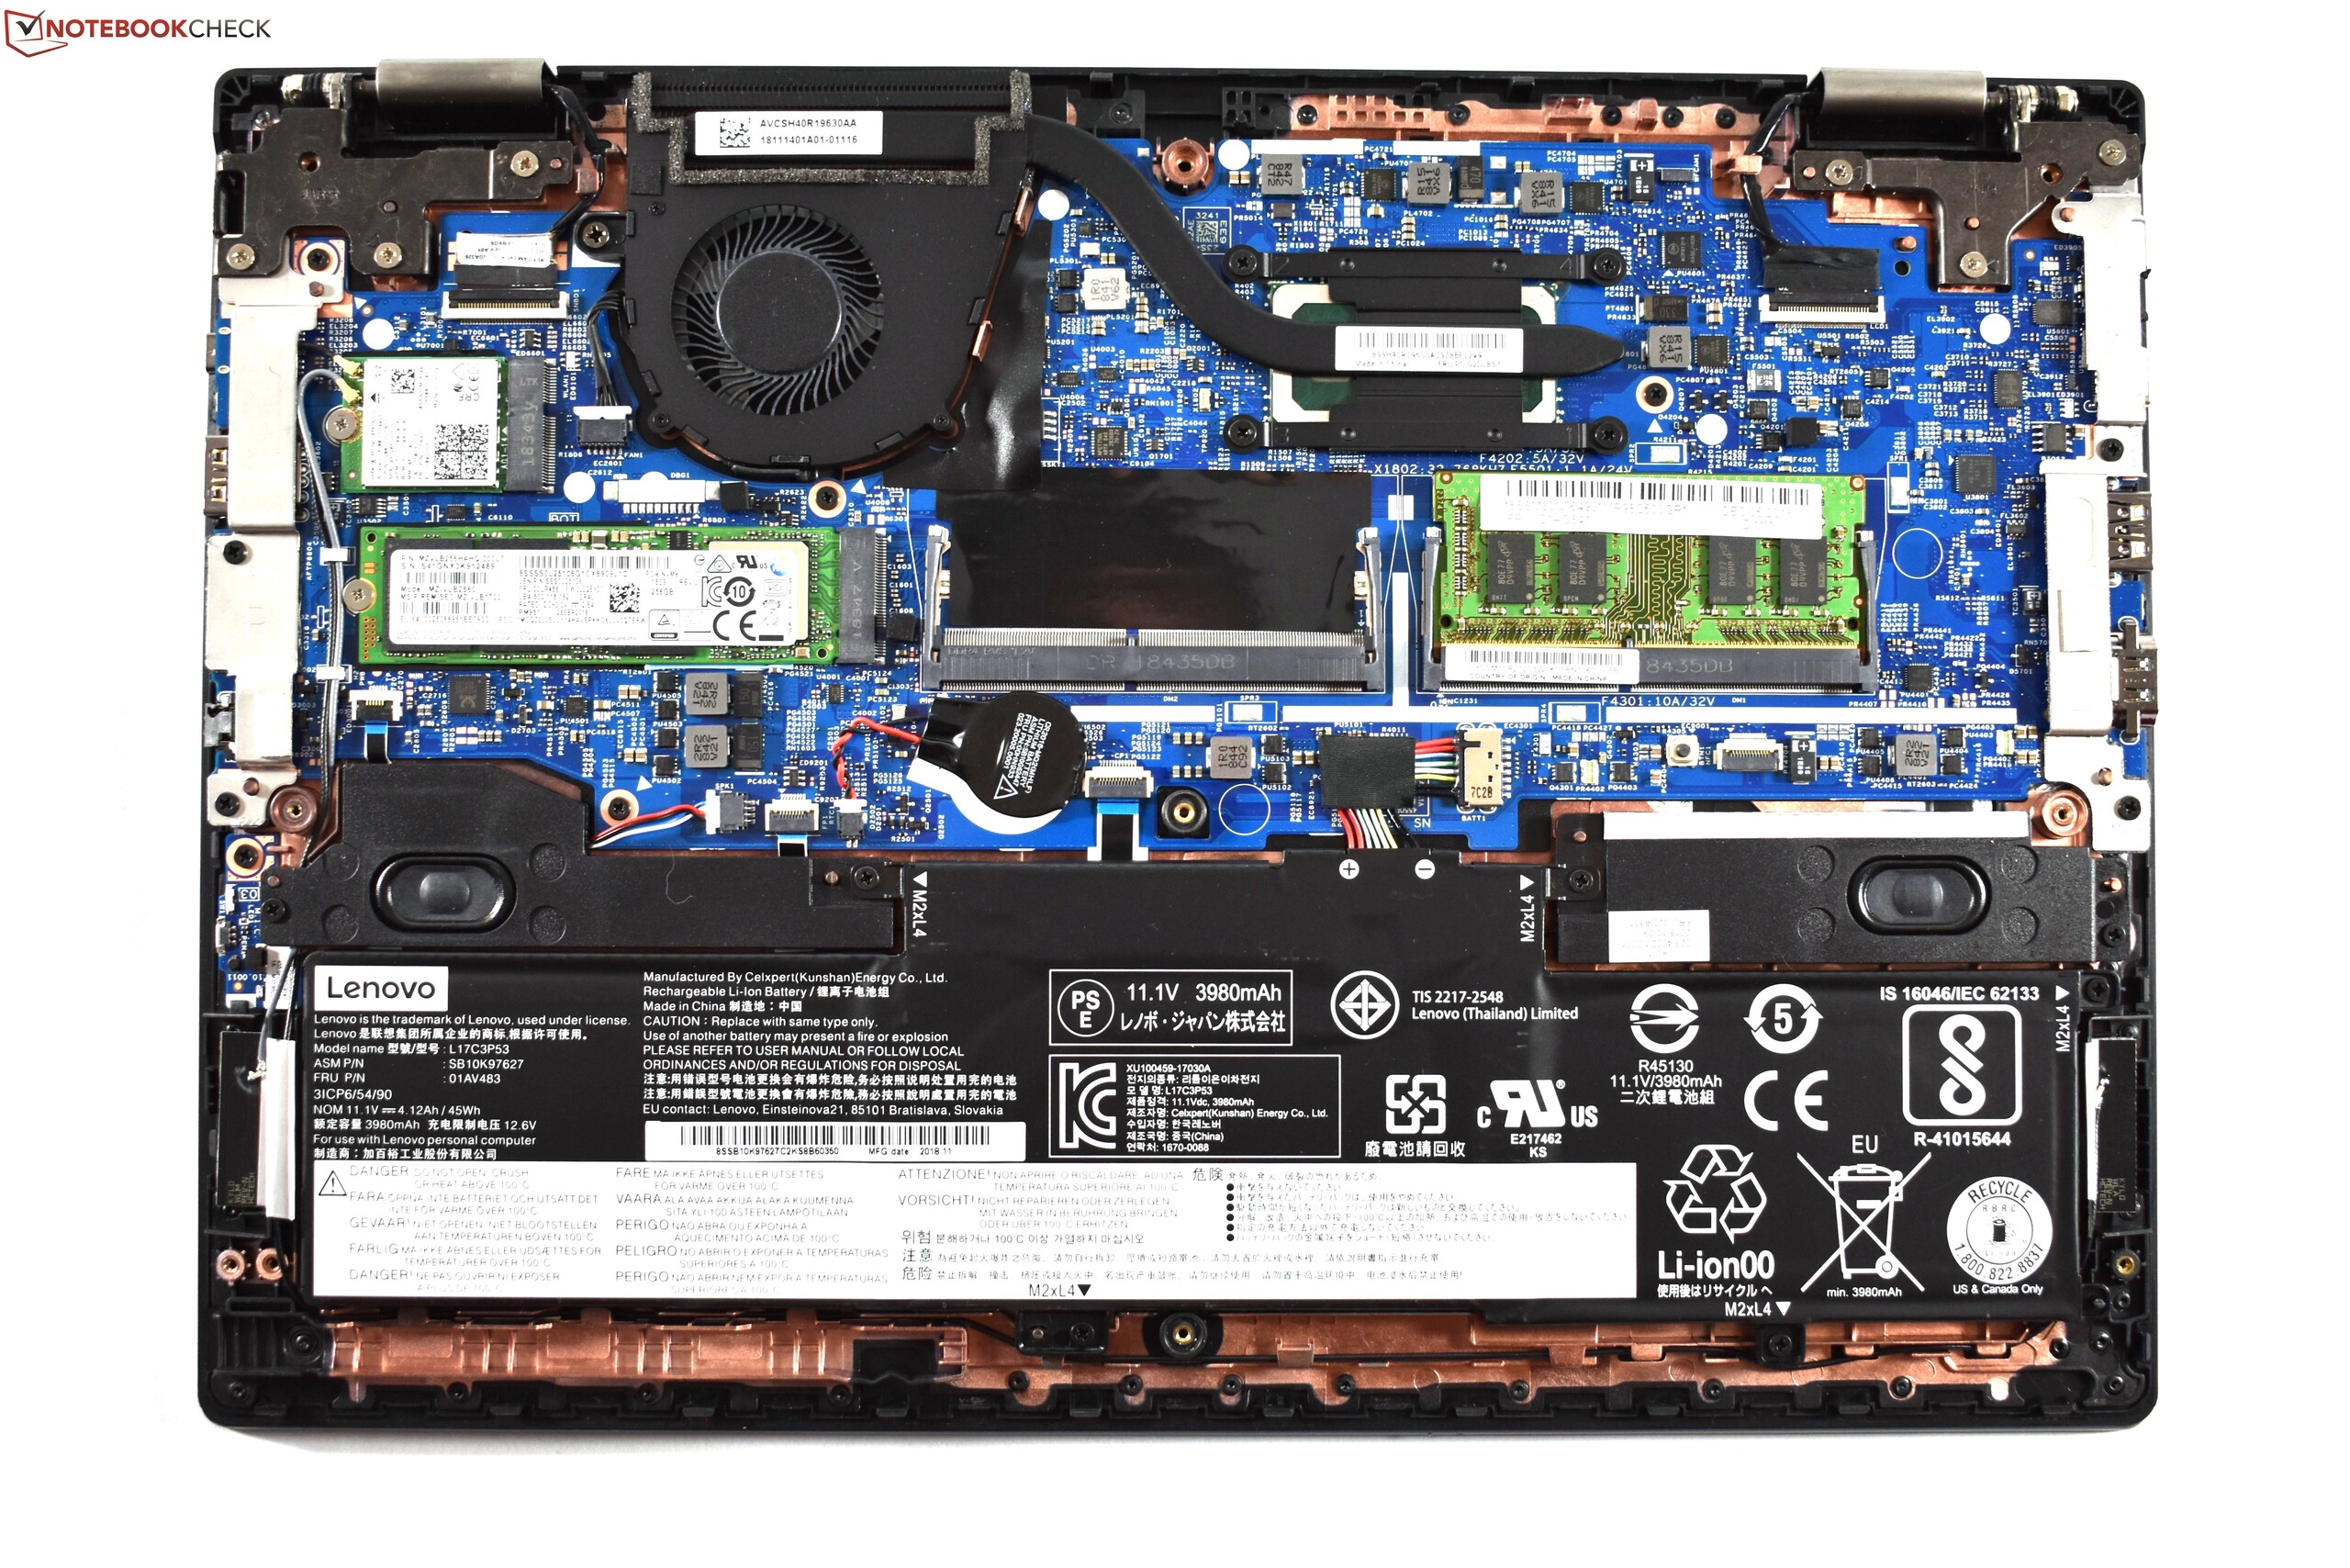
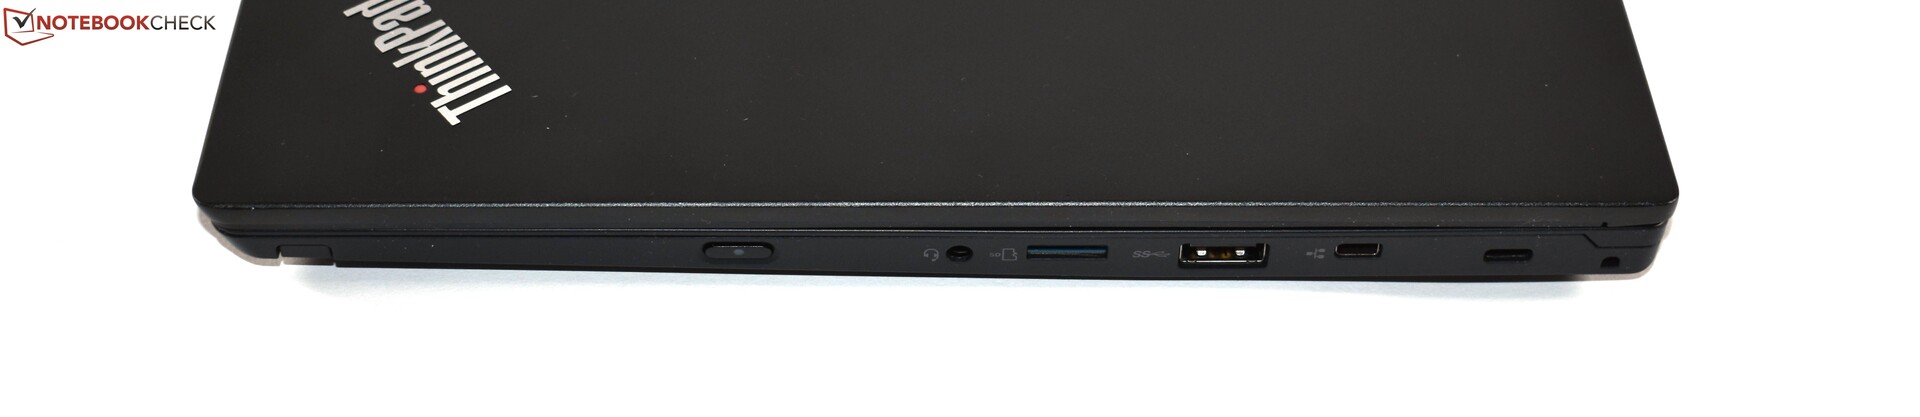
Com isto em mente, não é de surpreender que os pontos fortes e fracos do ThinkPad L390 sejam praticamente idênticos ao seu antecessor. Um de seus pontos fortes é que o portátil funciona sem ruído do ventilador na maior parte do tempo e que o ventilador é ainda bastante silencioso sob uso intenso. Os dispositivos de entrada também são recomendáveis: A combinação de touchpad e TrackPoint é muito confortável e o teclado ThinkPad de tamanho normal é tão bom quanto se poderia esperar. A primeira diferença real em comparação com o L380 é o desempenho da CPU, que foi melhorado pela Lenovo com um limite de TDP superior. Outros pros para o ThinkPad L390 incluem o chassi estável, a boa seleção de portas e a capacidade de atualização da RAM - com os dois slots de RAM de até 64 GB, o que é muito útil para um portátil compacto. Por último, mas não menos importante, o preço acessível também pode ser considerado positivo.
A tela não é completamente ruim e é até um pouco mais brilhante em comparação com a do L380, mas a baixa gama de cores continua a ser um ponto sensível. Outro ponto negativo sobre o L390 é o fato de que ele possui menos recursos empresariais do que outros ThinkPads. Por exemplo, falta-lhe uma porta docking mecânica, o ThinkShutter, bem como um leitor de Smartcard. Infelizmente, a duração da bateria é pior em comparação com o ThinkPad L380 e o chassi do L390 esquenta notavelmente mais que seu antecessor também. Além disso, o L390 tem uma garantia padrão de apenas um ano e não conta com uma porta Thunderbolt.
O ThinkPad L390 é um sólido cavalo de batalha móvel sem grandes falhas, e oferece um bom valor pelo dinheiro, assim como seu antecessor.
Apesar desses pontos negativos, o veredicto para o ThinkPad L390 é positivo, em geral, e ganha a nossa recomendação. O Lenovo ThinkPad L390 pode ser considerado um portátil de trabalho móvel atraente e acessível, especialmente para estudantes.
Lenovo ThinkPad L390-20NR0013GE
- 02/15/2019 v6 (old)
Benjamin Herzig
Price comparison
