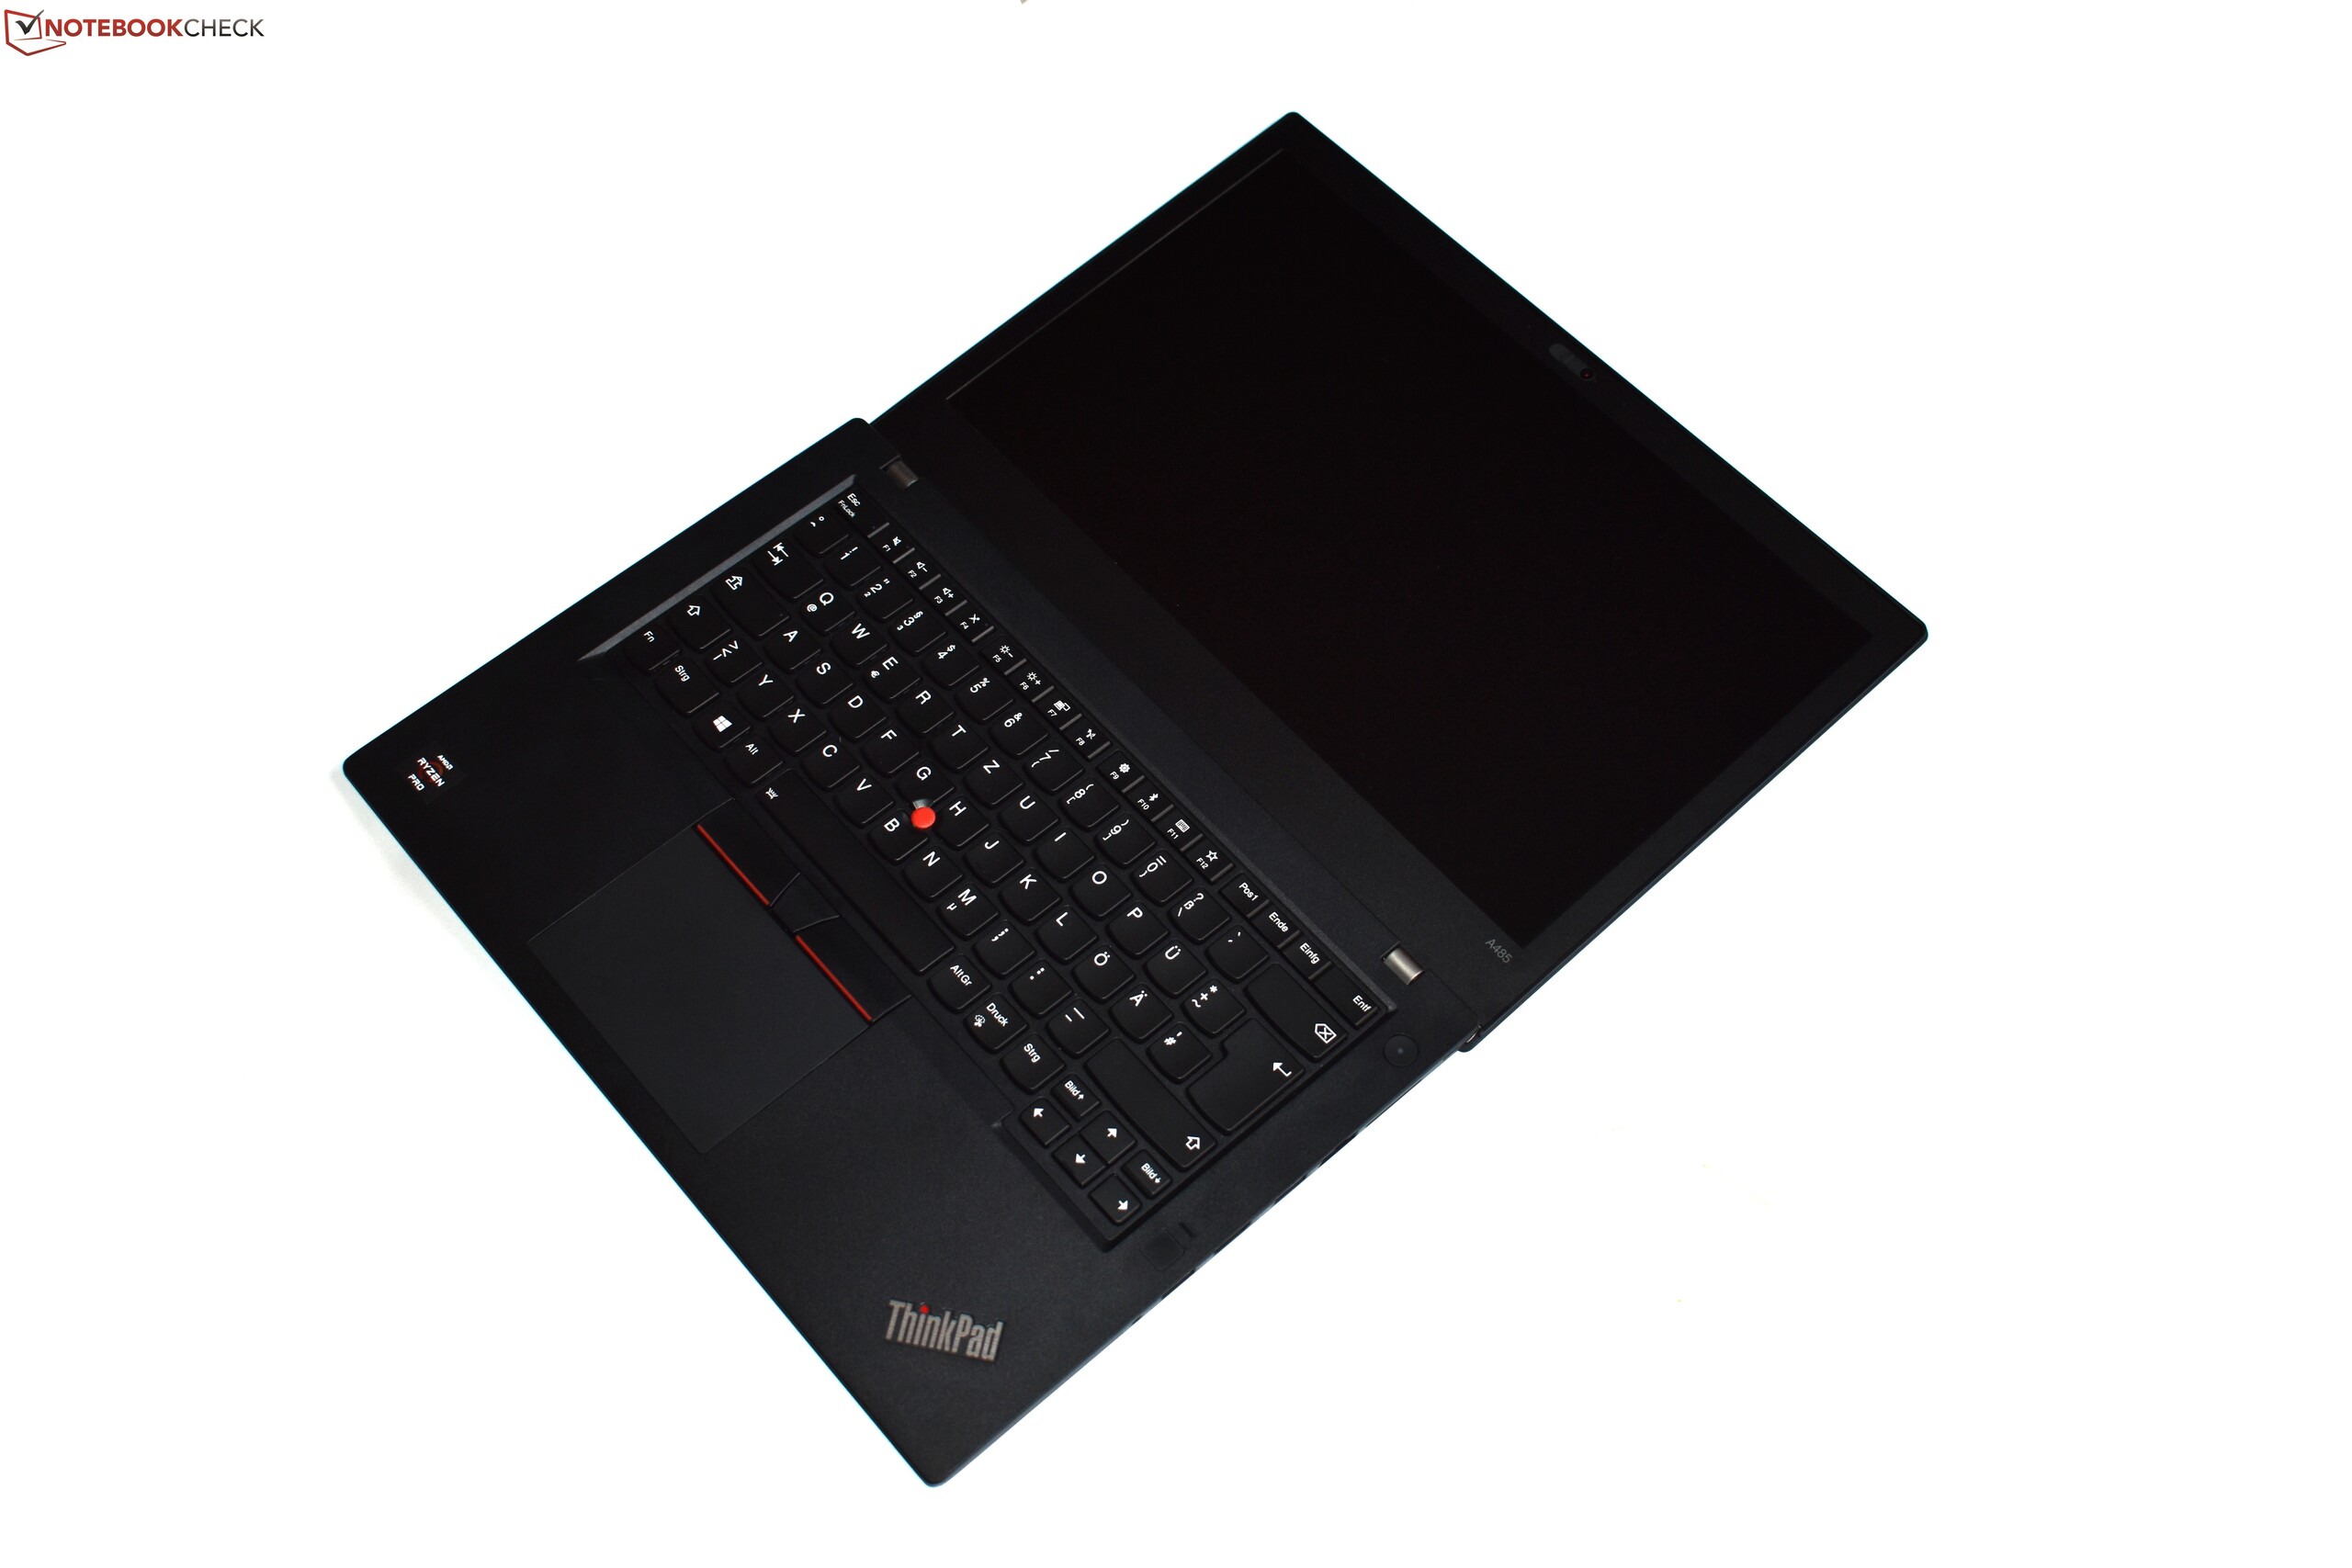
Breve Análise do Portátil Lenovo ThinkPad A485 (Ryzen 5 Pro)

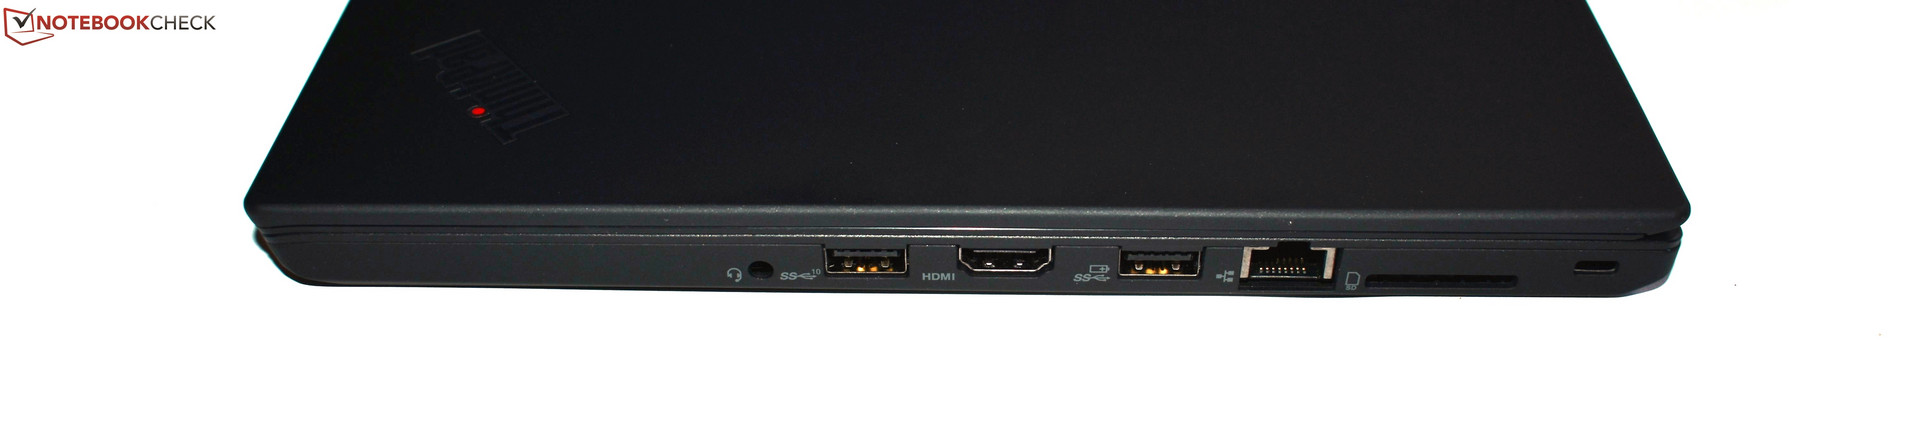
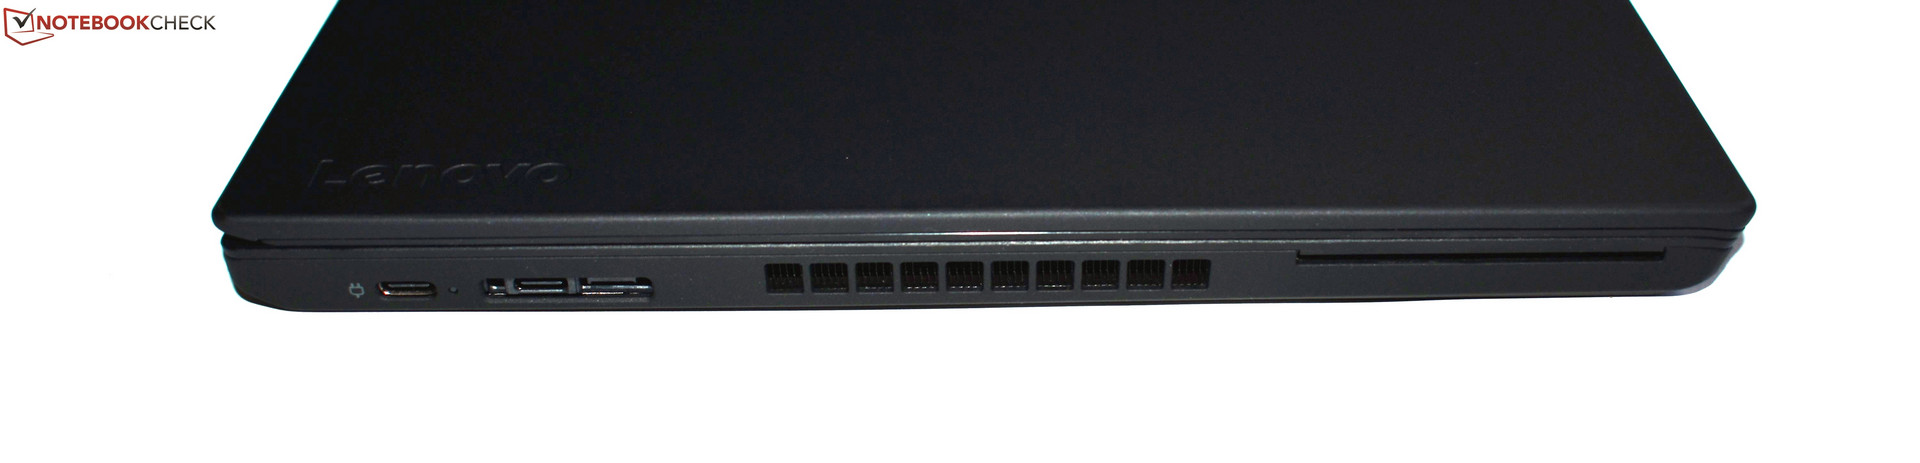
Connections
| SD Card Reader | |
| average JPG Copy Test (av. of 3 runs) | |
| Dell Latitude 5490-TD70X (Toshiba Exceria Pro SDXC 64 GB UHS-II) | |
| Lenovo ThinkPad T480-20L6S01V00 (Toshiba Exceria Pro SDXC 64 GB UHS-II) | |
| Lenovo ThinkPad A485-20MU000CGE (Toshiba Exceria Pro SDXC 64 GB UHS-II) | |
| Média da turma Office (19.8 - 198.5, n=22, últimos 2 anos) | |
| maximum AS SSD Seq Read Test (1GB) | |
| Dell Latitude 5490-TD70X (Toshiba Exceria Pro SDXC 64 GB UHS-II) | |
| Lenovo ThinkPad T480-20L6S01V00 (Toshiba Exceria Pro SDXC 64 GB UHS-II) | |
| Lenovo ThinkPad A485-20MU000CGE (Toshiba Exceria Pro SDXC 64 GB UHS-II) | |
| Média da turma Office (27.4 - 249, n=21, últimos 2 anos) | |
| |||||||||||||||||||||||||
iluminação: 85 %
iluminação com acumulador: 273 cd/m²
Contraste: 1058:1 (Preto: 0.26 cd/m²)
ΔE ColorChecker Calman: 5.9 | ∀{0.5-29.43 Ø4.72}
calibrated: 4.9
ΔE Greyscale Calman: 3.6 | ∀{0.09-98 Ø4.97}
59.6% sRGB (Argyll 1.6.3 3D)
38.1% AdobeRGB 1998 (Argyll 1.6.3 3D)
41.57% AdobeRGB 1998 (Argyll 3D)
60% sRGB (Argyll 3D)
40.24% Display P3 (Argyll 3D)
Gamma: 2.36
CCT: 6798 K
| Lenovo ThinkPad A485-20MU000CGE NV140FHM-N46, , 1920x1080, 14" | Lenovo ThinkPad T480-20L6S01V00 Lenovo LP140WF6-SPB7, , 1920x1080, 14" | Dell Latitude 5490-TD70X AU Optronics AUO263D, , 1920x1080, 14" | HP EliteBook 745 G5 3UN74EA AUO383D, , 1920x1080, 14" | Lenovo ThinkPad T480s-20L8S02D00 LP140QH2-SPB1, , 2560x1440, 14" | |
|---|---|---|---|---|---|
| Display | -2% | -10% | 49% | 74% | |
| Display P3 Coverage (%) | 40.24 | 39.24 -2% | 36.28 -10% | 61.3 52% | 72.8 81% |
| sRGB Coverage (%) | 60 | 58.8 -2% | 54.6 -9% | 87.6 46% | 97.9 63% |
| AdobeRGB 1998 Coverage (%) | 41.57 | 40.56 -2% | 37.48 -10% | 62.3 50% | 74.1 78% |
| Response Times | 26% | 3% | 26% | 17% | |
| Response Time Grey 50% / Grey 80% * (ms) | 44.8 ? | 35.6 ? 21% | 46.9 ? -5% | 35 ? 22% | 38.4 ? 14% |
| Response Time Black / White * (ms) | 35.2 ? | 24.8 ? 30% | 31.2 ? 11% | 25 ? 29% | 28.4 ? 19% |
| PWM Frequency (Hz) | 1000 ? | ||||
| Screen | 4% | 1% | 35% | 16% | |
| Brightness middle (cd/m²) | 275 | 307 12% | 227 -17% | 421 53% | 352 28% |
| Brightness (cd/m²) | 272 | 295 8% | 211 -22% | 398 46% | 343 26% |
| Brightness Distribution (%) | 85 | 90 6% | 88 4% | 86 1% | 91 7% |
| Black Level * (cd/m²) | 0.26 | 0.25 4% | 0.19 27% | 0.27 -4% | 0.46 -77% |
| Contrast (:1) | 1058 | 1228 16% | 1195 13% | 1559 47% | 765 -28% |
| Colorchecker dE 2000 * | 5.9 | 5.7 3% | 5.6 5% | 4.08 31% | 3.3 44% |
| Colorchecker dE 2000 max. * | 20 | 21.3 -7% | 22.4 -12% | 7.48 63% | 7.3 63% |
| Colorchecker dE 2000 calibrated * | 4.9 | 4.7 4% | |||
| Greyscale dE 2000 * | 3.6 | 3.7 -3% | 2.4 33% | 2.92 19% | 5.3 -47% |
| Gamma | 2.36 93% | 2.11 104% | 2.44 90% | 2.32 95% | 2.22 99% |
| CCT | 6798 96% | 7353 88% | 6506 100% | 7043 92% | 6452 101% |
| Color Space (Percent of AdobeRGB 1998) (%) | 38.1 | 37.4 -2% | 34.5 -9% | 57 50% | 68.4 80% |
| Color Space (Percent of sRGB) (%) | 59.6 | 58.7 -2% | 54.4 -9% | 87 46% | 98 64% |
| Média Total (Programa/Configurações) | 9% /
5% | -2% /
-1% | 37% /
37% | 36% /
28% |
* ... menor é melhor
Exibir tempos de resposta
| ↔ Tempo de resposta preto para branco | ||
|---|---|---|
| 35.2 ms ... ascensão ↗ e queda ↘ combinadas | ↗ 19.6 ms ascensão | 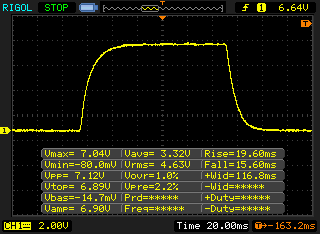 |
| ↘ 15.6 ms queda | ||
| A tela mostra taxas de resposta lentas em nossos testes e será insatisfatória para os jogadores. Em comparação, todos os dispositivos testados variam de 0.1 (mínimo) a 240 (máximo) ms. » 93 % de todos os dispositivos são melhores. Isso significa que o tempo de resposta medido é pior que a média de todos os dispositivos testados (19.8 ms). | ||
| ↔ Tempo de resposta 50% cinza a 80% cinza | ||
| 44.8 ms ... ascensão ↗ e queda ↘ combinadas | ↗ 22.8 ms ascensão | 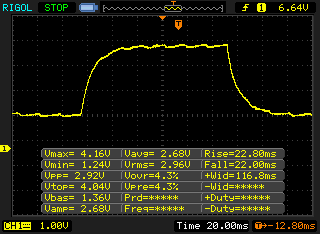 |
| ↘ 22 ms queda | ||
| A tela mostra taxas de resposta lentas em nossos testes e será insatisfatória para os jogadores. Em comparação, todos os dispositivos testados variam de 0.165 (mínimo) a 636 (máximo) ms. » 76 % de todos os dispositivos são melhores. Isso significa que o tempo de resposta medido é pior que a média de todos os dispositivos testados (31 ms). | ||
Cintilação da tela / PWM (modulação por largura de pulso)
| Tela tremeluzindo/PWM detectado | 1000 Hz | ≤ 99 % configuração de brilho | 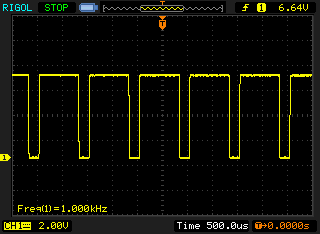 |
A luz de fundo da tela pisca em 1000 Hz (pior caso, por exemplo, utilizando PWM) Cintilação detectada em uma configuração de brilho de 99 % e abaixo. Não deve haver cintilação ou PWM acima desta configuração de brilho. A frequência de 1000 Hz é bastante alta, então a maioria dos usuários sensíveis ao PWM não deve notar nenhuma oscilação. [pwm_comparison] Em comparação: 52 % de todos os dispositivos testados não usam PWM para escurecer a tela. Se PWM foi detectado, uma média de 7747 (mínimo: 5 - máximo: 343500) Hz foi medida. | |||
| PCMark 8 Home Score Accelerated v2 | 2937 pontos | |
| PCMark 8 Work Score Accelerated v2 | 4123 pontos | |
| PCMark 10 Score | 2673 pontos | |
Ajuda | ||
| Lenovo ThinkPad A485-20MU000CGE Samsung SSD PM981 MZVLB256HAHQ | HP EliteBook 745 G5 3UN74EA Toshiba XG5 KXG50ZNV256G | Lenovo ThinkPad T480s-20L8S02D00 Samsung SSD PM981 MZVLB512HAJQ | Dell Latitude 5490-TD70X Toshiba KSG60ZMV512G | Lenovo ThinkPad T480-20L6S01V00 Samsung SSD PM981 MZVLB512HAJQ | Média Samsung SSD PM981 MZVLB256HAHQ | |
|---|---|---|---|---|---|---|
| CrystalDiskMark 3.0 | -19% | 43% | -30% | -2% | 20% | |
| Read Seq (MB/s) | 1193 | 1549 30% | 1540 29% | 465.1 -61% | 922 -23% | 1837 ? 54% |
| Write Seq (MB/s) | 1280 | 269.7 -79% | 1613 26% | 425 -67% | 928 -27% | 1402 ? 10% |
| Read 512 (MB/s) | 765 | 823 8% | 835 9% | 410.1 -46% | 561 -27% | 860 ? 12% |
| Write 512 (MB/s) | 1169 | 298.1 -74% | 1716 47% | 360.7 -69% | 567 -51% | 1038 ? -11% |
| Read 4k (MB/s) | 52.2 | 24.9 -52% | 66.9 28% | 27.34 -48% | 64.4 23% | 47.2 ? -10% |
| Write 4k (MB/s) | 89.7 | 97.1 8% | 160.6 79% | 89 -1% | 108 20% | 103 ? 15% |
| Read 4k QD32 (MB/s) | 286.5 | 310.6 8% | 444.9 55% | 295.6 3% | 383.4 34% | 348 ? 21% |
| Write 4k QD32 (MB/s) | 205.6 | 208.4 1% | 343 67% | 300.2 46% | 271.4 32% | 341 ? 66% |

| 3DMark 06 Standard Score | 10336 pontos | |
| 3DMark 11 Performance | 2875 pontos | |
| 3DMark Cloud Gate Standard Score | 8192 pontos | |
| 3DMark Fire Strike Score | 1585 pontos | |
Ajuda | ||
| Rise of the Tomb Raider - 1024x768 Lowest Preset | |
| Lenovo ThinkPad T480-20L6S01V00 | |
| Lenovo ThinkPad T480s-20L8S02E00 | |
| HP ProBook 645 G4 3UP62EA | |
| Média AMD Radeon RX Vega 8 (Ryzen 2000/3000) (27.7 - 49.3, n=10) | |
| Lenovo ThinkPad A485-20MU000CGE | |
| HP EliteBook 840 G5-3JX66EA | |
| baixo | média | alto | ultra | |
|---|---|---|---|---|
| The Witcher 3 (2015) | 29.5 | 9.8 | ||
| Rise of the Tomb Raider (2016) | 34.2 | 10.9 | ||
| Civilization 6 (2016) | 43.6 | 11.1 |
Barulho
| Ocioso |
| 29.3 / 29.3 / 29.6 dB |
| Carga |
| 31.6 / 31.6 dB |
 | ||
30 dB silencioso 40 dB(A) audível 50 dB(A) ruidosamente alto |
||
min: | ||
(+) A temperatura máxima no lado superior é 39.1 °C / 102 F, em comparação com a média de 34.3 °C / 94 F , variando de 21.2 a 62.5 °C para a classe Office.
(-) A parte inferior aquece até um máximo de 49.9 °C / 122 F, em comparação com a média de 36.8 °C / 98 F
(+) Em uso inativo, a temperatura média para o lado superior é 26.7 °C / 80 F, em comparação com a média do dispositivo de 29.5 °C / ### class_avg_f### F.
(+) Os apoios para as mãos e o touchpad estão atingindo a temperatura máxima da pele (32.3 °C / 90.1 F) e, portanto, não estão quentes.
(-) A temperatura média da área do apoio para as mãos de dispositivos semelhantes foi 27.5 °C / 81.5 F (-4.8 °C / -8.6 F).
Lenovo ThinkPad A485-20MU000CGE análise de áudio
(±) | o volume do alto-falante é médio, mas bom (###valor### dB)
Graves 100 - 315Hz
(-) | quase nenhum baixo - em média 24.7% menor que a mediana
(±) | a linearidade dos graves é média (11.9% delta para a frequência anterior)
Médios 400 - 2.000 Hz
(+) | médios equilibrados - apenas 2.9% longe da mediana
(±) | a linearidade dos médios é média (7.5% delta para frequência anterior)
Altos 2 - 16 kHz
(+) | agudos equilibrados - apenas 2.2% longe da mediana
(+) | os máximos são lineares (6.8% delta da frequência anterior)
Geral 100 - 16.000 Hz
(±) | a linearidade do som geral é média (23.8% diferença em relação à mediana)
Comparado com a mesma classe
» 68% de todos os dispositivos testados nesta classe foram melhores, 8% semelhantes, 23% piores
» O melhor teve um delta de 7%, a média foi 21%, o pior foi 53%
Comparado com todos os dispositivos testados
» 71% de todos os dispositivos testados foram melhores, 6% semelhantes, 22% piores
» O melhor teve um delta de 4%, a média foi 23%, o pior foi 134%
HP EliteBook 745 G5 3UN74EA análise de áudio
(-) | alto-falantes não muito altos (###valor### dB)
Graves 100 - 315Hz
(-) | quase nenhum baixo - em média 27.1% menor que a mediana
(±) | a linearidade dos graves é média (10.7% delta para a frequência anterior)
Médios 400 - 2.000 Hz
(+) | médios equilibrados - apenas 2.4% longe da mediana
(±) | a linearidade dos médios é média (8.6% delta para frequência anterior)
Altos 2 - 16 kHz
(+) | agudos equilibrados - apenas 2.7% longe da mediana
(+) | os máximos são lineares (5.6% delta da frequência anterior)
Geral 100 - 16.000 Hz
(±) | a linearidade do som geral é média (20.2% diferença em relação à mediana)
Comparado com a mesma classe
» 44% de todos os dispositivos testados nesta classe foram melhores, 10% semelhantes, 46% piores
» O melhor teve um delta de 7%, a média foi 21%, o pior foi 53%
Comparado com todos os dispositivos testados
» 52% de todos os dispositivos testados foram melhores, 8% semelhantes, 39% piores
» O melhor teve um delta de 4%, a média foi 23%, o pior foi 134%
| desligado | |
| Ocioso | |
| Carga |
|
Key:
min: | |
| Lenovo ThinkPad A485-20MU000CGE R5 PRO 2500U, Vega 8, Samsung SSD PM981 MZVLB256HAHQ, IPS LED, 1920x1080, 14" | HP EliteBook 745 G5 3UN74EA R7 2700U, Vega 10, Toshiba XG5 KXG50ZNV256G, IPS LED, 1920x1080, 14" | Lenovo ThinkPad T480s-20L8S02D00 i5-8250U, UHD Graphics 620, Samsung SSD PM981 MZVLB512HAJQ, IPS, 2560x1440, 14" | Dell Latitude 5490-TD70X i5-8350U, UHD Graphics 620, Toshiba KSG60ZMV512G, IPS, 1920x1080, 14" | Lenovo ThinkPad T480-20L6S01V00 i5-8550U, GeForce MX150, Samsung SSD PM981 MZVLB512HAJQ, IPS, 1920x1080, 14" | Média AMD Radeon RX Vega 8 (Ryzen 2000/3000) | Média da turma Office | |
|---|---|---|---|---|---|---|---|
| Power Consumption | 11% | 4% | 15% | -5% | 3% | 4% | |
| Idle Minimum * (Watt) | 5.3 | 4.9 8% | 3.1 42% | 3.3 38% | 3.6 32% | 5.68 ? -7% | 4.3 ? 19% |
| Idle Average * (Watt) | 8.3 | 8.1 2% | 6.8 18% | 5.54 33% | 7.1 14% | 8.75 ? -5% | 7.33 ? 12% |
| Idle Maximum * (Watt) | 11.4 | 10.6 7% | 10.1 11% | 6.59 42% | 9.5 17% | 10.1 ? 11% | 8.59 ? 25% |
| Load Average * (Watt) | 42 | 32.2 23% | 48.4 -15% | 42.4 -1% | 63.9 -52% | 37.8 ? 10% | 43.6 ? -4% |
| Load Maximum * (Watt) | 48.8 | 42.3 13% | 67.1 -38% | 67.6 -39% | 67.3 -38% | 46.2 ? 5% | 64.4 ? -32% |
| Witcher 3 ultra * (Watt) | 53.9 |
* ... menor é melhor
| Lenovo ThinkPad A485-20MU000CGE R5 PRO 2500U, Vega 8, 48 Wh | HP EliteBook 745 G5 3UN74EA R7 2700U, Vega 10, 50 Wh | Dell Latitude 5490-TD70X i5-8350U, UHD Graphics 620, 68 Wh | Lenovo ThinkPad T480-20L6S01V00 i5-8550U, GeForce MX150, 72 Wh | Lenovo ThinkPad T480s-20L8S02D00 i5-8250U, UHD Graphics 620, 57 Wh | Média da turma Office | |
|---|---|---|---|---|---|---|
| Duração da bateria | 19% | 116% | 127% | 84% | 118% | |
| Reader / Idle (h) | 11.2 | 10.7 -4% | 25.9 131% | 27.9 149% | 24.5 ? 119% | |
| H.264 (h) | 6.1 | 7.1 16% | 13.2 116% | 10.6 74% | 12 97% | 15.5 ? 154% |
| WiFi v1.3 (h) | 5.5 | 6.6 20% | 15 173% | 13.2 140% | 9 64% | 13 ? 136% |
| Load (h) | 1.1 | 1.6 45% | 1.6 45% | 2.7 145% | 2.1 91% | 1.808 ? 64% |
Pro
Contra
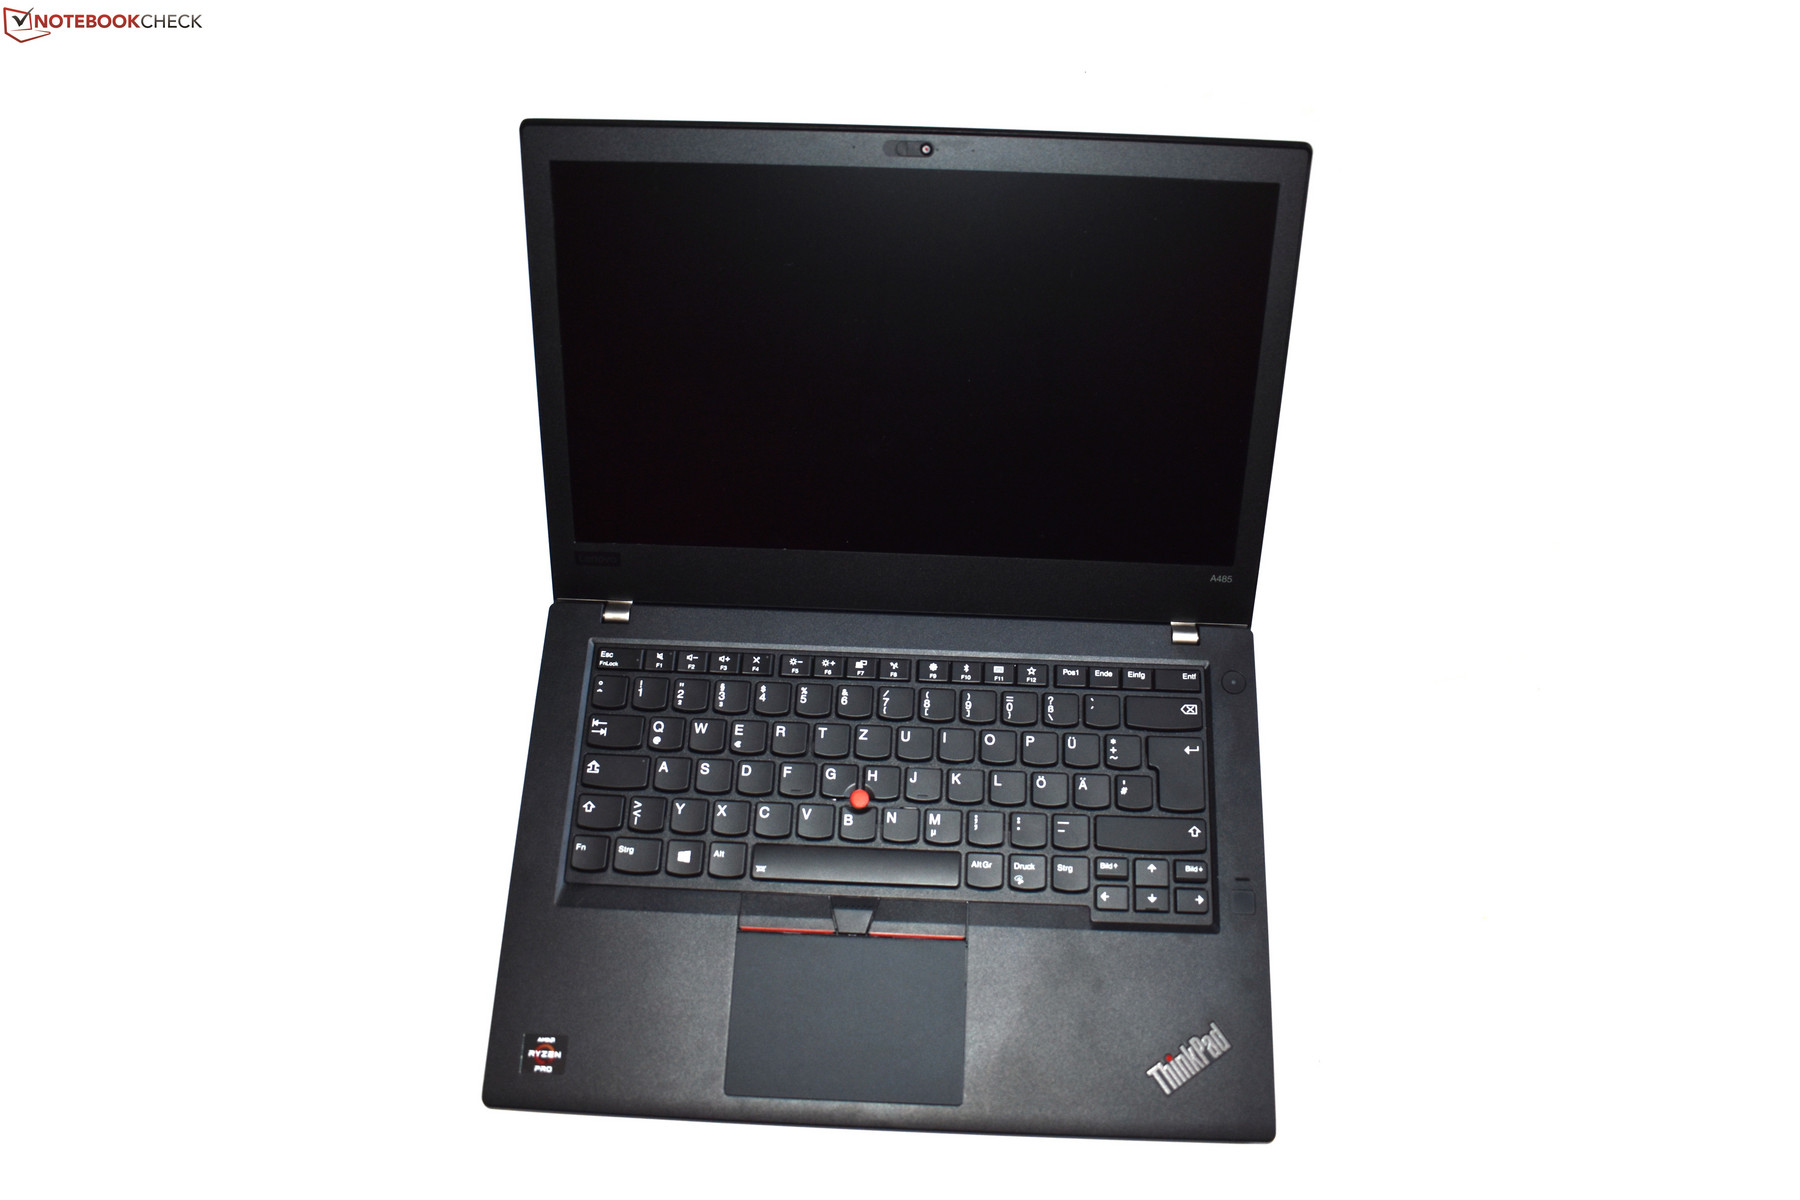
O Lenovo ThinkPad A485 realmente tinha um alto potencial: A série ThinkPad T, na qual o ThinkPad A se baseia, é extremamente popular, e há uma grande demanda por bons portáteis Ryzen. No entanto, este ThinkPad Ryzen nos decepciona no teste.
Por um lado, isso é porque a Lenovo desnecessariamente omite a tela QHD do ThinkPad A485, e o A485 também não tem Thunderbolt 3. Além disso, o desempenho da CPU permanece muito atrás do modelo irmão ThinkPad T480 da Intel. Pior ainda é o fato de que o consumo é muito alto, resultando em uma bateria extremamente ruim em comparação. Isso é apenas parcialmente culpa da Lenovo, já que os portáteis com a Ryzen geralmente enfrentam um consumo maior em comparação com os modelos baseados na Intel.
Claro que o Lenovo ThinkPad A485 também tem muitos lados positivos, levando à boa pontuação de avaliação. Estes incluem, por exemplo, a carcaça robusta, os excelentes dispositivos de entrada e o extenso equipamento de conexão. Mas você também pode conseguir tudo isso no ThinkPad T480. Apenas no desempenho gráfico o A485 está na frente, mas só comparado com o T480 com a iGPU. O modelo com a GeForce MX150 também é melhor neste aspecto.
Não recomendado: Tudo o que torna o ThinkPad A485 um bom portátil, o ThinkPad T480 também pode fazer, enquanto também proporciona um melhor desempenho da CPU e melhor duração da bateria do que o A485.
Então, finalmente, não podemos realmente dar uma recomendação para o ThinkPad A485. Na prática, o Lenovo ThinkPad T480 é realmente a melhor opção em todos os aspectos. Por outro lado, se você quiser evitar os processadores da Intel em geral, você deveria escolher o HP EliteBook 745 G5, que tem uma duração de bateria que não é tão ruim e o painel LCD também é melhor até certo ponto neste modelo.
Atualização UEFI versão 1.02: Conseguimos testar novamente o ThinkPad A485 com uma versão mais recente do BIOS UEFI. A duração da bateria agora melhorou um pouco, e o desempenho da CPU sob uso intenso também é maior com o firmware mais novo. Portanto, ajustamos a pontuação da avaliação e também queremos modificar um pouco nosso veredicto: Embora o ThinkPad T480 continue a superar o A485, o ThinkPad A485 pode ser uma opção interessante devido ao seu preço relativamente acessível, especialmente se você precisar de um pouco mais de desempenho da GPU.
Lenovo ThinkPad A485-20MU000CGE
- 10/22/2019 v7 (old)
Benjamin Herzig