Breve Análise do Acer TravelMate X3410 (i7-8550U, 16 GB RAM, SSD de 512 GB)
| SD Card Reader | |
| average JPG Copy Test (av. of 3 runs) | |
| Dell Latitude 7490 (Toshiba Exceria Pro M501 UHS-II) | |
| Lenovo ThinkPad T480-20L50010US (Toshiba Exceria Pro SDXC 64 GB UHS-II) | |
| Toshiba Tecra X40-D | |
| Lenovo ThinkPad T480s-20L8S02E00 (Toshiba Exceria Pro SDXC 64 GB UHS-II) | |
| Média da turma Office (22.4 - 198.5, n=22, últimos 2 anos) | |
| Acer TravelMate X3410-M-866T (Toshiba Exceria Pro SDXC 64 GB UHS-II) | |
| maximum AS SSD Seq Read Test (1GB) | |
| Dell Latitude 7490 (Toshiba Exceria Pro M501 UHS-II) | |
| Lenovo ThinkPad T480s-20L8S02E00 (Toshiba Exceria Pro SDXC 64 GB UHS-II) | |
| Toshiba Tecra X40-D | |
| Lenovo ThinkPad T480-20L50010US (Toshiba Exceria Pro SDXC 64 GB UHS-II) | |
| Média da turma Office (27.4 - 249, n=20, últimos 2 anos) | |
| Acer TravelMate X3410-M-866T (Toshiba Exceria Pro SDXC 64 GB UHS-II) | |
| |||||||||||||||||||||||||
iluminação: 77 %
iluminação com acumulador: 253.1 cd/m²
Contraste: 844:1 (Preto: 0.3 cd/m²)
ΔE ColorChecker Calman: 4.71 | ∀{0.5-29.43 Ø4.73}
calibrated: 3.44
ΔE Greyscale Calman: 3.4 | ∀{0.09-98 Ø4.97}
62% sRGB (Argyll 1.6.3 3D)
40% AdobeRGB 1998 (Argyll 1.6.3 3D)
42.99% AdobeRGB 1998 (Argyll 3D)
62.4% sRGB (Argyll 3D)
41.59% Display P3 (Argyll 3D)
Gamma: 1.997
CCT: 6266 K
| Acer TravelMate X3410-M-866T Chi Mei CMN14D4, IPS, 14", 1920x1080 | Lenovo ThinkPad T480-20L50010US B140HAK01.0, TFT-LCD, 14", 1920x1080 | Lenovo ThinkPad T480s-20L8S02E00 LP140QH2-SPB1, IPS LED, 14", 2560x1440 | Lenovo ThinkPad X1 Carbon 2018-20KGS5DU00 LP140QH2-SPB1, IPS, 14", 2560x1440 | Toshiba Portege X30T-E-109 Toshiba TOS508F, IPS, 13.3", 1920x1080 | Toshiba Tecra X40-D Toshiba TOS508F, IPS, 14", 1920x1080 | Dell Latitude 7490 AUO503D (D04YD_B140HAN), IPS, 14", 1920x1080 | HP EliteBook 840 G5-3JX61EA IVO M140NVF7 R0, IPS, 14", 1920x1080 | |
|---|---|---|---|---|---|---|---|---|
| Display | -13% | 65% | 69% | 54% | -3% | 58% | 44% | |
| Display P3 Coverage (%) | 41.59 | 36.31 -13% | 71.4 72% | 72.7 75% | 67.2 62% | 40.55 -3% | 66.6 60% | 61 47% |
| sRGB Coverage (%) | 62.4 | 54.5 -13% | 96.6 55% | 97.9 57% | 90.8 46% | 61 -2% | 96.8 55% | 87.7 41% |
| AdobeRGB 1998 Coverage (%) | 42.99 | 37.51 -13% | 72.1 68% | 74.6 74% | 66.5 55% | 41.89 -3% | 67.9 58% | 62.1 44% |
| Response Times | 8% | 16% | 16% | -5% | 15% | 3% | 22% | |
| Response Time Grey 50% / Grey 80% * (ms) | 40.4 ? | 39.2 ? 3% | 36 ? 11% | 38 ? 6% | 42 ? -4% | 38 ? 6% | 41.6 ? -3% | 33 ? 18% |
| Response Time Black / White * (ms) | 35.2 ? | 30.8 ? 12% | 28 ? 20% | 26 ? 26% | 37 ? -5% | 26.8 ? 24% | 32 ? 9% | 26 ? 26% |
| PWM Frequency (Hz) | 25000 ? | 17000 ? | 20410 ? | 3125 ? | ||||
| Screen | -11% | 29% | 15% | 13% | -3% | 20% | 47% | |
| Brightness middle (cd/m²) | 253.1 | 276.7 9% | 311 23% | 316 25% | 350 38% | 283.9 12% | 308.6 22% | 655 159% |
| Brightness (cd/m²) | 230 | 272 18% | 302 31% | 311 35% | 343 49% | 261 13% | 294 28% | 630 174% |
| Brightness Distribution (%) | 77 | 90 17% | 91 18% | 84 9% | 73 -5% | 85 10% | 89 16% | 93 21% |
| Black Level * (cd/m²) | 0.3 | 0.21 30% | 0.36 -20% | 0.35 -17% | 0.29 3% | 0.25 17% | 0.23 23% | 0.56 -87% |
| Contrast (:1) | 844 | 1318 56% | 864 2% | 903 7% | 1207 43% | 1136 35% | 1342 59% | 1170 39% |
| Colorchecker dE 2000 * | 4.71 | 7.22 -53% | 3 36% | 4.5 4% | 6.36 -35% | 6.4 -36% | 6.07 -29% | 3.27 31% |
| Colorchecker dE 2000 max. * | 20.72 | 25.87 -25% | 6.1 71% | 10.3 50% | 11.63 44% | 18.7 10% | 10.58 49% | 5.92 71% |
| Colorchecker dE 2000 calibrated * | 3.44 | 5.01 -46% | 1.7 51% | 1.6 53% | 1.7 51% | 1.67 51% | 3.22 6% | |
| Greyscale dE 2000 * | 3.4 | 6.7 -97% | 4 -18% | 7.7 -126% | 8.04 -136% | 6.3 -85% | 7.3 -115% | 2.85 16% |
| Gamma | 1.997 110% | 2.321 95% | 2.17 101% | 2.2 100% | 2.47 89% | 2.39 92% | 2.061 107% | 2.45 90% |
| CCT | 6266 104% | 6656 98% | 6961 93% | 6639 98% | 7716 84% | 6511 100% | 7269 89% | 6065 107% |
| Color Space (Percent of AdobeRGB 1998) (%) | 40 | 34 -15% | 66.7 67% | 68.6 72% | 59 48% | 38 -5% | 62 55% | 57 43% |
| Color Space (Percent of sRGB) (%) | 62 | 54 -13% | 96.7 56% | 97.9 58% | 91 47% | 60 -3% | 97 56% | 88 42% |
| Média Total (Programa/Configurações) | -5% /
-9% | 37% /
34% | 33% /
26% | 21% /
19% | 3% /
-1% | 27% /
25% | 38% /
43% |
* ... menor é melhor
Exibir tempos de resposta
| ↔ Tempo de resposta preto para branco | ||
|---|---|---|
| 35.2 ms ... ascensão ↗ e queda ↘ combinadas | ↗ 20.8 ms ascensão | 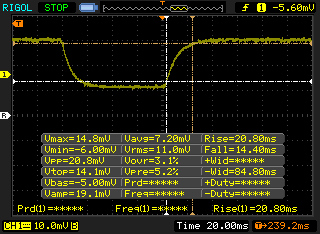 |
| ↘ 14.4 ms queda | ||
| A tela mostra taxas de resposta lentas em nossos testes e será insatisfatória para os jogadores. Em comparação, todos os dispositivos testados variam de 0.1 (mínimo) a 240 (máximo) ms. » 93 % de todos os dispositivos são melhores. Isso significa que o tempo de resposta medido é pior que a média de todos os dispositivos testados (19.9 ms). | ||
| ↔ Tempo de resposta 50% cinza a 80% cinza | ||
| 40.4 ms ... ascensão ↗ e queda ↘ combinadas | ↗ 23.2 ms ascensão | 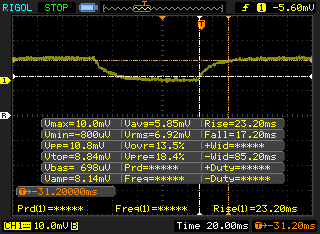 |
| ↘ 17.2 ms queda | ||
| A tela mostra taxas de resposta lentas em nossos testes e será insatisfatória para os jogadores. Em comparação, todos os dispositivos testados variam de 0.165 (mínimo) a 636 (máximo) ms. » 63 % de todos os dispositivos são melhores. Isso significa que o tempo de resposta medido é pior que a média de todos os dispositivos testados (31.1 ms). | ||
Cintilação da tela / PWM (modulação por largura de pulso)
| Tela tremeluzindo/PWM detectado | 25000 Hz | ≤ 21 % configuração de brilho | 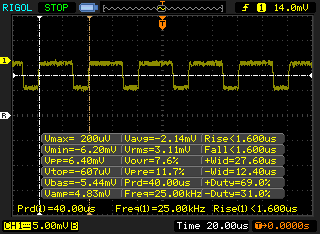 |
A luz de fundo da tela pisca em 25000 Hz (pior caso, por exemplo, utilizando PWM) Cintilação detectada em uma configuração de brilho de 21 % e abaixo. Não deve haver cintilação ou PWM acima desta configuração de brilho. A frequência de 25000 Hz é bastante alta, então a maioria dos usuários sensíveis ao PWM não deve notar nenhuma oscilação. [pwm_comparison] Em comparação: 52 % de todos os dispositivos testados não usam PWM para escurecer a tela. Se PWM foi detectado, uma média de 7798 (mínimo: 5 - máximo: 343500) Hz foi medida. | |||
| wPrime 2.10 - 1024m | |
| Média da turma Office (274 - 675, n=7, últimos 2 anos) | |
| Média Intel Core i7-8550U (258 - 435, n=11) | |
| Lenovo IdeaPad 330-15ICH | |
| MSI P65 8RF-451 - Creator | |
* ... menor é melhor
| PCMark 8 | |
| Home Score Accelerated v2 | |
| Média da turma Office (n=1últimos 2 anos) | |
| HP EliteBook 840 G5-3JX61EA | |
| Lenovo ThinkPad T480-20L50010US | |
| Lenovo ThinkPad X1 Carbon 2018-20KGS5DU00 | |
| Toshiba Tecra X40-D | |
| Dell Latitude 7490 | |
| Média Intel Core i7-8550U, Intel UHD Graphics 620 (3024 - 4197, n=33) | |
| Lenovo ThinkPad T480s-20L8S02E00 | |
| Acer TravelMate X3410-M-866T | |
| Work Score Accelerated v2 | |
| Média da turma Office (n=1últimos 2 anos) | |
| HP EliteBook 840 G5-3JX61EA | |
| Toshiba Tecra X40-D | |
| Lenovo ThinkPad T480s-20L8S02E00 | |
| Dell Latitude 7490 | |
| Acer TravelMate X3410-M-866T | |
| Média Intel Core i7-8550U, Intel UHD Graphics 620 (3518 - 5154, n=27) | |
| Lenovo ThinkPad X1 Carbon 2018-20KGS5DU00 | |
| PCMark 8 Home Score Accelerated v2 | 3386 pontos | |
| PCMark 8 Work Score Accelerated v2 | 4893 pontos | |
| PCMark 10 Score | 3460 pontos | |
Ajuda | ||
| Acer TravelMate X3410-M-866T Micron SSD 1100 SED 512GB, M.2 (MTFDDAV512TBN) | Lenovo ThinkPad T480-20L50010US Samsung SSD PM981 MZVLB512HAJQ | Lenovo ThinkPad T480s-20L8S02E00 Samsung SSD PM981 MZVLB512HAJQ | Lenovo ThinkPad X1 Carbon 2018-20KGS5DU00 Samsung SSD PM981 MZVLB512HAJQ | Toshiba Portege X30T-E-109 Samsung SSD PM981 MZVLB1T0HALR | Toshiba Tecra X40-D Samsung PM961 MZVLW256HEHP | Dell Latitude 7490 Toshiba KSG60ZMV256G | HP EliteBook 840 G5-3JX61EA Toshiba KXG50ZNV1T02 | Média Micron SSD 1100 SED 512GB, M.2 (MTFDDAV512TBN) | |
|---|---|---|---|---|---|---|---|---|---|
| AS SSD | 225% | 229% | 153% | 255% | 184% | -12% | 124% | -11% | |
| Seq Read (MB/s) | 464.9 | 1420 205% | 2440 425% | 2399 416% | 2276 390% | 2479 433% | 486.2 5% | 2300 395% | 467 ? 0% |
| Seq Write (MB/s) | 465.2 | 1341 188% | 1382 197% | 1343 189% | 2331 401% | 1117 140% | 294.9 -37% | 856 84% | 436 ? -6% |
| 4K Read (MB/s) | 22.96 | 50.5 120% | 49.81 117% | 46.21 101% | 51.4 124% | 51.6 125% | 26.66 16% | 26.75 17% | 22.8 ? -1% |
| 4K Write (MB/s) | 89.1 | 107.4 21% | 114.4 28% | 109.4 23% | 128.6 44% | 124.8 40% | 79.2 -11% | 90 1% | 73.7 ? -17% |
| 4K-64 Read (MB/s) | 350.5 | 1447 313% | 1329 279% | 664 89% | 1561 345% | 1663 374% | 316.1 -10% | 813 132% | 314 ? -10% |
| 4K-64 Write (MB/s) | 313.3 | 1704 444% | 1456 365% | 1020 226% | 1273 306% | 438.4 40% | 248.1 -21% | 908 190% | 254 ? -19% |
| Access Time Read * (ms) | 0.045 | 0.045 | 0.056 | 0.044 | 0.061 | 0.112 | 0.059 | 0.071 ? | |
| Access Time Write * (ms) | 0.047 | 0.035 26% | 0.033 30% | 0.033 30% | 0.03 36% | 0.028 40% | 0.056 -19% | 0.055 -17% | 0.056 ? -19% |
| Score Read (Points) | 420 | 1639 290% | 1623 286% | 950 126% | 1840 338% | 1963 367% | 391 -7% | 1070 155% | 384 ? -9% |
| Score Write (Points) | 449 | 1945 333% | 1708 280% | 1264 182% | 1635 264% | 675 50% | 357 -20% | 1084 141% | 371 ? -17% |
| Score Total (Points) | 1090 | 4425 306% | 4115 278% | 2659 144% | 4424 306% | 3576 228% | 947 -13% | 2630 141% | 956 ? -12% |
| Copy ISO MB/s (MB/s) | 1412 | 1688 | 263 ? | ||||||
| Copy Program MB/s (MB/s) | 387.5 | 326.2 | 174.4 ? | ||||||
| Copy Game MB/s (MB/s) | 1110 | 905 | 222 ? | ||||||
| CrystalDiskMark 5.2 / 6 | 94% | 232% | 171% | 209% | 189% | -18% | 138% | -8% | |
| Write 4K (MB/s) | 113.3 | 123.2 9% | 144.2 27% | 98.6 -13% | 137.6 21% | 195.1 72% | 79.4 -30% | 96.1 -15% | 95.5 ? -16% |
| Read 4K (MB/s) | 28.65 | 44.43 55% | 45.55 59% | 39.75 39% | 47.05 64% | 48.5 69% | 27.37 -4% | 31.12 9% | 27.1 ? -5% |
| Write Seq (MB/s) | 428.7 | 845 97% | 1803 321% | 1757 310% | 2372 453% | 1226 186% | 343.9 -20% | 919 114% | 422 ? -2% |
| Read Seq (MB/s) | 435.2 | 865 99% | 2335 437% | 1169 169% | 1568 260% | 1763 305% | 472.7 9% | 2089 380% | 448 ? 3% |
| Write 4K Q32T1 (MB/s) | 274.6 | 287.3 5% | 701 155% | 333.8 22% | 204.5 -26% | 547 99% | 206 -25% | 425.6 55% | 239 ? -13% |
| Read 4K Q32T1 (MB/s) | 326.5 | 360.9 11% | 442.4 35% | 268 -18% | 350.8 7% | 633 94% | 188.3 -42% | 275.3 -16% | 284 ? -13% |
| Write Seq Q32T1 (MB/s) | 505 | 1718 240% | 1917 280% | 2069 310% | 2395 374% | 1226 143% | 343.3 -32% | 958 90% | 469 ? -7% |
| Read Seq Q32T1 (MB/s) | 530 | 1779 236% | 3399 541% | 3426 546% | 3286 520% | 3421 545% | 533 1% | 3118 488% | 479 ? -10% |
| Média Total (Programa/Configurações) | 160% /
167% | 231% /
230% | 162% /
161% | 232% /
235% | 187% /
186% | -15% /
-14% | 131% /
130% | -10% /
-10% |
* ... menor é melhor

| 3DMark | |
| 1280x720 Cloud Gate Standard Graphics | |
| Dell Precision 5530 2-in-1 | |
| Média da turma Office (11640 - 118515, n=37, últimos 2 anos) | |
| Asus VivoBook S15 S530UN-BQ097T | |
| Lenovo ThinkPad A285-20MX0002GE | |
| HP Pavilion 15-cs0003ng | |
| HP EliteBook 735 G5 3UN62EA | |
| Dell Latitude 15 3590-K8JP | |
| Média Intel UHD Graphics 620 (6205 - 16400, n=225) | |
| Acer TravelMate X3410-M-866T | |
| 1920x1080 Fire Strike Graphics | |
| Dell Precision 5530 2-in-1 | |
| Média da turma Office (736 - 21871, n=72, últimos 2 anos) | |
| Lenovo ThinkPad X1 Tablet G3-20KJ001NGE | |
| Asus VivoBook S15 S530UN-BQ097T | |
| HP Pavilion 15-cs0003ng | |
| Lenovo ThinkPad A285-20MX0002GE | |
| Dell Latitude 15 3590-K8JP | |
| HP EliteBook 735 G5 3UN62EA | |
| Média Intel UHD Graphics 620 (557 - 2608, n=213) | |
| Acer TravelMate X3410-M-866T | |
| 3DMark 11 Performance | 1702 pontos | |
| 3DMark Cloud Gate Standard Score | 7673 pontos | |
| 3DMark Fire Strike Score | 1012 pontos | |
Ajuda | ||
| baixo | média | alto | ultra | |
|---|---|---|---|---|
| BioShock Infinite (2013) | 46 | 32 | 26 | 16 |
Barulho
| Ocioso |
| 28.2 / 28.2 / 28.2 dB |
| Carga |
| 33.2 / 35.6 dB |
 | ||
30 dB silencioso 40 dB(A) audível 50 dB(A) ruidosamente alto |
||
min: | ||
(+) A temperatura máxima no lado superior é 35.2 °C / 95 F, em comparação com a média de 34.3 °C / 94 F , variando de 21.2 a 62.5 °C para a classe Office.
(+) A parte inferior aquece até um máximo de 39.4 °C / 103 F, em comparação com a média de 36.8 °C / 98 F
(+) Em uso inativo, a temperatura média para o lado superior é 25.7 °C / 78 F, em comparação com a média do dispositivo de 29.5 °C / ### class_avg_f### F.
(+) Os apoios para as mãos e o touchpad são mais frios que a temperatura da pele, com um máximo de 27.8 °C / 82 F e, portanto, são frios ao toque.
(±) A temperatura média da área do apoio para as mãos de dispositivos semelhantes foi 27.5 °C / 81.5 F (-0.3 °C / -0.5 F).
Acer TravelMate X3410-M-866T análise de áudio
(-) | alto-falantes não muito altos (###valor### dB)
Graves 100 - 315Hz
(-) | quase nenhum baixo - em média 18.4% menor que a mediana
(±) | a linearidade dos graves é média (13% delta para a frequência anterior)
Médios 400 - 2.000 Hz
(+) | médios equilibrados - apenas 4% longe da mediana
(±) | a linearidade dos médios é média (8.7% delta para frequência anterior)
Altos 2 - 16 kHz
(+) | agudos equilibrados - apenas 2.4% longe da mediana
(±) | a linearidade dos máximos é média (8.5% delta para frequência anterior)
Geral 100 - 16.000 Hz
(±) | a linearidade do som geral é média (25.8% diferença em relação à mediana)
Comparado com a mesma classe
» 78% de todos os dispositivos testados nesta classe foram melhores, 7% semelhantes, 15% piores
» O melhor teve um delta de 7%, a média foi 21%, o pior foi 53%
Comparado com todos os dispositivos testados
» 79% de todos os dispositivos testados foram melhores, 4% semelhantes, 17% piores
» O melhor teve um delta de 4%, a média foi 24%, o pior foi 134%
Lenovo ThinkPad T480s-20L8S02E00 análise de áudio
(±) | o volume do alto-falante é médio, mas bom (###valor### dB)
Graves 100 - 315Hz
(-) | quase nenhum baixo - em média 19.4% menor que a mediana
(±) | a linearidade dos graves é média (12.1% delta para a frequência anterior)
Médios 400 - 2.000 Hz
(±) | médios mais altos - em média 6.5% maior que a mediana
(±) | a linearidade dos médios é média (9.6% delta para frequência anterior)
Altos 2 - 16 kHz
(+) | agudos equilibrados - apenas 3.5% longe da mediana
(±) | a linearidade dos máximos é média (7.6% delta para frequência anterior)
Geral 100 - 16.000 Hz
(±) | a linearidade do som geral é média (22.1% diferença em relação à mediana)
Comparado com a mesma classe
» 57% de todos os dispositivos testados nesta classe foram melhores, 8% semelhantes, 34% piores
» O melhor teve um delta de 7%, a média foi 21%, o pior foi 53%
Comparado com todos os dispositivos testados
» 64% de todos os dispositivos testados foram melhores, 6% semelhantes, 30% piores
» O melhor teve um delta de 4%, a média foi 24%, o pior foi 134%
| desligado | |
| Ocioso | |
| Carga |
|
Key:
min: | |
| Acer TravelMate X3410-M-866T i5-8550U, UHD Graphics 620, Micron SSD 1100 SED 512GB, M.2 (MTFDDAV512TBN), IPS, 1920x1080, 14" | Lenovo ThinkPad T480-20L50010US i7-8650U, UHD Graphics 620, Samsung SSD PM981 MZVLB512HAJQ, TFT-LCD, 1920x1080, 14" | Lenovo ThinkPad T480s-20L8S02E00 i5-8550U, GeForce MX150, Samsung SSD PM981 MZVLB512HAJQ, IPS LED, 2560x1440, 14" | Toshiba Portege X30T-E-109 i5-8550U, UHD Graphics 620, Samsung SSD PM981 MZVLB1T0HALR, IPS, 1920x1080, 13.3" | Toshiba Tecra X40-D i7-7600U, HD Graphics 620, Samsung PM961 MZVLW256HEHP, IPS, 1920x1080, 14" | Dell Latitude 7490 i5-8350U, UHD Graphics 620, Toshiba KSG60ZMV256G, IPS, 1920x1080, 14" | HP EliteBook 840 G5-3JX61EA i5-8550U, UHD Graphics 620, Toshiba KXG50ZNV1T02, IPS, 1920x1080, 14" | |
|---|---|---|---|---|---|---|---|
| Power Consumption | -13% | -29% | -25% | 9% | 22% | -10% | |
| Idle Minimum * (Watt) | 4.5 | 3.8 16% | 3.4 24% | 4.7 -4% | 5.2 -16% | 2 56% | 3.8 16% |
| Idle Average * (Watt) | 6.3 | 7.7 -22% | 7.5 -19% | 9.4 -49% | 6.9 -10% | 4.7 25% | 8.3 -32% |
| Idle Maximum * (Watt) | 7 | 9.3 -33% | 10.8 -54% | 16 -129% | 7 -0% | 5.7 19% | 10.7 -53% |
| Load Average * (Watt) | 28.7 | 45.7 -59% | 55.4 -93% | 26.4 8% | 24.6 14% | 38.4 -34% | 35.5 -24% |
| Load Maximum * (Watt) | 67.7 | 46.1 32% | 70.3 -4% | 34 50% | 30.1 56% | 38.9 43% | 37 45% |
| Witcher 3 ultra * (Watt) | 34 |
* ... menor é melhor
| Acer TravelMate X3410-M-866T i5-8550U, UHD Graphics 620, 57 Wh | Lenovo ThinkPad T480-20L50010US i7-8650U, UHD Graphics 620, 24 Wh | Lenovo ThinkPad T480s-20L8S02E00 i5-8550U, GeForce MX150, 57 Wh | Lenovo ThinkPad X1 Carbon 2018-20KGS5DU00 i5-8550U, UHD Graphics 620, 57 Wh | Toshiba Portege X30T-E-109 i5-8550U, UHD Graphics 620, Wh | Toshiba Tecra X40-D i7-7600U, HD Graphics 620, 48 Wh | Dell Latitude 7490 i5-8350U, UHD Graphics 620, 60 Wh | HP EliteBook 840 G5-3JX61EA i5-8550U, UHD Graphics 620, 50 Wh | |
|---|---|---|---|---|---|---|---|---|
| Duração da bateria | -29% | -15% | -13% | -11% | -26% | -12% | -28% | |
| Reader / Idle (h) | 20.8 | 22.8 10% | 14.6 -30% | |||||
| WiFi v1.3 (h) | 10.3 | 7.3 -29% | 8.8 -15% | 9 -13% | 9.2 -11% | 6 -42% | 9.1 -12% | 7.4 -28% |
| Load (h) | 2.2 | 1.3 -41% | 2.1 -5% |
Pro
Contra
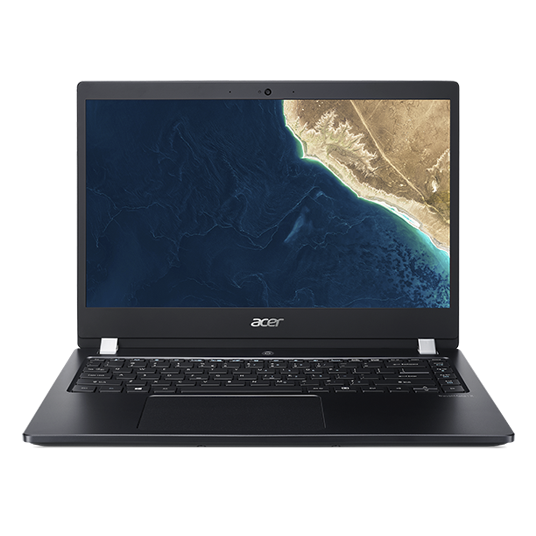
O Acer TravelMate X3410 é um bom exemplo de compromisso. Com um preço de $1.300, o TravelMate X3410 oferece um chassi portátil e bem construído, uma boa quantidade de armazenamento (512 GB) e desempenho adequado para o trabalho de escritório. Dito isto, o dispositivo fica aquém em quase todas as categorias quando comparado com os seus rivais, particularmente o ThinkPad T480s da Lenovo, Latitude 7490 da Dell, e o HP EliteBook 840 G1 da HP.
O teclado do TravelMate é responsivo, mas se sente barato, a tela é fraca e granulada, e o desempenho é fortemente limitado com poucos motivos. A duração da bateria é excelente, mas alguns rivais (como o ThinkPad T480) oferecem várias configurações de bateria para tempos de duração mais longos.
Tudo dito, o TravelMate X3410 é um portátil de negócios "bom o suficiente". Aqueles com um orçamento apertado que querem uma máquina de escritório fina e leve e não se importam em comprometer alguns recursos importantes podem querer olhar para o Acer TravelMate X3410, mas a maioria dos usuários deve pagar algumas centenas de dólares a mais para obter uma máquina melhor.
Acer TravelMate X3410-M-866T
- 01/28/2019 v6 (old)
Sam Medley
Price comparison
