Breve Análise do Portátil HP ZBook 15u G6: A tela 4K de alto contraste encurta a duração da bateria
#compare_competitor
Avaliação | Data | Modelo | Peso | Altura | Size | Resolução | Preço |
|---|---|---|---|---|---|---|---|
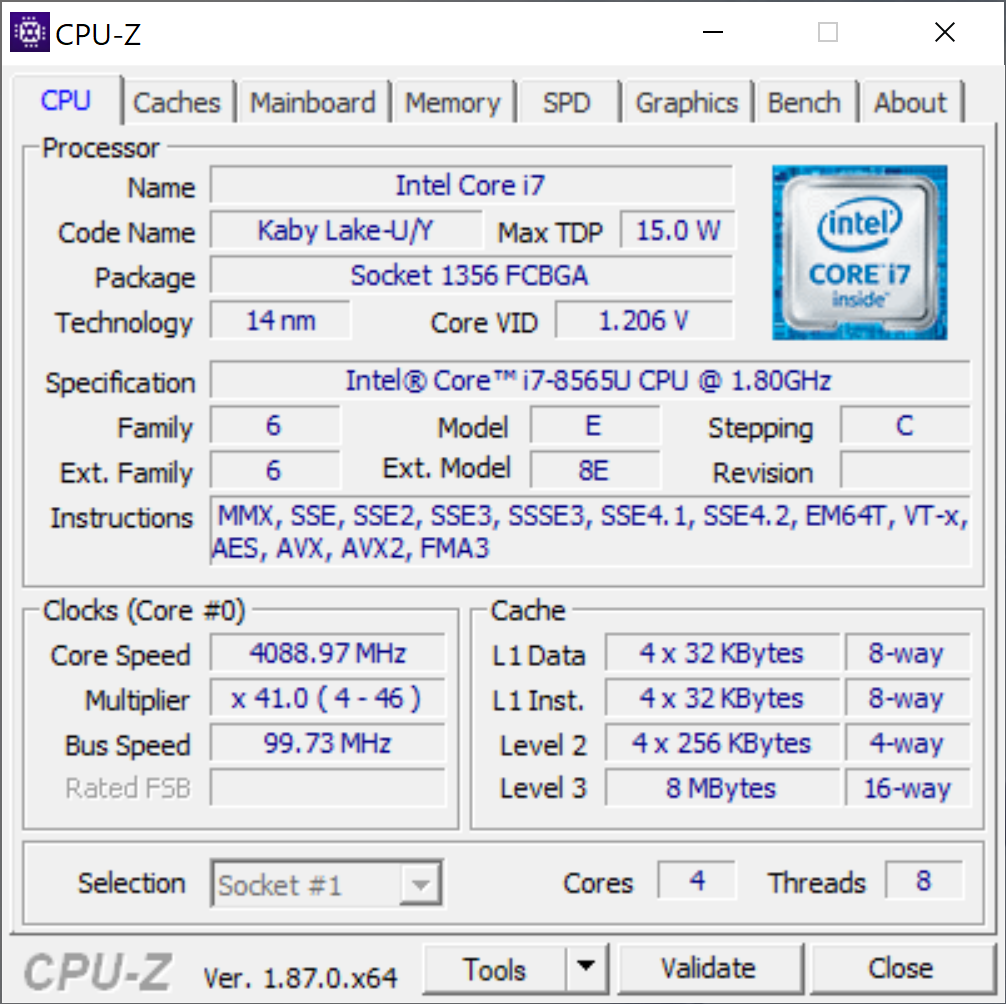
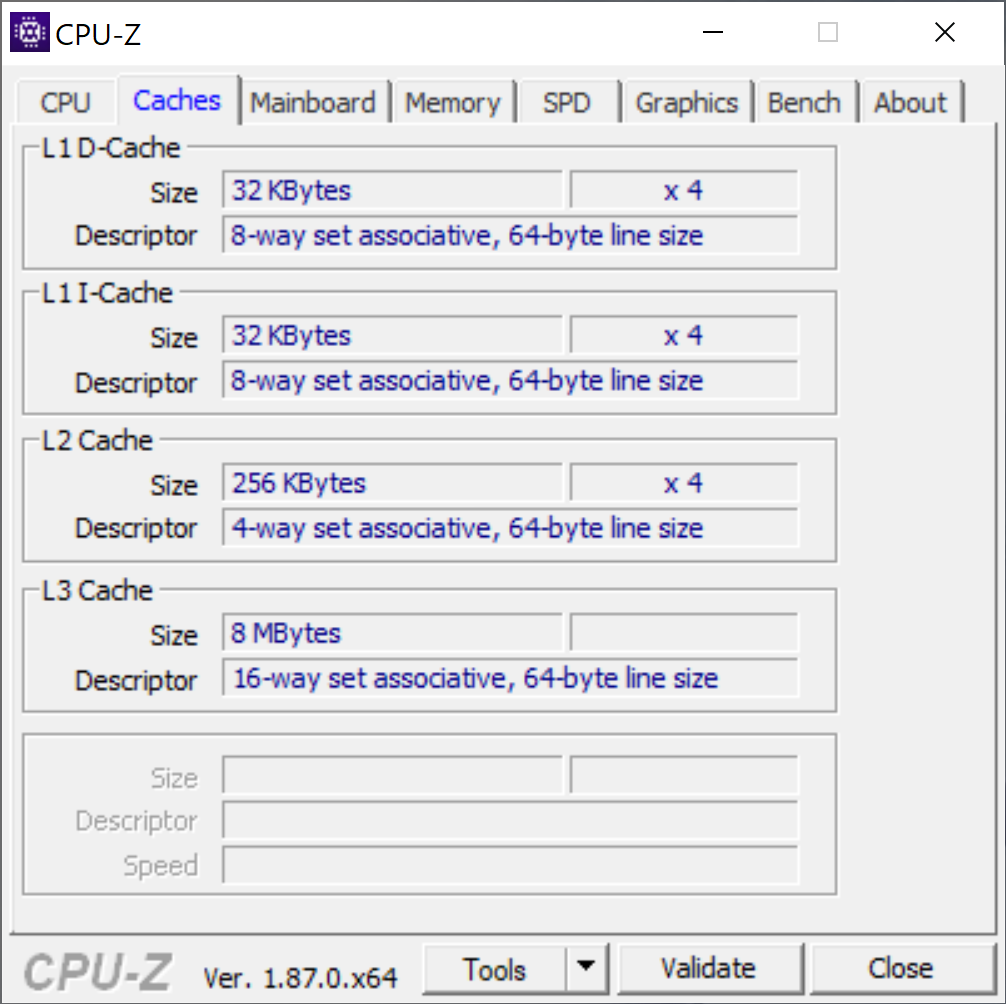
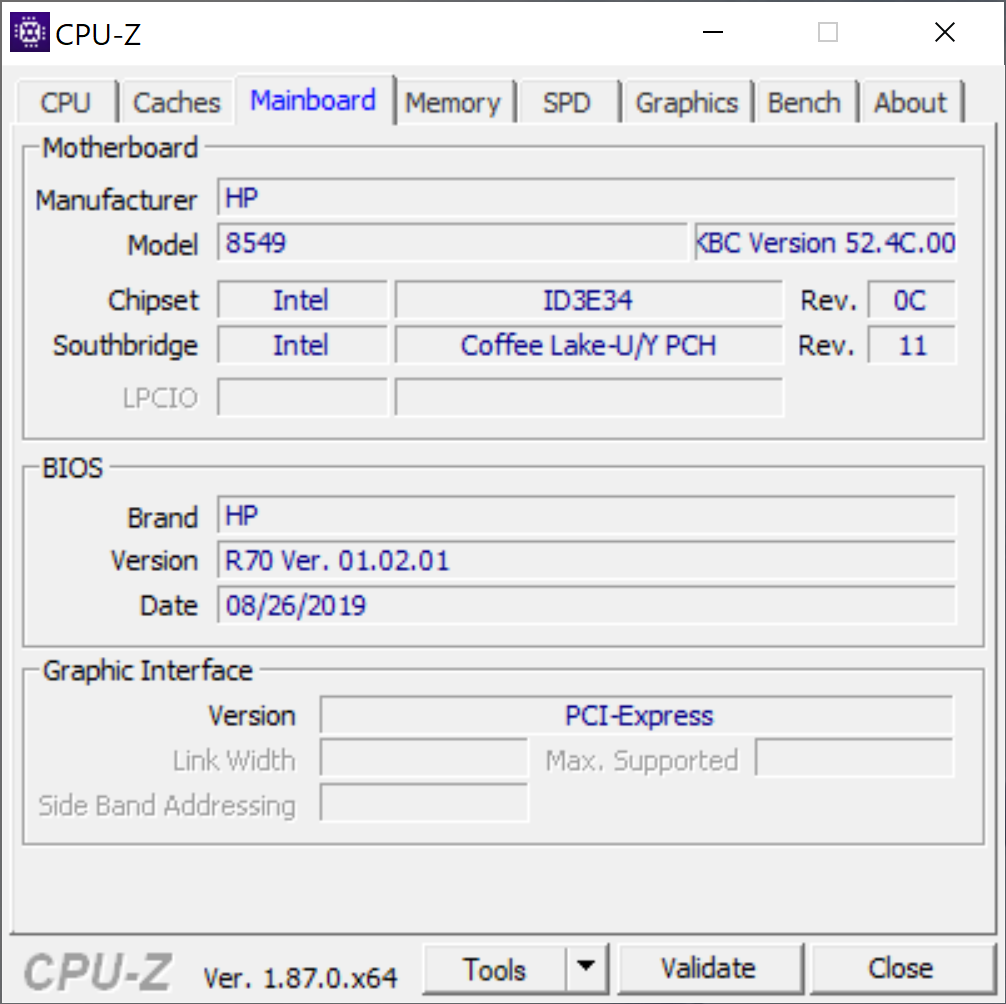
| 80.8 % v7 (old) | 10/2019 | HP ZBook 15u G6 6TP54EA i7-8565U, Radeon Pro WX 3200 | 1.6 kg | 19 mm | 15.60" | 3840x2160 | |
| 87.8 % v7 (old) | 08/2019 | Lenovo ThinkPad P1 2019-20QT000RGE i7-9850H, Quadro T1000 (Laptop) | 1.7 kg | 18.4 mm | 15.60" | 1920x1080 | |
| 85.6 % v6 (old) | Fujitsu Celsius H780 i7-8850H, Quadro P2000 | 2.8 kg | 31.9 mm | 15.60" | 1920x1080 | ||
| 89.2 % v6 (old) | Dell Latitude 5420 Rugged-P85G i7-8650U, Radeon RX 540 | 2.8 kg | 32.9 mm | 14.00" | 1920x1080 | ||
| 80.2 % v6 (old) | 07/2018 | HP ZBook 15u G5 2ZC05EA i5-8550U, Radeon Pro WX 3100 | 1.9 kg | 19 mm | 15.60" | 1920x1080 |

| Networking | |
| iperf3 transmit AX12 | |
| Lenovo ThinkPad P1 2019-20QT000RGE | |
| HP ZBook 15u G6 6TP54EA | |
| Fujitsu Celsius H780 | |
| Dell Latitude 5420 Rugged-P85G | |
| HP ZBook 15u G5 2ZC05EA | |
| iperf3 receive AX12 | |
| Dell Latitude 5420 Rugged-P85G | |
| HP ZBook 15u G6 6TP54EA | |
| HP ZBook 15u G5 2ZC05EA | |
| Fujitsu Celsius H780 | |
| Lenovo ThinkPad P1 2019-20QT000RGE | |
| |||||||||||||||||||||||||
iluminação: 89 %
iluminação com acumulador: 450 cd/m²
Contraste: 1804:1 (Preto: 0.25 cd/m²)
ΔE ColorChecker Calman: 4.4 | ∀{0.5-29.43 Ø4.73}
calibrated: 1.8
ΔE Greyscale Calman: 5 | ∀{0.09-98 Ø4.97}
97% sRGB (Argyll 1.6.3 3D)
63% AdobeRGB 1998 (Argyll 1.6.3 3D)
69.7% AdobeRGB 1998 (Argyll 3D)
97.1% sRGB (Argyll 3D)
69.2% Display P3 (Argyll 3D)
Gamma: 2.31
CCT: 7717 K
| HP ZBook 15u G6 6TP54EA AU Optronics AUO30EB, , 3840x2160, 15.6" | HP ZBook 15u G5 2ZC05EA CMN15E7, , 1920x1080, 15.6" | Lenovo ThinkPad P1 2019-20QT000RGE N156HCE-GN1, , 1920x1080, 15.6" | Fujitsu Celsius H780 LP156WF6-SPP1, , 1920x1080, 15.6" | Dell Latitude 5420 Rugged-P85G AU Optronics AUO523D, , 1920x1080, 14" | |
|---|---|---|---|---|---|
| Display | -36% | -8% | -9% | -8% | |
| Display P3 Coverage (%) | 69.2 | 43.05 -38% | 62.4 -10% | 66.3 -4% | 62.5 -10% |
| sRGB Coverage (%) | 97.1 | 64.7 -33% | 91.5 -6% | 85.9 -12% | 92.4 -5% |
| AdobeRGB 1998 Coverage (%) | 69.7 | 44.5 -36% | 63.4 -9% | 62.8 -10% | 64.2 -8% |
| Response Times | 22% | 52% | 27% | -7% | |
| Response Time Grey 50% / Grey 80% * (ms) | 68.8 ? | 41.6 ? 40% | 34.4 ? 50% | 38 ? 45% | 68 ? 1% |
| Response Time Black / White * (ms) | 29.6 | 28.8 ? 3% | 14 ? 53% | 26.8 ? 9% | 33.6 ? -14% |
| PWM Frequency (Hz) | 25770 ? | 26040 ? | 20830 ? | 735 ? | |
| Screen | -40% | -3% | -20% | -6% | |
| Brightness middle (cd/m²) | 451 | 229 -49% | 542 20% | 271 -40% | 1111.7 146% |
| Brightness (cd/m²) | 434 | 212 -51% | 528 22% | 260 -40% | 1026 136% |
| Brightness Distribution (%) | 89 | 88 -1% | 84 -6% | 86 -3% | 80 -10% |
| Black Level * (cd/m²) | 0.25 | 0.23 8% | 0.41 -64% | 0.29 -16% | 0.81 -224% |
| Contrast (:1) | 1804 | 996 -45% | 1322 -27% | 934 -48% | 1372 -24% |
| Colorchecker dE 2000 * | 4.4 | 4.2 5% | 3.5 20% | 3.9 11% | 3.83 13% |
| Colorchecker dE 2000 max. * | 6.7 | 18 -169% | 7.8 -16% | 10.2 -52% | 7.85 -17% |
| Colorchecker dE 2000 calibrated * | 1.8 | 4.2 -133% | 1.3 28% | 2.9 -61% | 2.98 -66% |
| Greyscale dE 2000 * | 5 | 2 60% | 4.8 4% | 2.6 48% | 5.6 -12% |
| Gamma | 2.31 95% | 2.23 99% | 2.33 94% | 2.29 96% | 2.306 95% |
| CCT | 7717 84% | 6292 103% | 7690 85% | 6517 100% | 7676 85% |
| Color Space (Percent of AdobeRGB 1998) (%) | 63 | 41 -35% | 58.8 -7% | 56.1 -11% | 59 -6% |
| Color Space (Percent of sRGB) (%) | 97 | 64.5 -34% | 91.1 -6% | 85.8 -12% | 93 -4% |
| Média Total (Programa/Configurações) | -18% /
-32% | 14% /
3% | -1% /
-12% | -7% /
-7% |
* ... menor é melhor
Exibir tempos de resposta
| ↔ Tempo de resposta preto para branco | ||
|---|---|---|
| 29.6 ms ... ascensão ↗ e queda ↘ combinadas | ↗ ms ascensão | 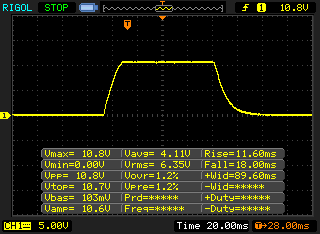 |
| ↘ ms queda | ||
| A tela mostra taxas de resposta relativamente lentas em nossos testes e pode ser muito lenta para os jogadores. Em comparação, todos os dispositivos testados variam de 0.1 (mínimo) a 240 (máximo) ms. » 79 % de todos os dispositivos são melhores. Isso significa que o tempo de resposta medido é pior que a média de todos os dispositivos testados (19.9 ms). | ||
| ↔ Tempo de resposta 50% cinza a 80% cinza | ||
| 68.8 ms ... ascensão ↗ e queda ↘ combinadas | ↗ 33.2 ms ascensão | 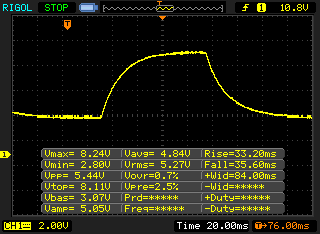 |
| ↘ 35.6 ms queda | ||
| A tela mostra taxas de resposta lentas em nossos testes e será insatisfatória para os jogadores. Em comparação, todos os dispositivos testados variam de 0.165 (mínimo) a 636 (máximo) ms. » 98 % de todos os dispositivos são melhores. Isso significa que o tempo de resposta medido é pior que a média de todos os dispositivos testados (31.1 ms). | ||
Cintilação da tela / PWM (modulação por largura de pulso)
| Tela tremeluzindo / PWM não detectado |  | ||
[pwm_comparison] Em comparação: 52 % de todos os dispositivos testados não usam PWM para escurecer a tela. Se PWM foi detectado, uma média de 7810 (mínimo: 5 - máximo: 343500) Hz foi medida. | |||
| Cinebench R15 | |
| CPU Single 64Bit | |
| Média da turma Workstation (191.4 - 328, n=25, últimos 2 anos) | |
| Lenovo ThinkPad P1 2019-20QT000RGE | |
| Fujitsu Celsius H780 | |
| Média Intel Core i7-8565U (138.3 - 193, n=51) | |
| HP ZBook 15u G5 2ZC05EA | |
| HP ZBook 15u G6 6TP54EA | |
| Dell Latitude 5420 Rugged-P85G | |
| CPU Multi 64Bit | |
| Média da turma Workstation (2489 - 5810, n=25, últimos 2 anos) | |
| Fujitsu Celsius H780 | |
| Lenovo ThinkPad P1 2019-20QT000RGE | |
| Média Intel Core i7-8565U (452 - 815, n=52) | |
| HP ZBook 15u G5 2ZC05EA | |
| HP ZBook 15u G6 6TP54EA | |
| Dell Latitude 5420 Rugged-P85G | |
| PCMark 8 | |
| Home Score Accelerated v2 | |
| Fujitsu Celsius H780 | |
| Dell Latitude 5420 Rugged-P85G | |
| Lenovo ThinkPad P1 2019-20QT000RGE | |
| HP ZBook 15u G5 2ZC05EA | |
| Média Intel Core i7-8565U, AMD Radeon Pro WX 3200 (3257 - 3954, n=2) | |
| HP ZBook 15u G6 6TP54EA | |
| Work Score Accelerated v2 | |
| Lenovo ThinkPad P1 2019-20QT000RGE | |
| Fujitsu Celsius H780 | |
| Dell Latitude 5420 Rugged-P85G | |
| HP ZBook 15u G5 2ZC05EA | |
| Média Intel Core i7-8565U, AMD Radeon Pro WX 3200 (4022 - 4885, n=2) | |
| HP ZBook 15u G6 6TP54EA | |
| PCMark 8 Home Score Accelerated v2 | 3257 pontos | |
| PCMark 8 Work Score Accelerated v2 | 4022 pontos | |
| PCMark 10 Score | 2817 pontos | |
Ajuda | ||
| HP ZBook 15u G6 6TP54EA Samsung SSD PM981 MZVLB512HAJQ | HP ZBook 15u G5 2ZC05EA Toshiba XG5 KXG50ZNV256G | Lenovo ThinkPad P1 2019-20QT000RGE WDC PC SN720 SDAQNTW-512G | Fujitsu Celsius H780 Samsung SSD PM981 MZVLB512HAJQ | Dell Latitude 5420 Rugged-P85G SK hynix PC401 NVMe 500 GB | Média Samsung SSD PM981 MZVLB512HAJQ | |
|---|---|---|---|---|---|---|
| CrystalDiskMark 5.2 / 6 | -25% | 25% | -7% | -26% | 7% | |
| Write 4K (MB/s) | 156 | 98.8 -37% | 162.2 4% | 98.3 -37% | 98.8 -37% | 126.7 ? -19% |
| Read 4K (MB/s) | 45.73 | 33.98 -26% | 43.71 -4% | 40.18 -12% | 38.51 -16% | 44 ? -4% |
| Write Seq (MB/s) | 1158 | 395.7 -66% | 2441 111% | 1777 53% | 843 -27% | 1617 ? 40% |
| Read Seq (MB/s) | 1132 | 2063 82% | 1753 55% | 1247 10% | 1282 13% | 1716 ? 52% |
| Write 4K Q32T1 (MB/s) | 369.2 | 352.3 -5% | 397.6 8% | 344.7 -7% | 355.5 -4% | 413 ? 12% |
| Read 4K Q32T1 (MB/s) | 573 | 281.8 -51% | 520 -9% | 383.1 -33% | 241.4 -58% | 420 ? -27% |
| Write Seq Q32T1 (MB/s) | 1969 | 355 -82% | 2519 28% | 2019 3% | 893 -55% | 2076 ? 5% |
| Read Seq Q32T1 (MB/s) | 3138 | 2775 -12% | 3448 10% | 2076 -34% | 2478 -21% | 3130 ? 0% |
| Write 4K Q8T8 (MB/s) | 361 | 1381 | 1751 | 1264 ? | ||
| Read 4K Q8T8 (MB/s) | 447.3 | 1371 | 1568 | 1193 ? | ||
| AS SSD | -65% | 4% | -10% | -38% | -26% | |
| Seq Read (MB/s) | 2083 | 1696 -19% | 2980 43% | 1049 -50% | 2054 -1% | 1976 ? -5% |
| Seq Write (MB/s) | 1715 | 441 -74% | 2094 22% | 1882 10% | 653 -62% | 1637 ? -5% |
| 4K Read (MB/s) | 55.3 | 31.28 -43% | 45.05 -19% | 48.35 -13% | 39.34 -29% | 50.5 ? -9% |
| 4K Write (MB/s) | 137.6 | 101.5 -26% | 155.4 13% | 102.5 -26% | 96.4 -30% | 112 ? -19% |
| 4K-64 Read (MB/s) | 1211 | 488.4 -60% | 1291 7% | 1395 15% | 677 -44% | 1203 ? -1% |
| 4K-64 Write (MB/s) | 1446 | 564 -61% | 1506 4% | 1789 24% | 982 -32% | 1504 ? 4% |
| Access Time Read * (ms) | 0.039 | 0.103 -164% | 0.064 -64% | 0.066 -69% | 0.044 -13% | 0.05092 ? -31% |
| Access Time Write * (ms) | 0.026 | 0.051 -96% | 0.024 8% | 0.037 -42% | 0.051 -96% | 0.08337 ? -221% |
| Score Read (Points) | 1474 | 689 -53% | 1634 11% | 1549 5% | 921 -38% | 1451 ? -2% |
| Score Write (Points) | 1755 | 710 -60% | 1871 7% | 2080 19% | 1143 -35% | 1780 ? 1% |
| Score Total (Points) | 3976 | 1697 -57% | 4300 8% | 4469 12% | 2475 -38% | 3966 ? 0% |
| Copy ISO MB/s (MB/s) | 1146 | 2015 | 1547 | 1622 | 1755 ? | |
| Copy Program MB/s (MB/s) | 324.8 | 597 | 405.9 | 378.1 | 454 ? | |
| Copy Game MB/s (MB/s) | 742 | 1449 | 1170 | 793 | 1057 ? | |
| Média Total (Programa/Configurações) | -45% /
-48% | 15% /
13% | -9% /
-9% | -32% /
-33% | -10% /
-12% |
* ... menor é melhor

| 3DMark 11 - 1280x720 Performance GPU | |
| Média da turma Workstation (10888 - 69594, n=25, últimos 2 anos) | |
| Lenovo ThinkPad P1 2019-20QT000RGE | |
| Fujitsu Celsius H780 | |
| Dell Latitude 5420 Rugged-P85G | |
| Média AMD Radeon Pro WX 3200 (4256 - 4419, n=2) | |
| HP ZBook 15u G6 6TP54EA | |
| HP ZBook 15u G5 2ZC05EA | |
| 3DMark | |
| 1280x720 Cloud Gate Standard Graphics | |
| Média da turma Workstation (46927 - 152418, n=15, últimos 2 anos) | |
| Lenovo ThinkPad P1 2019-20QT000RGE | |
| Fujitsu Celsius H780 | |
| Dell Latitude 5420 Rugged-P85G | |
| HP ZBook 15u G6 6TP54EA | |
| Média AMD Radeon Pro WX 3200 (18780 - 18952, n=2) | |
| HP ZBook 15u G5 2ZC05EA | |
| 1920x1080 Fire Strike Graphics | |
| Média da turma Workstation (7578 - 52560, n=25, últimos 2 anos) | |
| Lenovo ThinkPad P1 2019-20QT000RGE | |
| Fujitsu Celsius H780 | |
| Dell Latitude 5420 Rugged-P85G | |
| Média AMD Radeon Pro WX 3200 (3088 - 3224, n=2) | |
| HP ZBook 15u G6 6TP54EA | |
| HP ZBook 15u G5 2ZC05EA | |
| 2560x1440 Time Spy Graphics | |
| Média da turma Workstation (2725 - 24806, n=25, últimos 2 anos) | |
| Lenovo ThinkPad P1 2019-20QT000RGE | |
| Média AMD Radeon Pro WX 3200 (938 - 973, n=2) | |
| HP ZBook 15u G6 6TP54EA | |
| Dell Latitude 5420 Rugged-P85G | |
| Unigine Valley 1.0 | |
| 1920x1080 Extreme HD DirectX AA:x8 | |
| Média da turma Workstation (n=1últimos 2 anos) | |
| Lenovo ThinkPad P1 2019-20QT000RGE | |
| Fujitsu Celsius H780 | |
| HP ZBook 15u G6 6TP54EA | |
| Média AMD Radeon Pro WX 3200 (n=1) | |
| HP ZBook 15u G5 2ZC05EA | |
| 1920x1080 Extreme HD Preset OpenGL AA:x8 | |
| Média da turma Workstation (n=1últimos 2 anos) | |
| Lenovo ThinkPad P1 2019-20QT000RGE | |
| Fujitsu Celsius H780 | |
| HP ZBook 15u G6 6TP54EA | |
| Média AMD Radeon Pro WX 3200 (n=1) | |
| HP ZBook 15u G5 2ZC05EA | |
| Unigine Heaven 4.0 | |
| Extreme Preset OpenGL | |
| Média da turma Workstation (72.4 - 185.3, n=4, últimos 2 anos) | |
| Lenovo ThinkPad P1 2019-20QT000RGE | |
| Fujitsu Celsius H780 | |
| HP ZBook 15u G6 6TP54EA | |
| Média AMD Radeon Pro WX 3200 (n=1) | |
| HP ZBook 15u G5 2ZC05EA | |
| Extreme Preset DX11 | |
| Média da turma Workstation (77.7 - 222, n=4, últimos 2 anos) | |
| Lenovo ThinkPad P1 2019-20QT000RGE | |
| Fujitsu Celsius H780 | |
| HP ZBook 15u G6 6TP54EA | |
| Média AMD Radeon Pro WX 3200 (n=1) | |
| HP ZBook 15u G5 2ZC05EA | |
| 3DMark 06 Standard Score | 16604 pontos | |
| 3DMark Vantage P Result | 12538 pontos | |
| 3DMark 11 Performance | 4592 pontos | |
| 3DMark Cloud Gate Standard Score | 11979 pontos | |
| 3DMark Fire Strike Score | 2822 pontos | |
| 3DMark Time Spy Score | 1039 pontos | |
Ajuda | ||
| The Witcher 3 | |
| 1366x768 Medium Graphics & Postprocessing | |
| Média da turma Workstation (81.6 - 175, n=2, últimos 2 anos) | |
| Lenovo ThinkPad P1 2019-20QT000RGE | |
| Fujitsu Celsius H780 | |
| Dell Latitude 5420 Rugged-P85G | |
| Média AMD Radeon Pro WX 3200 (26.5 - 35.6, n=2) | |
| HP ZBook 15u G5 2ZC05EA | |
| HP ZBook 15u G6 6TP54EA | |
| 1920x1080 High Graphics & Postprocessing (Nvidia HairWorks Off) | |
| Média da turma Workstation (53.4 - 156.4, n=3, últimos 2 anos) | |
| Lenovo ThinkPad P1 2019-20QT000RGE | |
| Fujitsu Celsius H780 | |
| HP ZBook 15u G5 2ZC05EA | |
| Média AMD Radeon Pro WX 3200 (12.3 - 18, n=2) | |
| HP ZBook 15u G6 6TP54EA | |
| Dell Latitude 5420 Rugged-P85G | |
| 1920x1080 Ultra Graphics & Postprocessing (HBAO+) | |
| Média da turma Workstation (26.3 - 91.7, n=3, últimos 2 anos) | |
| Lenovo ThinkPad P1 2019-20QT000RGE | |
| Fujitsu Celsius H780 | |
| Média AMD Radeon Pro WX 3200 (9.4 - 11.2, n=2) | |
| HP ZBook 15u G6 6TP54EA | |
| HP ZBook 15u G5 2ZC05EA | |
| Dell Latitude 5420 Rugged-P85G | |
| BioShock Infinite | |
| 1280x720 Very Low Preset | |
| Lenovo ThinkPad P1 2019-20QT000RGE | |
| Média AMD Radeon Pro WX 3200 (n=1) | |
| HP ZBook 15u G5 2ZC05EA | |
| Dell Latitude 5420 Rugged-P85G | |
| 1366x768 Medium Preset | |
| Lenovo ThinkPad P1 2019-20QT000RGE | |
| Média AMD Radeon Pro WX 3200 (n=1) | |
| Dell Latitude 5420 Rugged-P85G | |
| HP ZBook 15u G5 2ZC05EA | |
| Thief | |
| 1024x768 Very Low Preset | |
| Dell Latitude 5420 Rugged-P85G | |
| 1366x768 Normal Preset AA:FX | |
| Dell Latitude 5420 Rugged-P85G | |
| HP ZBook 15u G6 6TP54EA | |
| Média AMD Radeon Pro WX 3200 (n=1) | |
| 1366x768 High Preset AA:FXAA & Low SS AF:4x | |
| Dell Latitude 5420 Rugged-P85G | |
| HP ZBook 15u G6 6TP54EA | |
| Média AMD Radeon Pro WX 3200 (n=1) | |
| Rise of the Tomb Raider | |
| 1024x768 Lowest Preset | |
| Lenovo ThinkPad P1 2019-20QT000RGE | |
| Dell Latitude 5420 Rugged-P85G | |
| HP ZBook 15u G6 6TP54EA | |
| Média AMD Radeon Pro WX 3200 (n=1) | |
| HP ZBook 15u G5 2ZC05EA | |
| 1366x768 Medium Preset AF:2x | |
| Lenovo ThinkPad P1 2019-20QT000RGE | |
| Dell Latitude 5420 Rugged-P85G | |
| HP ZBook 15u G6 6TP54EA | |
| Média AMD Radeon Pro WX 3200 (n=1) | |
| HP ZBook 15u G5 2ZC05EA | |
| 1920x1080 High Preset AA:FX AF:4x | |
| Lenovo ThinkPad P1 2019-20QT000RGE | |
| Dell Latitude 5420 Rugged-P85G | |
| HP ZBook 15u G6 6TP54EA | |
| Média AMD Radeon Pro WX 3200 (n=1) | |
| HP ZBook 15u G5 2ZC05EA | |
| Far Cry 5 | |
| 1280x720 Low Preset AA:T | |
| Média da turma Workstation (75 - 168, n=9, últimos 2 anos) | |
| HP ZBook 15u G6 6TP54EA | |
| Média AMD Radeon Pro WX 3200 (n=1) | |
| Dell Latitude 5420 Rugged-P85G | |
| 1920x1080 Medium Preset AA:T | |
| Média da turma Workstation (42 - 148, n=11, últimos 2 anos) | |
| Dell Latitude 5420 Rugged-P85G | |
| HP ZBook 15u G6 6TP54EA | |
| Média AMD Radeon Pro WX 3200 (n=1) | |
| 1920x1080 High Preset AA:T | |
| Média da turma Workstation (39 - 138, n=11, últimos 2 anos) | |
| Dell Latitude 5420 Rugged-P85G | |
| HP ZBook 15u G6 6TP54EA | |
| Média AMD Radeon Pro WX 3200 (n=1) | |
| 1920x1080 Ultra Preset AA:T | |
| Média da turma Workstation (37 - 128, n=11, últimos 2 anos) | |
| Dell Latitude 5420 Rugged-P85G | |
| HP ZBook 15u G6 6TP54EA | |
| Média AMD Radeon Pro WX 3200 (n=1) | |
| baixo | média | alto | ultra | 4K | |
|---|---|---|---|---|---|
| BioShock Infinite (2013) | 81.6 | 29.16 | |||
| Thief (2014) | 36.4 | 34.9 | 19.9 | ||
| The Witcher 3 (2015) | 26.5 | 12.3 | 9.4 | 5.2 | |
| Dota 2 Reborn (2015) | 98 | 87 | 48 | 45 | 9.4 |
| Rise of the Tomb Raider (2016) | 50.6 | 36.22 | 18.54 | ||
| X-Plane 11.11 (2018) | 25.4 | 16.7 | 15.2 | ||
| Far Cry 5 (2018) | 43 | 20 | 18 | 17 |
Barulho
| Ocioso |
| 29.7 / 29.7 / 30.3 dB |
| Carga |
| 32.6 / 36.1 dB |
 | ||
30 dB silencioso 40 dB(A) audível 50 dB(A) ruidosamente alto |
||
min: | ||
(±) A temperatura máxima no lado superior é 40.5 °C / 105 F, em comparação com a média de 38.2 °C / 101 F , variando de 22.2 a 69.8 °C para a classe Workstation.
(±) A parte inferior aquece até um máximo de 44.9 °C / 113 F, em comparação com a média de 41.1 °C / 106 F
(+) Em uso inativo, a temperatura média para o lado superior é 24 °C / 75 F, em comparação com a média do dispositivo de 32 °C / ### class_avg_f### F.
(±) Jogando The Witcher 3, a temperatura média para o lado superior é 35.5 °C / 96 F, em comparação com a média do dispositivo de 32 °C / ## #class_avg_f### F.
(+) Os apoios para as mãos e o touchpad são mais frios que a temperatura da pele, com um máximo de 31.6 °C / 88.9 F e, portanto, são frios ao toque.
(-) A temperatura média da área do apoio para as mãos de dispositivos semelhantes foi 27.8 °C / 82 F (-3.8 °C / -6.9 F).
HP ZBook 15u G6 6TP54EA análise de áudio
(±) | o volume do alto-falante é médio, mas bom (###valor### dB)
Graves 100 - 315Hz
(-) | quase nenhum baixo - em média 17.7% menor que a mediana
(±) | a linearidade dos graves é média (12.6% delta para a frequência anterior)
Médios 400 - 2.000 Hz
(+) | médios equilibrados - apenas 3.2% longe da mediana
(+) | médios são lineares (5.9% delta para frequência anterior)
Altos 2 - 16 kHz
(+) | agudos equilibrados - apenas 2.6% longe da mediana
(+) | os máximos são lineares (6.3% delta da frequência anterior)
Geral 100 - 16.000 Hz
(±) | a linearidade do som geral é média (18.7% diferença em relação à mediana)
Comparado com a mesma classe
» 63% de todos os dispositivos testados nesta classe foram melhores, 8% semelhantes, 29% piores
» O melhor teve um delta de 7%, a média foi 17%, o pior foi 35%
Comparado com todos os dispositivos testados
» 43% de todos os dispositivos testados foram melhores, 8% semelhantes, 50% piores
» O melhor teve um delta de 4%, a média foi 24%, o pior foi 134%
Apple MacBook 12 (Early 2016) 1.1 GHz análise de áudio
(+) | os alto-falantes podem tocar relativamente alto (###valor### dB)
Graves 100 - 315Hz
(±) | graves reduzidos - em média 11.3% menor que a mediana
(±) | a linearidade dos graves é média (14.2% delta para a frequência anterior)
Médios 400 - 2.000 Hz
(+) | médios equilibrados - apenas 2.4% longe da mediana
(+) | médios são lineares (5.5% delta para frequência anterior)
Altos 2 - 16 kHz
(+) | agudos equilibrados - apenas 2% longe da mediana
(+) | os máximos são lineares (4.5% delta da frequência anterior)
Geral 100 - 16.000 Hz
(+) | o som geral é linear (10.2% diferença em relação à mediana)
Comparado com a mesma classe
» 7% de todos os dispositivos testados nesta classe foram melhores, 2% semelhantes, 91% piores
» O melhor teve um delta de 5%, a média foi 18%, o pior foi 53%
Comparado com todos os dispositivos testados
» 5% de todos os dispositivos testados foram melhores, 1% semelhantes, 94% piores
» O melhor teve um delta de 4%, a média foi 24%, o pior foi 134%
| desligado | |
| Ocioso | |
| Carga |
|
Key:
min: | |
| HP ZBook 15u G6 6TP54EA i7-8565U, Radeon Pro WX 3200, Samsung SSD PM981 MZVLB512HAJQ, IPS, 3840x2160, 15.6" | HP ZBook 15u G5 2ZC05EA i5-8550U, Radeon Pro WX 3100, Toshiba XG5 KXG50ZNV256G, IPS LED, 1920x1080, 15.6" | Dell Latitude 5420 Rugged-P85G i7-8650U, Radeon RX 540, SK hynix PC401 NVMe 500 GB, IPS, 1920x1080, 14" | Acer Swift 3 SF314-55G-768V i7-8565U, GeForce MX250, WDC PC SN520 SDAPNUW-512G, IPS, 1920x1080, 14" | Lenovo ThinkPad P1 2019-20QT000RGE i7-9850H, Quadro T1000 (Laptop), WDC PC SN720 SDAQNTW-512G, IPS LED, 1920x1080, 15.6" | Fujitsu Celsius H780 i7-8850H, Quadro P2000, Samsung SSD PM981 MZVLB512HAJQ, IPS LED, 1920x1080, 15.6" | Média AMD Radeon Pro WX 3200 | Média da turma Workstation | |
|---|---|---|---|---|---|---|---|---|
| Power Consumption | 17% | -21% | 9% | -82% | -59% | 5% | -72% | |
| Idle Minimum * (Watt) | 5.5 | 3.2 42% | 4.8 13% | 7.4 -35% | 13.7 -149% | 9.1 -65% | 4.85 ? 12% | 8.94 ? -63% |
| Idle Average * (Watt) | 9.8 | 6.1 38% | 13.6 -39% | 9.9 -1% | 17.5 -79% | 13.2 -35% | 8.87 ? 9% | 13.8 ? -41% |
| Idle Maximum * (Watt) | 12 | 9.7 19% | 13.8 -15% | 11.7 2% | 20.9 -74% | 14.04 -17% | 11.5 ? 4% | 17.5 ? -46% |
| Load Average * (Watt) | 59 | 62 -5% | 67.8 -15% | 29 51% | 77.2 -31% | 78.8 -34% | 59.1 ? -0% | 95 ? -61% |
| Witcher 3 ultra * (Watt) | 51 | 48 6% | 69.1 -35% | |||||
| Load Maximum * (Watt) | 70 | 71 -1% | 93.5 -34% | 52 26% | 123.7 -77% | 172.5 -146% | 70.3 ? -0% | 175.2 ? -150% |
* ... menor é melhor
| HP ZBook 15u G6 6TP54EA i7-8565U, Radeon Pro WX 3200, 56 Wh | HP ZBook 15u G5 2ZC05EA i5-8550U, Radeon Pro WX 3100, 56 Wh | Dell Latitude 5420 Rugged-P85G i7-8650U, Radeon RX 540, 102 Wh | Acer Swift 3 SF314-55G-768V i7-8565U, GeForce MX250, 50.7 Wh | Lenovo ThinkPad P1 2019-20QT000RGE i7-9850H, Quadro T1000 (Laptop), 80 Wh | Fujitsu Celsius H780 i7-8850H, Quadro P2000, 96 Wh | Média da turma Workstation | |
|---|---|---|---|---|---|---|---|
| Duração da bateria | 48% | 109% | 7% | -7% | 9% | 32% | |
| Reader / Idle (h) | 12.4 | 21.7 75% | 31.4 153% | 16.1 30% | 26.1 ? 110% | ||
| WiFi v1.3 (h) | 6.9 | 8.6 25% | 16.2 135% | 8.1 17% | 8.9 29% | 7.5 9% | 8.53 ? 24% |
| Load (h) | 2.3 | 3.3 43% | 3.2 39% | 1.7 -26% | 1.3 -43% | 1.429 ? -38% |
Pro
Contra
Veredicto - apenas em algumas circunstâncias esta atualização de hardware poderia valer a mudança
O HP ZBook 15u G6 oferece apenas um ligeiro aumento no desempenho em comparação com o seu antecessor. Ficamos particularmente desapontados com o desempenho da CPU em comparação com o ZBook 15u G5. A GPU AMD Radeon Pro WX 3200, por outro lado, tem um melhor desempenho e o dispositivo de armazenamento incluído também se sai bem nos benchmarks. Ficamos particularmente impressionados com a tela 4K, que oferece alta luminosidade, cores vivas e uma taxa de contraste muito boa. A superfície mate possibilita que os usuários usem o dispositivo em exteriores sem precisar lidar com reflexões incômodas.
A HP não fez muitas alterações no ZBook 15u G6. Enquanto estamos um pouco decepcionados com a atualização do hardware, a tela 4K é ótima.
Como as inovações são limitadas ao interior do ZBook 15u G6, os compradores receberão a carcaça de alta qualidade habitual e dispositivos de entrada muito bons. A seleção de portas intermediárias pode ser facilmente expandida graças à porta Thunderbolt 3 e as velocidades de Wi-Fi são rápidas neste workstation HP. Isso ainda torna a falta de opções de manutenção mais facilmente aceitável. Os usuários que já estão utilizando o ZBook 15u G5 só serão beneficiados com a mudança para o sucessor se o melhor desempenho gráfico afetar o uso diário.
HP ZBook 15u G6 6TP54EA
- 10/08/2019 v7 (old)
Mike Wobker
Price comparison
