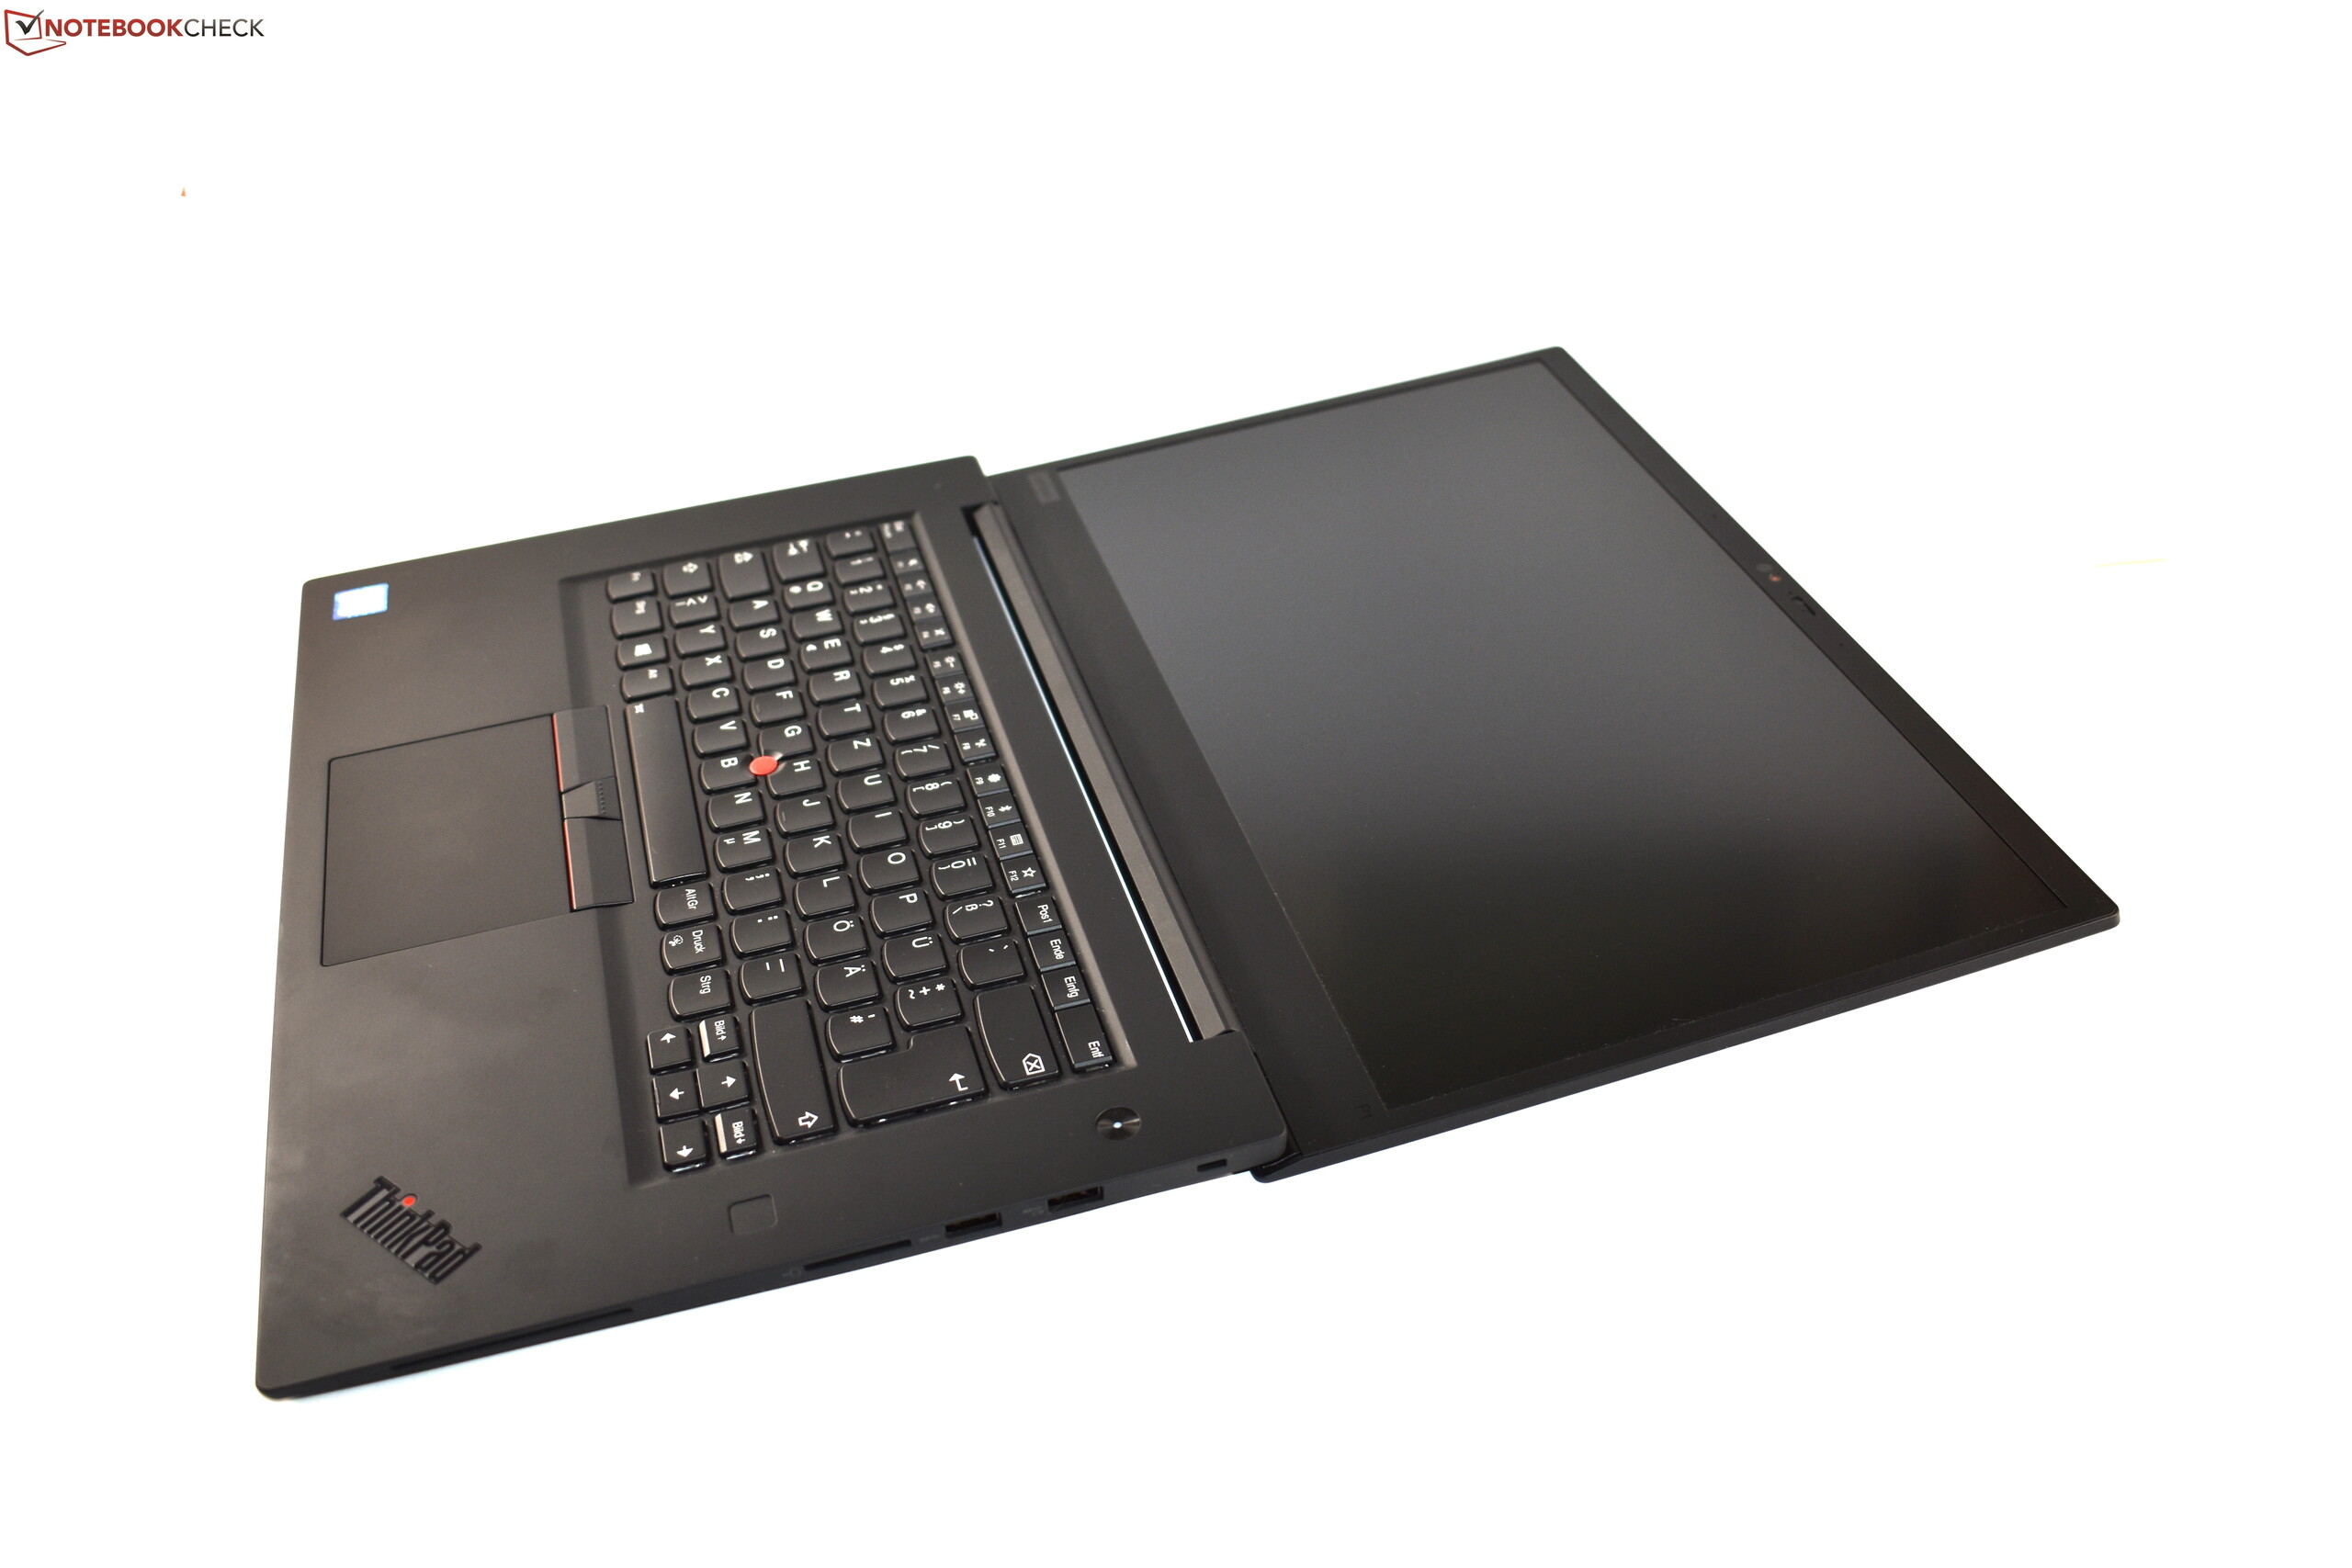
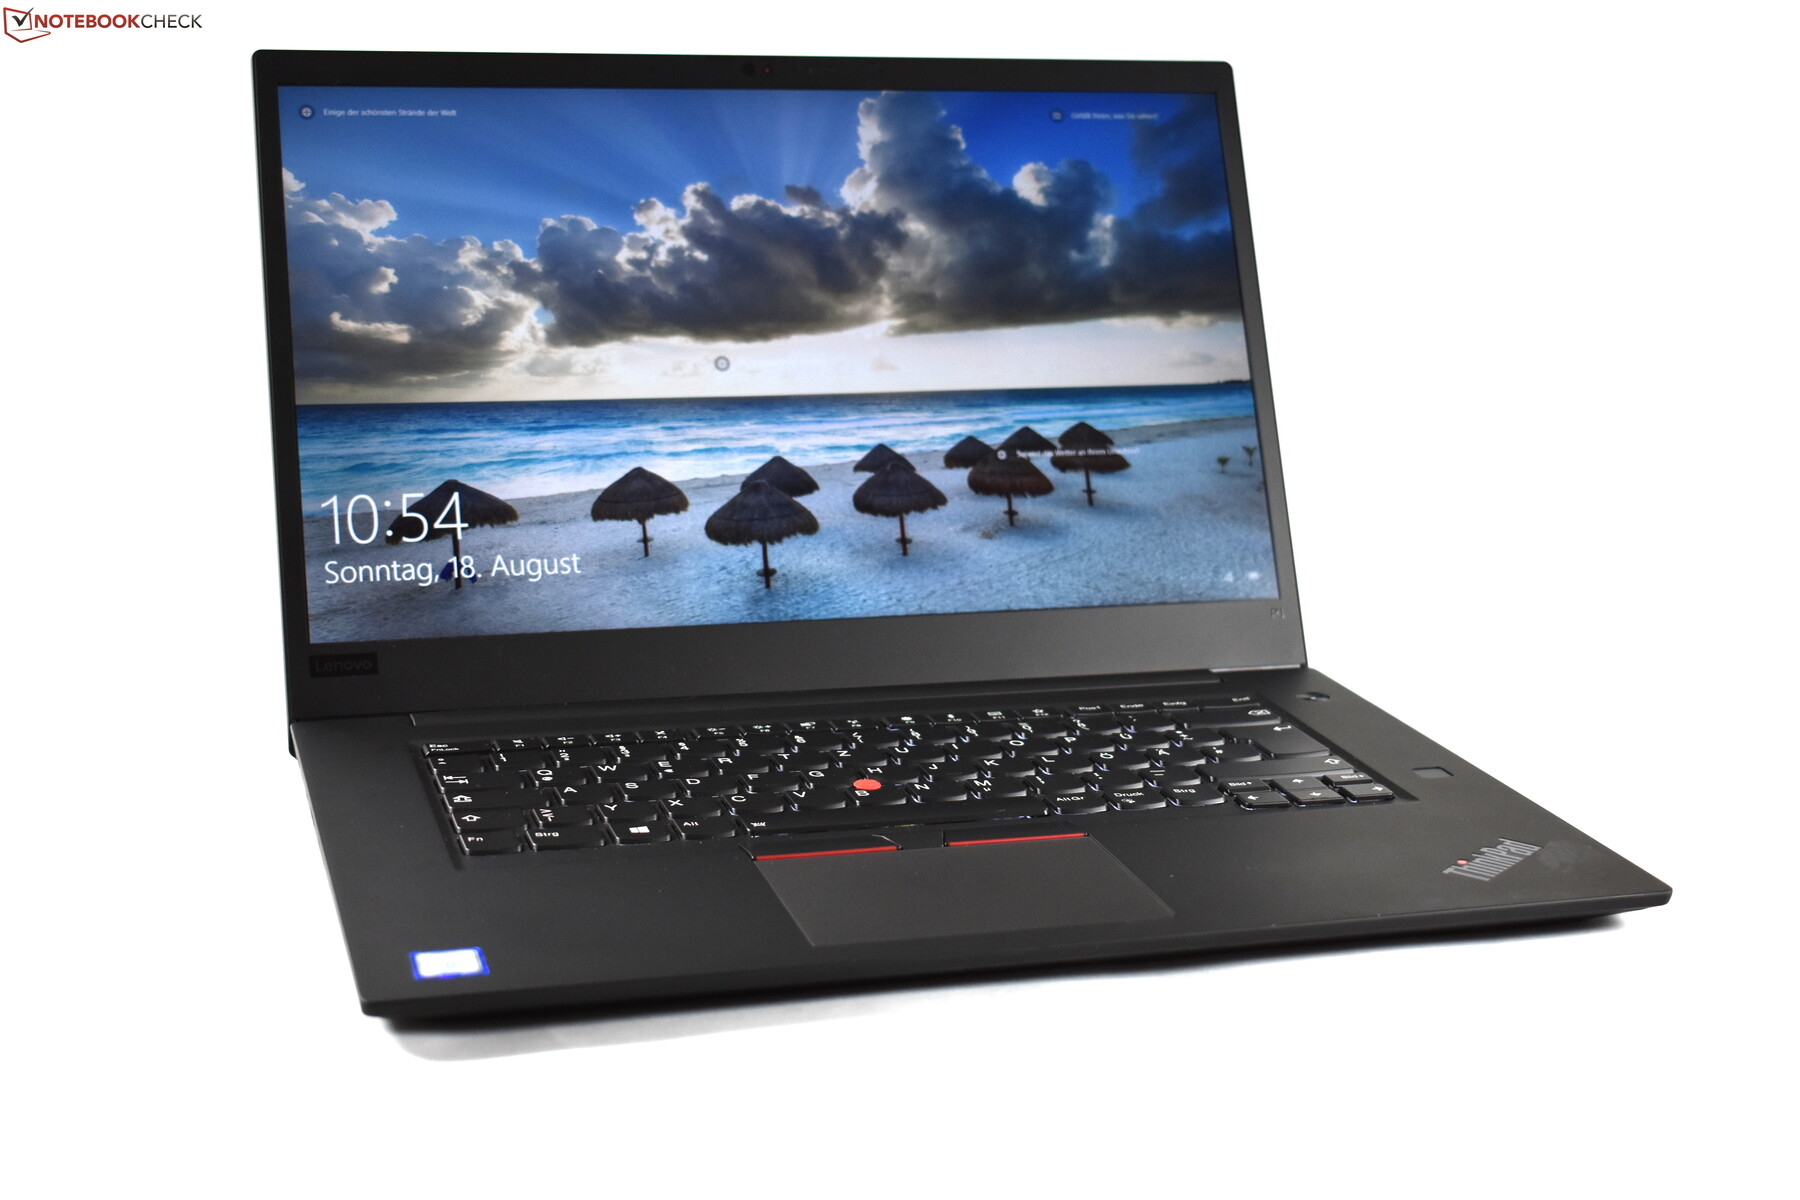
Breve Análise do Portátil Lenovo ThinkPad P1 2019: Workstation fino com GPU mais potente e CPU mais fraca

| SD Card Reader | |
| average JPG Copy Test (av. of 3 runs) | |
| Lenovo ThinkPad P1 2019-20QT000RGE (Toshiba Exceria Pro SDXC 64 GB UHS-II) | |
| HP ZBook Studio G5-4QH10EA (Toshiba Exceria Pro SDXC 64 GB UHS-II) | |
| Dell XPS 15 7590 9980HK GTX 1650 (Toshiba Exceria Pro SDXC 64 GB UHS-II) | |
| Dell Precision 5530 Xeon E-2176M (Toshiba Exceria Pro SDXC 64 GB UHS-II) | |
| Média da turma Workstation (49.6 - 681, n=14, últimos 2 anos) | |
| maximum AS SSD Seq Read Test (1GB) | |
| Média da turma Workstation (87.6 - 1455, n=14, últimos 2 anos) | |
| HP ZBook Studio G5-4QH10EA (Toshiba Exceria Pro SDXC 64 GB UHS-II) | |
| Lenovo ThinkPad P1 2019-20QT000RGE (Toshiba Exceria Pro SDXC 64 GB UHS-II) | |
| Dell XPS 15 7590 9980HK GTX 1650 (Toshiba Exceria Pro SDXC 64 GB UHS-II) | |
| Dell Precision 5530 Xeon E-2176M (Toshiba Exceria Pro SDXC 64 GB UHS-II) | |
| |||||||||||||||||||||||||
iluminação: 84 %
iluminação com acumulador: 521 cd/m²
Contraste: 1322:1 (Preto: 0.41 cd/m²)
ΔE ColorChecker Calman: 3.5 | ∀{0.5-29.43 Ø4.72}
calibrated: 1.3
ΔE Greyscale Calman: 4.8 | ∀{0.09-98 Ø4.97}
91.1% sRGB (Argyll 1.6.3 3D)
58.8% AdobeRGB 1998 (Argyll 1.6.3 3D)
63.4% AdobeRGB 1998 (Argyll 3D)
91.5% sRGB (Argyll 3D)
62.4% Display P3 (Argyll 3D)
Gamma: 2.33
CCT: 7690 K
| Lenovo ThinkPad P1 2019-20QT000RGE N156HCE-GN1, , 1920x1080, 15.6" | Lenovo ThinkPad X1 Extreme-20MF000RGE NV156FHM-N61, , 1920x1080, 15.6" | Dell XPS 15 7590 i5 iGPU FHD LQ156M1, , 1920x1080, 15.6" | Dell Precision 5530 Xeon E-2176M Sharp SHP148D / LQ156D1, , 3840x2160, 15.6" | HP ZBook Studio G5-4QH10EA AUO30EB, , 3840x2160, 15.6" | Dell XPS 15 7590 9980HK GTX 1650 Samsung 156WR04, SDCA029, , 3840x2160, 15.6" | |
|---|---|---|---|---|---|---|
| Display | 3% | 7% | 17% | 8% | 32% | |
| Display P3 Coverage (%) | 62.4 | 68.6 10% | 66.5 7% | 76.5 23% | 68.2 9% | 88.1 41% |
| sRGB Coverage (%) | 91.5 | 88.7 -3% | 98 7% | 98.4 8% | 96.2 5% | 99.6 9% |
| AdobeRGB 1998 Coverage (%) | 63.4 | 64.8 2% | 68.4 8% | 76.4 21% | 68.8 9% | 91.8 45% |
| Response Times | -105% | -91% | -90% | -106% | 88% | |
| Response Time Grey 50% / Grey 80% * (ms) | 34.4 ? | 52.8 ? -53% | 52.8 ? -53% | 48 ? -40% | 60.8 ? -77% | 2.3 ? 93% |
| Response Time Black / White * (ms) | 14 ? | 36 ? -157% | 32 ? -129% | 33.6 ? -140% | 32.8 ? -134% | 2.4 ? 83% |
| PWM Frequency (Hz) | 26040 ? | 21370 ? | 1020 ? | 1000 | 59.5 ? | |
| Screen | -26% | 14% | -12% | -5% | -8% | |
| Brightness middle (cd/m²) | 542 | 331 -39% | 588 8% | 451.7 -17% | 417 -23% | 421.2 -22% |
| Brightness (cd/m²) | 528 | 305 -42% | 555 5% | 440 -17% | 412 -22% | 417 -21% |
| Brightness Distribution (%) | 84 | 84 0% | 89 6% | 90 7% | 85 1% | 94 12% |
| Black Level * (cd/m²) | 0.41 | 0.24 41% | 0.4 2% | 0.4 2% | 0.29 29% | |
| Contrast (:1) | 1322 | 1379 4% | 1470 11% | 1129 -15% | 1438 9% | |
| Colorchecker dE 2000 * | 3.5 | 5.6 -60% | 2.5 29% | 3.11 11% | 4.4 -26% | 6.06 -73% |
| Colorchecker dE 2000 max. * | 7.8 | 9.9 -27% | 6.3 19% | 8.62 -11% | 6.7 14% | 11.89 -52% |
| Colorchecker dE 2000 calibrated * | 1.3 | 3 -131% | 0.6 54% | 3.07 -136% | 1.9 -46% | |
| Greyscale dE 2000 * | 4.8 | 6.3 -31% | 4.5 6% | 3.7 23% | 5 -4% | 2.8 42% |
| Gamma | 2.33 94% | 2.33 94% | 2.2 100% | 2.11 104% | 2.28 96% | 2.15 102% |
| CCT | 7690 85% | 7152 91% | 6836 95% | 6492 100% | 7575 86% | 6235 104% |
| Color Space (Percent of AdobeRGB 1998) (%) | 58.8 | 58 -1% | 63.2 7% | 69 17% | 62.3 6% | 81 38% |
| Color Space (Percent of sRGB) (%) | 91.1 | 88.6 -3% | 98 8% | 98 8% | 96 5% | 99.6 9% |
| Média Total (Programa/Configurações) | -43% /
-31% | -23% /
-0% | -28% /
-16% | -34% /
-15% | 37% /
16% |
* ... menor é melhor
Exibir tempos de resposta
| ↔ Tempo de resposta preto para branco | ||
|---|---|---|
| 14 ms ... ascensão ↗ e queda ↘ combinadas | ↗ 4.4 ms ascensão | 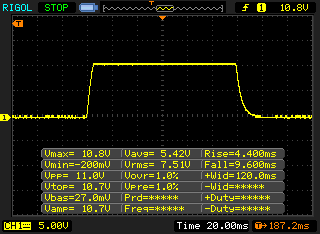 |
| ↘ 9.6 ms queda | ||
| A tela mostra boas taxas de resposta em nossos testes, mas pode ser muito lenta para jogadores competitivos. Em comparação, todos os dispositivos testados variam de 0.1 (mínimo) a 240 (máximo) ms. » 34 % de todos os dispositivos são melhores. Isso significa que o tempo de resposta medido é melhor que a média de todos os dispositivos testados (19.8 ms). | ||
| ↔ Tempo de resposta 50% cinza a 80% cinza | ||
| 34.4 ms ... ascensão ↗ e queda ↘ combinadas | ↗ 17.2 ms ascensão | 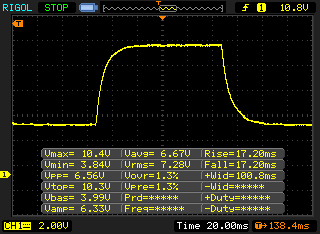 |
| ↘ 17.2 ms queda | ||
| A tela mostra taxas de resposta lentas em nossos testes e será insatisfatória para os jogadores. Em comparação, todos os dispositivos testados variam de 0.165 (mínimo) a 636 (máximo) ms. » 48 % de todos os dispositivos são melhores. Isso significa que o tempo de resposta medido é pior que a média de todos os dispositivos testados (31 ms). | ||
Cintilação da tela / PWM (modulação por largura de pulso)
| Tela tremeluzindo/PWM detectado | 26040 Hz | ≤ 70 % configuração de brilho | 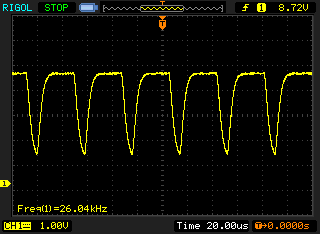 |
A luz de fundo da tela pisca em 26040 Hz (pior caso, por exemplo, utilizando PWM) Cintilação detectada em uma configuração de brilho de 70 % e abaixo. Não deve haver cintilação ou PWM acima desta configuração de brilho. A frequência de 26040 Hz é bastante alta, então a maioria dos usuários sensíveis ao PWM não deve notar nenhuma oscilação. [pwm_comparison] Em comparação: 52 % de todos os dispositivos testados não usam PWM para escurecer a tela. Se PWM foi detectado, uma média de 7769 (mínimo: 5 - máximo: 343500) Hz foi medida. | |||
| PCMark 8 Home Score Accelerated v2 | 3986 pontos | |
| PCMark 8 Creative Score Accelerated v2 | 3897 pontos | |
| PCMark 8 Work Score Accelerated v2 | 5332 pontos | |
| PCMark 10 Score | 5046 pontos | |
Ajuda | ||
| Lenovo ThinkPad P1 2019-20QT000RGE WDC PC SN720 SDAQNTW-512G | Lenovo ThinkPad P1-20MD002LUS Samsung SSD PM981 MZVLB2T0HMLB | Dell Precision 5530 Xeon E-2176M SK hynix PC400 512 GB | HP ZBook Studio G5-4QH10EA Samsung SSD PM981 MZVLB512HAJQ | Dell XPS 15 7590 9980HK GTX 1650 Toshiba XG6 KXG60ZNV1T02 | Média WDC PC SN720 SDAQNTW-512G | |
|---|---|---|---|---|---|---|
| CrystalDiskMark 5.2 / 6 | -21% | -23% | -26% | -7% | 8% | |
| Write 4K (MB/s) | 162.2 | 108 -33% | 97.8 -40% | 102.7 -37% | 104.3 -36% | 183.3 ? 13% |
| Read 4K (MB/s) | 43.71 | 37.24 -15% | 41.21 -6% | 38.32 -12% | 45.23 3% | 48.2 ? 10% |
| Write Seq (MB/s) | 2441 | 1476 -40% | 1312 -46% | 1417 -42% | 1729 -29% | 2135 ? -13% |
| Read Seq (MB/s) | 1753 | 1367 -22% | 1667 -5% | 1289 -26% | 1861 6% | 2102 ? 20% |
| Write 4K Q32T1 (MB/s) | 397.6 | 302.4 -24% | 449.5 13% | 278.9 -30% | 509 28% | 452 ? 14% |
| Read 4K Q32T1 (MB/s) | 520 | 375 -28% | 327.4 -37% | 348.8 -33% | 388.5 -25% | 619 ? 19% |
| Write Seq Q32T1 (MB/s) | 2519 | 2433 -3% | 1385 -45% | 1895 -25% | 2813 12% | 2537 ? 1% |
| Read Seq Q32T1 (MB/s) | 3448 | 3493 1% | 2948 -15% | 3352 -3% | 2906 -16% | 3466 ? 1% |

| 3DMark 06 Standard Score | 33809 pontos | |
| 3DMark Vantage P Result | 31509 pontos | |
| 3DMark 11 Performance | 10211 pontos | |
| 3DMark Ice Storm Standard Score | 76341 pontos | |
| 3DMark Cloud Gate Standard Score | 23601 pontos | |
| 3DMark Fire Strike Score | 6812 pontos | |
| 3DMark Time Spy Score | 3006 pontos | |
Ajuda | ||
| The Witcher 3 - 1920x1080 High Graphics & Postprocessing (Nvidia HairWorks Off) | |
| Média da turma Workstation (91 - 156.4, n=2, últimos 2 anos) | |
| Dell XPS 15 7590 9980HK GTX 1650 | |
| Média NVIDIA Quadro T1000 (Laptop) (52.7 - 62.9, n=3) | |
| Lenovo ThinkPad P1 2019-20QT000RGE | |
| Lenovo ThinkPad X1 Extreme-20MF000RGE | |
| Lenovo ThinkPad P1-20MD002LUS | |
| HP ZBook Studio G5-4QH10EA | |
| baixo | média | alto | ultra | 4K | |
|---|---|---|---|---|---|
| BioShock Infinite (2013) | 280.4 | 210 | 184.7 | 72.9 | |
| The Witcher 3 (2015) | 156.2 | 94.1 | 52.7 | 30.9 | |
| Dota 2 Reborn (2015) | 134 | 115 | 113 | 106 | 47.9 |
| Rainbow Six Siege (2015) | 190.3 | 159.6 | 111.6 | 97.9 | |
| Rise of the Tomb Raider (2016) | 136.2 | 86 | 53.4 | 43.8 | |
| For Honor (2017) | 163.4 | 66.7 | 63.9 | 48.8 | |
| Ghost Recon Wildlands (2017) | 94 | 47.2 | 43.9 | 24.2 | |
| Rocket League (2017) | 246.4 | 150.7 | 117 | ||
| Final Fantasy XV Benchmark (2018) | 77.4 | 41.9 | 31.1 | ||
| Kingdom Come: Deliverance (2018) | 93.7 | 49.3 | 40.5 | 30.7 | |
| X-Plane 11.11 (2018) | 91 | 78 | 69 | ||
| Shadow of the Tomb Raider (2018) | 88 | 46 | 40 | 35 | |
| FIFA 19 (2018) | 148 | 119.2 | 113.5 | 110.8 | |
| Assassin´s Creed Odyssey (2018) | 57 | 40 | 35 | 29 | |
| Battlefield V (2018) | 61.5 | 43.2 | 37.8 | 35 | |
| Farming Simulator 19 (2018) | 182.4 | 106.7 | 86.3 | 66.5 | |
| Apex Legends (2019) | 143.7 | 73.8 | 57.8 | 55.9 | |
| Far Cry New Dawn (2019) | 77 | 48 | 46 | 43 | |
| Dirt Rally 2.0 (2019) | 185.2 | 80.7 | 63.7 | 36.3 | |
| The Division 2 (2019) | 39 | 36 | 29 | ||
| Anno 1800 (2019) | 69.6 | 52.8 | 37.2 | 20 | |
| F1 2019 (2019) | 118 | 73 | 61 | 49 |
Barulho
| Ocioso |
| 28.8 / 28.8 / 28.8 dB |
| Carga |
| 36.1 / 36.7 dB |
 | ||
30 dB silencioso 40 dB(A) audível 50 dB(A) ruidosamente alto |
||
min: | ||
(±) A temperatura máxima no lado superior é 44.7 °C / 112 F, em comparação com a média de 38.2 °C / 101 F , variando de 22.2 a 69.8 °C para a classe Workstation.
(-) A parte inferior aquece até um máximo de 49.4 °C / 121 F, em comparação com a média de 41.1 °C / 106 F
(+) Em uso inativo, a temperatura média para o lado superior é 23.6 °C / 74 F, em comparação com a média do dispositivo de 32 °C / ### class_avg_f### F.
(±) Jogando The Witcher 3, a temperatura média para o lado superior é 36.7 °C / 98 F, em comparação com a média do dispositivo de 32 °C / ## #class_avg_f### F.
(+) Os apoios para as mãos e o touchpad são mais frios que a temperatura da pele, com um máximo de 30.1 °C / 86.2 F e, portanto, são frios ao toque.
(-) A temperatura média da área do apoio para as mãos de dispositivos semelhantes foi 27.8 °C / 82 F (-2.3 °C / -4.2 F).
Lenovo ThinkPad P1 2019-20QT000RGE análise de áudio
(±) | o volume do alto-falante é médio, mas bom (###valor### dB)
Graves 100 - 315Hz
(±) | graves reduzidos - em média 10.6% menor que a mediana
(±) | a linearidade dos graves é média (13% delta para a frequência anterior)
Médios 400 - 2.000 Hz
(+) | médios equilibrados - apenas 4.4% longe da mediana
(+) | médios são lineares (5.9% delta para frequência anterior)
Altos 2 - 16 kHz
(+) | agudos equilibrados - apenas 2.4% longe da mediana
(±) | a linearidade dos máximos é média (8.2% delta para frequência anterior)
Geral 100 - 16.000 Hz
(±) | a linearidade do som geral é média (16.7% diferença em relação à mediana)
Comparado com a mesma classe
» 46% de todos os dispositivos testados nesta classe foram melhores, 9% semelhantes, 45% piores
» O melhor teve um delta de 7%, a média foi 17%, o pior foi 35%
Comparado com todos os dispositivos testados
» 29% de todos os dispositivos testados foram melhores, 7% semelhantes, 64% piores
» O melhor teve um delta de 4%, a média foi 24%, o pior foi 134%
Lenovo ThinkPad P1-20MD002LUS análise de áudio
(±) | o volume do alto-falante é médio, mas bom (###valor### dB)
Graves 100 - 315Hz
(±) | graves reduzidos - em média 10.1% menor que a mediana
(±) | a linearidade dos graves é média (12.3% delta para a frequência anterior)
Médios 400 - 2.000 Hz
(±) | médios mais altos - em média 5.9% maior que a mediana
(±) | a linearidade dos médios é média (8.9% delta para frequência anterior)
Altos 2 - 16 kHz
(+) | agudos equilibrados - apenas 2% longe da mediana
(+) | os máximos são lineares (5.1% delta da frequência anterior)
Geral 100 - 16.000 Hz
(±) | a linearidade do som geral é média (21.8% diferença em relação à mediana)
Comparado com a mesma classe
» 77% de todos os dispositivos testados nesta classe foram melhores, 6% semelhantes, 17% piores
» O melhor teve um delta de 7%, a média foi 17%, o pior foi 35%
Comparado com todos os dispositivos testados
» 62% de todos os dispositivos testados foram melhores, 7% semelhantes, 31% piores
» O melhor teve um delta de 4%, a média foi 24%, o pior foi 134%
| desligado | |
| Ocioso | |
| Carga |
|
Key:
min: | |
| Lenovo ThinkPad P1 2019-20QT000RGE i7-9850H, Quadro T1000 (Laptop), WDC PC SN720 SDAQNTW-512G, IPS LED, 1920x1080, 15.6" | Lenovo ThinkPad X1 Extreme-20MF000RGE i5-8300H, GeForce GTX 1050 Ti Max-Q, Samsung SSD PM981 MZVLB256HAHQ, IPS LED, 1920x1080, 15.6" | Lenovo ThinkPad P1-20MD002LUS E-2176M, Quadro P2000 Max-Q, Samsung SSD PM981 MZVLB2T0HMLB, IPS, 3840x2160, 15.6" | Dell Precision 5530 Xeon E-2176M E-2176M, Quadro P2000, SK hynix PC400 512 GB, IGZO, 3840x2160, 15.6" | HP ZBook Studio G5-4QH10EA i7-8750H, Quadro P1000, Samsung SSD PM981 MZVLB512HAJQ, IPS LED, 3840x2160, 15.6" | Dell XPS 15 7590 9980HK GTX 1650 i9-9980HK, GeForce GTX 1650 Mobile, Toshiba XG6 KXG60ZNV1T02, OLED, 3840x2160, 15.6" | Média NVIDIA Quadro T1000 (Laptop) | Média da turma Workstation | |
|---|---|---|---|---|---|---|---|---|
| Power Consumption | 35% | 21% | 5% | 23% | 11% | 16% | 0% | |
| Idle Minimum * (Watt) | 13.7 | 4.14 70% | 7.1 48% | 9.8 28% | 6.8 50% | 6.2 55% | 8.33 ? 39% | 9.04 ? 34% |
| Idle Average * (Watt) | 17.5 | 7.3 58% | 14.4 18% | 16.8 4% | 11.3 35% | 9.6 45% | 11.8 ? 33% | 13.8 ? 21% |
| Idle Maximum * (Watt) | 20.9 | 11.5 45% | 14.6 30% | 16.9 19% | 14.3 32% | 21.2 -1% | 15.2 ? 27% | 17.7 ? 15% |
| Load Average * (Watt) | 77.2 | 78.8 -2% | 93.9 -22% | 102.3 -33% | 78 -1% | 104.3 -35% | 86.4 ? -12% | 96.2 ? -25% |
| Load Maximum * (Watt) | 123.7 | 118 5% | 88.3 29% | 114.5 7% | 126 -2% | 135.3 -9% | 131.1 ? -6% | 178.5 ? -44% |
| Witcher 3 ultra * (Watt) | 82 | 77.9 | 76.5 | 64 | 91.7 |
* ... menor é melhor
| Lenovo ThinkPad P1 2019-20QT000RGE i7-9850H, Quadro T1000 (Laptop), 80 Wh | Lenovo ThinkPad X1 Extreme-20MF000RGE i5-8300H, GeForce GTX 1050 Ti Max-Q, 80 Wh | Dell XPS 15 7590 i5 iGPU FHD i5-9300H, UHD Graphics 630, 97 Wh | Lenovo ThinkPad P1-20MD002LUS E-2176M, Quadro P2000 Max-Q, 80 Wh | Dell Precision 5530 Xeon E-2176M E-2176M, Quadro P2000, 97 Wh | HP ZBook Studio G5-4QH10EA i7-8750H, Quadro P1000, 97 Wh | Média da turma Workstation | |
|---|---|---|---|---|---|---|---|
| Duração da bateria | 16% | 59% | -40% | 16% | 25% | 3% | |
| H.264 (h) | 9.3 | 9.6 3% | 17.6 89% | 9.1 -2% | 9.51 ? 2% | ||
| WiFi v1.3 (h) | 8.9 | 9.4 6% | 14.1 58% | 5.3 -40% | 8.4 -6% | 9.7 9% | 8.52 ? -4% |
| Load (h) | 1.3 | 1.8 38% | 1.7 31% | 1.8 38% | 2.2 69% | 1.429 ? 10% | |
| Reader / Idle (h) | 21 | 16.5 | 17.3 | 26.1 ? |
Pro
Contra
Desde que o Lenovo ThinkPad P1 2019 é apenas uma atualização de seu modelo predecessor direto, o ThinkPad P1 2018, o veredicto resulta em grande parte muito similar. As únicas diferenças estão nas especificações.
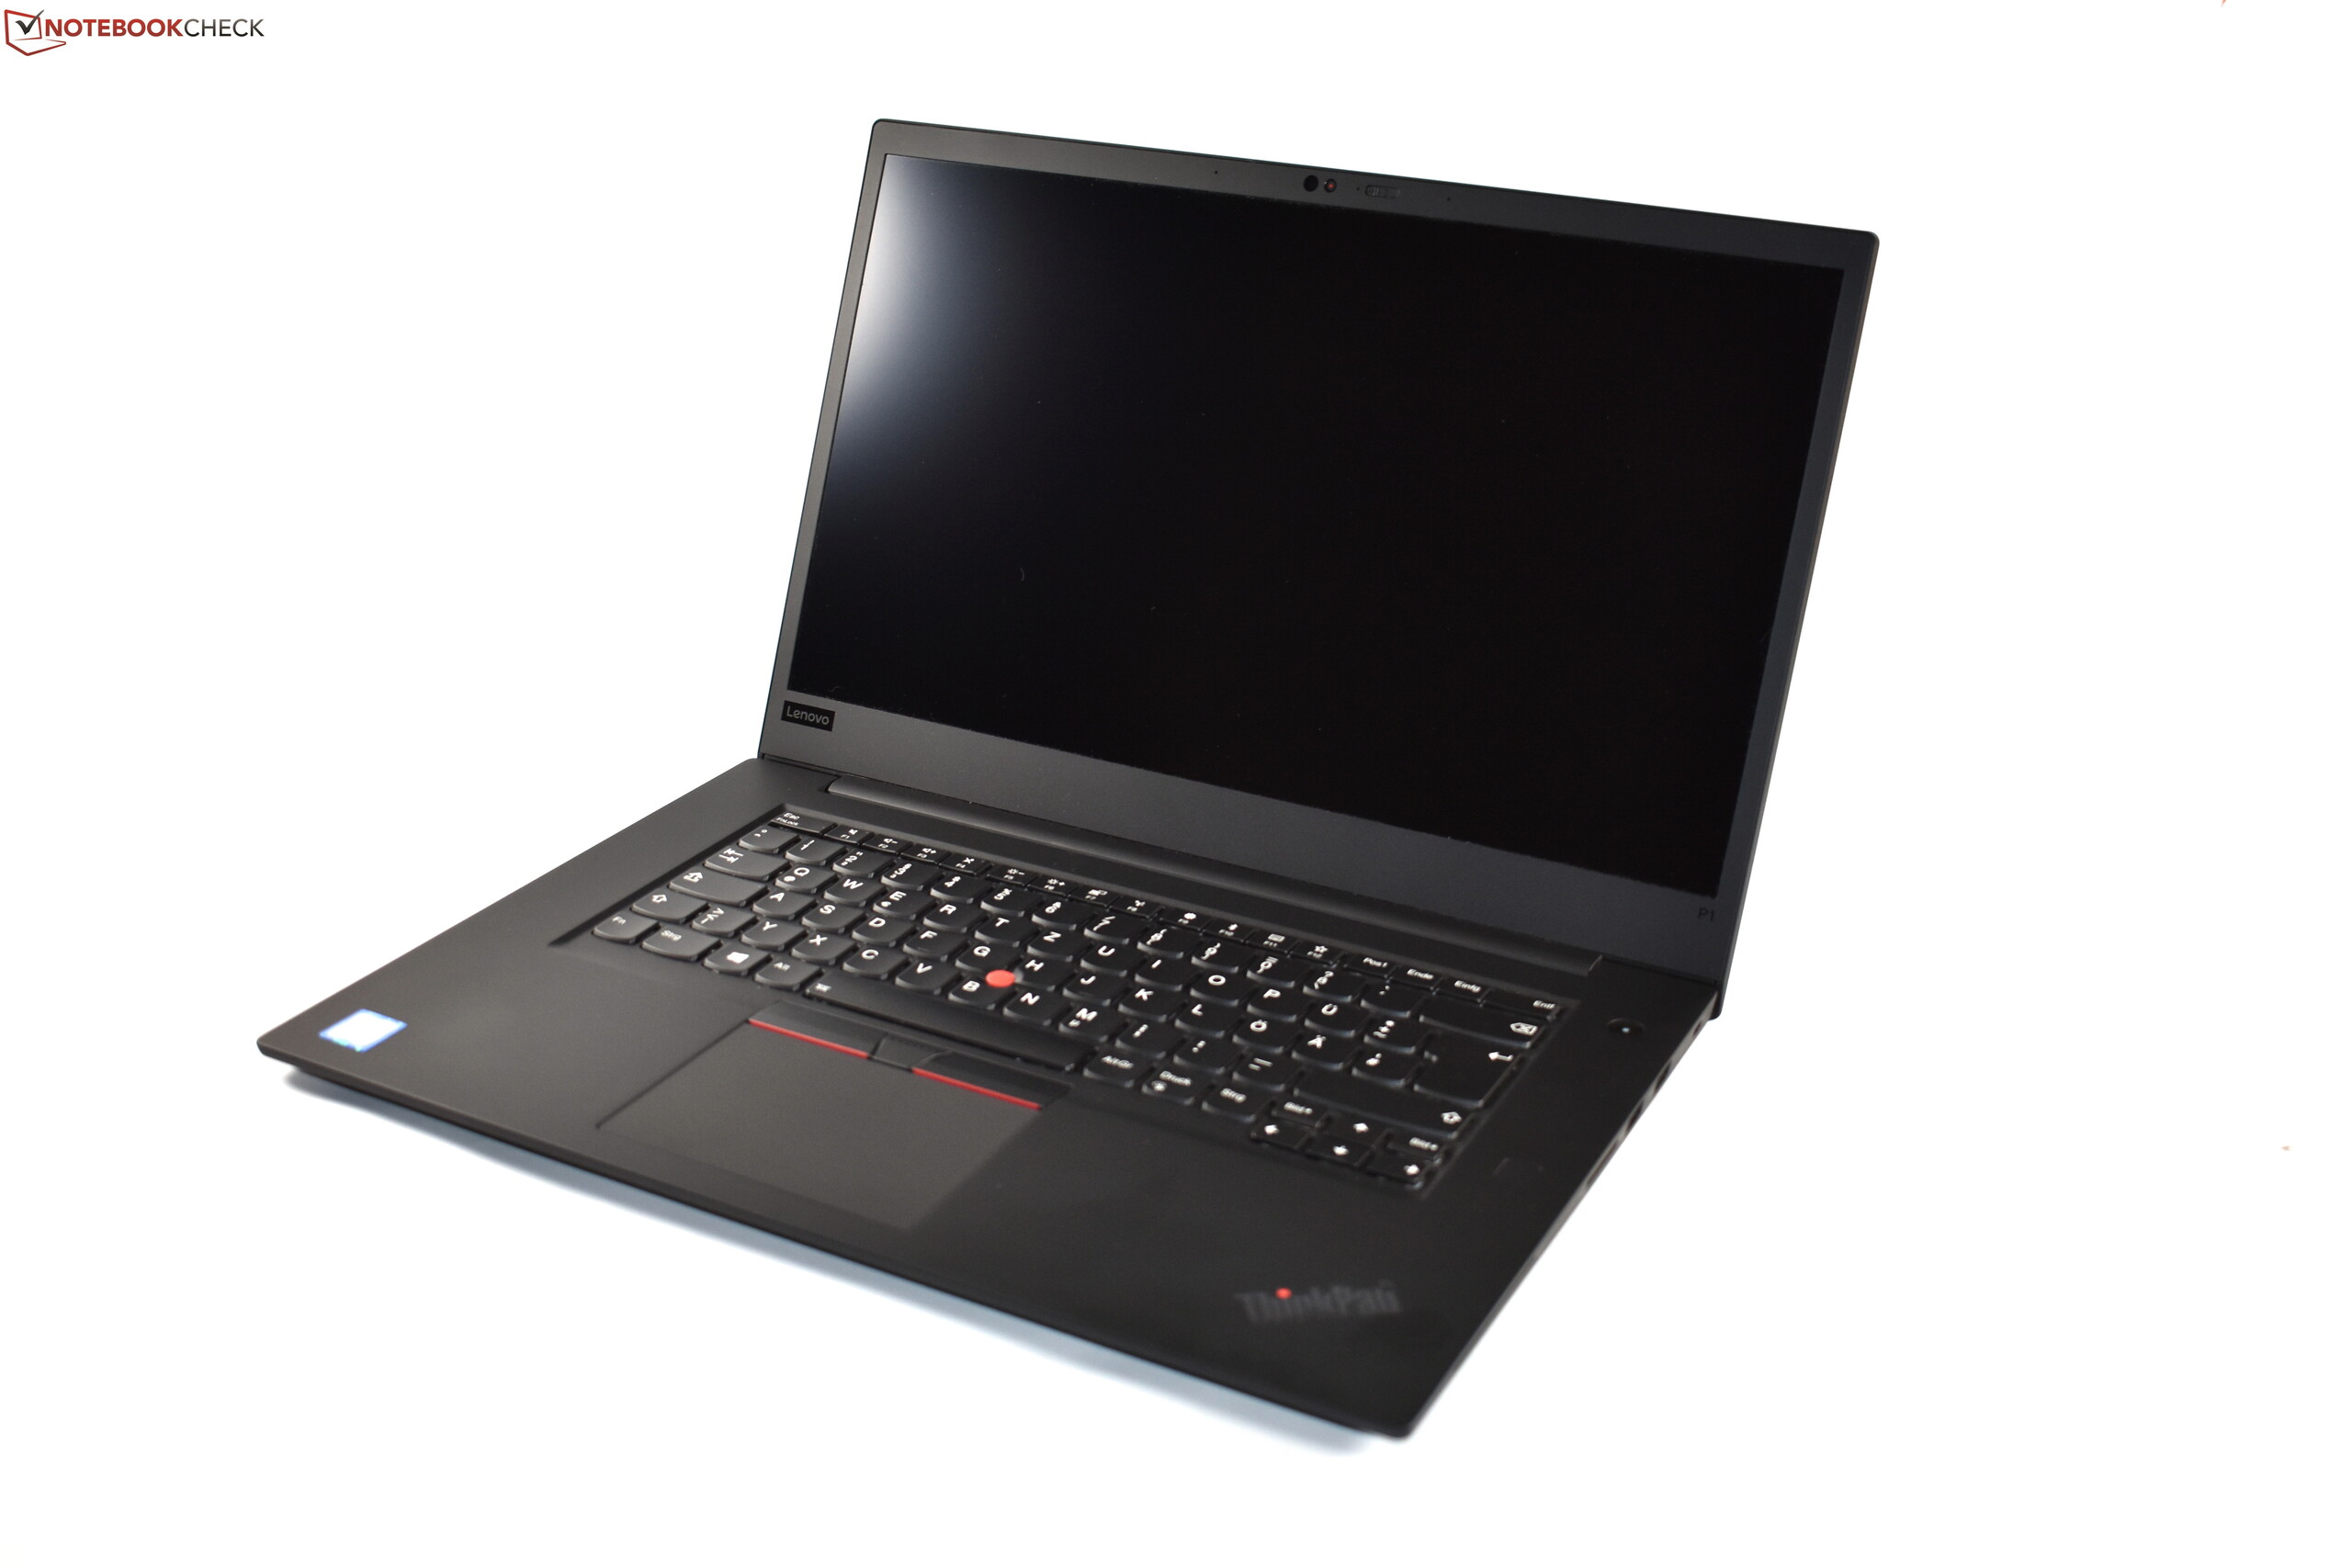
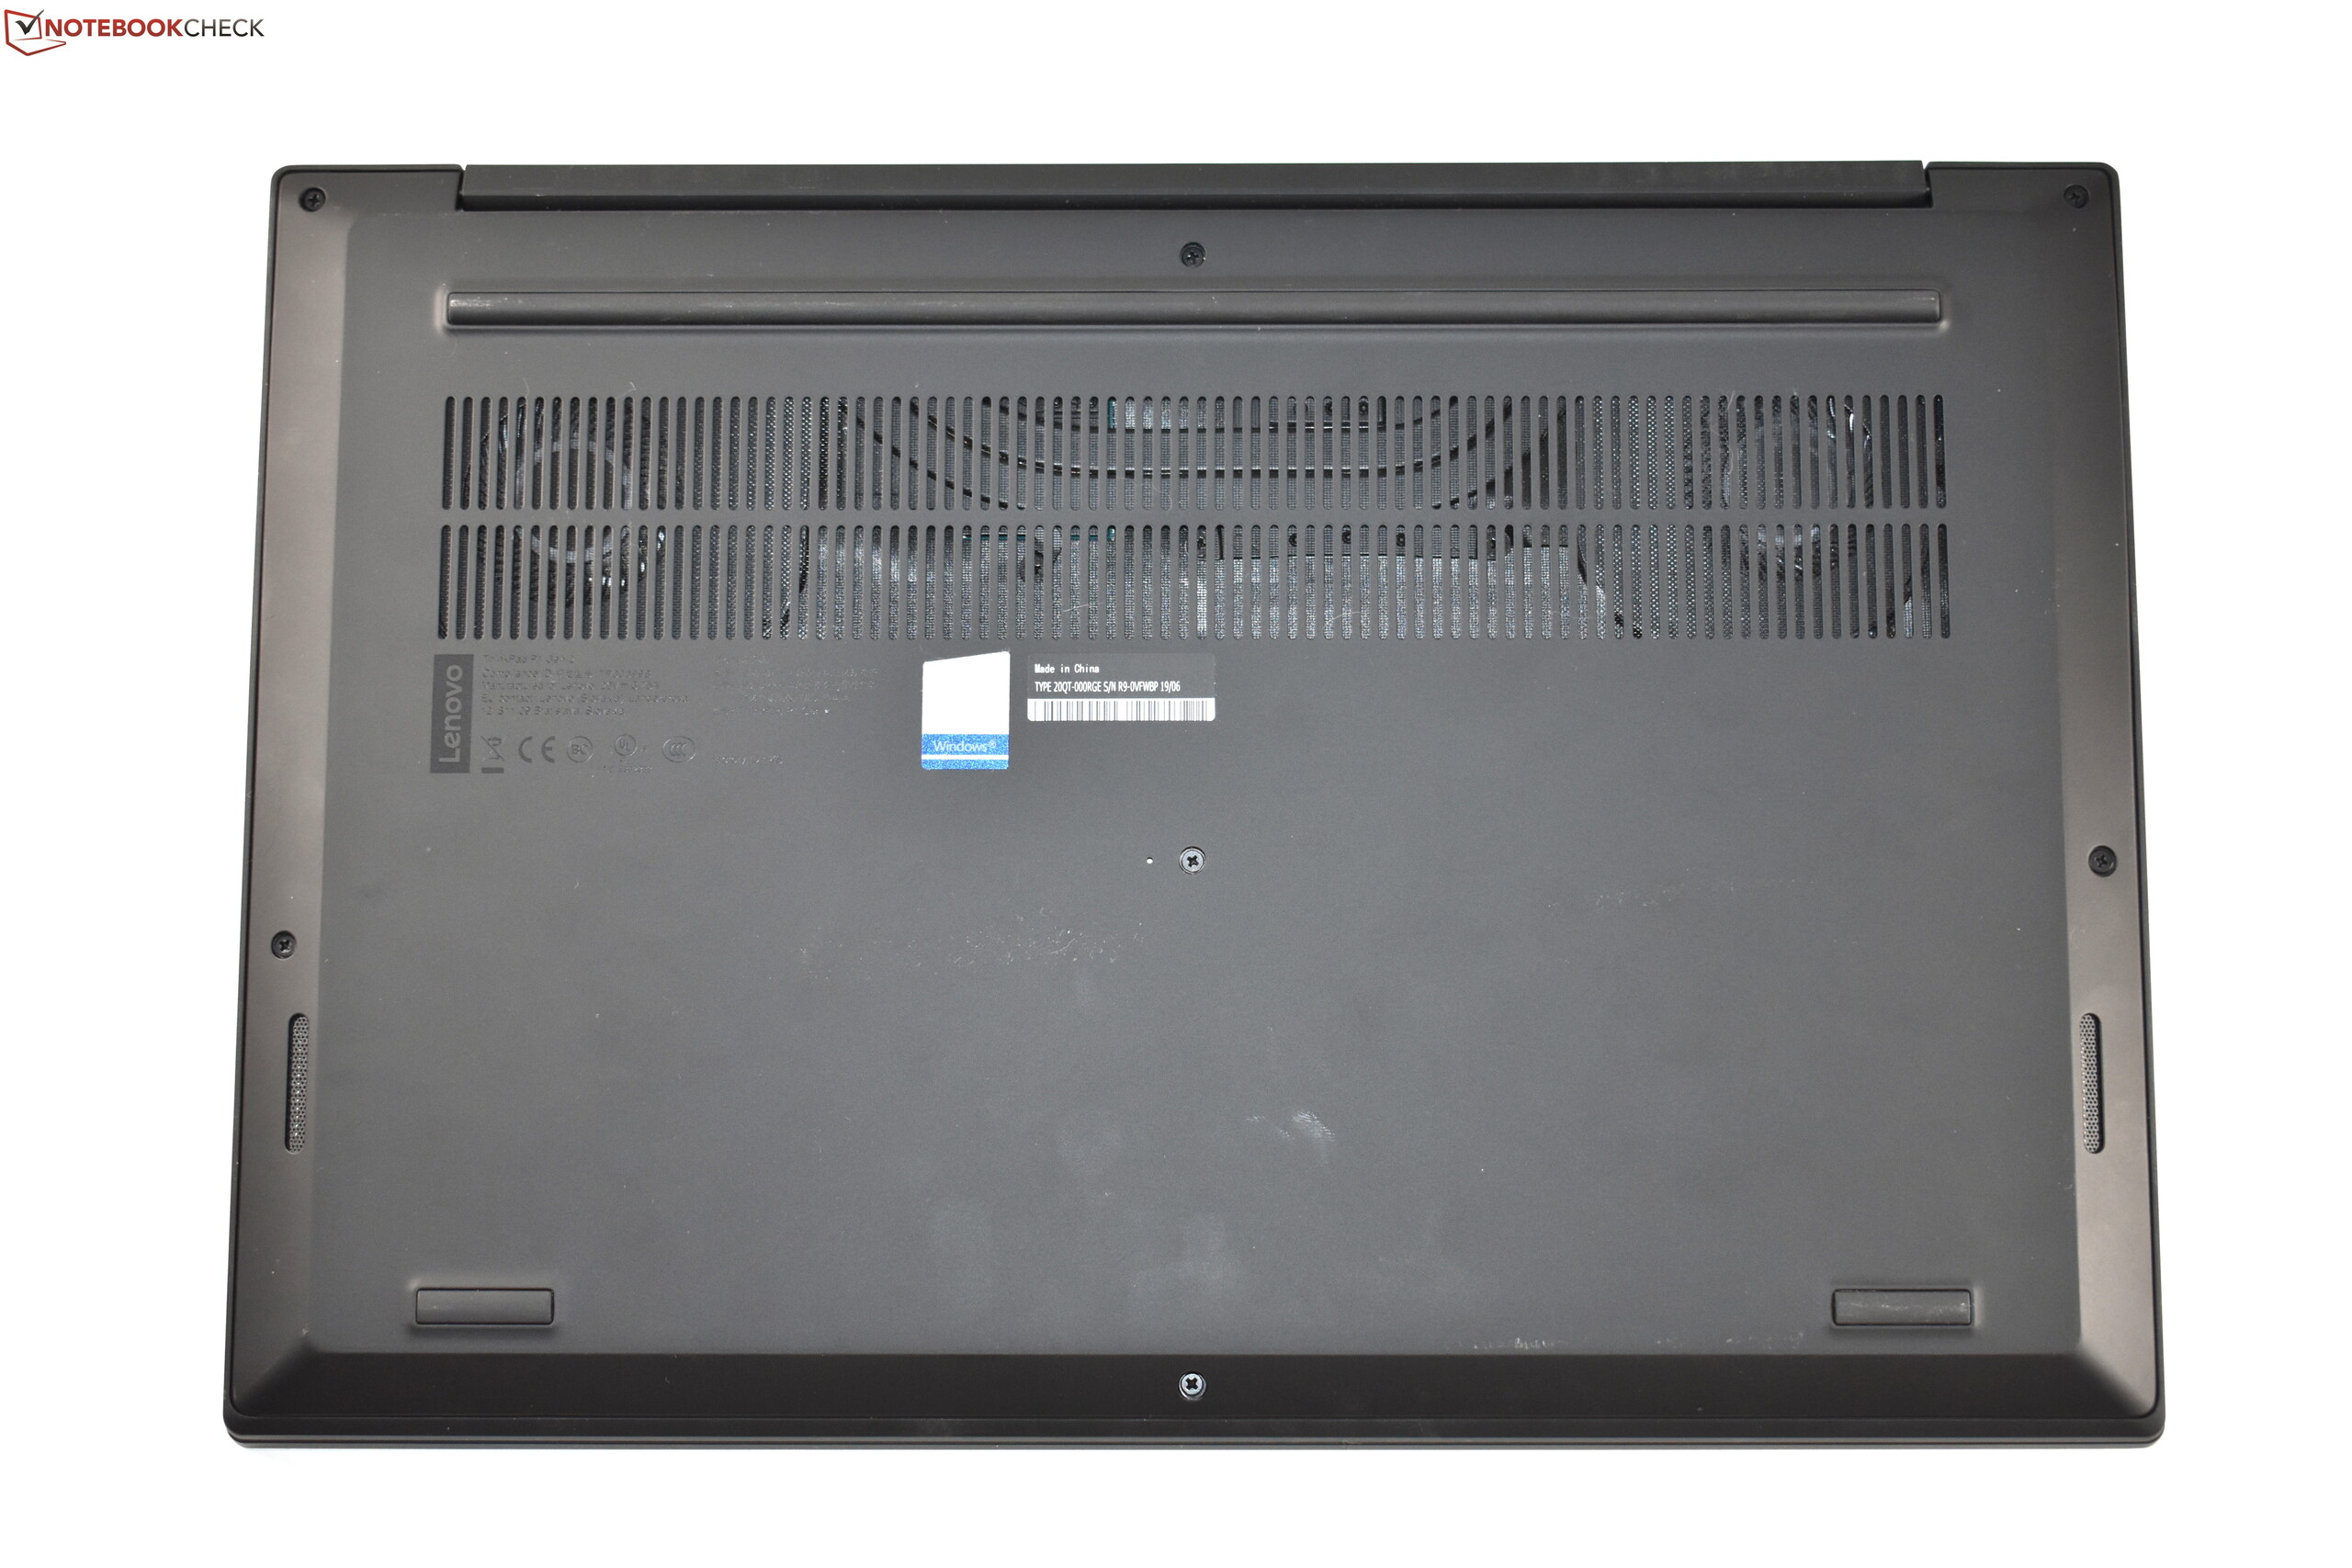
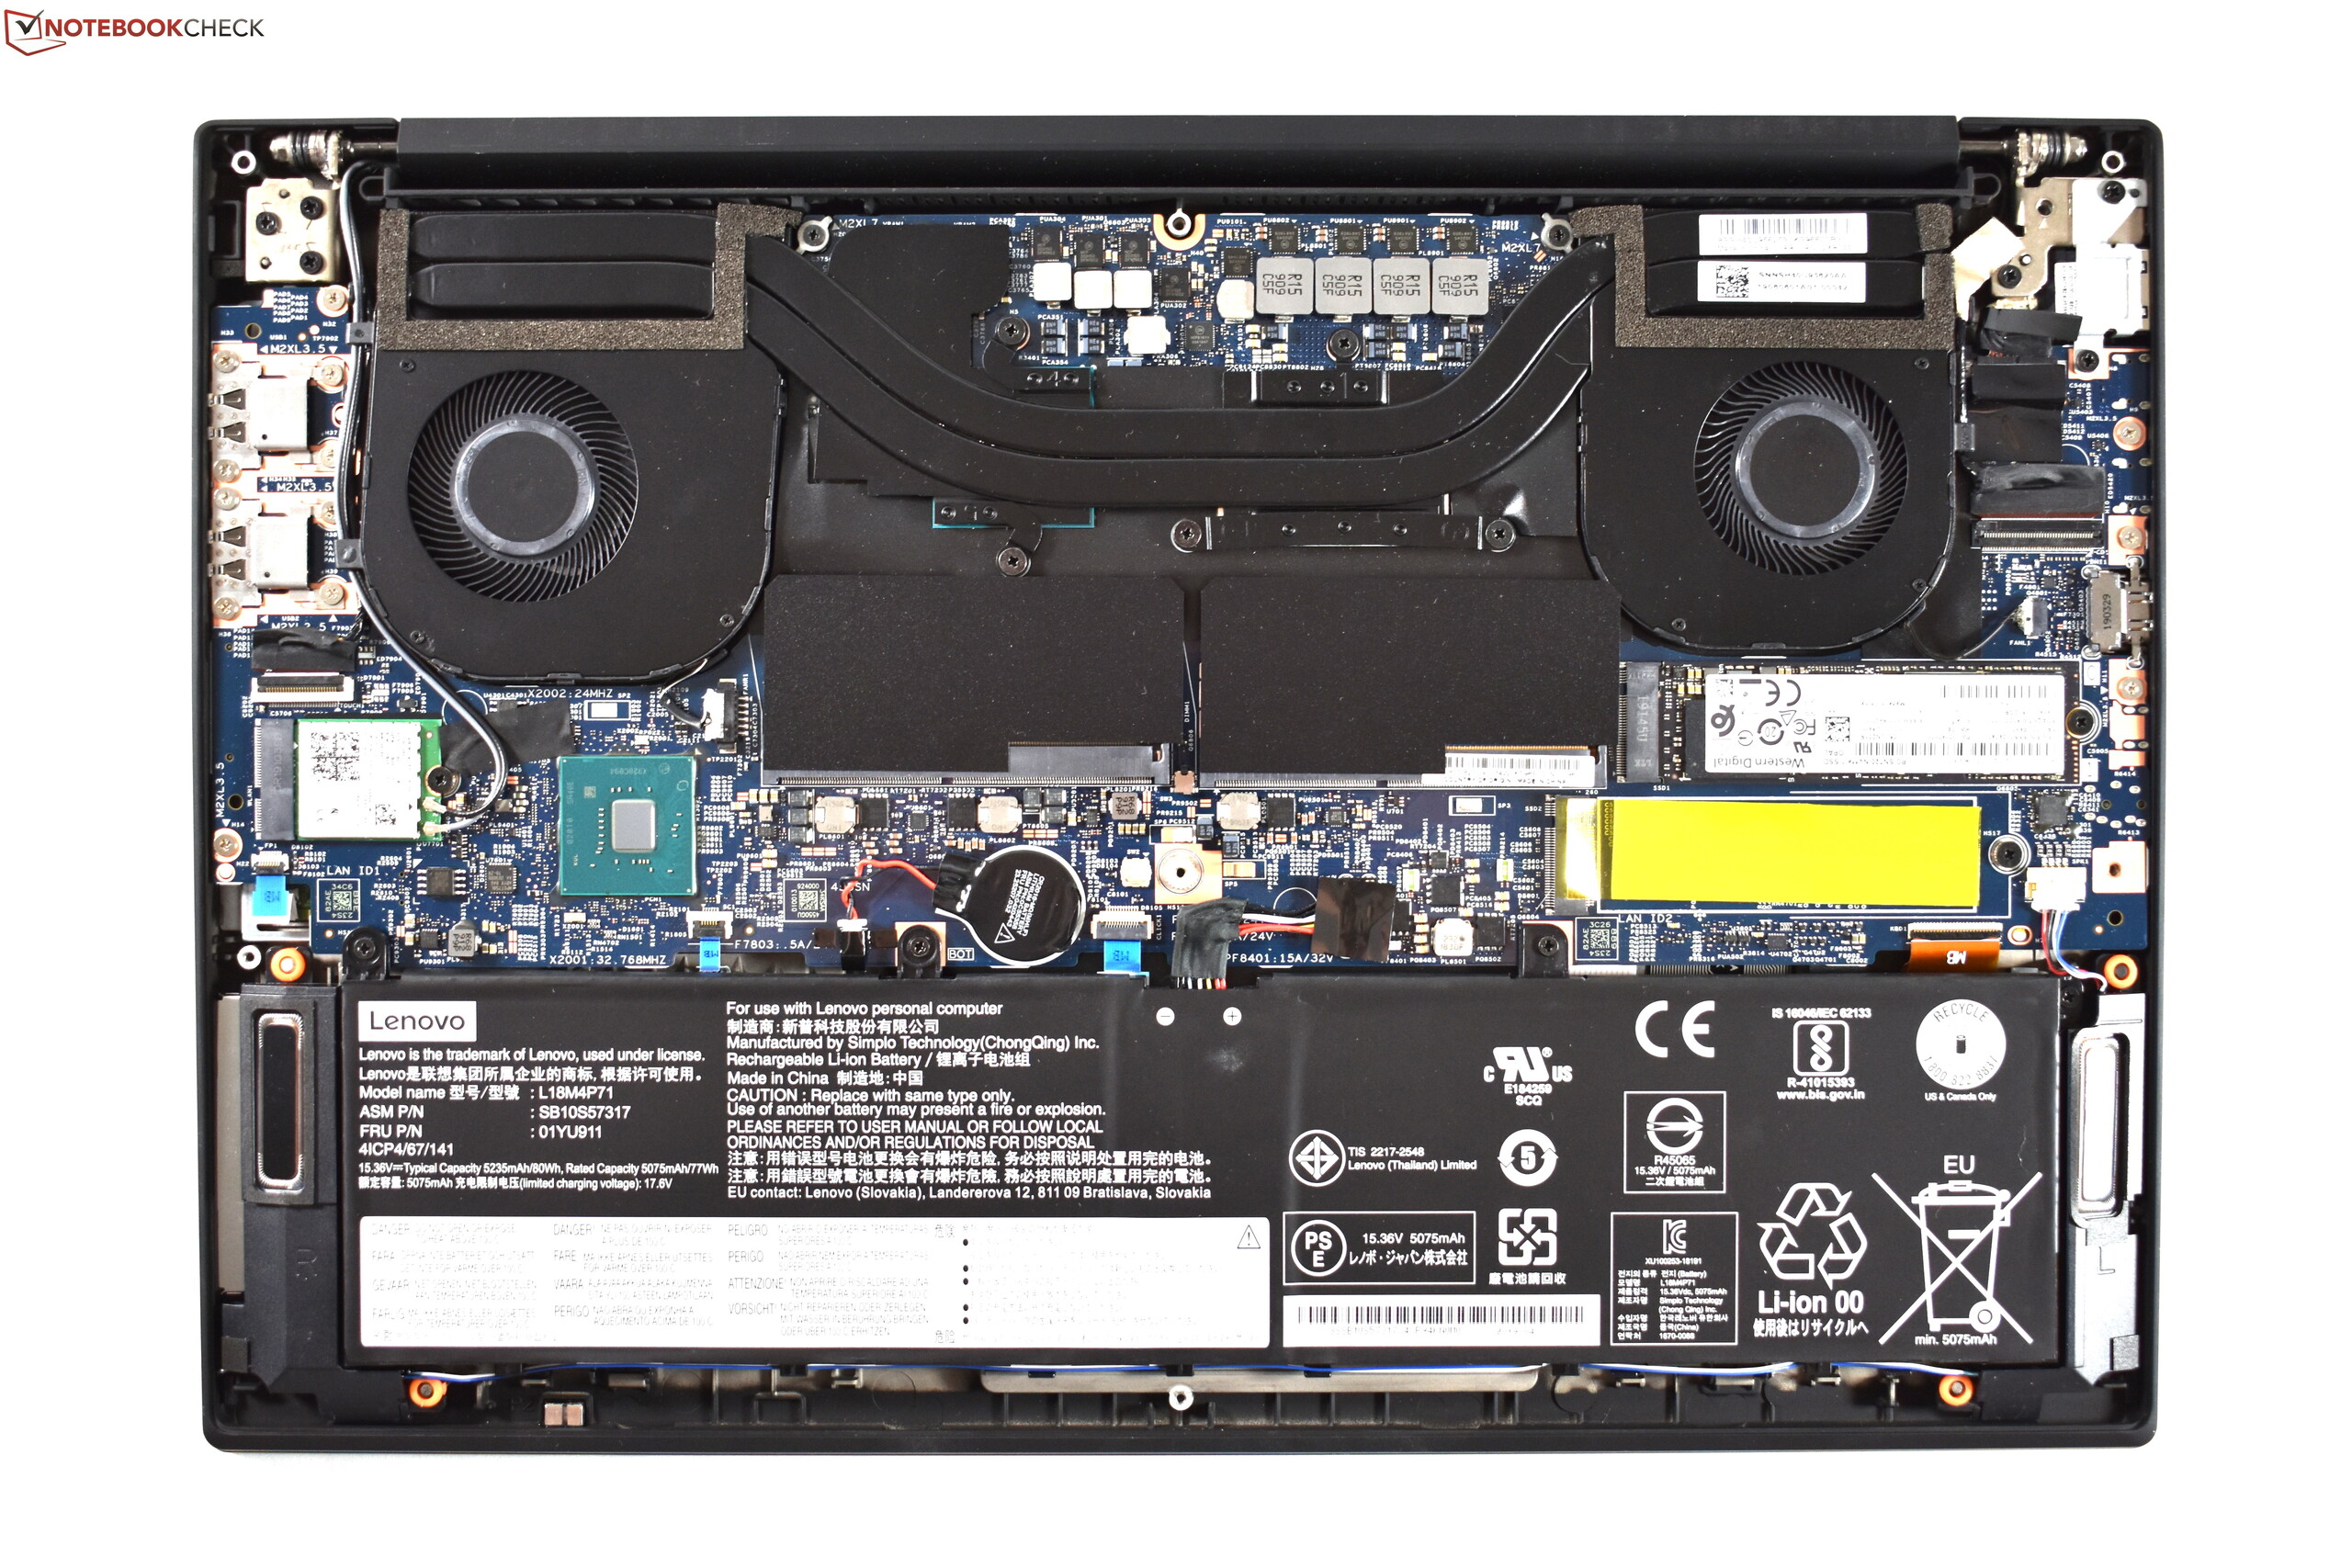
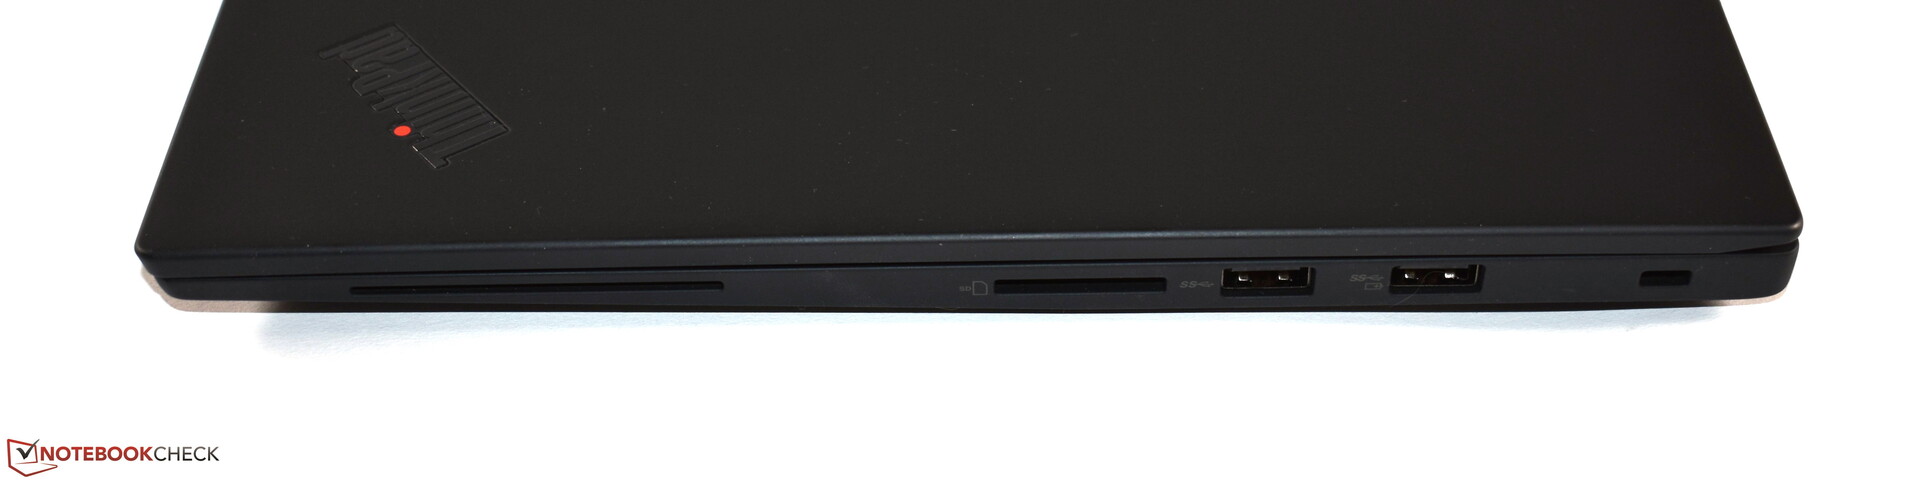
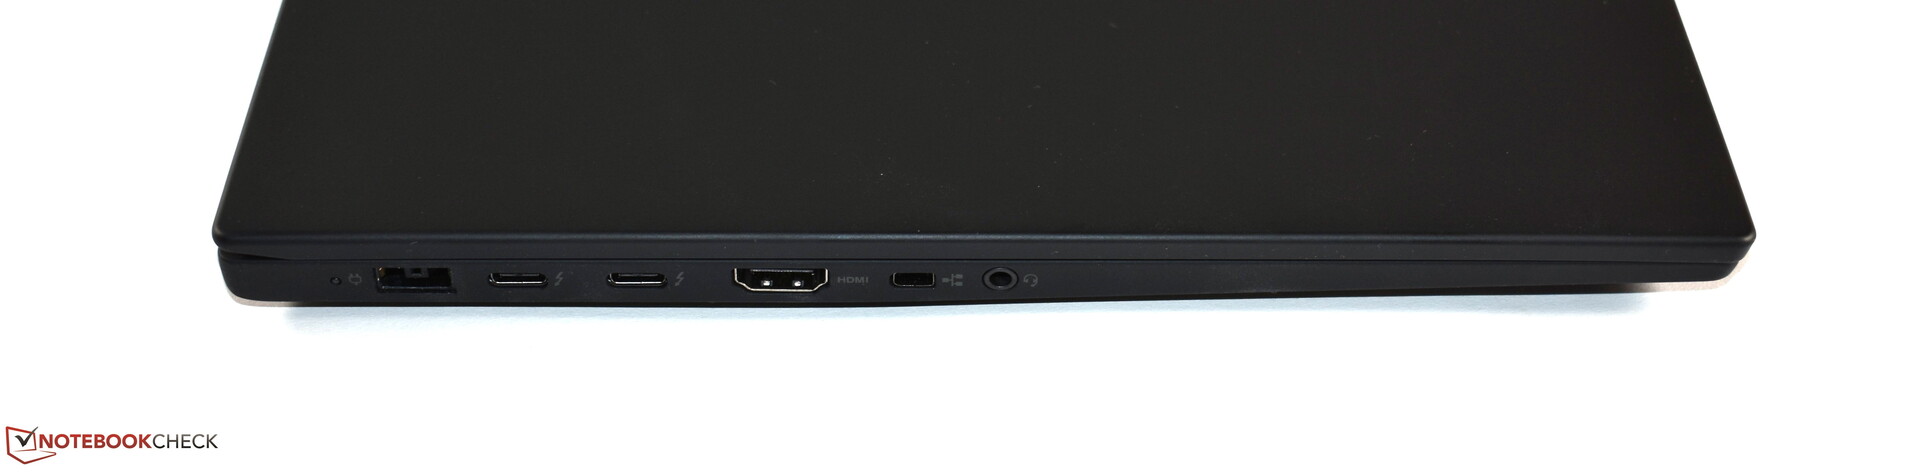
A carcaça feita de carbono, magnésio e alumínio continua sendo de alta qualidade e, em contraste com o antecessor que tinha uma tela táctil, a tampa da tela não range. A carcaça preta mate contém excelentes dispositivos de entrada e diversas conexões. Além disso, o ThinkPad P1 Gen 2 continua sendo fácil de manter e atualizar (2x SO-DIMM RAM, 2 SSDs 2280-M.2). As novidades são algumas opções de tela, como a tela Full HD HDR em nossa unidade de teste, que convence com um brilho extremamente alto de mais de 500 cd/m². É lamentável que não cubra 100% do espaço de cores sRGB. Novo também é o Quadro T1000, que como uma solução de nível de entrada para o ThinkPad P1 Gen 2 ainda é mais rápido que a Nvidia Quadro P2000 Max-Q do predecessor. Outros pontos positivos são o silencio do sistema de resfriamento e o período de garantia de três anos.
Como um ponto negativo importante no ThinkPad P1 Gen 2, o desempenho da CPU se destaca claramente. Não é abismal, mas pelo contrário: O ThinkPad P1 2019 é um portátil muito poderoso. No entanto, no geral, ainda precisamos ressaltar que o desempenho da CPU permanece abaixo do desempenho do modelo predecessor. Então, a este respeito, o novo ThinkPad P1 não é uma atualização. Outros pontos negativos incluem a falta de uma opção de WWAN, a duração medíocre da bateria, o alto preço de compra, e o irritante ruído de bobina.
Pior CPU, mas melhor GPU e tela significativamente mais brilhante: As alterações do ThinkPad P1 (2019) em comparação com seu antecessor podem ser resumidas desta maneira.
Se você pesar os pontos negativos contra as características positivas, os pontos positivos ganham claramente no ThinkPad P1 Gen 2. Os compradores receberão um workstation móvel de excelente qualidade e muito bem equipado com uma tela incrivelmente brilhante. Comparado com o ThinkPad P1 2018 e muitos workstations móveis antigos de construção similar, principalmente a Nvidia Quadro T1000 representa uma boa atualização de desempenho, enquanto o desempenho da CPU é o ponto fraco do ThinkPad P1 2019.
Lenovo ThinkPad P1 2019-20QT000RGE
- 10/22/2019 v7 (old)
Benjamin Herzig
Price comparison
