Notebookcheck Logo

Breve Análise do Portátil Acer Swift 3 SF314 (i7-8565U, MX250)

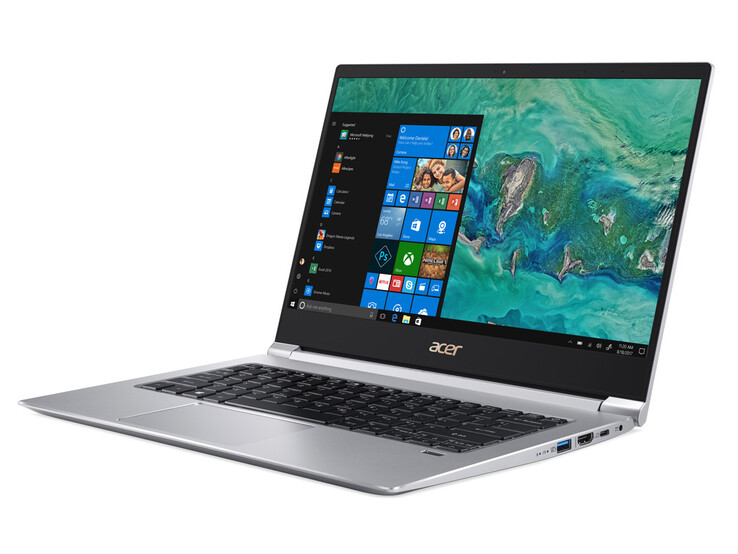
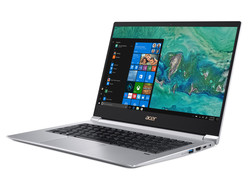
Pequeno e leve com um MX250. A Acer promete aos compradores do Swift 3 um design elegante e alta mobilidade. Com sua carcaça de alumínio atraente e tamanho pequeno, o portátil de 14 polegadas já é capaz de cumprir essas promessas à primeira vista. Avaliamos em nosso teste se o desempenho do portátil compacto também é correto.
Acer Swift 3 SF314-55G-768V (Swift 3 SF314 Serie)
Processador
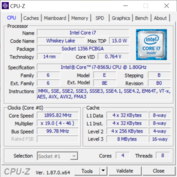
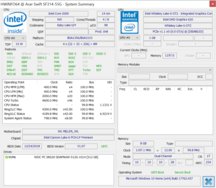
Intel Core i7-8565U 4 x 1.8 - 4.6 GHz, Whiskey Lake-U
Placa gráfica
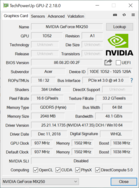
NVIDIA GeForce MX250 - 2048 MB VRAM, Análises do: 544 MHz, Memoría: 202.5 MHz, 1D52, GeForce 417.35
Memória
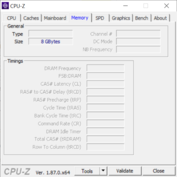
8 GB 
, DDR4
Pantalha
14.00 polegadas 16:9, 1920 x 1080 pixel 157 PPI, Chi Mei CMN14D5, IPS, Brilhante: não
placa mãe
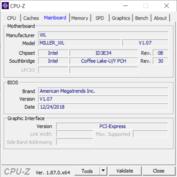
Intel Cannon Lake-U PCH-LP Premium
Disco rígido
WDC PC SN520 SDAPNUW-512G, 512 GB 
, 430 GB livre
Placa de Som
Intel Cannon Lake-LP - cAVS
Conexões
3 USB 3.0, 1 HDMI, 1 DisplayPort, 1 Kensington Lock, Conexões Audio: Porta de áudio de 3,5 mm, Card Reader: SD, 1 Leitor de Impressões Digitais
Funcionamento em rede
Intel Wireless-AC 9560 (a/b/g/n = Wi-Fi 4/ac = Wi-Fi 5/), Bluetooth 5
Tamanho
altura x largura x profundidade (em mm): 14.9 x 323 x 228
Bateria
50.7 Wh, 3320 mAh Lítio-Ion
Sistema Operativo
Microsoft Windows 10 Home 64 Bit
Camera
Webcam: 0.9MP 16:9 (1280x720)
Características adicionais
Alto falantes: Estéreo, Teclado: chiclet, Iluminação do Teclado: sim, 24 Meses Garantia
peso
1.5 kg, Suprimento de energia: 208 g
Preço
1200 Euro
Note: The manufacturer may use components from different suppliers including display panels, drives or memory sticks with similar specifications.


Acer Swift 3 SF314-55G-768V

Size Comparison

336.6 mm 232.5 mm 19.95 mm 1.6 kg328 mm 238 mm 19.9 mm 1.7 kg323 mm 228 mm 14.9 mm 1.5 kg319 mm 199 mm 15.9 mm 1.2 kg307.5 mm 223.8 mm 15.9 mm 1.5 kg297 mm 210 mm 1 mm 5.7 g
SD Card Reader
average JPG Copy Test (av. of 3 runs)
Lenovo ThinkPad A485-20MU000CGE
  (Toshiba Exceria Pro SDXC 64 GB UHS-II)
74.2 MB/s +176%
Average of class Subnotebook
  (19.5 - 193.9, n=17, last 2 years)
70 MB/s +160%
Asus Zenbook 14 UX433FA-A6018T
  (Toshiba Exceria Pro M501 microSDXC 64GB)
36 MB/s +34%
Acer Swift 3 SF314-55G-768V
  (Toshiba Exceria Pro SDXC 64 GB UHS-II)
26.9 MB/s
Acer Swift 3 SF314-55-31N8
  (Toshiba Exceria Pro SDXC 64 GB UHS-II)
26.7 MB/s -1%
Acer TravelMate X3410-M-50DD
  (Toshiba Exceria Pro SDXC 64 GB UHS-II)
20.9 MB/s -22%
maximum AS SSD Seq Read Test (1GB)
Lenovo ThinkPad A485-20MU000CGE
  (Toshiba Exceria Pro SDXC 64 GB UHS-II)
85.6 MB/s +168%
Average of class Subnotebook
  (23.6 - 239, n=17, last 2 years)
84.7 MB/s +165%
Acer Swift 3 SF314-55G-768V
  (Toshiba Exceria Pro SDXC 64 GB UHS-II)
32 MB/s
Acer Swift 3 SF314-55-31N8
  (Toshiba Exceria Pro SDXC 64 GB UHS-II)
29.5 MB/s -8%
Asus Zenbook 14 UX433FA-A6018T
  (Toshiba Exceria Pro M501 microSDXC 64GB)
25.8 MB/s -19%
Acer TravelMate X3410-M-50DD
  (Toshiba Exceria Pro SDXC 64 GB UHS-II)
25 MB/s -22%
Networking
iperf3 transmit AX12
Average of class Subnotebook
  (606 - 1339, n=3, last 2 years)
1056 MBit/s +66%
Huawei MateBook 14 KLV-W29
Intel Wireless-AC 9560
659 MBit/s +3%
Acer Swift 3 SF314-55-31N8
Intel Wireless-AC 9560
638 (570min - 673max) MBit/s 0%
Acer Swift 3 SF314-55G-768V
Intel Wireless-AC 9560
637 (467min - 709max) MBit/s
Asus Zenbook 14 UX433FA-A6018T
Intel Wireless-AC 9560
631 (503min - 648max) MBit/s -1%
Lenovo ThinkPad A485-20MU000CGE
Realtek RTL8822BE Wireless LAN 802.11ac PCIe Adapter
581 MBit/s -9%
Acer TravelMate X3410-M-50DD
Intel Dual Band Wireless-AC 7265
565 (533min - 587max) MBit/s -11%
iperf3 receive AX12
Average of class Subnotebook
  (623 - 1690, n=3, last 2 years)
1258 MBit/s +105%
Asus Zenbook 14 UX433FA-A6018T
Intel Wireless-AC 9560
666 (585min - 685max) MBit/s +8%
Huawei MateBook 14 KLV-W29
Intel Wireless-AC 9560
663 MBit/s +8%
Acer Swift 3 SF314-55-31N8
Intel Wireless-AC 9560
630 (523min - 670max) MBit/s +2%
Acer Swift 3 SF314-55G-768V
Intel Wireless-AC 9560
615 (517min - 654max) MBit/s
Acer TravelMate X3410-M-50DD
Intel Dual Band Wireless-AC 7265
551 (441min - 572max) MBit/s -10%
Lenovo ThinkPad A485-20MU000CGE
Realtek RTL8822BE Wireless LAN 802.11ac PCIe Adapter
536 MBit/s -13%
04080120160200240280320360400440480520560600640680Tooltip
Acer Swift 3 SF314-55G-768V; iperf3 receive AX12; iperf 3.1.3: Ø615 (517-654)
Acer Swift 3 SF314-55G-768V; iperf3 transmit AX12; iperf 3.1.3: Ø637 (467-709)
284
cd/m²
290
cd/m²
280
cd/m²
295
cd/m²
323
cd/m²
299
cd/m²
298
cd/m²
312
cd/m²
309
cd/m²
Distribuição do brilho
Chi Mei CMN14D5 tested with X-Rite i1Pro 2
Máximo: 323 cd/m² (Nits) Médio: 298.9 cd/m² Minimum: 20 cd/m²
iluminação: 87 %
iluminação com acumulador: 317 cd/m²
Contraste: 923:1 (Preto: 0.35 cd/m²)
ΔE Color 3.13 | 0.5-29.43 Ø5, calibrated: 0.9
ΔE Greyscale 4.32 | 0.57-98 Ø5.3
99% sRGB (Argyll 1.6.3 3D)
64% AdobeRGB 1998 (Argyll 1.6.3 3D)
69.5% AdobeRGB 1998 (Argyll 2.2.0 3D)
98.9% sRGB (Argyll 2.2.0 3D)
67.3% Display P3 (Argyll 2.2.0 3D)
Gamma: 2.29
Acer Swift 3 SF314-55G-768V
Chi Mei CMN14D5, , 1920x1080, 14.00
Lenovo ThinkPad A485-20MU000CGE
NV140FHM-N46, , 1920x1080, 14.00
Huawei MateBook 14 KLV-W29
Chi Mei CMN8C02, , 2160x1440, 14.00
Acer TravelMate X3410-M-50DD
N140HCA-EAC, , 1920x1080, 14.00
Asus Zenbook 14 UX433FA-A6018T
AU Optronics B140HAN03.2, , 1920x1080, 14.00
Acer Swift 3 SF314-55-31N8
Chi Mei N140HCE-EN2, , 1920x1080, 14.00
Display
-40%
-1%
-37%
-7%
-2%
Display P3 Coverage
67.3
40.24
-40%
66.6
-1%
41.96
-38%
63.5
-6%
66.2
-2%
sRGB Coverage
98.9
60
-39%
97.8
-1%
63
-36%
90.9
-8%
98.3
-1%
AdobeRGB 1998 Coverage
69.5
41.57
-40%
68.1
-2%
43.37
-38%
64.6
-7%
67.8
-2%
Response Times
87%
4%
3229%
-3%
3297%
Response Time Grey 50% / Grey 80% *
40 ?(22, 18)
44.8 ?(22.8, 22)
-12%
38 ?(19.6, 18.4)
5%
42 ?(22, 20)
-5%
42 ?(21, 21)
-5%
41 ?(21, 20)
-3%
Response Time Black / White *
28 ?(15, 13)
35.2 ?(19.6, 15.6)
-26%
27.2 ?(17.2, 10)
3%
30 ?(17, 13)
-7%
28 ?(16, 12)
-0%
30 ?(18, 12)
-7%
PWM Frequency
250
1000 ?(99)
300%
24500 ?(20)
9700%
25000 ?(20)
9900%
Screen
-70%
-10%
-32%
-27%
-4%
Brightness middle
323
275
-15%
401.7
24%
255
-21%
321
-1%
291
-10%
Brightness
299
272
-9%
386
29%
218
-27%
282
-6%
276
-8%
Brightness Distribution
87
85
-2%
95
9%
72
-17%
77
-11%
90
3%
Black Level *
0.35
0.26
26%
0.42
-20%
0.08
77%
0.2
43%
0.27
23%
Contrast
923
1058
15%
956
4%
3188
245%
1605
74%
1078
17%
Colorchecker dE 2000 *
3.13
5.9
-88%
4.11
-31%
5.01
-60%
6.35
-103%
3.86
-23%
Colorchecker dE 2000 max. *
6.96
20
-187%
8.93
-28%
17.44
-151%
12.2
-75%
8.26
-19%
Colorchecker dE 2000 calibrated *
0.9
4.9
-444%
1.36
-51%
4.06
-351%
1.88
-109%
Greyscale dE 2000 *
4.32
3.6
17%
6.1
-41%
3
31%
8.35
-93%
5.33
-23%
Gamma
2.29 96%
2.36 93%
2.19 100%
2.26 97%
2.51 88%
2.25 98%
CCT
7436 87%
6798 96%
7222 90%
6185 105%
8227 79%
7426 88%
Color Space (Percent of AdobeRGB 1998)
64
38.1
-40%
62.7
-2%
40
-37%
59
-8%
62
-3%
Color Space (Percent of sRGB)
99
59.6
-40%
98.6
0%
63
-36%
91
-8%
98
-1%
Total Average (Program / Settings)
-8% / -37%
-2% / -6%
1053% / 543%
-12% / -20%
1097% / 615%

* ... smaller is better

Display Response Times

Display response times show how fast the screen is able to change from one color to the next. Slow response times can lead to afterimages and can cause moving objects to appear blurry (ghosting). Gamers of fast-paced 3D titles should pay special attention to fast response times.
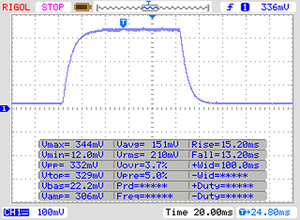
       Response Time Black to White
28 ms ... rise ↗ and fall ↘ combined↗ 15 ms rise
↘ 13 ms fall
The screen shows relatively slow response rates in our tests and may be too slow for gamers.
In comparison, all tested devices range from 0.1 (minimum) to 240 (maximum) ms. » 67 % of all devices are better.
This means that the measured response time is worse than the average of all tested devices (21.6 ms).
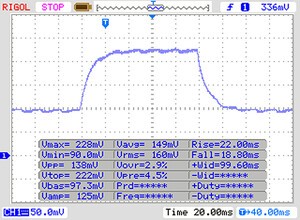
       Response Time 50% Grey to 80% Grey
40 ms ... rise ↗ and fall ↘ combined↗ 22 ms rise
↘ 18 ms fall
The screen shows slow response rates in our tests and will be unsatisfactory for gamers.
In comparison, all tested devices range from 0.2 (minimum) to 636 (maximum) ms. » 55 % of all devices are better.
This means that the measured response time is worse than the average of all tested devices (33.9 ms).

Screen Flickering / PWM (Pulse-Width Modulation)

To dim the screen, some notebooks will simply cycle the backlight on and off in rapid succession - a method called Pulse Width Modulation (PWM) . This cycling frequency should ideally be undetectable to the human eye. If said frequency is too low, users with sensitive eyes may experience strain or headaches or even notice the flickering altogether.
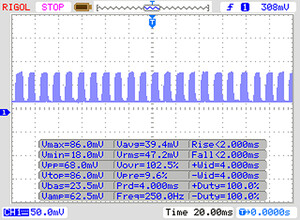
Screen flickering / PWM detected 250 Hz

The display backlight flickers at 250 Hz (worst case, e.g., utilizing PWM) .

The frequency of 250 Hz is relatively low, so sensitive users will likely notice flickering and experience eyestrain at the stated brightness setting and below.

In comparison: 53 % of all tested devices do not use PWM to dim the display. If PWM was detected, an average of 18080 (minimum: 5 - maximum: 3846000) Hz was measured.

 
0306090120150180210240270300330360390420450480510540Tooltip
Acer Swift 3 SF314-55G-768V Intel Core i7-8565U, Intel Core i7-8565U: Ø525 (504.86-564.35)
Acer Swift 3 SF314-55-31N8 Intel Core i3-8145U, Intel Core i3-8145U: Ø349 (347.66-361.38)
Lenovo ThinkPad A485-20MU000CGE AMD Ryzen 5 PRO 2500U, AMD Ryzen 5 PRO 2500U: Ø504 (495-536)
Acer TravelMate X3410-M-50DD Intel Core i7-8550U, Intel Core i7-8550U: Ø501 (497-532)
Cinebench R15
CPU Single 64Bit
Average of class Subnotebook
  (91.8 - 280, n=64, last 2 years)
235 Points +31%
Acer Swift 3 SF314-55G-768V
Intel Core i7-8565U
180 Points
Huawei MateBook 14 KLV-W29
Intel Core i7-8565U
177 Points -2%
Average Intel Core i7-8565U
  (138.3 - 193, n=51)
172.5 Points -4%
Acer TravelMate X3410-M-50DD
Intel Core i7-8550U
167 Points -7%
Acer Aspire 5 A515-52G-723L
Intel Core i7-8565U
165 Points -8%
HP Pavilion 15-cs2019ng
Intel Core i5-8265U
157 Points -13%
Acer Swift 3 SF314-55-31N8
Intel Core i3-8145U
150 Points -17%
Asus Zenbook 14 UX433FA-A6018T
Intel Core i5-8265U
149 Points -17%
Lenovo ThinkPad A485-20MU000CGE
AMD Ryzen 5 PRO 2500U
134 Points -26%
CPU Multi 64Bit
Average of class Subnotebook
  (514 - 2581, n=72, last 2 years)
1719 Points +205%
Huawei MateBook 14 KLV-W29
Intel Core i7-8565U
659 Points +17%
Asus Zenbook 14 UX433FA-A6018T
Intel Core i5-8265U
654 Points +16%
Asus Zenbook 14 UX433FA-A6018T
Intel Core i5-8265U
647 Points +15%
Average Intel Core i7-8565U
  (452 - 815, n=52)
612 Points +9%
Acer Swift 3 SF314-55G-768V
Intel Core i7-8565U
564 Points
Lenovo ThinkPad A485-20MU000CGE
AMD Ryzen 5 PRO 2500U
553 Points -2%
Acer TravelMate X3410-M-50DD
Intel Core i7-8550U
540 Points -4%
HP Pavilion 15-cs2019ng
Intel Core i5-8265U
528 Points -6%
Acer Aspire 5 A515-52G-723L
Intel Core i7-8565U
493 Points -13%
Acer Swift 3 SF314-55-31N8
Intel Core i3-8145U
361 Points -36%
Cinebench R15 CPU Single 64Bit
180 Points
Cinebench R15 CPU Multi 64Bit
564 Points
Cinebench R15 OpenGL 64Bit
94.3 fps
Cinebench R15 Ref. Match 64Bit
99.6 %
Ajuda
PCMark 10
Score
Average of class Subnotebook
  (4384 - 7428, n=57, last 2 years)
5834 Points +44%
Acer Aspire 5 A515-52G-723L
GeForce MX250, i7-8565U, WDC PC SN520 SDAPNUW-512G
4236 Points +4%
Huawei MateBook 14 KLV-W29
GeForce MX250, i7-8565U, Samsung SSD PM981 MZVLB512HAJQ
4205 Points +4%
HP Pavilion 15-cs2019ng
GeForce MX250, i5-8265U, Toshiba KBG30ZMV256G
4190 Points +3%
Average Intel Core i7-8565U, NVIDIA GeForce MX250
  (3759 - 4547, n=9)
4153 Points +2%
Acer Swift 3 SF314-55G-768V
GeForce MX250, i7-8565U, WDC PC SN520 SDAPNUW-512G
4061 Points
Asus Zenbook 14 UX433FA-A6018T
UHD Graphics 620, i5-8265U, WDC PC SN520 SDAPNUW-256G
3643 Points -10%
Acer TravelMate X3410-M-50DD
GeForce MX130, i5-8550U, Micron 1100 MTFDDAV256TBN
3565 Points -12%
Acer Swift 3 SF314-55-31N8
UHD Graphics 620, i3-8145U, Kingston RBUSNS8154P3128GJ
3179 Points -22%
Lenovo ThinkPad A485-20MU000CGE
Vega 8, R5 PRO 2500U, Samsung SSD PM981 MZVLB256HAHQ
2673 Points -34%
Essentials
Average of class Subnotebook
  (8890 - 11168, n=57, last 2 years)
10213 Points +37%
HP Pavilion 15-cs2019ng
GeForce MX250, i5-8265U, Toshiba KBG30ZMV256G
8394 Points +13%
Huawei MateBook 14 KLV-W29
GeForce MX250, i7-8565U, Samsung SSD PM981 MZVLB512HAJQ
8367 Points +12%
Acer Aspire 5 A515-52G-723L
GeForce MX250, i7-8565U, WDC PC SN520 SDAPNUW-512G
8233 Points +11%
Average Intel Core i7-8565U, NVIDIA GeForce MX250
  (7204 - 8929, n=9)
8038 Points +8%
Asus Zenbook 14 UX433FA-A6018T
UHD Graphics 620, i5-8265U, WDC PC SN520 SDAPNUW-256G
7618 Points +2%
Acer Swift 3 SF314-55G-768V
GeForce MX250, i7-8565U, WDC PC SN520 SDAPNUW-512G
7446 Points
Acer TravelMate X3410-M-50DD
GeForce MX130, i5-8550U, Micron 1100 MTFDDAV256TBN
7368 Points -1%
Acer Swift 3 SF314-55-31N8
UHD Graphics 620, i3-8145U, Kingston RBUSNS8154P3128GJ
6911 Points -7%
Lenovo ThinkPad A485-20MU000CGE
Vega 8, R5 PRO 2500U, Samsung SSD PM981 MZVLB256HAHQ
5848 Points -21%
Productivity
Average of class Subnotebook
  (6213 - 10279, n=57, last 2 years)
7841 Points +11%
Acer Aspire 5 A515-52G-723L
GeForce MX250, i7-8565U, WDC PC SN520 SDAPNUW-512G
7212 Points +2%
Acer Swift 3 SF314-55G-768V
GeForce MX250, i7-8565U, WDC PC SN520 SDAPNUW-512G
7037 Points
Average Intel Core i7-8565U, NVIDIA GeForce MX250
  (6302 - 7443, n=9)
6948 Points -1%
Huawei MateBook 14 KLV-W29
GeForce MX250, i7-8565U, Samsung SSD PM981 MZVLB512HAJQ
6916 Points -2%
HP Pavilion 15-cs2019ng
GeForce MX250, i5-8265U, Toshiba KBG30ZMV256G
6604 Points -6%
Asus Zenbook 14 UX433FA-A6018T
UHD Graphics 620, i5-8265U, WDC PC SN520 SDAPNUW-256G
5939 Points -16%
Acer TravelMate X3410-M-50DD
GeForce MX130, i5-8550U, Micron 1100 MTFDDAV256TBN
5437 Points -23%
Acer Swift 3 SF314-55-31N8
UHD Graphics 620, i3-8145U, Kingston RBUSNS8154P3128GJ
5274 Points -25%
Lenovo ThinkPad A485-20MU000CGE
Vega 8, R5 PRO 2500U, Samsung SSD PM981 MZVLB256HAHQ
3759 Points -47%
Digital Content Creation
Average of class Subnotebook
  (4093 - 9749, n=57, last 2 years)
6805 Points +96%
HP Pavilion 15-cs2019ng
GeForce MX250, i5-8265U, Toshiba KBG30ZMV256G
3604 Points +4%
Average Intel Core i7-8565U, NVIDIA GeForce MX250
  (3133 - 3841, n=9)
3489 Points +1%
Huawei MateBook 14 KLV-W29
GeForce MX250, i7-8565U, Samsung SSD PM981 MZVLB512HAJQ
3488 Points +1%
Acer Aspire 5 A515-52G-723L
GeForce MX250, i7-8565U, WDC PC SN520 SDAPNUW-512G
3475 Points 0%
Acer Swift 3 SF314-55G-768V
GeForce MX250, i7-8565U, WDC PC SN520 SDAPNUW-512G
3470 Points
Acer TravelMate X3410-M-50DD
GeForce MX130, i5-8550U, Micron 1100 MTFDDAV256TBN
3071 Points -11%
Asus Zenbook 14 UX433FA-A6018T
UHD Graphics 620, i5-8265U, WDC PC SN520 SDAPNUW-256G
2902 Points -16%
Acer Swift 3 SF314-55-31N8
UHD Graphics 620, i3-8145U, Kingston RBUSNS8154P3128GJ
2392 Points -31%
Lenovo ThinkPad A485-20MU000CGE
Vega 8, R5 PRO 2500U, Samsung SSD PM981 MZVLB256HAHQ
2359 Points -32%
PCMark 8
Home Score Accelerated v2
Average of class Subnotebook
  (4730 - 5285, n=3, last 2 years)
5030 Points +40%
Acer Aspire 5 A515-52G-723L
GeForce MX250, i7-8565U, WDC PC SN520 SDAPNUW-512G
4220 Points +18%
Average Intel Core i7-8565U, NVIDIA GeForce MX250
  (3331 - 4220, n=9)
3738 Points +4%
Asus Zenbook 14 UX433FA-A6018T
UHD Graphics 620, i5-8265U, WDC PC SN520 SDAPNUW-256G
3733 Points +4%
Huawei MateBook 14 KLV-W29
GeForce MX250, i7-8565U, Samsung SSD PM981 MZVLB512HAJQ
3612 Points +1%
HP Pavilion 15-cs2019ng
GeForce MX250, i5-8265U, Toshiba KBG30ZMV256G
3603 Points +1%
Acer Swift 3 SF314-55G-768V
GeForce MX250, i7-8565U, WDC PC SN520 SDAPNUW-512G
3581 Points
Acer TravelMate X3410-M-50DD
GeForce MX130, i5-8550U, Micron 1100 MTFDDAV256TBN
3578 Points 0%
Acer Swift 3 SF314-55-31N8
UHD Graphics 620, i3-8145U, Kingston RBUSNS8154P3128GJ
3281 Points -8%
Lenovo ThinkPad A485-20MU000CGE
Vega 8, R5 PRO 2500U, Samsung SSD PM981 MZVLB256HAHQ
2937 Points -18%
Work Score Accelerated v2
Acer Aspire 5 A515-52G-723L
GeForce MX250, i7-8565U, WDC PC SN520 SDAPNUW-512G
5272 Points +2%
HP Pavilion 15-cs2019ng
GeForce MX250, i5-8265U, Toshiba KBG30ZMV256G
5223 Points +1%
Acer Swift 3 SF314-55G-768V
GeForce MX250, i7-8565U, WDC PC SN520 SDAPNUW-512G
5174 Points
Average Intel Core i7-8565U, NVIDIA GeForce MX250
  (4796 - 5277, n=9)
5047 Points -2%
Acer TravelMate X3410-M-50DD
GeForce MX130, i5-8550U, Micron 1100 MTFDDAV256TBN
5030 Points -3%
Huawei MateBook 14 KLV-W29
GeForce MX250, i7-8565U, Samsung SSD PM981 MZVLB512HAJQ
4796 Points -7%
Asus Zenbook 14 UX433FA-A6018T
UHD Graphics 620, i5-8265U, WDC PC SN520 SDAPNUW-256G
4715 Points -9%
Acer Swift 3 SF314-55-31N8
UHD Graphics 620, i3-8145U, Kingston RBUSNS8154P3128GJ
4556 Points -12%
Lenovo ThinkPad A485-20MU000CGE
Vega 8, R5 PRO 2500U, Samsung SSD PM981 MZVLB256HAHQ
4123 Points -20%
Average of class Subnotebook
  (2972 - 5271, n=3, last 2 years)
3805 Points -26%
PCMark 8 Home Score Accelerated v2
3581 pontos
PCMark 8 Work Score Accelerated v2
5174 pontos
PCMark 10 Score
4061 pontos
Ajuda
Acer Swift 3 SF314-55G-768V
WDC PC SN520 SDAPNUW-512G
Lenovo ThinkPad A485-20MU000CGE
Samsung SSD PM981 MZVLB256HAHQ
Huawei MateBook 14 KLV-W29
Samsung SSD PM981 MZVLB512HAJQ
Acer TravelMate X3410-M-50DD
Micron 1100 MTFDDAV256TBN
Asus Zenbook 14 UX433FA-A6018T
WDC PC SN520 SDAPNUW-256G
Acer Swift 3 SF314-55-31N8
Kingston RBUSNS8154P3128GJ
Average WDC PC SN520 SDAPNUW-512G
 
CrystalDiskMark 5.2 / 6
-20%
-6%
-62%
-21%
-41%
-8%
Write 4K
185.5
114.8
-38%
165.9
-11%
85.4
-54%
99.9
-46%
96.8
-48%
138.5 ?(94.1 - 191.2, n=27)
-25%
Read 4K
50.2
41.33
-18%
28.04
-44%
26.4
-47%
40.03
-20%
36.99
-26%
44.2 ?(27.6 - 53.1, n=27)
-12%
Write Seq
1175
1271
8%
1009
-14%
402.5
-66%
973
-17%
463.1
-61%
1265 ?(750 - 1768, n=25)
8%
Read Seq
1132
1171
3%
962
-15%
461.2
-59%
1111
-2%
794
-30%
1237 ?(423 - 1710, n=25)
9%
Write 4K Q32T1
472.6
218.4
-54%
572
21%
175.8
-63%
424.6
-10%
291.7
-38%
404 ?(239 - 749, n=27)
-15%
Read 4K Q32T1
642
308.5
-52%
611
-5%
228.8
-64%
255.9
-60%
352
-45%
421 ?(229 - 654, n=27)
-34%
Write Seq Q32T1
1453
1460
0%
1720
18%
442.9
-70%
1300
-11%
468.1
-68%
1491 ?(1319 - 2544, n=27)
3%
Read Seq Q32T1
1738
1529
-12%
1775
2%
522
-70%
1723
-1%
1489
-14%
1741 ?(473 - 3433, n=27)
0%
Write 4K Q8T8
1208
309
715 ?(437 - 1211, n=4)
Read 4K Q8T8
983
247.1
1027 ?(926 - 1104, n=4)
AS SSD
-43%
6%
-68%
-29%
-51%
-13%
Seq Read
1438
1224
-15%
1225
-15%
492.9
-66%
1389
-3%
1201
-16%
1363 ?(399 - 2934, n=28)
-5%
Seq Write
1352
1118
-17%
1386
3%
462.2
-66%
795
-41%
434.5
-68%
1227 ?(412 - 2407, n=28)
-9%
4K Read
47.35
42.46
-10%
56.4
19%
26.89
-43%
37.3
-21%
40.9
-14%
40.8 ?(25 - 48.3, n=28)
-14%
4K Write
167.9
77.4
-54%
137.6
-18%
85.1
-49%
130.8
-22%
90
-46%
127.3 ?(82.1 - 179.7, n=27)
-24%
4K-64 Read
1051
559
-47%
1190
13%
234.2
-78%
653
-38%
425.5
-60%
957 ?(631 - 1296, n=28)
-9%
4K-64 Write
1211
378.1
-69%
1377
14%
312.8
-74%
605
-50%
390.9
-68%
1081 ?(709 - 1459, n=28)
-11%
Access Time Read *
0.081
0.046
0.114
0.184
0.07744 ?(0.045 - 0.131, n=25)
Access Time Write *
0.03
0.049
-63%
0.026
13%
0.056
-87%
0.028
7%
0.048
-60%
0.03671 ?(0.021 - 0.099, n=28)
-22%
Score Read
1242
724
-42%
1369
10%
310
-75%
829
-33%
586
-53%
1134 ?(721 - 1638, n=28)
-9%
Score Write
1514
567
-63%
1653
9%
444
-71%
815
-46%
524
-65%
1331 ?(926 - 1879, n=28)
-12%
Score Total
3397
1669
-51%
3743
10%
922
-73%
2048
-40%
1386
-59%
3046 ?(2126 - 4334, n=28)
-10%
Copy ISO MB/s
812
1837
923
601
310.1
1169 ?(765 - 1637, n=17)
Copy Program MB/s
209.4
473.6
453.6
246.8
88.4
446 ?(205 - 889, n=17)
Copy Game MB/s
356.1
1216
523
549
166.4
874 ?(509 - 1295, n=17)
Total Average (Program / Settings)
-32% / -33%
0% / 1%
-65% / -65%
-25% / -25%
-46% / -47%
-11% / -11%

* ... smaller is better

WDC PC SN520 SDAPNUW-512G
Sequential Read: 1148 MB/s
Sequential Write: 1176 MB/s
512K Read: 646 MB/s
512K Write: 773 MB/s
4K Read: 38.09 MB/s
4K Write: 129.2 MB/s
4K QD32 Read: 390.8 MB/s
4K QD32 Write: 244 MB/s
3DMark 11 - 1280x720 Performance GPU
Average of class Subnotebook
  (2979 - 16904, n=56, last 2 years)
8111 Points +126%
HP Pavilion 15-cs2019ng
NVIDIA GeForce MX250, Intel Core i5-8265U
4761 Points +33%
Acer Aspire 5 A515-52G-723L
NVIDIA GeForce MX250, Intel Core i7-8565U
4633 Points +29%
Huawei MateBook 14 KLV-W29
NVIDIA GeForce MX250, Intel Core i7-8565U
4459 Points +24%
Average NVIDIA GeForce MX250
  (3585 - 4942, n=29)
4404 Points +23%
Acer Swift 3 SF314-55G-768V
NVIDIA GeForce MX250, Intel Core i7-8565U
3593 Points
Acer TravelMate X3410-M-50DD
NVIDIA GeForce MX130, Intel Core i7-8550U
3203 Points -11%
Lenovo ThinkPad A485-20MU000CGE
AMD Radeon RX Vega 8 (Ryzen 2000/3000), AMD Ryzen 5 PRO 2500U
2794 Points -22%
Asus Zenbook 14 UX433FA-A6018T
Intel UHD Graphics 620, Intel Core i5-8265U
1851 Points -48%
Acer Swift 3 SF314-55-31N8
Intel UHD Graphics 620, Intel Core i3-8145U
1415 Points -61%
3DMark
1280x720 Cloud Gate Standard Graphics
Average of class Subnotebook
  (13768 - 65911, n=41, last 2 years)
29091 Points +43%
Huawei MateBook 14 KLV-W29
NVIDIA GeForce MX250, Intel Core i7-8565U
22615 Points +11%
HP Pavilion 15-cs2019ng
NVIDIA GeForce MX250, Intel Core i5-8265U
22232 Points +10%
Acer Aspire 5 A515-52G-723L
NVIDIA GeForce MX250, Intel Core i7-8565U
21545 Points +6%
Average NVIDIA GeForce MX250
  (13805 - 23863, n=25)
21491 Points +6%
Acer Swift 3 SF314-55G-768V
NVIDIA GeForce MX250, Intel Core i7-8565U
20283 Points
Acer TravelMate X3410-M-50DD
NVIDIA GeForce MX130, Intel Core i7-8550U
14880 Points -27%
Asus Zenbook 14 UX433FA-A6018T
Intel UHD Graphics 620, Intel Core i5-8265U
10968 Points -46%
Lenovo ThinkPad A485-20MU000CGE
AMD Radeon RX Vega 8 (Ryzen 2000/3000), AMD Ryzen 5 PRO 2500U
10370 Points -49%
Acer Swift 3 SF314-55-31N8
Intel UHD Graphics 620, Intel Core i3-8145U
7152 Points -65%
1920x1080 Fire Strike Graphics
Average of class Subnotebook
  (2837 - 12349, n=61, last 2 years)
5921 Points +99%
HP Pavilion 15-cs2019ng
NVIDIA GeForce MX250, Intel Core i5-8265U
3690 Points +24%
Huawei MateBook 14 KLV-W29
NVIDIA GeForce MX250, Intel Core i7-8565U
3664 Points +23%
Acer Aspire 5 A515-52G-723L
NVIDIA GeForce MX250, Intel Core i7-8565U
3616 Points +21%
Average NVIDIA GeForce MX250
  (2939 - 3885, n=29)
3531 Points +19%
Acer Swift 3 SF314-55G-768V
NVIDIA GeForce MX250, Intel Core i7-8565U
2977 Points
Acer TravelMate X3410-M-50DD
NVIDIA GeForce MX130, Intel Core i7-8550U
2495 Points -16%
Lenovo ThinkPad A485-20MU000CGE
AMD Radeon RX Vega 8 (Ryzen 2000/3000), AMD Ryzen 5 PRO 2500U
1757 Points -41%
Asus Zenbook 14 UX433FA-A6018T
Intel UHD Graphics 620, Intel Core i5-8265U
1292 Points -57%
Acer Swift 3 SF314-55-31N8
Intel UHD Graphics 620, Intel Core i3-8145U
838 Points -72%
2560x1440 Time Spy Graphics
Average of class Subnotebook
  (811 - 4773, n=60, last 2 years)
1990 Points
Huawei MateBook 14 KLV-W29
NVIDIA GeForce MX250, Intel Core i7-8565U
1130 Points
Acer Aspire 5 A515-52G-723L
NVIDIA GeForce MX250, Intel Core i7-8565U
1090 Points
Average NVIDIA GeForce MX250
  (881 - 1169, n=22)
1070 Points
3DMark 11 Performance
3942 pontos
3DMark Cloud Gate Standard Score
14136 pontos
3DMark Fire Strike Score
2762 pontos
Ajuda
The Witcher 3
1024x768 Low Graphics & Postprocessing
Average of class Subnotebook
  (37 - 249, n=54, last 2 years)
100.5 fps +73%
HP Pavilion 15-cs2019ng
Intel Core i5-8265U, NVIDIA GeForce MX250
65 fps +12%
Huawei MateBook 14 KLV-W29
Intel Core i7-8565U, NVIDIA GeForce MX250
64.5 fps +11%
Acer Aspire 5 A515-52G-723L
Intel Core i7-8565U, NVIDIA GeForce MX250
63.5 fps +9%
Average NVIDIA GeForce MX250
  (47.4 - 70, n=24)
60.8 fps +5%
Acer Swift 3 SF314-55G-768V
Intel Core i7-8565U, NVIDIA GeForce MX250
58 fps
Acer TravelMate X3410-M-50DD
Intel Core i7-8550U, NVIDIA GeForce MX130
47.3 fps -18%
Lenovo ThinkPad A485-20MU000CGE
AMD Ryzen 5 PRO 2500U, AMD Radeon RX Vega 8 (Ryzen 2000/3000)
29.5 fps -49%
1366x768 Medium Graphics & Postprocessing
Average of class Subnotebook
  (29 - 264, n=46, last 2 years)
63.2 fps +92%
Acer Aspire 5 A515-52G-723L
Intel Core i7-8565U, NVIDIA GeForce MX250
37.9 fps +15%
HP Pavilion 15-cs2019ng
Intel Core i5-8265U, NVIDIA GeForce MX250
37 fps +12%
Huawei MateBook 14 KLV-W29
Intel Core i7-8565U, NVIDIA GeForce MX250
36.5 fps +11%
Average NVIDIA GeForce MX250
  (30 - 40, n=27)
35.3 fps +7%
Acer Swift 3 SF314-55G-768V
Intel Core i7-8565U, NVIDIA GeForce MX250
33 fps
Acer TravelMate X3410-M-50DD
Intel Core i7-8550U, NVIDIA GeForce MX130
28.2 fps -15%
1920x1080 High Graphics & Postprocessing (Nvidia HairWorks Off)
Average of class Subnotebook
  (11.2 - 92, n=58, last 2 years)
34.7 fps +93%
HP Pavilion 15-cs2019ng
Intel Core i5-8265U, NVIDIA GeForce MX250
21 fps +17%
Huawei MateBook 14 KLV-W29
Intel Core i7-8565U, NVIDIA GeForce MX250
21 fps +17%
Acer Aspire 5 A515-52G-723L
Intel Core i7-8565U, NVIDIA GeForce MX250
20.4 fps +13%
Average NVIDIA GeForce MX250
  (16.3 - 23.1, n=27)
20.1 fps +12%
Acer Swift 3 SF314-55G-768V
Intel Core i7-8565U, NVIDIA GeForce MX250
18 fps
Acer TravelMate X3410-M-50DD
Intel Core i7-8550U, NVIDIA GeForce MX130
15.3 fps -15%
Lenovo ThinkPad A485-20MU000CGE
AMD Ryzen 5 PRO 2500U, AMD Radeon RX Vega 8 (Ryzen 2000/3000)
9.8 fps -46%
1920x1080 Ultra Graphics & Postprocessing (HBAO+)
Average of class Subnotebook
  (8 - 44.2, n=59, last 2 years)
18.7 fps
HP Pavilion 15-cs2019ng
Intel Core i5-8265U, NVIDIA GeForce MX250
16 fps
Huawei MateBook 14 KLV-W29
Intel Core i7-8565U, NVIDIA GeForce MX250
11.9 fps
Average NVIDIA GeForce MX250
  (9 - 16, n=24)
11.6 fps
Acer Aspire 5 A515-52G-723L
Intel Core i7-8565U, NVIDIA GeForce MX250
11.4 fps
BioShock Infinite
1366x768 High Preset
Acer Aspire 5 A515-52G-723L
Intel Core i7-8565U, NVIDIA GeForce MX250
94 fps +12%
Average NVIDIA GeForce MX250
  (84 - 100.5, n=14)
93.6 fps +11%
HP Pavilion 15-cs2019ng
Intel Core i5-8265U, NVIDIA GeForce MX250
93 fps +11%
Acer Swift 3 SF314-55G-768V
Intel Core i7-8565U, NVIDIA GeForce MX250
84 fps
Acer TravelMate X3410-M-50DD
Intel Core i7-8550U, NVIDIA GeForce MX130
68.8 fps -18%
Asus Zenbook 14 UX433FA-A6018T
Intel Core i5-8265U, Intel UHD Graphics 620
31 fps -63%
Acer Swift 3 SF314-55-31N8
Intel Core i3-8145U, Intel UHD Graphics 620
19.1 fps -77%
1366x768 Medium Preset
HP Pavilion 15-cs2019ng
Intel Core i5-8265U, NVIDIA GeForce MX250
110 fps +12%
Average NVIDIA GeForce MX250
  (98.4 - 117.5, n=14)
109.1 fps +11%
Acer Aspire 5 A515-52G-723L
Intel Core i7-8565U, NVIDIA GeForce MX250
107 fps +9%
Acer Swift 3 SF314-55G-768V
Intel Core i7-8565U, NVIDIA GeForce MX250
98.4 fps
Acer TravelMate X3410-M-50DD
Intel Core i7-8550U, NVIDIA GeForce MX130
80.2 fps -18%
Asus Zenbook 14 UX433FA-A6018T
Intel Core i5-8265U, Intel UHD Graphics 620
36.7 fps -63%
Acer Swift 3 SF314-55-31N8
Intel Core i3-8145U, Intel UHD Graphics 620
23.3 fps -76%
1280x720 Very Low Preset
HP Pavilion 15-cs2019ng
Intel Core i5-8265U, NVIDIA GeForce MX250
197 fps +12%
Average NVIDIA GeForce MX250
  (133.9 - 212, n=14)
187.3 fps +7%
Acer Aspire 5 A515-52G-723L
Intel Core i7-8565U, NVIDIA GeForce MX250
180.2 fps +3%
Acer Swift 3 SF314-55G-768V
Intel Core i7-8565U, NVIDIA GeForce MX250
175.5 fps
Acer TravelMate X3410-M-50DD
Intel Core i7-8550U, NVIDIA GeForce MX130
138.1 fps -21%
Asus Zenbook 14 UX433FA-A6018T
Intel Core i5-8265U, Intel UHD Graphics 620
67.4 fps -62%
Acer Swift 3 SF314-55-31N8
Intel Core i3-8145U, Intel UHD Graphics 620
40.2 fps -77%
Dota 2 Reborn
1280x720 min (0/3) fastest
Acer Swift 3 SF314-55G-768V
Intel Core i7-8565U, NVIDIA GeForce MX250
118 (103min) fps
Average of class Subnotebook
  (57.5 - 152.8, n=60, last 2 years)
109.3 fps -7%
Average NVIDIA GeForce MX250
  (71 - 131, n=21)
108.5 fps -8%
Acer Aspire 5 A515-52G-723L
Intel Core i7-8565U, NVIDIA GeForce MX250
89.2 fps -24%
1366x768 med (1/3)
Acer Swift 3 SF314-55G-768V
Intel Core i7-8565U, NVIDIA GeForce MX250
98.7 (83.8min) fps
Average of class Subnotebook
  (53.7 - 137.8, n=60, last 2 years)
88 fps -11%
Average NVIDIA GeForce MX250
  (21.8 - 109, n=21)
86.7 fps -12%
Acer Aspire 5 A515-52G-723L
Intel Core i7-8565U, NVIDIA GeForce MX250
79.5 fps -19%
1920x1080 high (2/3)
Acer Aspire 5 A515-52G-723L
Intel Core i7-8565U, NVIDIA GeForce MX250
66.4 fps +9%
Average of class Subnotebook
  (37.4 - 115, n=60, last 2 years)
66 fps +9%
Average NVIDIA GeForce MX250
  (8.6 - 77.4, n=21)
62 fps +2%
Acer Swift 3 SF314-55G-768V
Intel Core i7-8565U, NVIDIA GeForce MX250
60.7 (54.2min) fps
1920x1080 ultra (3/3) best looking
Average of class Subnotebook
  (29.4 - 109.1, n=60, last 2 years)
59.7 fps +9%
Acer Swift 3 SF314-55G-768V
Intel Core i7-8565U, NVIDIA GeForce MX250
54.7 (47.4min) fps
Average NVIDIA GeForce MX250
  (7.8 - 67.5, n=21)
53.6 fps -2%
Acer Aspire 5 A515-52G-723L
Intel Core i7-8565U, NVIDIA GeForce MX250
52.9 fps -3%
baixo média alto ultra
BioShock Infinite (2013) 175.5 98.4 84 32.27
The Witcher 3 (2015) 58 33 18
Dota 2 Reborn (2015) 118 98.7 60.7 54.7

Barulho

Ocioso
31.5 / 31.5 / 31.5 dB
Carga
33.4 / 33.6 dB
  red to green bar
 
 
30 dB
silencioso
40 dB(A)
audível
50 dB(A)
ruidosamente alto
 
min: dark, med: mid, max: light   Audix TM1, Arta (15 cm de distância)   environment noise: 30.4 dB(A)
dB(A) 0102030405060708090Deep BassMiddle BassHigh BassLower RangeMidsHigher MidsLower HighsMid HighsUpper HighsSuper Highs2035.631.230.831.435.62534.232.231.530.734.23135.833.933.231.735.84031.831.73029.831.85032.431.831.13132.46329.930.629.928.529.98027.427.227.126.327.41002726.426.724.92712527.22725.525.427.216025.324.72423.225.320024.623.823.722.224.625023.624.3232223.631524.924.722.421.424.940022.522.421.220.722.550021.522.120.619.821.563020.821.620.318.820.880021.421.819.918.221.4100022.322.619.718.322.3125021.921.91917.721.9160021.62219.417.421.6200021.922.119.417.721.925002222.118.817.722315021.92218.717.821.9400020.220.818.618.220.2500020.220.21918.120.2630019.319.31918.319.3800019.319.219.118.419.31000019.21919.118.419.21250019.118.919.418.319.11600019.71919.118.419.7SPL33.433.631.630.533.4N1.81.81.51.31.8median 21.9median 22median 19.4median 18.4median 21.9Delta1.81.811.31.8hearing rangehide median Fan NoiseAcer Swift 3 SF314-55G-768V
Carga Máxima
 37.4 °C48.6 °C46.8 °C 
 29 °C39.3 °C38 °C 
 27.1 °C28.7 °C30.9 °C 
Máximo: 48.6 °C
Médio: 36.2 °C
48.4 °C49.2 °C40.6 °C
40.1 °C40.3 °C31 °C
33.6 °C32.4 °C29.1 °C
Máximo: 49.2 °C
Médio: 38.3 °C
alimentação elétrica  49.4 °C | Temperatura do quarto 23.2 °C | FIRT 550-Pocket
(±) The average temperature for the upper side under maximal load is 36.2 °C / 97 F, compared to the average of 30.7 °C / 87 F for the devices in the class Subnotebook.
(-) The maximum temperature on the upper side is 48.6 °C / 119 F, compared to the average of 35.9 °C / 97 F, ranging from 21.4 to 59 °C for the class Subnotebook.
(-) The bottom heats up to a maximum of 49.2 °C / 121 F, compared to the average of 39.4 °C / 103 F
(+) In idle usage, the average temperature for the upper side is 26.5 °C / 80 F, compared to the device average of 30.7 °C / 87 F.
(+) The palmrests and touchpad are cooler than skin temperature with a maximum of 30.9 °C / 87.6 F and are therefore cool to the touch.
(-) The average temperature of the palmrest area of similar devices was 28.3 °C / 82.9 F (-2.6 °C / -4.7 F).
dB(A) 0102030405060708090Deep BassMiddle BassHigh BassLower RangeMidsHigher MidsLower HighsMid HighsUpper HighsSuper Highs2033.331.433.32534.730.734.73133.131.733.14030.629.830.65032.63132.66329.928.529.98026.926.326.910026.724.926.712526.525.426.516035.323.235.320040.322.240.32504722473155121.45140057.320.757.350058.919.858.963061.418.861.480072.118.272.1100069.318.369.3125066.517.766.5160063.917.463.9200066.117.766.125006517.765315064.817.864.8400065.318.265.350006718.167630063.118.363.1800060.218.460.21000061.918.461.91250067.118.367.1160006118.461SPL7830.578N38.51.338.5median 61.9median 18.4median 61.9Delta9.11.39.135.335.132.931.831.83236.535.132.428.93328.936.328.848.32761.52752.924.860.92462.822.763.32269.521.267.82174.82075.919.472.718.97117.770.117.86917.671.817.668.117.671.417.673.717.670.417.571.617.671.617.669.617.459.717.583.630.662.51.5median 69.6median 17.84.72.4hearing rangehide median Pink NoiseAcer Swift 3 SF314-55G-768VApple MacBook 12 (Early 2016) 1.1 GHz
Frequency diagram (checkboxes can be checked and unchecked to compare devices)
Acer Swift 3 SF314-55G-768V audio analysis

(±) | speaker loudness is average but good (72.1 dB)
Bass 100 - 315 Hz
(-) | nearly no bass - on average 24.1% lower than median
(±) | linearity of bass is average (9.6% delta to prev. frequency)
Mids 400 - 2000 Hz
(+) | balanced mids - only 4.6% away from median
(±) | linearity of mids is average (9.1% delta to prev. frequency)
Highs 2 - 16 kHz
(+) | balanced highs - only 2.5% away from median
(+) | highs are linear (3.9% delta to prev. frequency)
Overall 100 - 16.000 Hz
(±) | linearity of overall sound is average (22.4% difference to median)
Compared to same class
» 72% of all tested devices in this class were better, 5% similar, 23% worse
» The best had a delta of 5%, average was 19%, worst was 53%
Compared to all devices tested
» 60% of all tested devices were better, 6% similar, 33% worse
» The best had a delta of 4%, average was 25%, worst was 134%

Apple MacBook 12 (Early 2016) 1.1 GHz audio analysis

(+) | speakers can play relatively loud (83.6 dB)
Bass 100 - 315 Hz
(±) | reduced bass - on average 11.3% lower than median
(±) | linearity of bass is average (14.2% delta to prev. frequency)
Mids 400 - 2000 Hz
(+) | balanced mids - only 2.4% away from median
(+) | mids are linear (5.5% delta to prev. frequency)
Highs 2 - 16 kHz
(+) | balanced highs - only 2% away from median
(+) | highs are linear (4.5% delta to prev. frequency)
Overall 100 - 16.000 Hz
(+) | overall sound is linear (10.2% difference to median)
Compared to same class
» 5% of all tested devices in this class were better, 2% similar, 93% worse
» The best had a delta of 5%, average was 19%, worst was 53%
Compared to all devices tested
» 3% of all tested devices were better, 1% similar, 96% worse
» The best had a delta of 4%, average was 25%, worst was 134%

Consumo de energia
desligadodarklight 0.3 / 0.62 Watt
Ociosodarkmidlight 7.4 / 9.9 / 11.7 Watt
Carga midlight 29 / 52 Watt
 color bar
Key: min: dark, med: mid, max: light        Metrahit Energy
Currently we use the Metrahit Energy, a professional single phase power quality and energy measurement digital multimeter, for our measurements. Find out more about it here. All of our test methods can be found here.
Acer Swift 3 SF314-55G-768V
i7-8565U, GeForce MX250, WDC PC SN520 SDAPNUW-512G, IPS, 1920x1080, 14.00
Lenovo ThinkPad A485-20MU000CGE
R5 PRO 2500U, Vega 8, Samsung SSD PM981 MZVLB256HAHQ, IPS LED, 1920x1080, 14.00
Huawei MateBook 14 KLV-W29
i7-8565U, GeForce MX250, Samsung SSD PM981 MZVLB512HAJQ, IPS, 2160x1440, 14.00
Acer TravelMate X3410-M-50DD
i5-8550U, GeForce MX130, Micron 1100 MTFDDAV256TBN, IPS LED, 1920x1080, 14.00
Asus Zenbook 14 UX433FA-A6018T
i5-8265U, UHD Graphics 620, WDC PC SN520 SDAPNUW-256G, IPS, 1920x1080, 14.00
Acer Swift 3 SF314-55-31N8
i3-8145U, UHD Graphics 620, Kingston RBUSNS8154P3128GJ, IPS, 1920x1080, 14.00
Average NVIDIA GeForce MX250
 
Average of class Subnotebook
 
Power Consumption
2%
-16%
-5%
26%
37%
-12%
-6%
Idle Minimum *
7.4
5.3
28%
3.7
50%
4.6
38%
2.7
64%
2.9
61%
4.1 ?(2.16 - 7.4, n=29)
45%
4.91 ?(1.77 - 11.8, n=64, last 2 years)
34%
Idle Average *
9.9
8.3
16%
9.3
6%
6.5
34%
5.8
41%
5.6
43%
7.91 ?(4.2 - 12.4, n=29)
20%
8.38 ?(4.6 - 17.4, n=64, last 2 years)
15%
Idle Maximum *
11.7
11.4
3%
12.8
-9%
8.5
27%
10.2
13%
6.1
48%
10.4 ?(7 - 16.2, n=29)
11%
10.4 ?(5.1 - 22.4, n=64, last 2 years)
11%
Load Average *
29
42
-45%
58.8
-103%
56
-93%
34.9
-20%
29
-0%
58.6 ?(29 - 84, n=29)
-102%
46.4 ?(19.1 - 83.3, n=63, last 2 years)
-60%
Load Maximum *
52
48.8
6%
65
-25%
67
-29%
35
33%
35.3
32%
68.9 ?(38 - 131, n=29)
-33%
66.6 ?(24.2 - 121.2, n=64, last 2 years)
-28%
Witcher 3 ultra *
55.8

* ... smaller is better

Tempo de Execução da Bateria
Ocioso (sem WLAN, min brilho)
16h 08min
WiFi Websurfing
8h 04min
Carga (máximo brilho)
1h 44min
Acer Swift 3 SF314-55G-768V
i7-8565U, GeForce MX250, 50.7 Wh
Lenovo ThinkPad A485-20MU000CGE
R5 PRO 2500U, Vega 8, 48 Wh
Huawei MateBook 14 KLV-W29
i7-8565U, GeForce MX250, 57.4 Wh
Acer TravelMate X3410-M-50DD
i5-8550U, GeForce MX130, 57 Wh
Asus Zenbook 14 UX433FA-A6018T
i5-8265U, UHD Graphics 620, 50 Wh
Acer Swift 3 SF314-55-31N8
i3-8145U, UHD Graphics 620, 50.7 Wh
Average of class Subnotebook
 
Battery Runtime
-33%
19%
23%
16%
27%
21%
Reader / Idle
968
671
-31%
1435
48%
1041
8%
1197 ?(581 - 2550, n=10, last 2 years)
24%
WiFi v1.3
484
330
-32%
503
4%
651
35%
563
16%
614
27%
624 ?(303 - 1144, n=65, last 2 years)
29%
Load
104
68
-35%
109
5%
131
26%
115.3 ?(61 - 197, n=48, last 2 years)
11%
H.264
368
695
786 ?(426 - 1153, n=31, last 2 years)

Pro

+ Tela IPS mate
+ Resolução Full HD
+ SSD NVMe
+ Iluminação do teclado
+ Opera sempre silenciosamente
+ DisplayPort via USB-C
+ Pode ser carregado via USB-C

Contra

- Memória de trabalho soldada
- A memória de trabalho não pode ser expandida
- PWM para o controle do brilho
- Somente o modelo de 10-watts do MX250 é utilizado

Veredicto - Mais desempenho em troca de menos duração da bateria

In review: Acer Swift 3. Test unit provided by notebooksbilliger.de

Em nosso teste, o Acer Swift 3 mostra um bom desempenho para aplicativos de escritório mais exigentes e para jogos ocasionais com configurações gráficas baixas. Enquanto o desempenho do i7-8565U cai ligeiramente após um curto período de tempo, pode então manter um nível ligeiramente acima do Core i7-8550U ou do Ryzen 5 PRO 2500U. Com cerca de oito horas, a duração da bateria também é boa, o que, em combinação com suas dimensões compactas, torna o Swift 3 um bom companheiro móvel.

Com hardware mais potente, o Acer Swift 3 também oferece um melhor desempenho. No entanto, isso é compensado com uma duração mais curta da bateria e maior consumo de energia.

Em termos de tela, a Acer dá um passo para trás em comparação com o nosso teste do Swift 3 de janeiro de 2019. Embora o brilho seja um pouco mais alto, o PWM é usado a uma frequência significativamente menor. Enquanto a Nvidia GeForce MX250 dedicada também oferece um melhor desempenho gráfico, isso é acompanhado por maior consumo de energia e menor duração da bateria. Para usuários que podem viver sem uma duração de bateria mais longa em troca do aumento de desempenho, vale a pena dar uma olhada no Swift 3.

Acer Swift 3 SF314-55G-768V - 05/27/2019 v6(old)
Mike Wobker
Acabamento
86 /  98 → 87%
Teclado
82%
Mouse
86%
Conectividade
56 / 80 → 70%
Peso
69 / 35-78 → 79%
Bateria
90%
Pantalha
89%
Desempenho do jogos
75 / 68 → 100%
Desempenho da aplicação
91 / 87 → 100%
Temperatura
88 / 91 → 97%
Ruído
92%
Audio
55 / 91 → 60%
Camera
44 / 85 → 52%
Médio
77%
86%
Subnotebook - Médio equilibrado

Pricecompare

Please share our article, every link counts!
> Análises e revisões de portáteis e celulares > Análises > Análises > Breve Análise do Portátil Acer Swift 3 SF314 (i7-8565U, MX250)
Mike Wobker, 2019-05-29 (Update: 2019-05-29)