Breve Análise do Portátil Lenovo IdeaPad 320-15IKBRN (8250U, MX150, FHD)

| SD Card Reader | |
| average JPG Copy Test (av. of 3 runs) | |
| HP Pavilion 15-cc107ng (Toshiba Exceria Pro SDXC 64 GB UHS-II) | |
| Acer Aspire 7 A715-71G-53TU (Toshiba Exceria Pro SDXC 64 GB UHS-II) | |
| Asus VivoBook 15 X510UQ-BQ534T (Toshiba Exceria Pro SDXC 64 GB UHS-II) | |
| Acer Swift 3 SF315-41-R4W1 | |
| Lenovo IdeaPad 320-15IKBRN 81BG001KGE (Toshiba Exceria Pro SDXC 64 GB UHS-II) | |
| Lenovo IdeaPad 320-15IKB 80XL01NEGE (Toshiba Exceria Pro SDXC 64 GB UHS-II) | |
| Asus ZenBook UX530UX-FY070T (Toshiba Exceria Pro SDXC 64 GB UHS-II) | |
| maximum AS SSD Seq Read Test (1GB) | |
| HP Pavilion 15-cc107ng (Toshiba Exceria Pro SDXC 64 GB UHS-II) | |
| Acer Aspire 7 A715-71G-53TU (Toshiba Exceria Pro SDXC 64 GB UHS-II) | |
| Asus VivoBook 15 X510UQ-BQ534T (Toshiba Exceria Pro SDXC 64 GB UHS-II) | |
| Acer Swift 3 SF315-41-R4W1 | |
| Lenovo IdeaPad 320-15IKBRN 81BG001KGE (Toshiba Exceria Pro SDXC 64 GB UHS-II) | |
| Lenovo IdeaPad 320-15IKB 80XL01NEGE (Toshiba Exceria Pro SDXC 64 GB UHS-II) | |
| Asus ZenBook UX530UX-FY070T (Toshiba Exceria Pro SDXC 64 GB UHS-II) | |
| Networking | |
| iperf3 transmit AX12 | |
| HP Pavilion 15-cc107ng | |
| Asus ZenBook UX530UX-FY070T | |
| Asus VivoBook 15 X510UQ-BQ534T | |
| Acer Aspire 7 A715-71G-53TU | |
| Acer Swift 3 SF315-41-R4W1 | |
| Lenovo IdeaPad 320-15IKB 80XL01NEGE | |
| Lenovo IdeaPad 320-15IKBRN 81BG001KGE | |
| iperf3 receive AX12 | |
| Acer Aspire 7 A715-71G-53TU | |
| Acer Swift 3 SF315-41-R4W1 | |
| HP Pavilion 15-cc107ng | |
| Asus VivoBook 15 X510UQ-BQ534T | |
| Asus ZenBook UX530UX-FY070T | |
| Lenovo IdeaPad 320-15IKBRN 81BG001KGE | |
| Lenovo IdeaPad 320-15IKB 80XL01NEGE | |
| |||||||||||||||||||||||||
iluminação: 84 %
iluminação com acumulador: 220 cd/m²
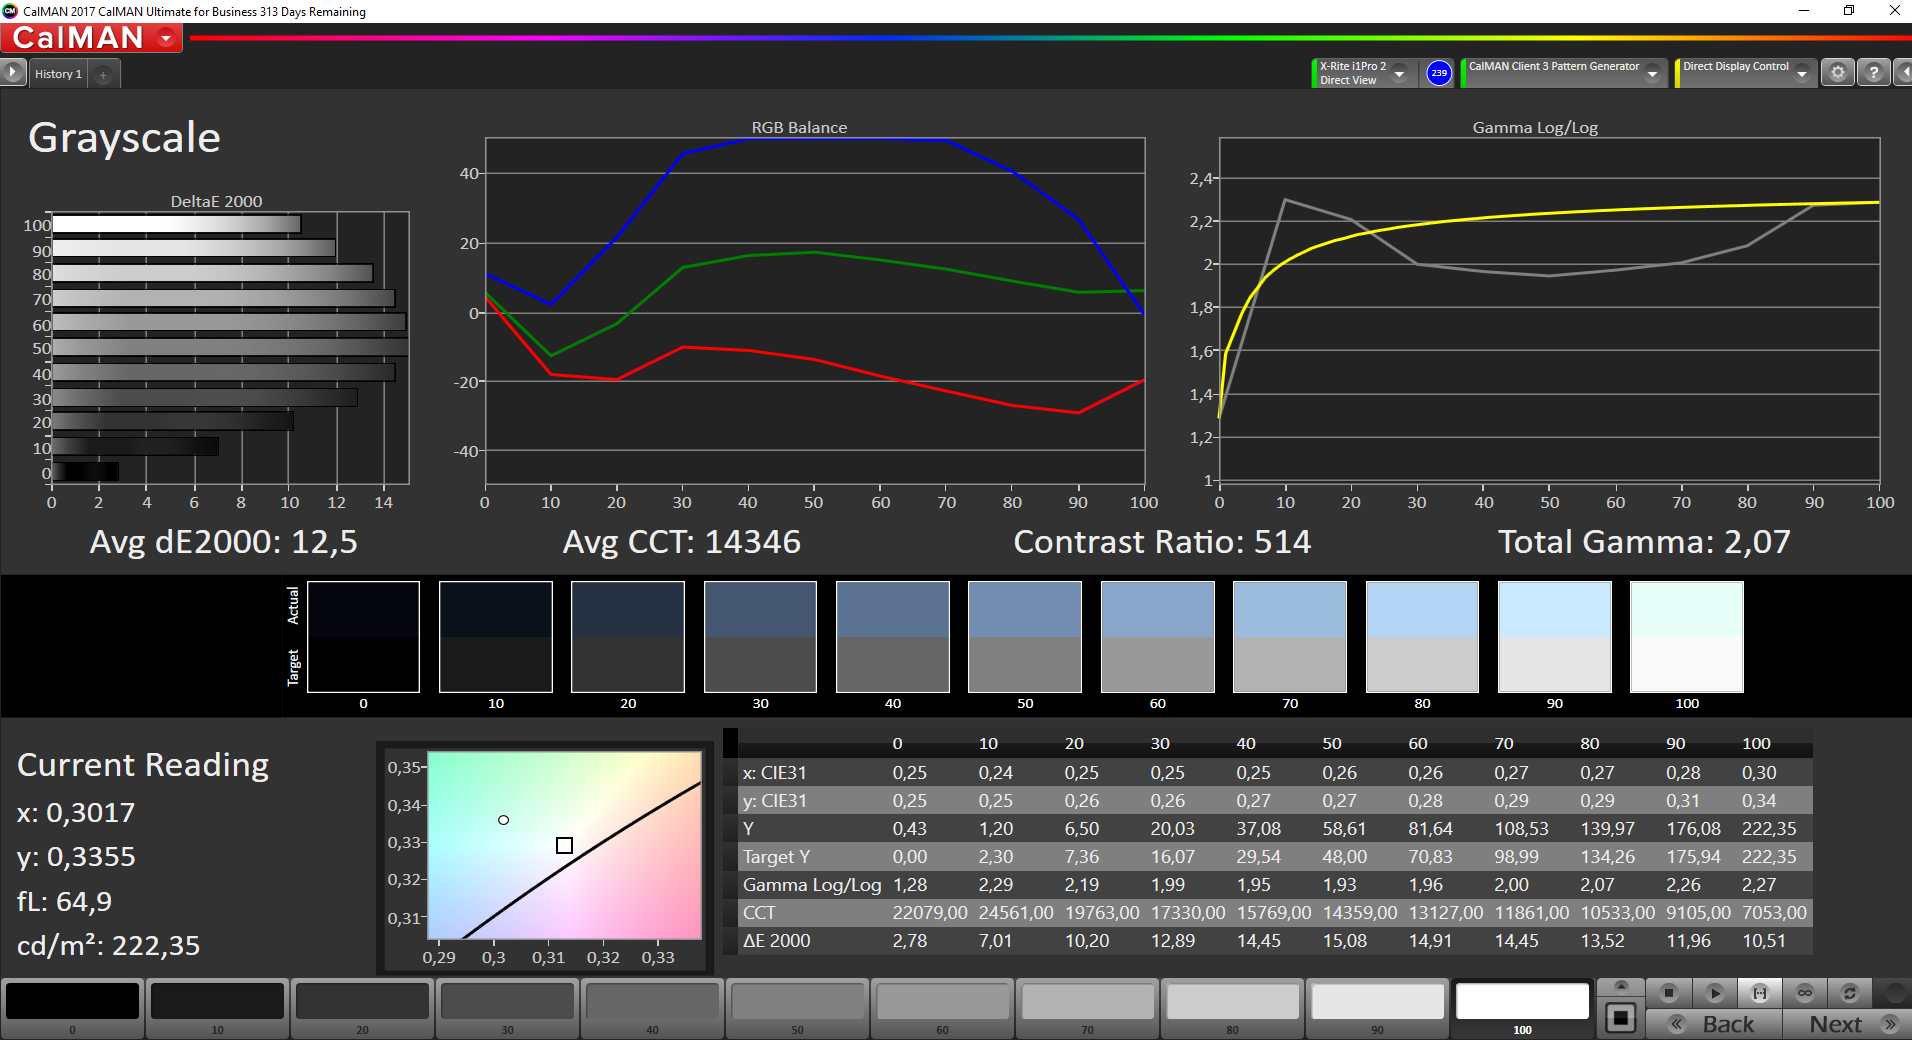
Contraste: 512:1 (Preto: 0.43 cd/m²)
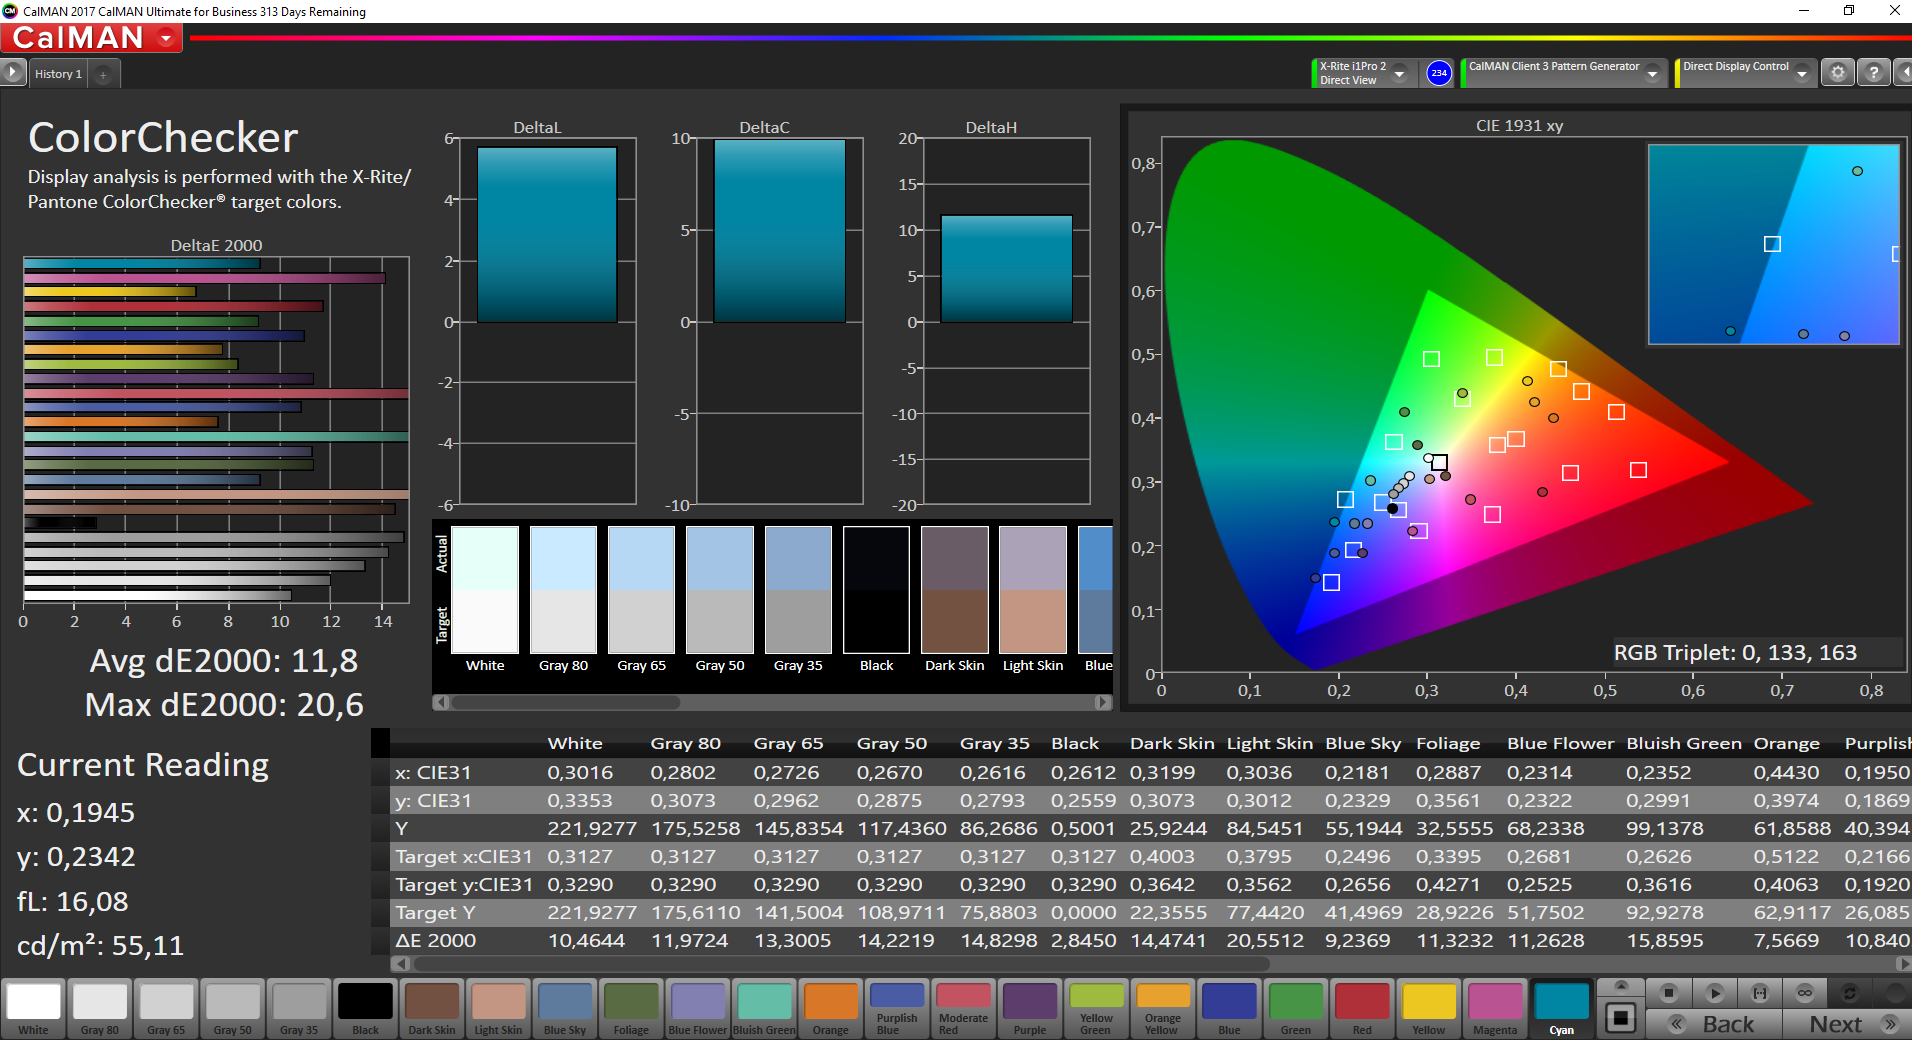
ΔE ColorChecker Calman: 11.8 | ∀{0.5-29.43 Ø4.71}
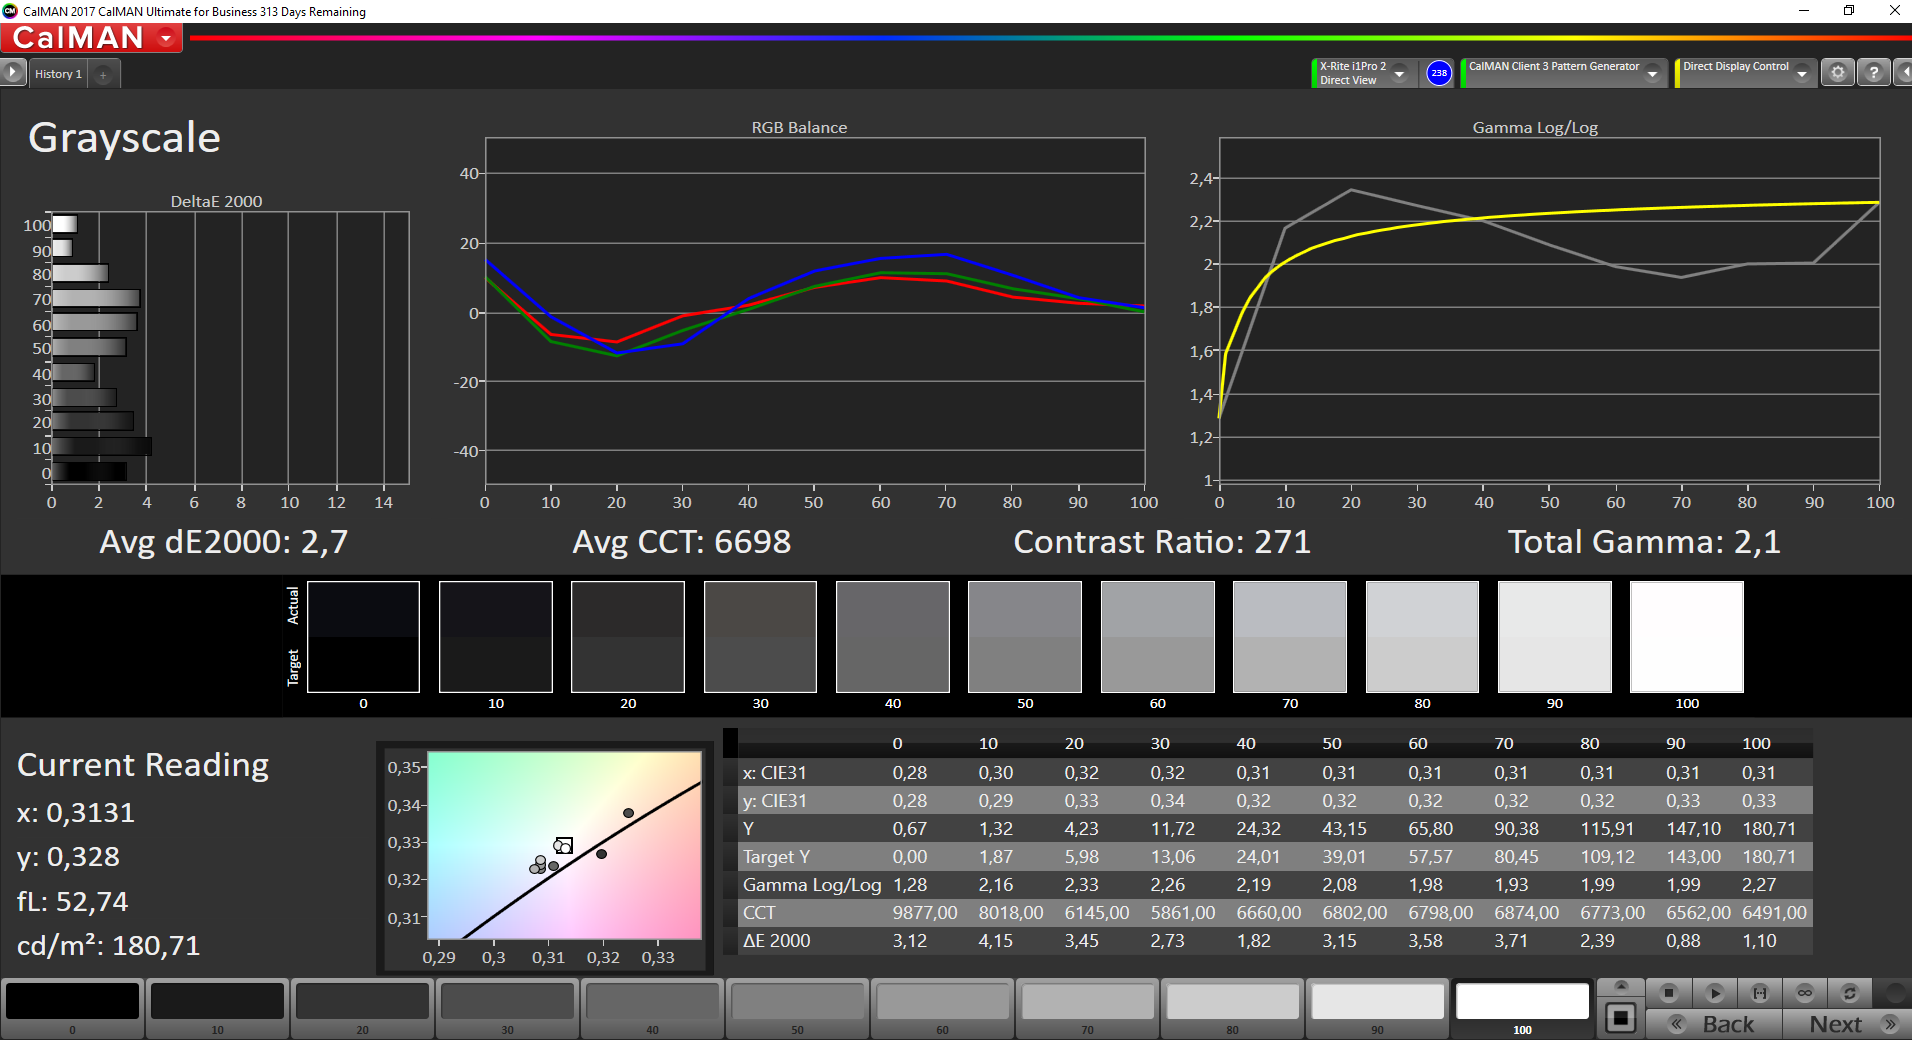
ΔE Greyscale Calman: 12.5 | ∀{0.09-98 Ø4.96}
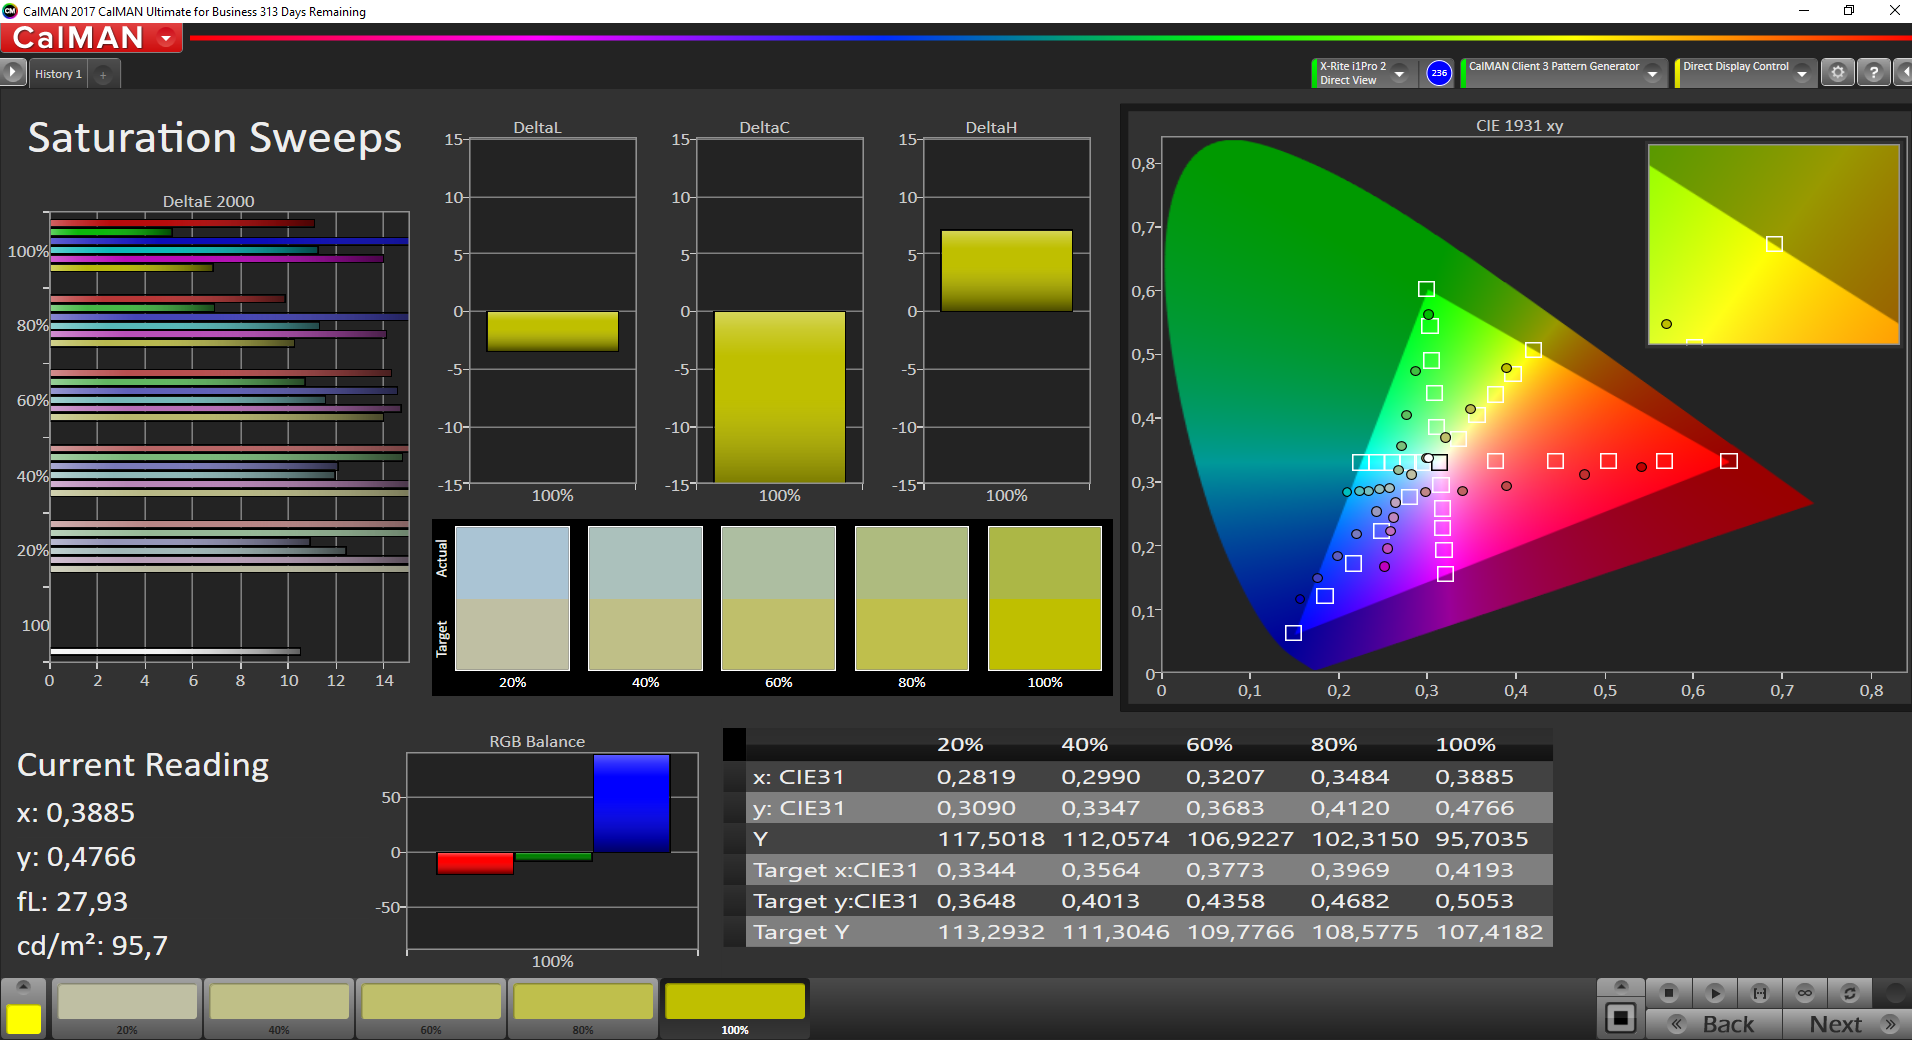
62.7% sRGB (Argyll 1.6.3 3D)
40.1% AdobeRGB 1998 (Argyll 1.6.3 3D)
43.44% AdobeRGB 1998 (Argyll 3D)
62.8% sRGB (Argyll 3D)
42.04% Display P3 (Argyll 3D)
Gamma: 2.07
CCT: 14346 K
| Lenovo IdeaPad 320-15IKBRN 81BG001KGE Chi Mei CMN15D5, N156HGA-EAB, 1920x1080, 15.6" | Lenovo IdeaPad 320-15IKB 80XL01NEGE Chi Mei N156HGA-EAB, 1920x1080, 15.6" | Asus ZenBook UX530UX-FY070T Chi Mei CMN15E8, 1920x1080, 15.6" | Asus VivoBook 15 X510UQ-BQ534T LG Philips LP156WF9-SPK2, 1920x1080, 15.6" | Acer Swift 3 SF315-41-R4W1 BOE CQ NV156FHM-N48, 1920x1080, 15.6" | HP Pavilion 15-cc107ng AU Optronics, 1920x1080, 15.6" | Acer Aspire 7 A715-71G-53TU BOE NV156FHM-N42 , 1920x1080, 15.6" | |
|---|---|---|---|---|---|---|---|
| Display | -6% | 49% | -7% | -6% | -11% | -4% | |
| Display P3 Coverage (%) | 42.04 | 39.47 -6% | 64.3 53% | 39.22 -7% | 39.59 -6% | 37.28 -11% | 40.53 -4% |
| sRGB Coverage (%) | 62.8 | 59 -6% | 90.6 44% | 59 -6% | 58.5 -7% | 56.1 -11% | 59.9 -5% |
| AdobeRGB 1998 Coverage (%) | 43.44 | 40.81 -6% | 65.2 50% | 40.55 -7% | 40.9 -6% | 38.51 -11% | 41.87 -4% |
| Response Times | 10% | -32% | 19% | -63% | 10% | -66% | |
| Response Time Grey 50% / Grey 80% * (ms) | 45.6 ? | 42 ? 8% | 40 ? 12% | 43 ? 6% | 46 ? -1% | 45 ? 1% | 49 ? -7% |
| Response Time Black / White * (ms) | 16 ? | 14 ? 12% | 28 ? -75% | 11 ? 31% | 36 ? -125% | 13 ? 19% | 36 ? -125% |
| PWM Frequency (Hz) | 25770 ? | 25000 ? | 25000 ? | 21000 ? | 20000 ? | ||
| Screen | 0% | 56% | 38% | 40% | 3% | 33% | |
| Brightness middle (cd/m²) | 220 | 227 3% | 309 40% | 267 21% | 237 8% | 234 6% | 267 21% |
| Brightness (cd/m²) | 194 | 207 7% | 296 53% | 250 29% | 229 18% | 230 19% | 250 29% |
| Brightness Distribution (%) | 84 | 81 -4% | 80 -5% | 83 -1% | 88 5% | 76 -10% | 82 -2% |
| Black Level * (cd/m²) | 0.43 | 0.44 -2% | 0.24 44% | 0.22 49% | 0.19 56% | 0.34 21% | 0.31 28% |
| Contrast (:1) | 512 | 516 1% | 1288 152% | 1214 137% | 1247 144% | 688 34% | 861 68% |
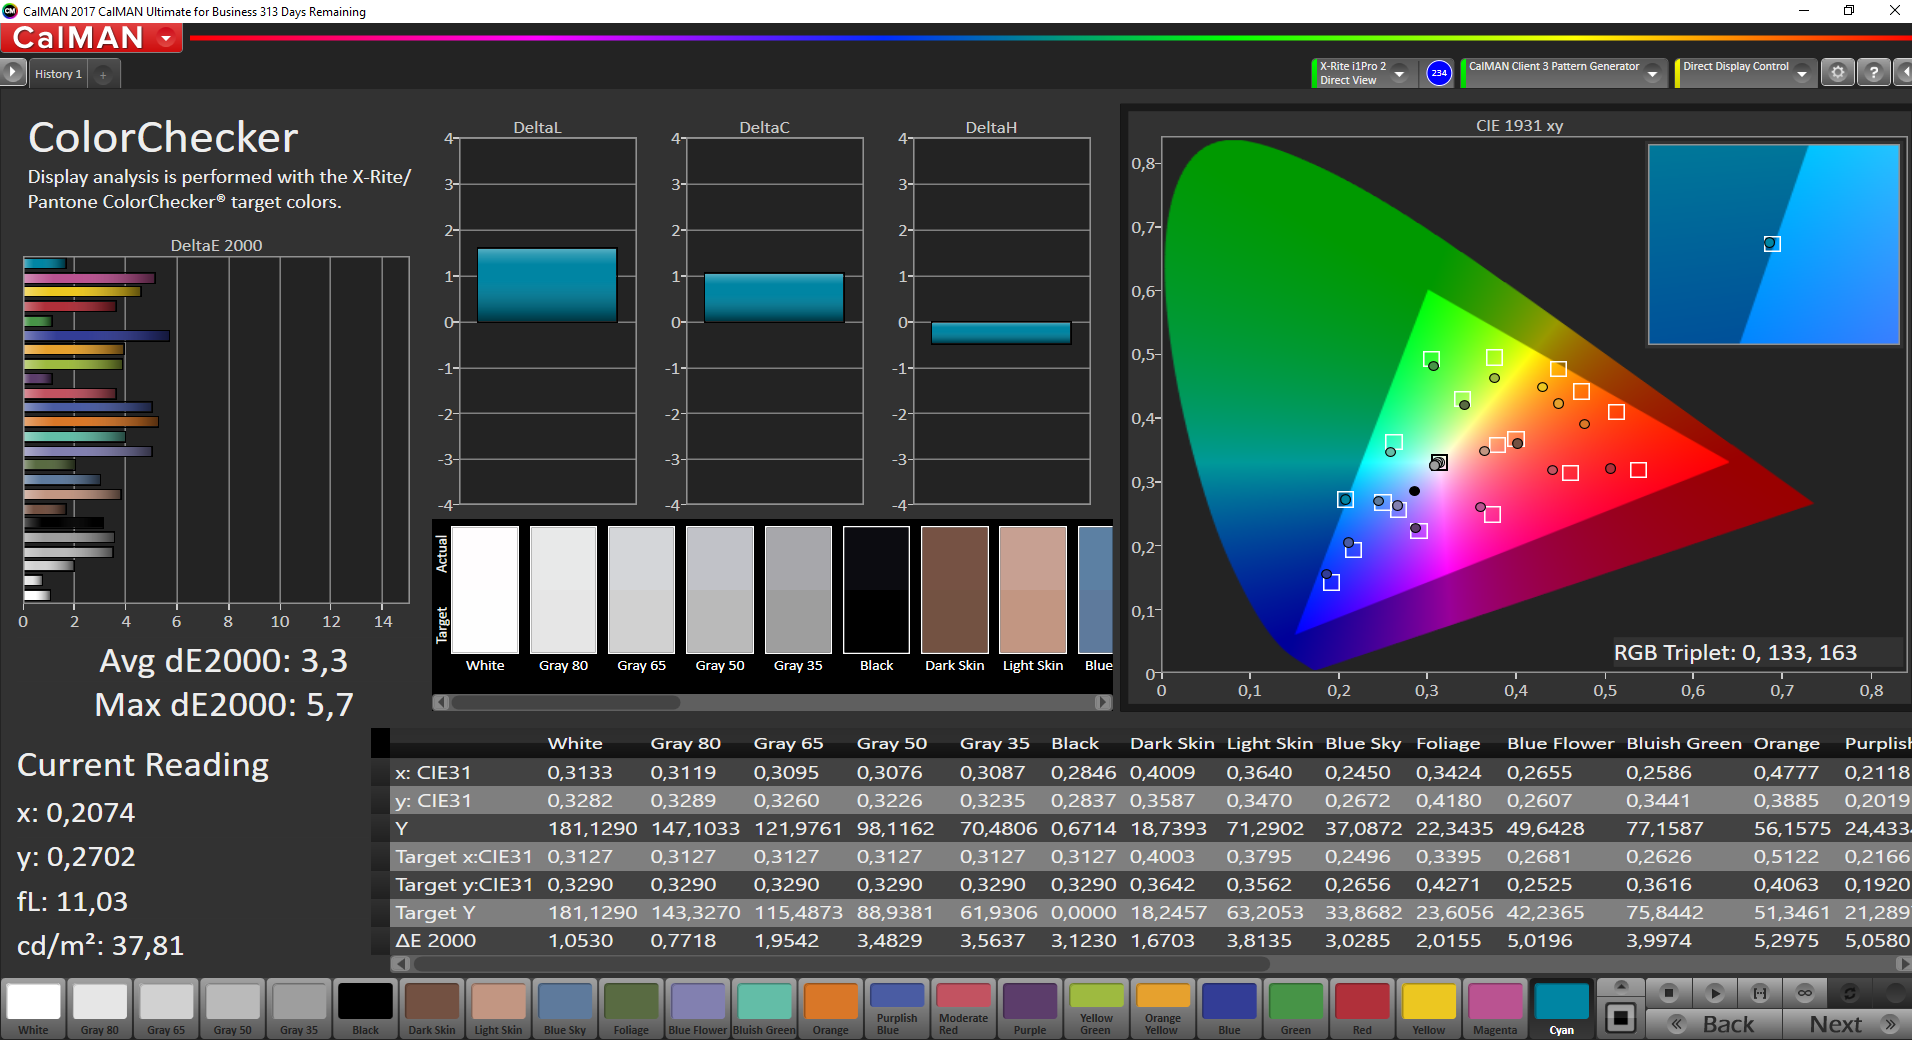
| Colorchecker dE 2000 * | 11.8 | 11.52 2% | 4.09 65% | 5.31 55% | 4.85 59% | 12.19 -3% | 4.65 61% |
| Colorchecker dE 2000 max. * | 20.6 | 19.97 3% | 7.44 64% | 9.28 55% | 8.34 60% | 20.81 -1% | 8.2 60% |
| Greyscale dE 2000 * | 12.5 | 12.01 4% | 4.75 62% | 6.24 50% | 3.84 69% | 13.99 -12% | 2.65 79% |
| Gamma | 2.07 106% | 2.23 99% | 2.39 92% | 2.7 81% | 2.42 91% | 2.32 95% | 2.44 90% |
| CCT | 14346 45% | 13330 49% | 7034 92% | 7619 85% | 6790 96% | 15863 41% | 6820 95% |
| Color Space (Percent of AdobeRGB 1998) (%) | 40.1 | 38 -5% | 58 45% | 37 -8% | 37 -8% | 36 -10% | 38 -5% |
| Color Space (Percent of sRGB) (%) | 62.7 | 59 -6% | 90 44% | 59 -6% | 58 -7% | 56 -11% | 59 -6% |
| Média Total (Programa/Configurações) | 1% /
0% | 24% /
43% | 17% /
27% | -10% /
17% | 1% /
1% | -12% /
13% |
* ... menor é melhor

Exibir tempos de resposta
| ↔ Tempo de resposta preto para branco | ||
|---|---|---|
| 16 ms ... ascensão ↗ e queda ↘ combinadas | ↗ 11.6 ms ascensão | 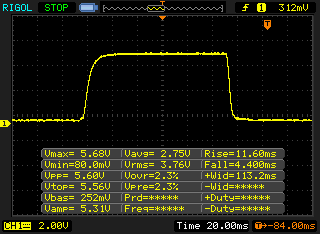 |
| ↘ 4.4 ms queda | ||
| A tela mostra boas taxas de resposta em nossos testes, mas pode ser muito lenta para jogadores competitivos. Em comparação, todos os dispositivos testados variam de 0.1 (mínimo) a 240 (máximo) ms. » 37 % de todos os dispositivos são melhores. Isso significa que o tempo de resposta medido é melhor que a média de todos os dispositivos testados (19.8 ms). | ||
| ↔ Tempo de resposta 50% cinza a 80% cinza | ||
| 45.6 ms ... ascensão ↗ e queda ↘ combinadas | ↗ 24.4 ms ascensão | 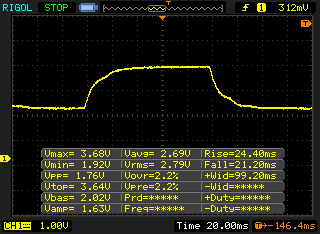 |
| ↘ 21.2 ms queda | ||
| A tela mostra taxas de resposta lentas em nossos testes e será insatisfatória para os jogadores. Em comparação, todos os dispositivos testados variam de 0.165 (mínimo) a 636 (máximo) ms. » 78 % de todos os dispositivos são melhores. Isso significa que o tempo de resposta medido é pior que a média de todos os dispositivos testados (31 ms). | ||
Cintilação da tela / PWM (modulação por largura de pulso)
| Tela tremeluzindo/PWM detectado | 25770 Hz | ≤ 60 % configuração de brilho | 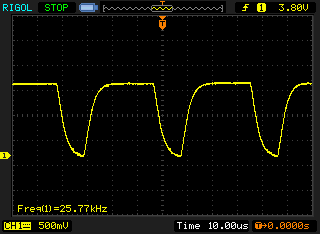 |
A luz de fundo da tela pisca em 25770 Hz (pior caso, por exemplo, utilizando PWM) Cintilação detectada em uma configuração de brilho de 60 % e abaixo. Não deve haver cintilação ou PWM acima desta configuração de brilho. A frequência de 25770 Hz é bastante alta, então a maioria dos usuários sensíveis ao PWM não deve notar nenhuma oscilação. [pwm_comparison] Em comparação: 52 % de todos os dispositivos testados não usam PWM para escurecer a tela. Se PWM foi detectado, uma média de 7754 (mínimo: 5 - máximo: 343500) Hz foi medida. | |||

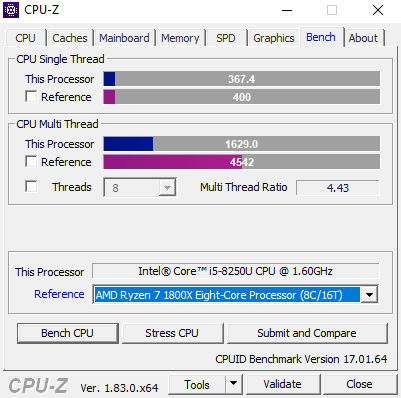
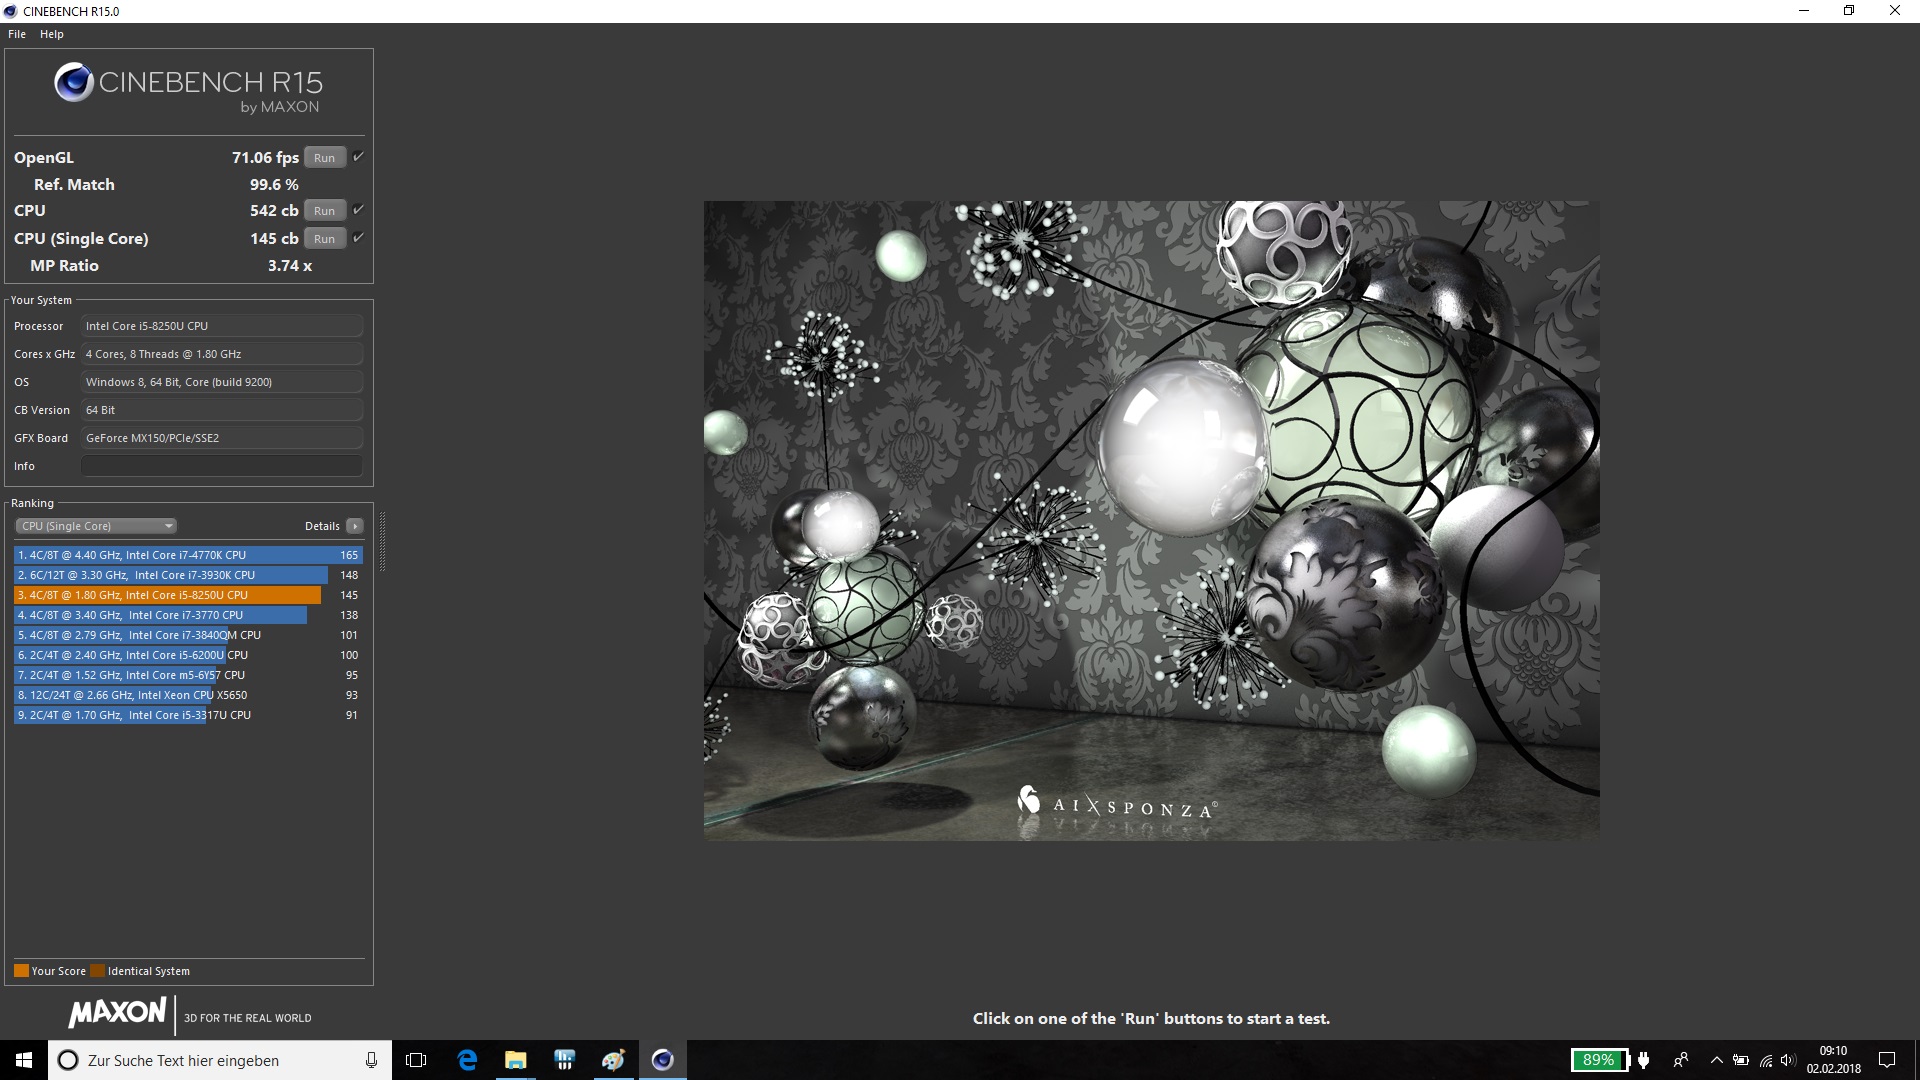
| Cinebench R15 | |
| CPU Single 64Bit | |
| Acer Aspire 7 A715-71G-53TU | |
| HP Pavilion 15-cc107ng | |
| Lenovo IdeaPad 320-15IKBRN 81BG001KGE | |
| Asus ZenBook UX530UX-FY070T | |
| Acer Swift 3 SF315-41-R4W1 | |
| Asus VivoBook 15 X510UQ-BQ534T | |
| Lenovo IdeaPad 320-15IKB 80XL01NEGE | |
| CPU Multi 64Bit | |
| Asus VivoBook 15 X510UQ-BQ534T | |
| Acer Swift 3 SF315-41-R4W1 | |
| HP Pavilion 15-cc107ng | |
| Lenovo IdeaPad 320-15IKBRN 81BG001KGE | |
| Acer Aspire 7 A715-71G-53TU | |
| Lenovo IdeaPad 320-15IKB 80XL01NEGE | |
| Asus ZenBook UX530UX-FY070T | |
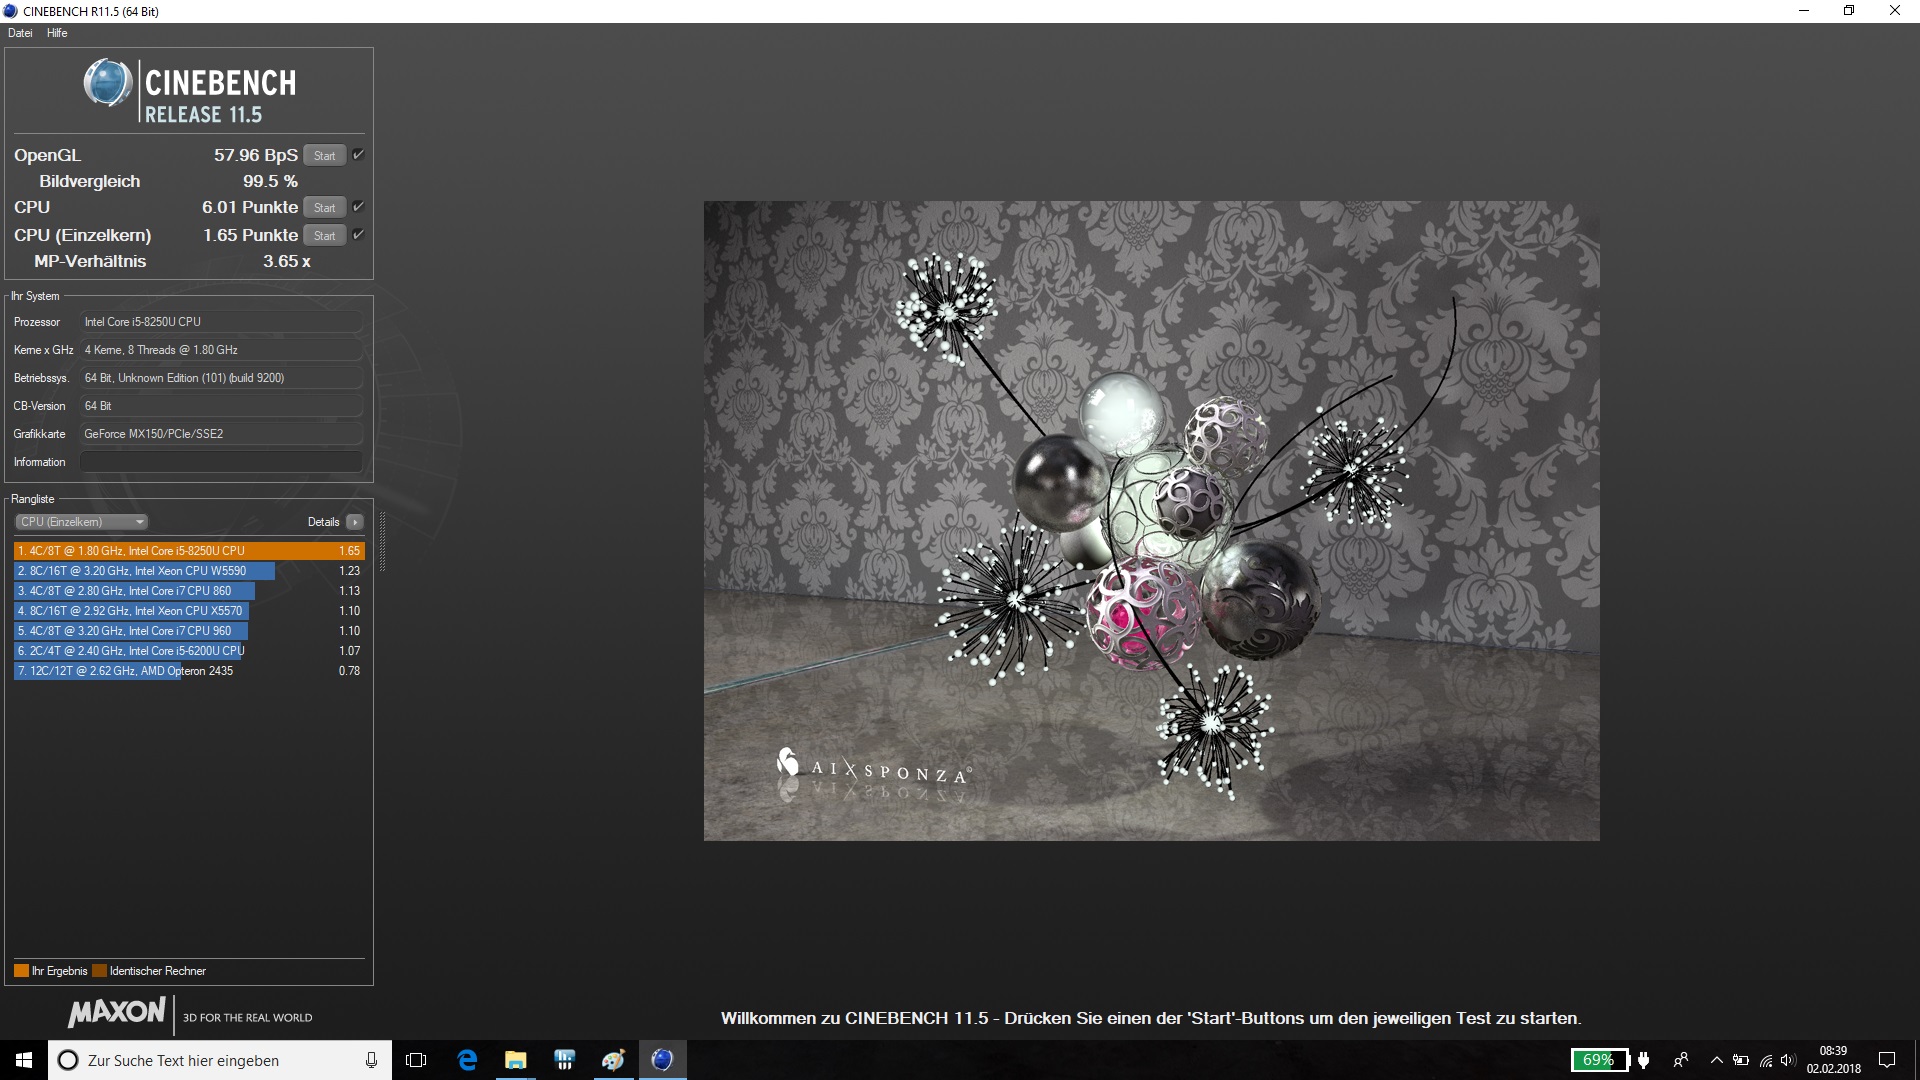
| Cinebench R11.5 | |
| CPU Single 64Bit | |
| Acer Aspire 7 A715-71G-53TU | |
| Lenovo IdeaPad 320-15IKBRN 81BG001KGE | |
| Acer Swift 3 SF315-41-R4W1 | |
| CPU Multi 64Bit | |
| Lenovo IdeaPad 320-15IKBRN 81BG001KGE | |
| Acer Aspire 7 A715-71G-53TU | |
| Acer Swift 3 SF315-41-R4W1 | |
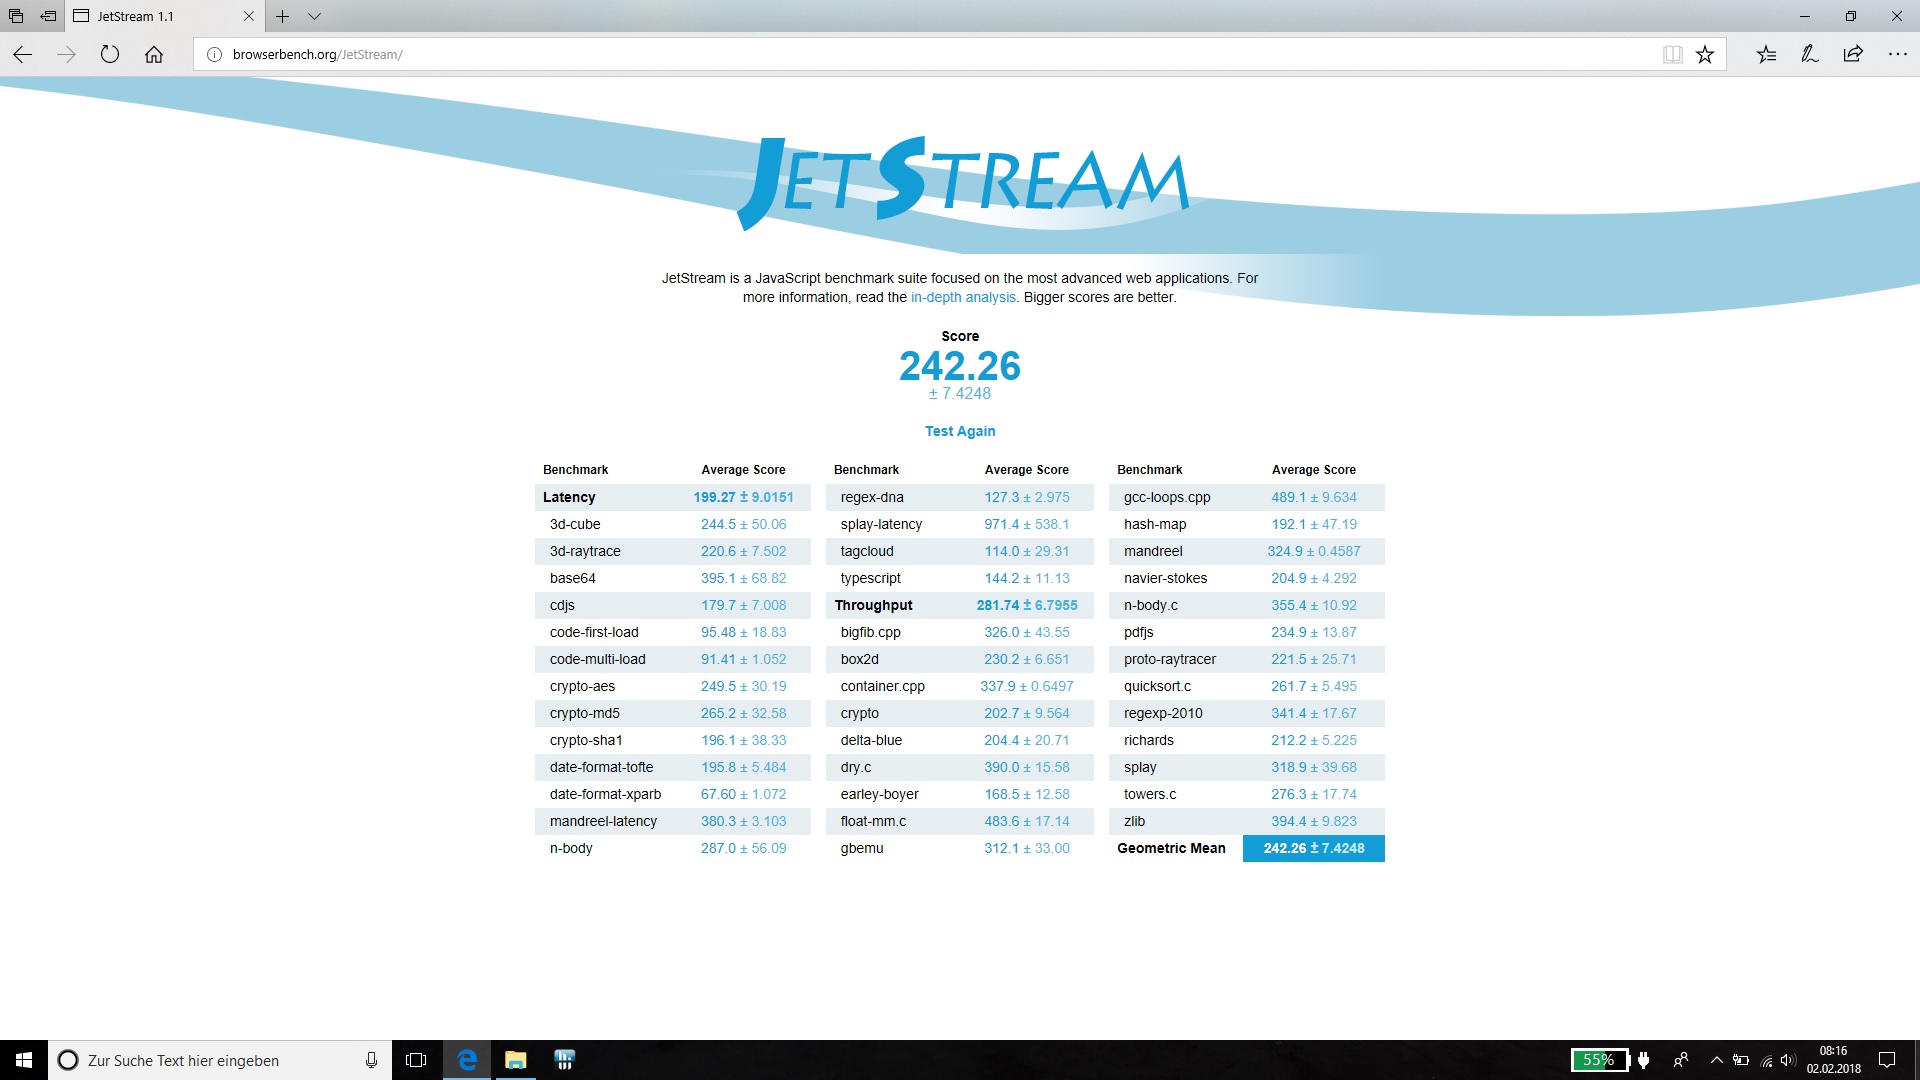
| JetStream 1.1 - 1.1 Total | |
| HP Pavilion 15-cc107ng | |
| Acer Aspire 7 A715-71G-53TU | |
| Lenovo IdeaPad 320-15IKBRN 81BG001KGE | |
| Asus VivoBook 15 X510UQ-BQ534T | |
| Lenovo IdeaPad 320-15IKB 80XL01NEGE | |
| Acer Swift 3 SF315-41-R4W1 | |
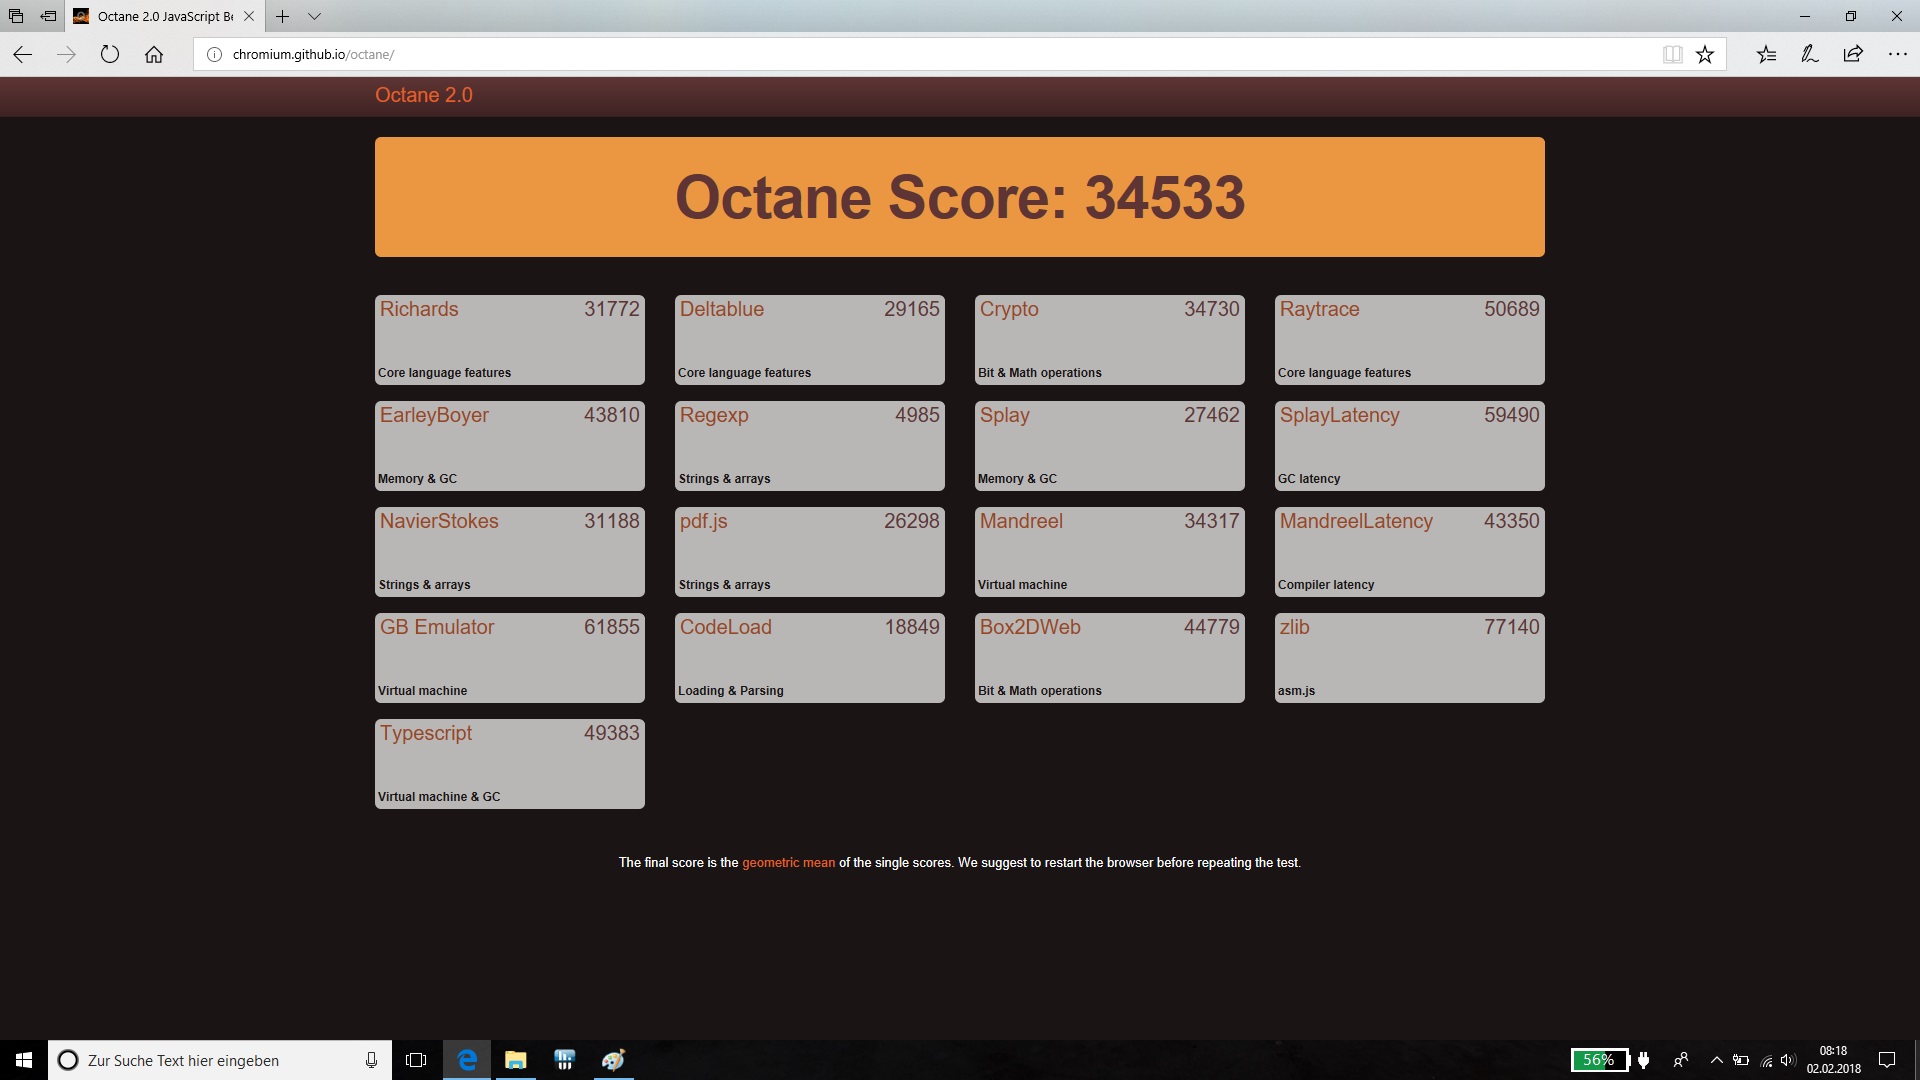
| Octane V2 - Total Score | |
| Acer Aspire 7 A715-71G-53TU | |
| Lenovo IdeaPad 320-15IKBRN 81BG001KGE | |
| Acer Swift 3 SF315-41-R4W1 | |
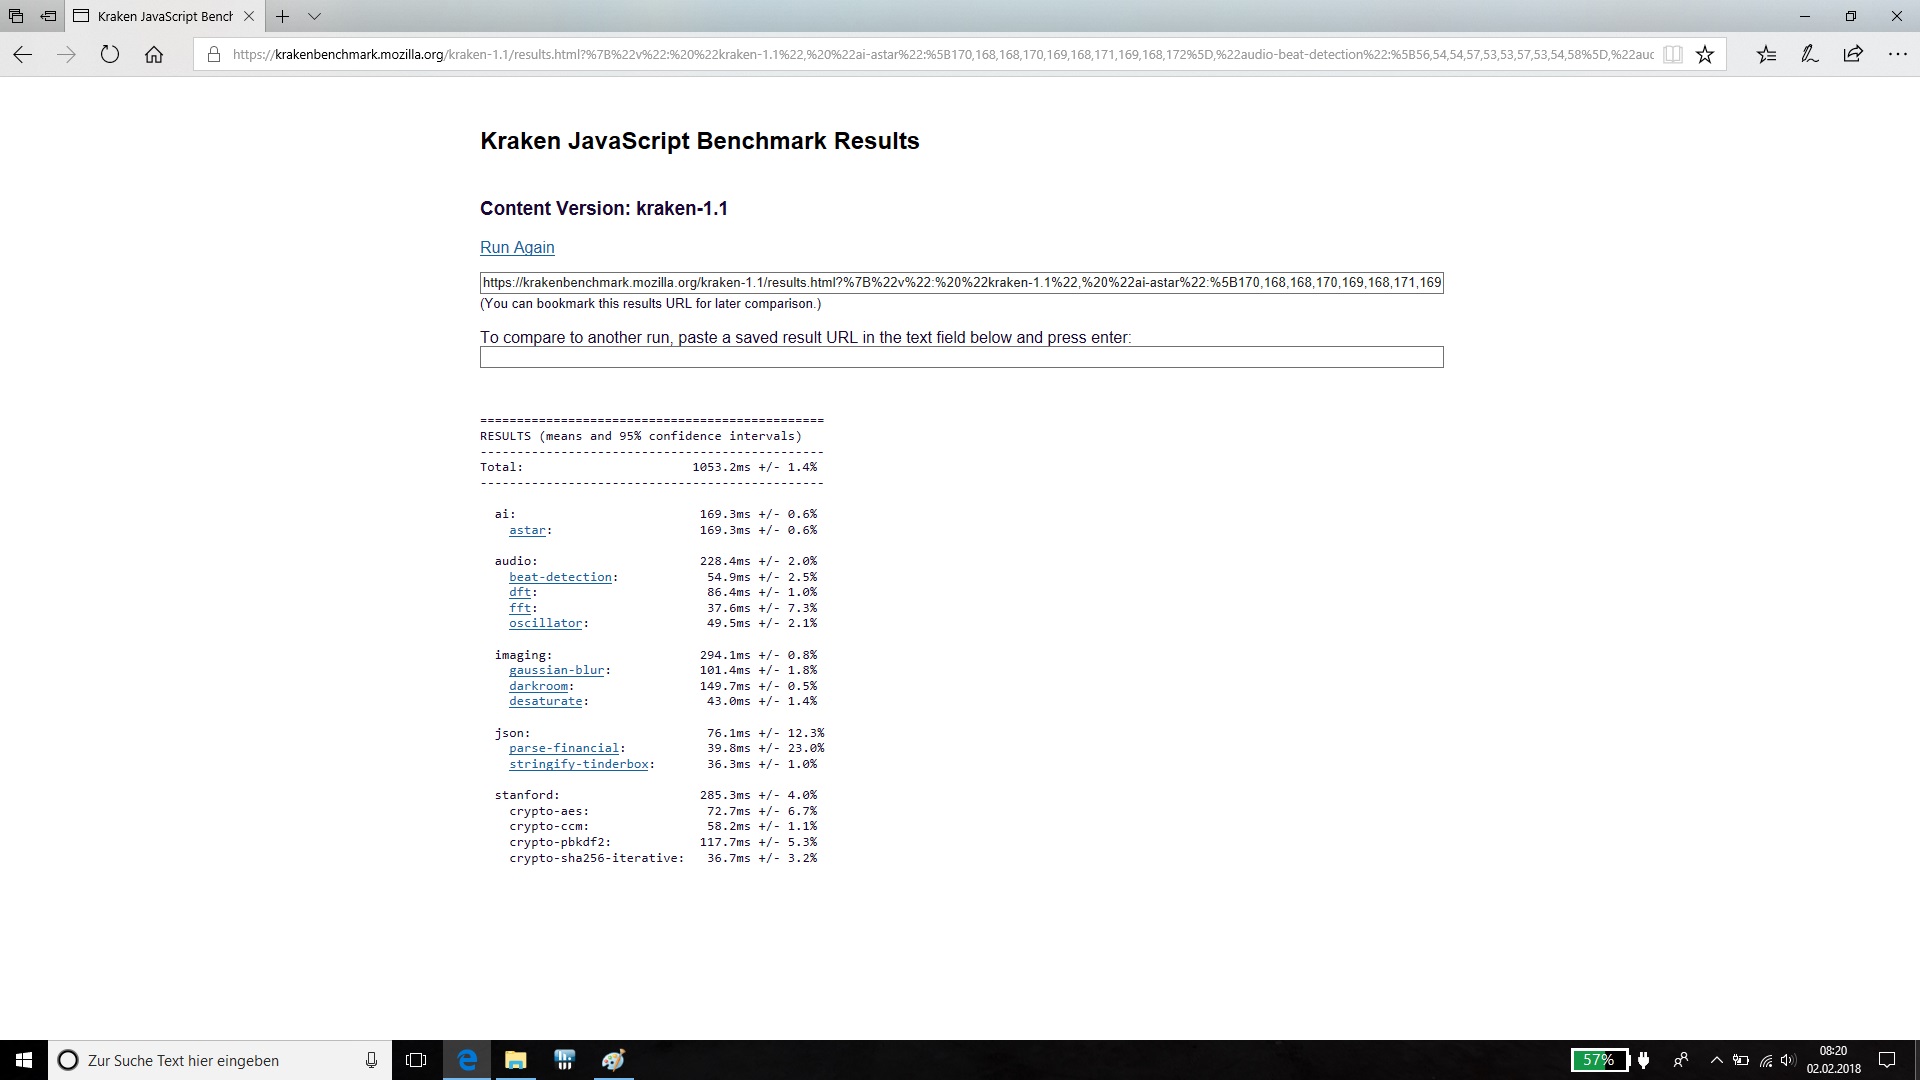
| Mozilla Kraken 1.1 - Total | |
| Lenovo IdeaPad 320-15IKBRN 81BG001KGE | |
| Acer Aspire 7 A715-71G-53TU | |
* ... menor é melhor
| PCMark 8 | |
| Home Score Accelerated v2 | |
| Acer Aspire 7 A715-71G-53TU | |
| HP Pavilion 15-cc107ng | |
| Lenovo IdeaPad 320-15IKB 80XL01NEGE | |
| Asus VivoBook 15 X510UQ-BQ534T | |
| Asus ZenBook UX530UX-FY070T | |
| Acer Swift 3 SF315-41-R4W1 | |
| Lenovo IdeaPad 320-15IKBRN 81BG001KGE | |
| Work Score Accelerated v2 | |
| Acer Aspire 7 A715-71G-53TU | |
| HP Pavilion 15-cc107ng | |
| Lenovo IdeaPad 320-15IKBRN 81BG001KGE | |
| Asus ZenBook UX530UX-FY070T | |
| Lenovo IdeaPad 320-15IKB 80XL01NEGE | |
| Acer Swift 3 SF315-41-R4W1 | |
| PCMark 10 | |
| Score | |
| Acer Aspire 7 A715-71G-53TU | |
| HP Pavilion 15-cc107ng | |
| Lenovo IdeaPad 320-15IKBRN 81BG001KGE | |
| Lenovo IdeaPad 320-15IKB 80XL01NEGE | |
| Acer Swift 3 SF315-41-R4W1 | |
| Productivity | |
| Acer Aspire 7 A715-71G-53TU | |
| HP Pavilion 15-cc107ng | |
| Lenovo IdeaPad 320-15IKBRN 81BG001KGE | |
| Lenovo IdeaPad 320-15IKB 80XL01NEGE | |
| Acer Swift 3 SF315-41-R4W1 | |
| PCMark 8 Home Score Accelerated v2 | 3274 pontos | |
| PCMark 8 Creative Score Accelerated v2 | 3357 pontos | |
| PCMark 8 Work Score Accelerated v2 | 4760 pontos | |
| PCMark 10 Score | 3007 pontos | |
Ajuda | ||
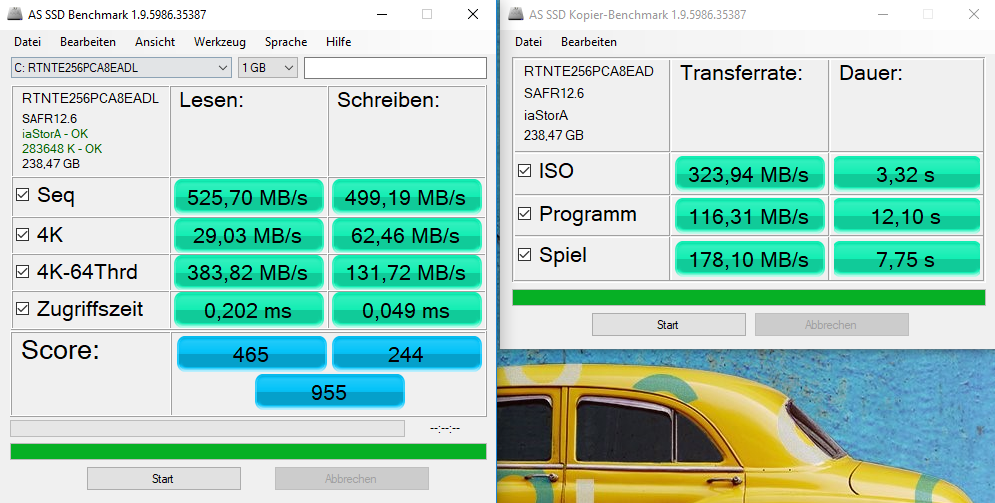
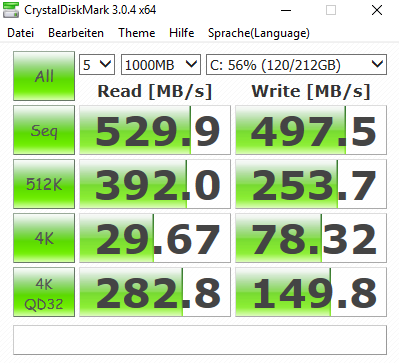
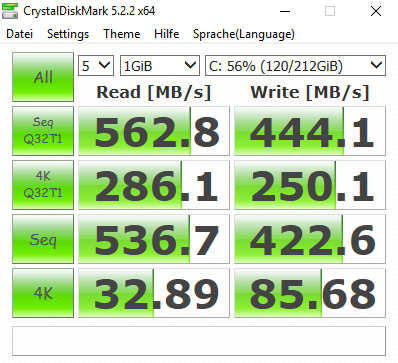
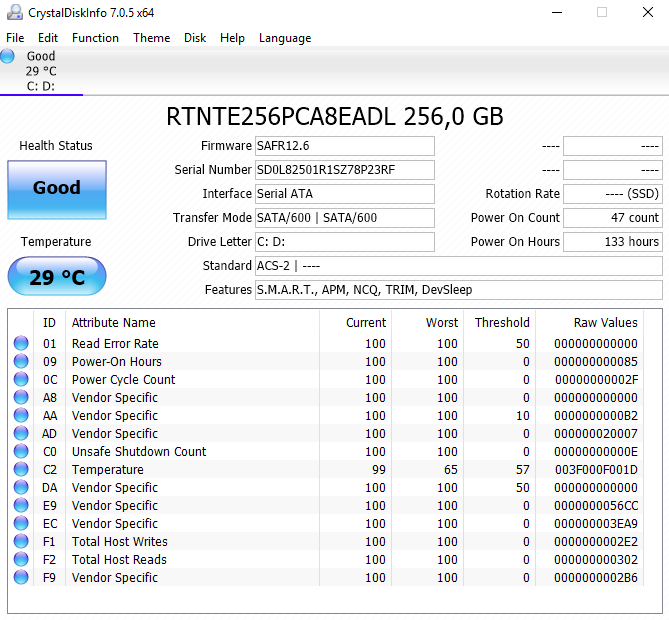
| Lenovo IdeaPad 320-15IKBRN 81BG001KGE Ramaxel RTNTE256PCA8EADL | Lenovo IdeaPad 320-15IKB 80XL01NEGE SK Hynix HFS256G3BTND | Asus ZenBook UX530UX-FY070T SK Hynix HFS256G39TND-N210A | Asus VivoBook 15 X510UQ-BQ534T | Acer Swift 3 SF315-41-R4W1 Intel SSD 600p SSDPEKKW256G7 | HP Pavilion 15-cc107ng SanDisk SD8SN8U256G1006 | Acer Aspire 7 A715-71G-53TU Kingston RBUSNS8180DS3128GH | |
|---|---|---|---|---|---|---|---|
| CrystalDiskMark 3.0 | 3% | -41% | -86% | 43% | -5% | -15% | |
| Read Seq (MB/s) | 530 | 466.4 -12% | 282.2 -47% | 139.2 -74% | 1130 113% | 475.4 -10% | 456 -14% |
| Write Seq (MB/s) | 497.5 | 259.3 -48% | 184.5 -63% | 126 -75% | 601 21% | 453.5 -9% | 245 -51% |
| Read 512 (MB/s) | 392 | 314.5 -20% | 233.5 -40% | 42.35 -89% | 837 114% | 345.2 -12% | 328.4 -16% |
| Write 512 (MB/s) | 253.7 | 259.4 2% | 140.1 -45% | 111.2 -56% | 606 139% | 299.1 18% | 146.3 -42% |
| Read 4k (MB/s) | 29.67 | 31.47 6% | 24.42 -18% | 0.207 -99% | 20.46 -31% | 27.8 -6% | 31.72 7% |
| Write 4k (MB/s) | 78.3 | 78.3 0% | 48.98 -37% | 4.059 -95% | 81.7 4% | 54.2 -31% | 69.3 -11% |
| Read 4k QD32 (MB/s) | 282.8 | 346.1 22% | 170 -40% | 0.738 -100% | 235.5 -17% | 250.9 -11% | 263.7 -7% |
| Write 4k QD32 (MB/s) | 149.8 | 260.4 74% | 98.5 -34% | 4.468 -97% | 155 3% | 181.8 21% | 165.7 11% |

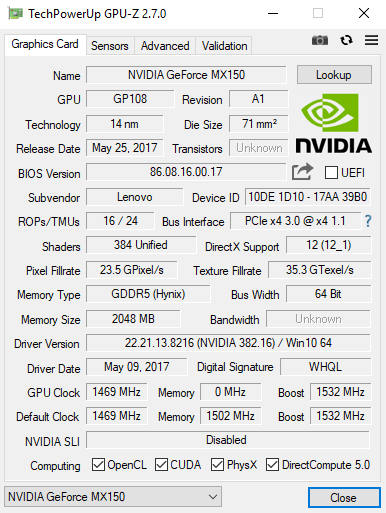
| 3DMark | |
| 1280x720 Cloud Gate Standard Graphics | |
| Acer Aspire 7 A715-71G-53TU | |
| Asus ZenBook UX530UX-FY070T | |
| Lenovo IdeaPad 320-15IKBRN 81BG001KGE | |
| Acer Swift 3 SF315-41-R4W1 | |
| Lenovo IdeaPad 320-15IKB 80XL01NEGE | |
| Asus VivoBook 15 X510UQ-BQ534T | |
| HP Pavilion 15-cc107ng | |
| 1920x1080 Fire Strike Graphics | |
| Acer Aspire 7 A715-71G-53TU | |
| Lenovo IdeaPad 320-15IKBRN 81BG001KGE | |
| Asus ZenBook UX530UX-FY070T | |
| Lenovo IdeaPad 320-15IKB 80XL01NEGE | |
| Asus VivoBook 15 X510UQ-BQ534T | |
| Acer Swift 3 SF315-41-R4W1 | |
| HP Pavilion 15-cc107ng | |
| 3DMark 11 - 1280x720 Performance GPU | |
| Acer Aspire 7 A715-71G-53TU | |
| Lenovo IdeaPad 320-15IKBRN 81BG001KGE | |
| Asus ZenBook UX530UX-FY070T | |
| Acer Swift 3 SF315-41-R4W1 | |
| Asus VivoBook 15 X510UQ-BQ534T | |
| Lenovo IdeaPad 320-15IKB 80XL01NEGE | |
| HP Pavilion 15-cc107ng | |
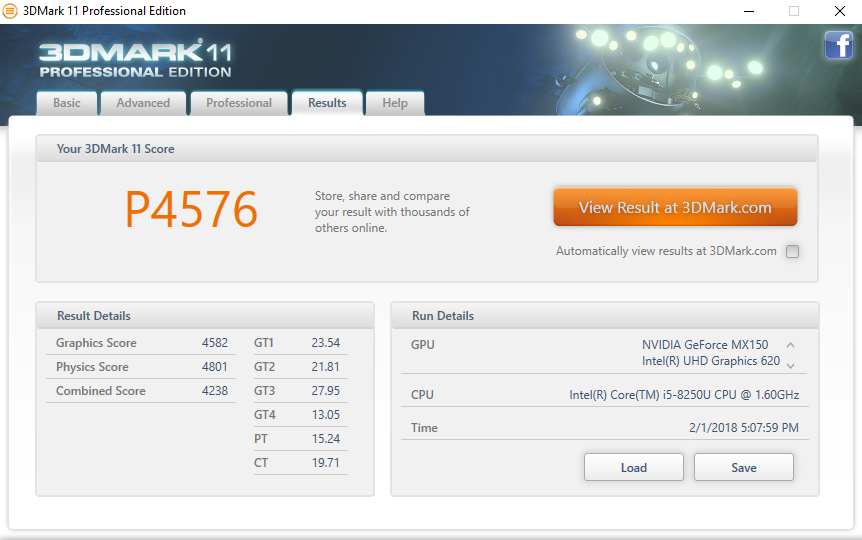
| 3DMark 11 Performance | 4576 pontos | |
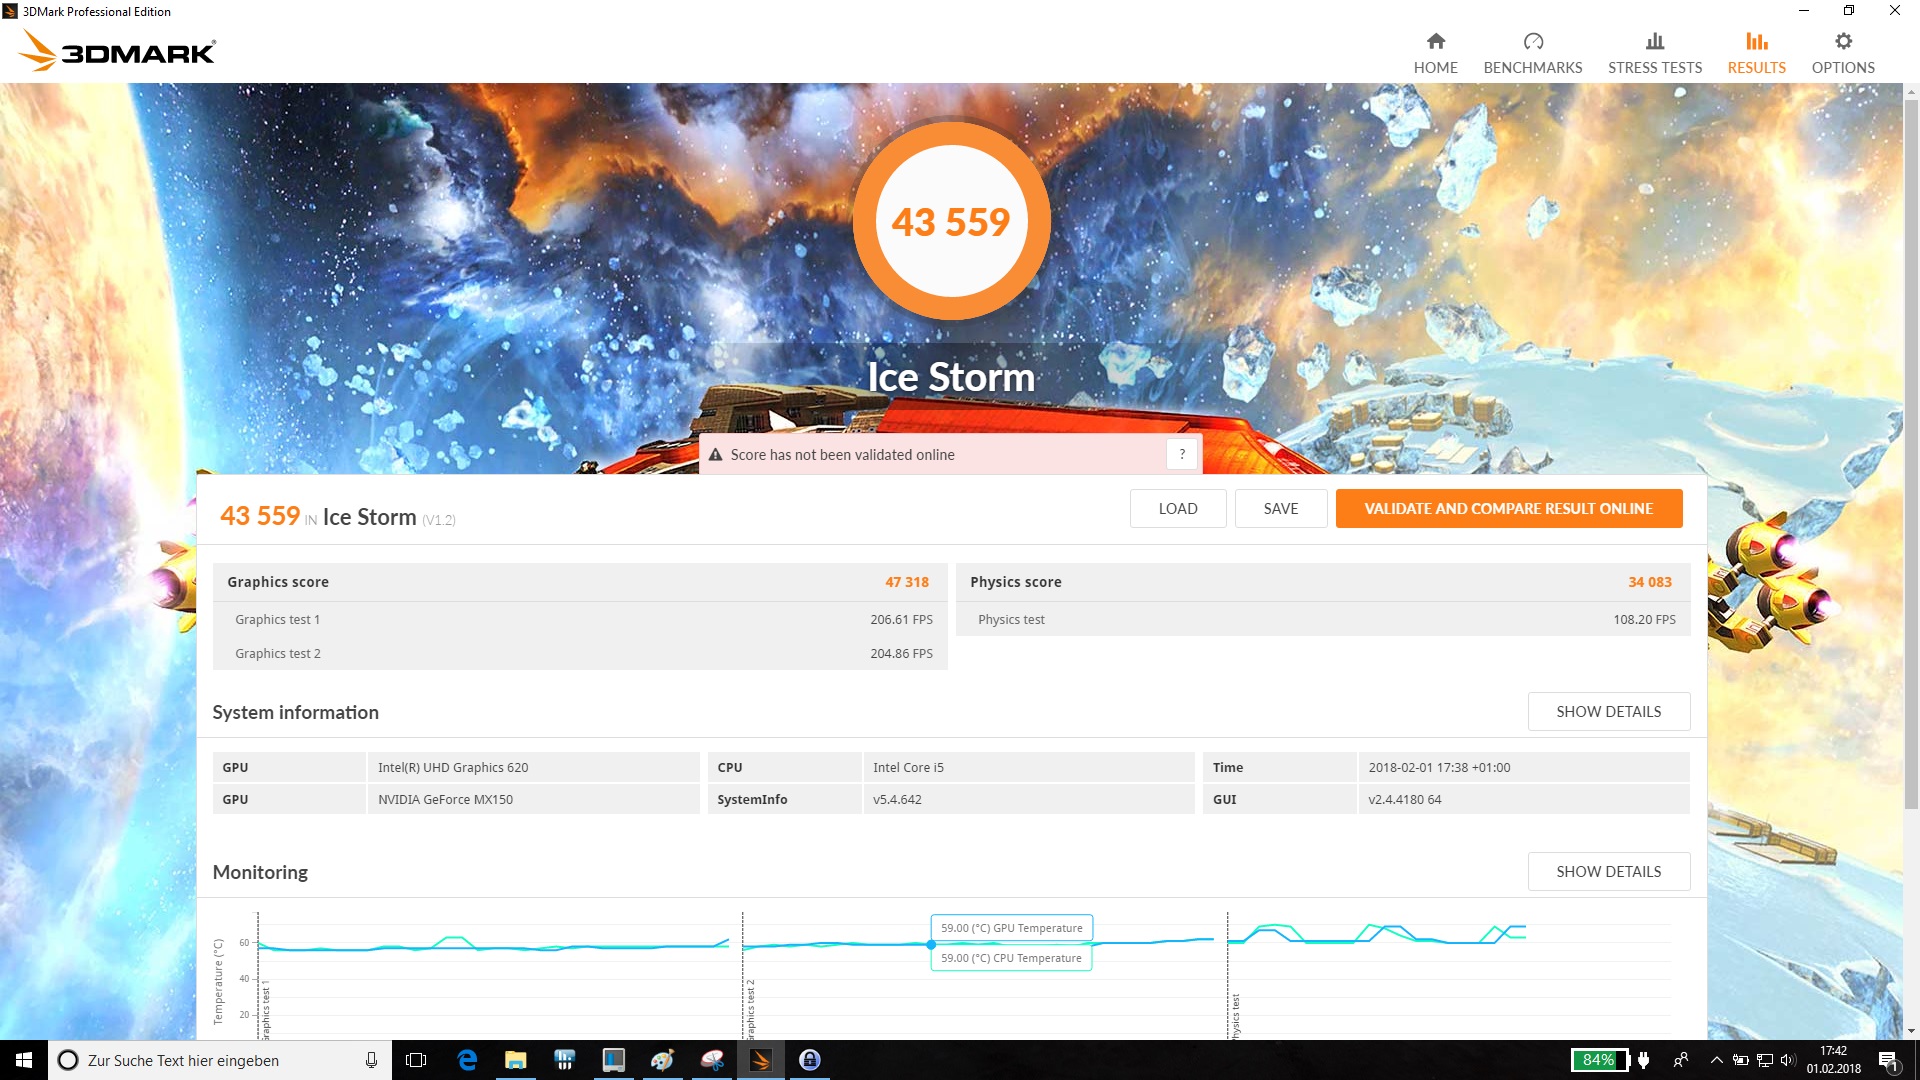
| 3DMark Ice Storm Standard Score | 43559 pontos | |
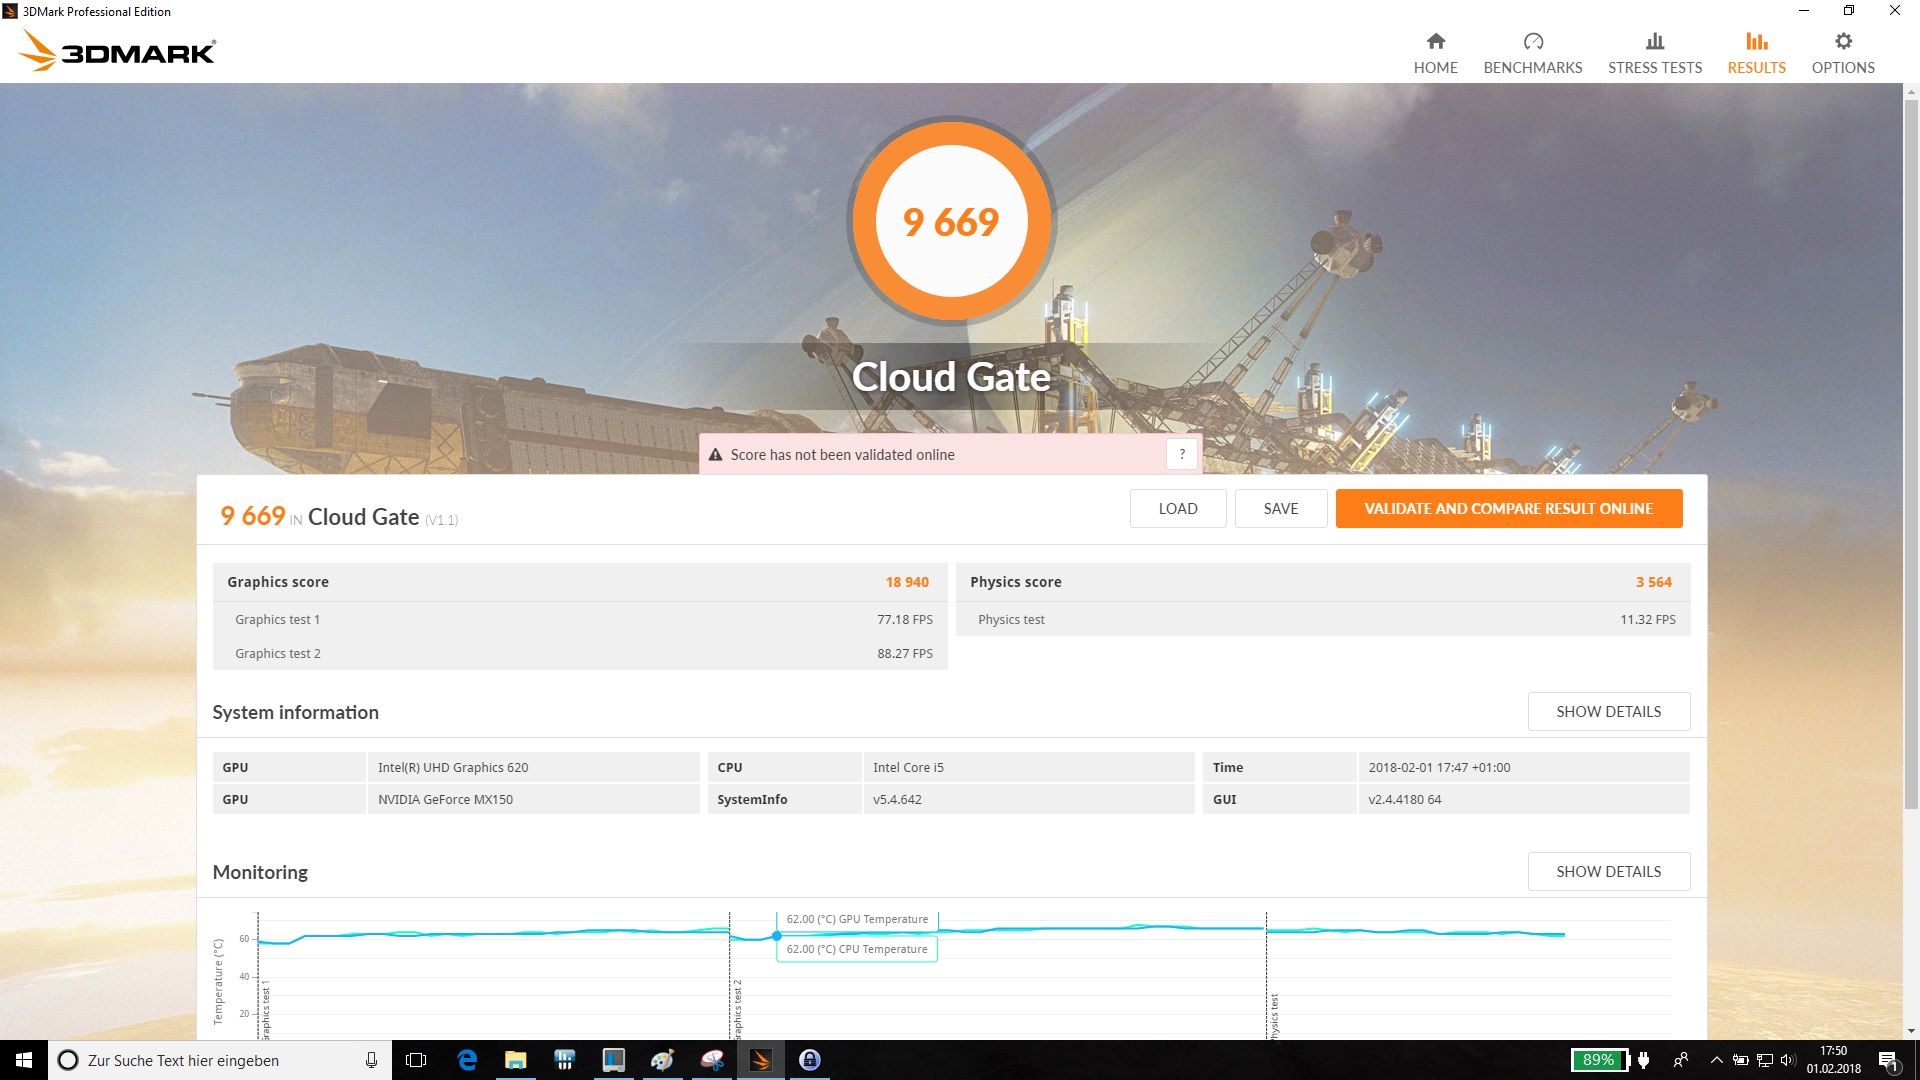
| 3DMark Cloud Gate Standard Score | 9669 pontos | |
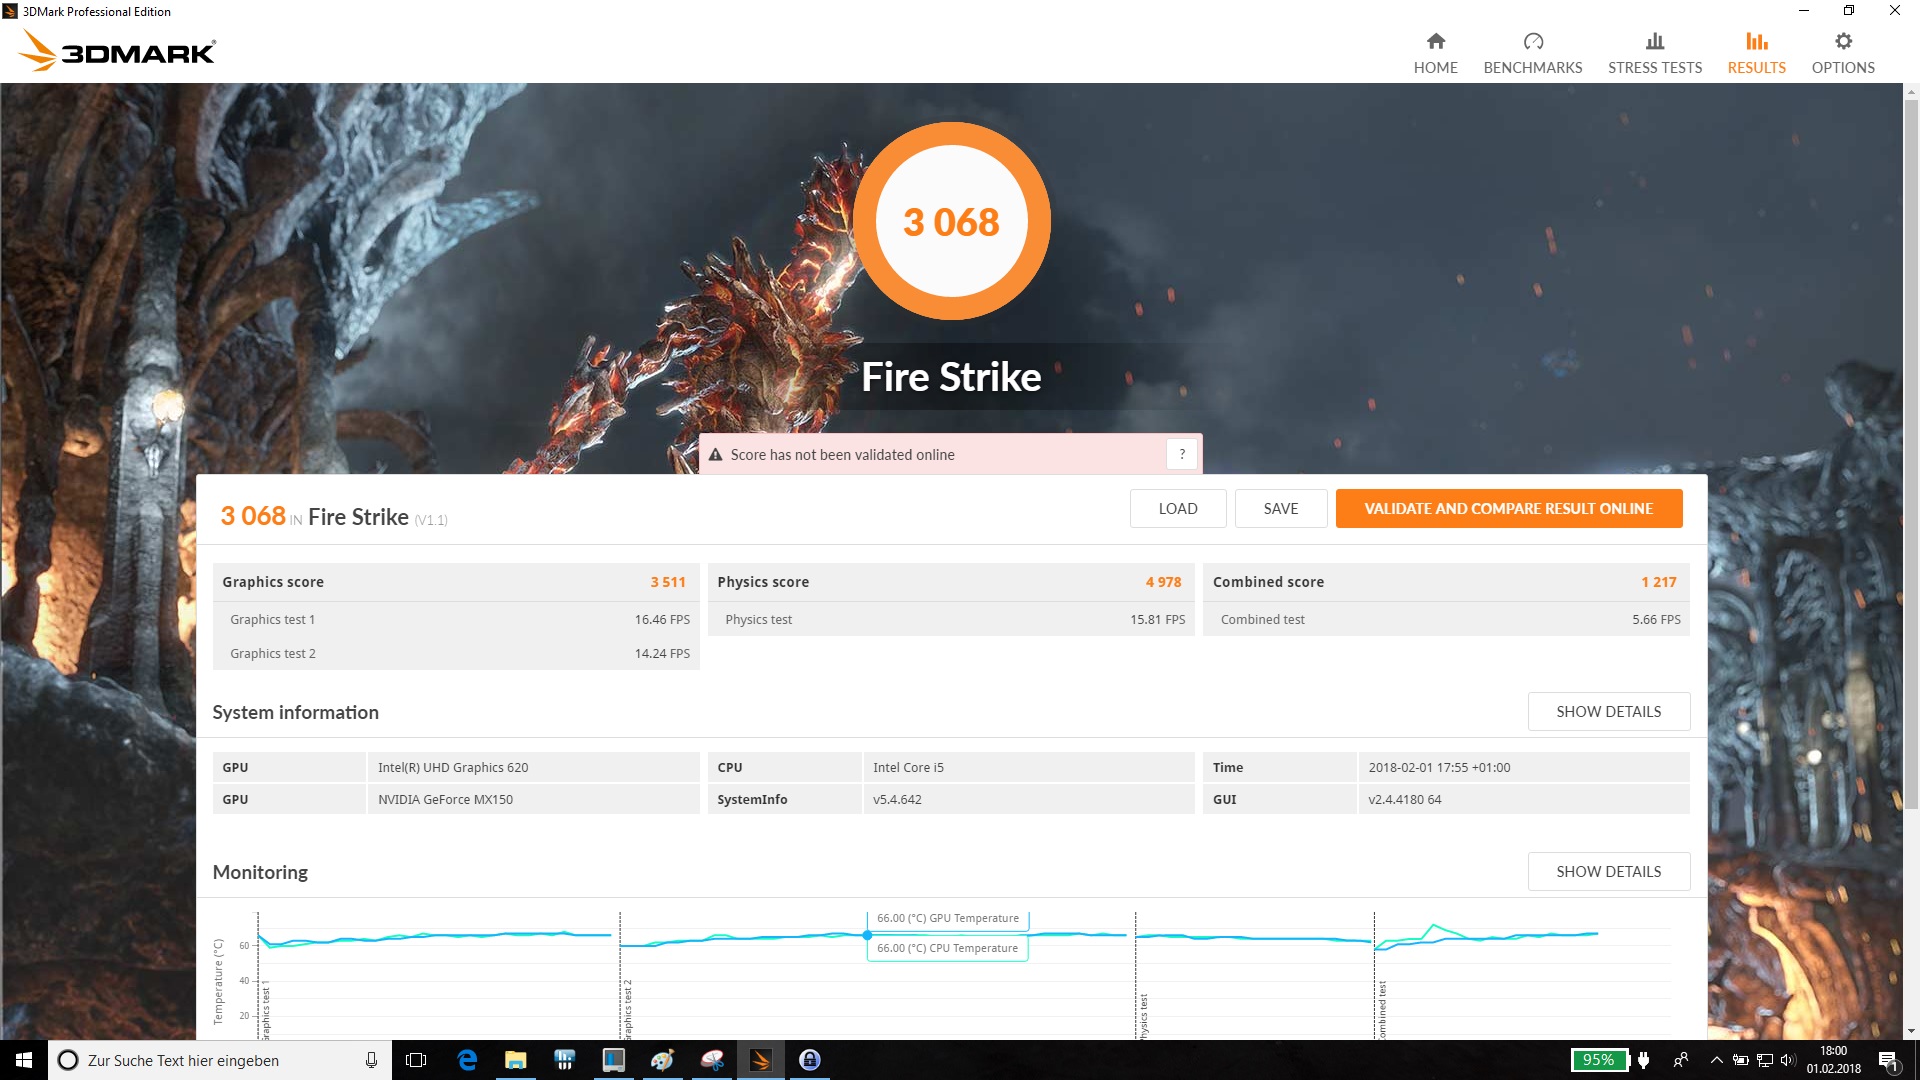
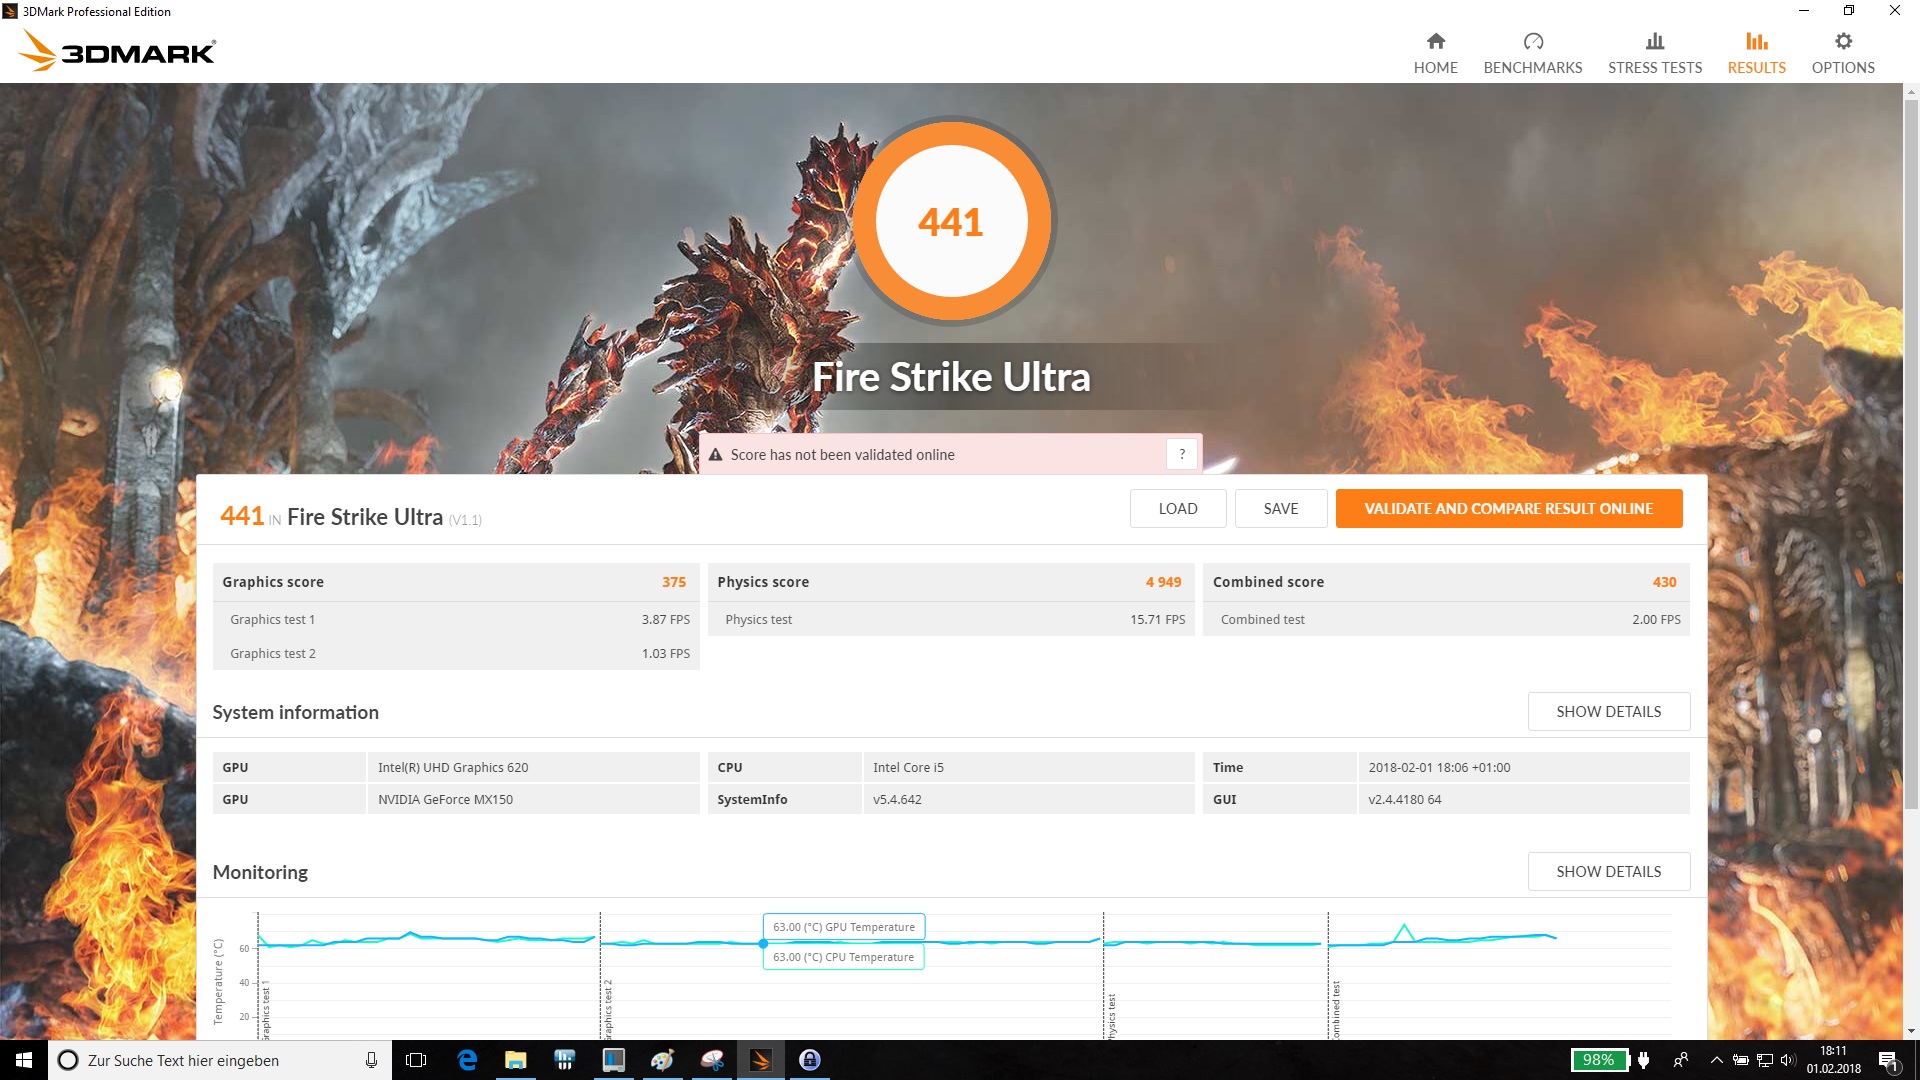
| 3DMark Fire Strike Score | 3068 pontos | |
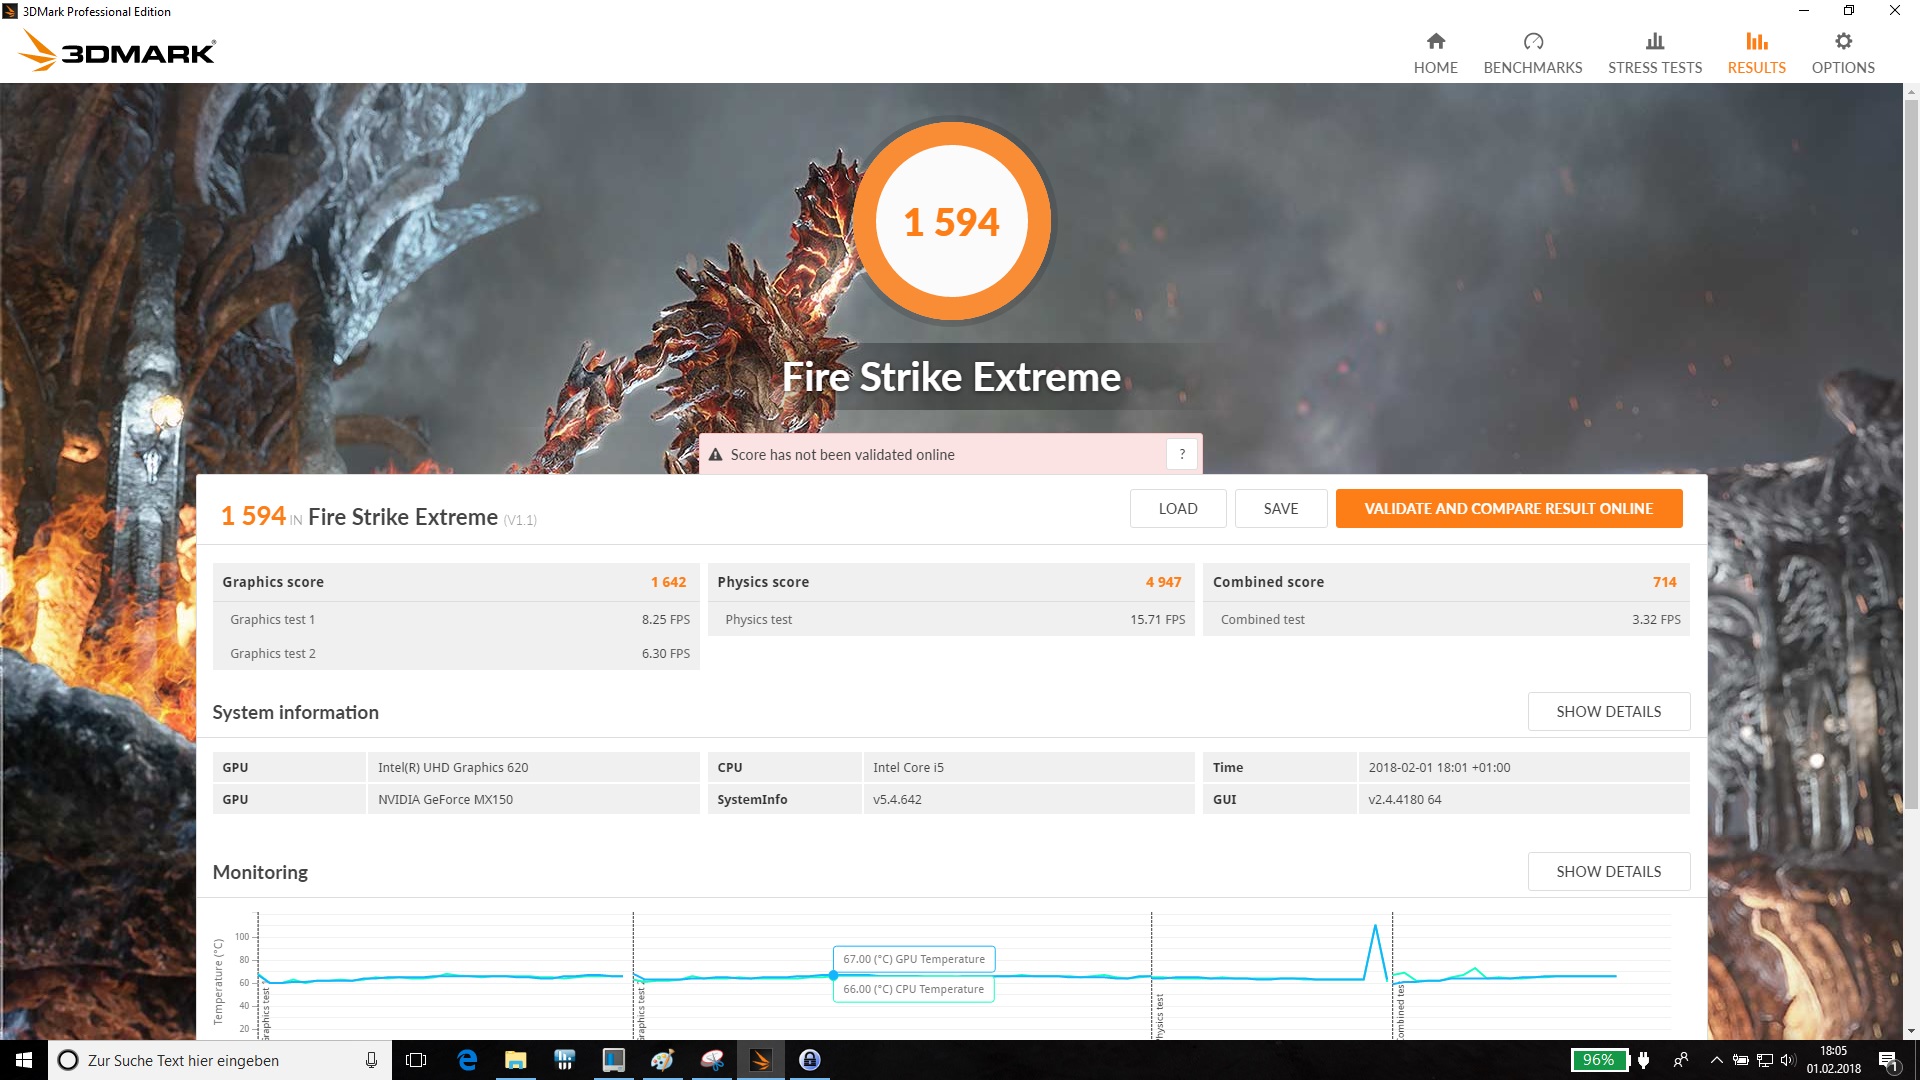
| 3DMark Fire Strike Extreme Score | 1594 pontos | |
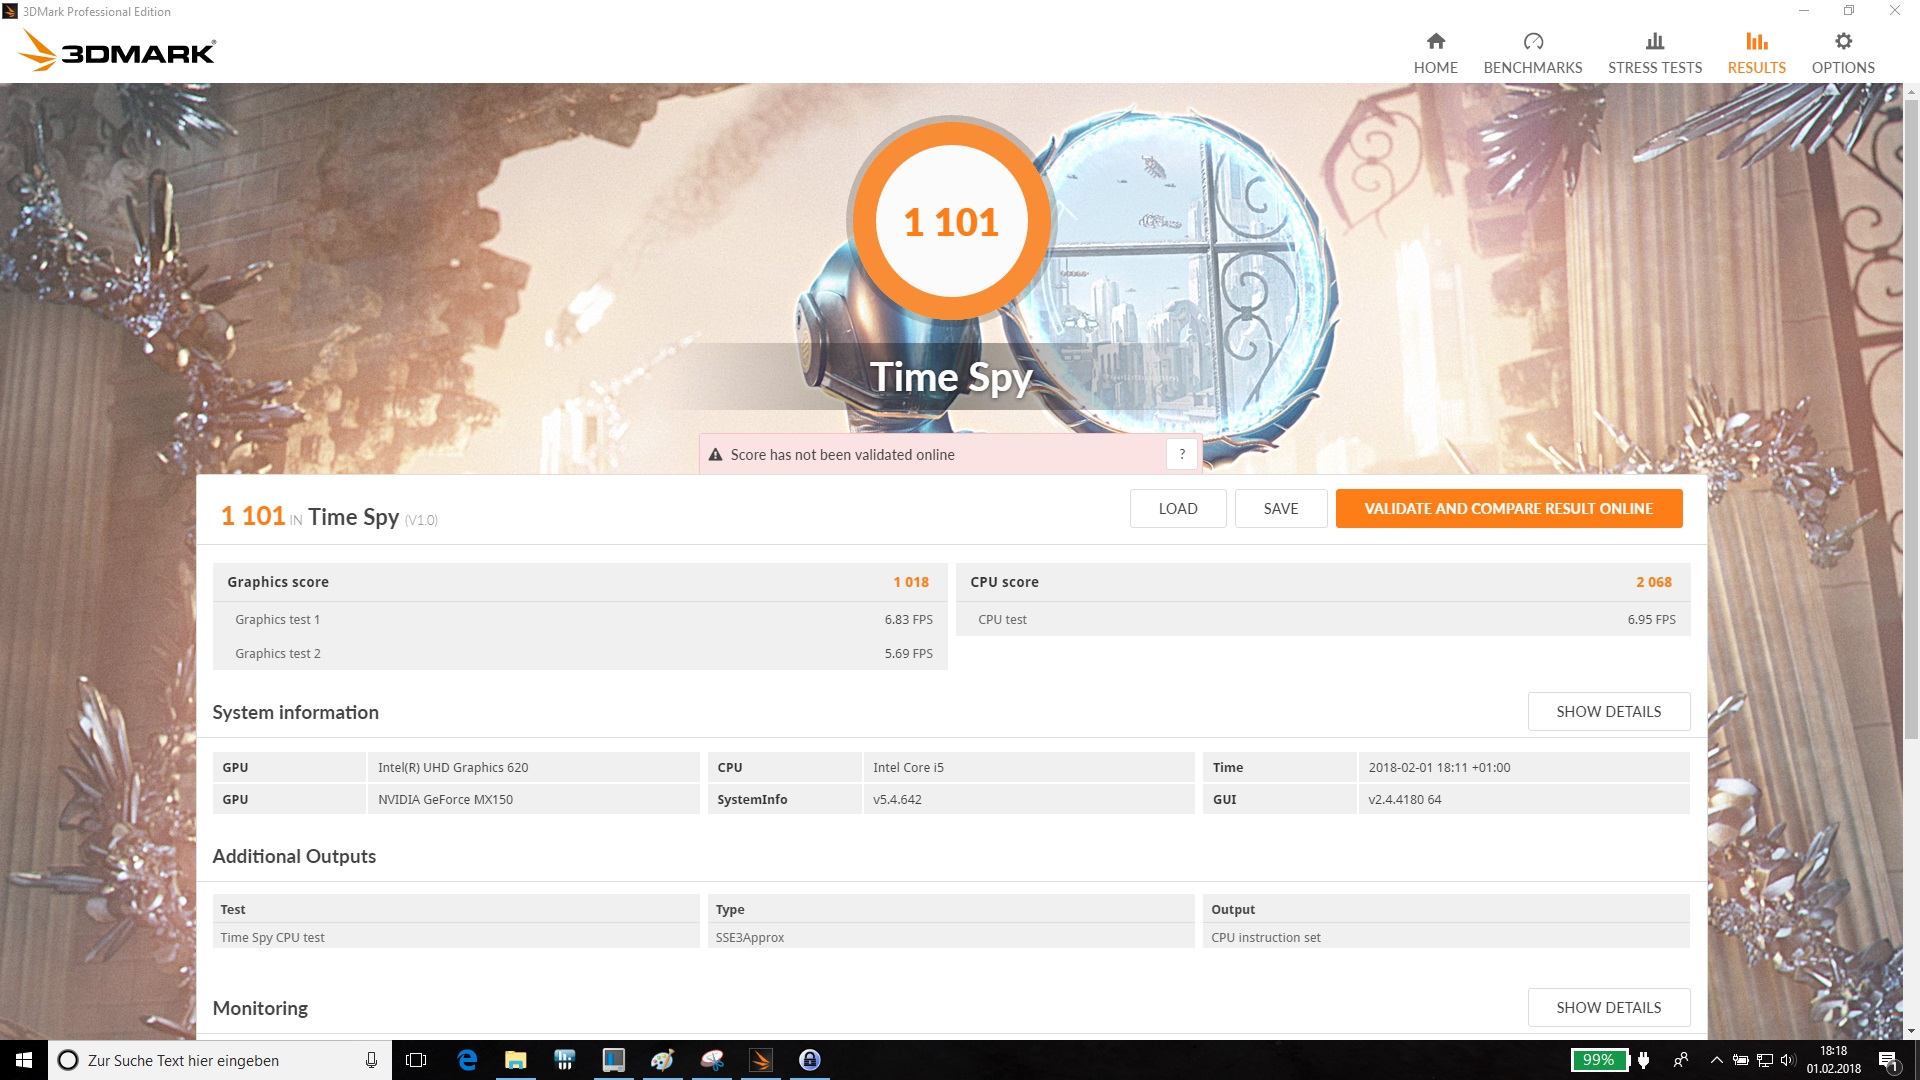
| 3DMark Time Spy Score | 1101 pontos | |
Ajuda | ||
| baixo | média | alto | ultra | |
|---|---|---|---|---|
| BioShock Infinite (2013) | 149.7 | 97 | 81.8 | 32.5 |
| The Witcher 3 (2015) | 62.1 | 36.2 | 16.8 | 11.8 |
| Rise of the Tomb Raider (2016) | 67 | 38.3 | 21.8 | 17.5 |
Barulho
| Ocioso |
| 29.9 / 29.9 / 32.2 dB |
| Carga |
| 34.6 / 40.2 dB |
 | ||
30 dB silencioso 40 dB(A) audível 50 dB(A) ruidosamente alto |
||
min: | ||
| Lenovo IdeaPad 320-15IKBRN 81BG001KGE GeForce MX150, i5-8250U, Ramaxel RTNTE256PCA8EADL | Lenovo IdeaPad 320-15IKB 80XL01NEGE GeForce 940MX, i5-7200U, SK Hynix HFS256G3BTND | Asus ZenBook UX530UX-FY070T GeForce GTX 950M, i7-7500U, SK Hynix HFS256G39TND-N210A | Asus VivoBook 15 X510UQ-BQ534T GeForce 940MX, i5-8250U | Acer Swift 3 SF315-41-R4W1 Vega 8, R5 2500U, Intel SSD 600p SSDPEKKW256G7 | HP Pavilion 15-cc107ng GeForce 940MX, i5-8250U, SanDisk SD8SN8U256G1006 | Acer Aspire 7 A715-71G-53TU GeForce GTX 1050 Mobile, i5-7300HQ, Kingston RBUSNS8180DS3128GH | |
|---|---|---|---|---|---|---|---|
| Noise | 2% | 1% | -9% | -0% | -1% | -1% | |
| desligado / ambiente * (dB) | 29.9 | 30.5 -2% | 30.2 -1% | 31 -4% | 31.8 -6% | 30.5 -2% | 30.4 -2% |
| Idle Minimum * (dB) | 29.9 | 30.5 -2% | 30.2 -1% | 32.3 -8% | 31.8 -6% | 30.9 -3% | 30.4 -2% |
| Idle Average * (dB) | 29.9 | 30.5 -2% | 30.2 -1% | 32.3 -8% | 32.1 -7% | 30.9 -3% | 30.8 -3% |
| Idle Maximum * (dB) | 32.2 | 30.5 5% | 31.6 2% | 32.3 -0% | 32.1 -0% | 31 4% | 30.8 4% |
| Load Average * (dB) | 34.6 | 35.1 -1% | 36 -4% | 43.2 -25% | 33 5% | 37.2 -8% | 33.6 3% |
| Witcher 3 ultra * (dB) | 40.2 | ||||||
| Load Maximum * (dB) | 40.2 | 35.4 12% | 36.6 9% | 43.2 -7% | 34.8 13% | 36.8 8% | 43.4 -8% |
* ... menor é melhor
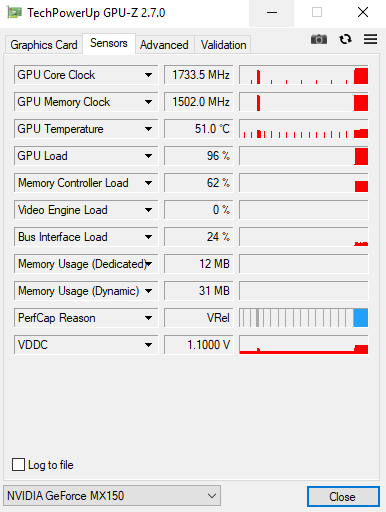
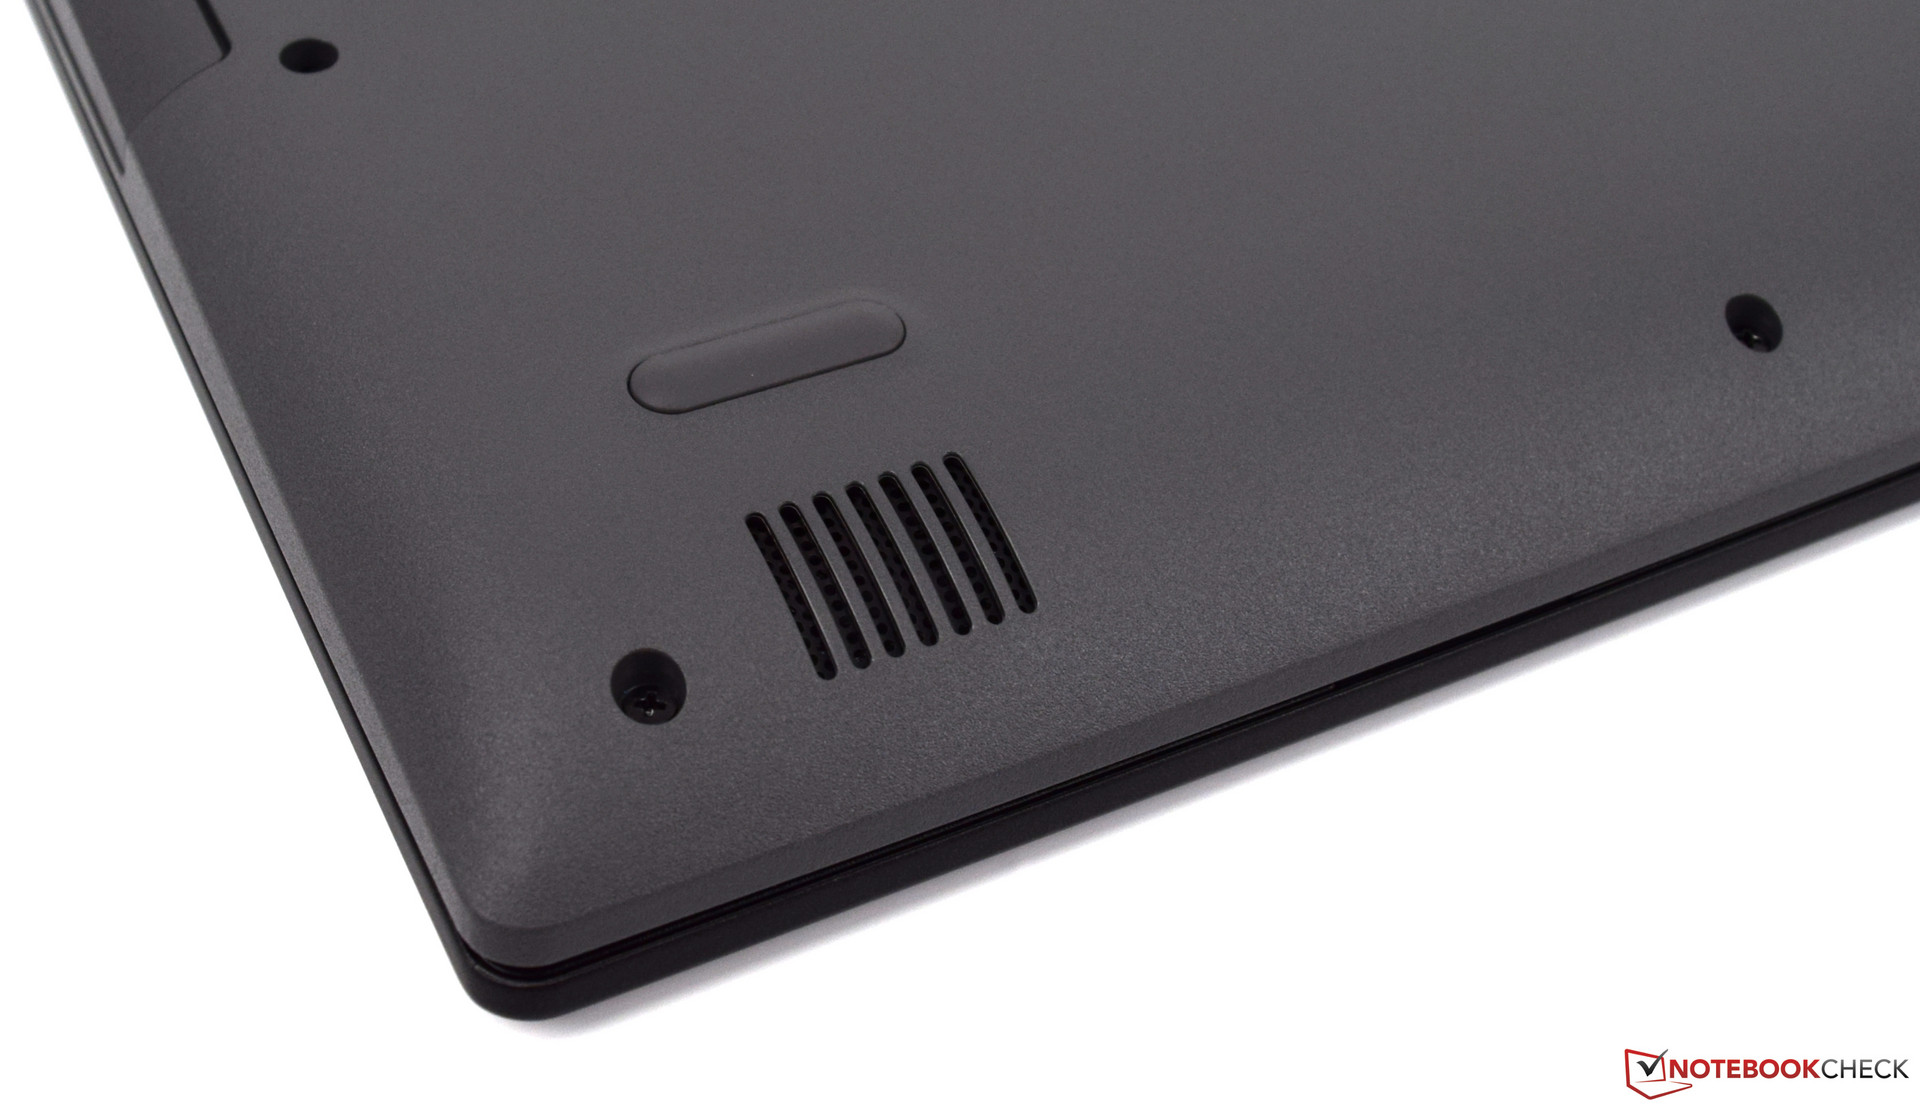
(±) A temperatura máxima no lado superior é 43 °C / 109 F, em comparação com a média de 36.8 °C / 98 F , variando de 21 a 71 °C para a classe Multimedia.
(-) A parte inferior aquece até um máximo de 49.7 °C / 121 F, em comparação com a média de 39.1 °C / 102 F
(+) Em uso inativo, a temperatura média para o lado superior é 23 °C / 73 F, em comparação com a média do dispositivo de 31.3 °C / ### class_avg_f### F.
(±) Jogando The Witcher 3, a temperatura média para o lado superior é 33 °C / 91 F, em comparação com a média do dispositivo de 31.3 °C / ## #class_avg_f### F.
(+) Os apoios para as mãos e o touchpad estão atingindo a temperatura máxima da pele (34.5 °C / 94.1 F) e, portanto, não estão quentes.
(-) A temperatura média da área do apoio para as mãos de dispositivos semelhantes foi 28.7 °C / 83.7 F (-5.8 °C / -10.4 F).
| Lenovo IdeaPad 320-15IKBRN 81BG001KGE GeForce MX150, i5-8250U, Ramaxel RTNTE256PCA8EADL | Lenovo IdeaPad 320-15IKB 80XL01NEGE GeForce 940MX, i5-7200U, SK Hynix HFS256G3BTND | Asus ZenBook UX530UX-FY070T GeForce GTX 950M, i7-7500U, SK Hynix HFS256G39TND-N210A | Asus VivoBook 15 X510UQ-BQ534T GeForce 940MX, i5-8250U | Acer Swift 3 SF315-41-R4W1 Vega 8, R5 2500U, Intel SSD 600p SSDPEKKW256G7 | HP Pavilion 15-cc107ng GeForce 940MX, i5-8250U, SanDisk SD8SN8U256G1006 | Acer Aspire 7 A715-71G-53TU GeForce GTX 1050 Mobile, i5-7300HQ, Kingston RBUSNS8180DS3128GH | |
|---|---|---|---|---|---|---|---|
| Heat | -5% | -3% | -9% | -8% | 4% | -8% | |
| Maximum Upper Side * (°C) | 43 | 43.8 -2% | 48.2 -12% | 40 7% | 41 5% | 42.3 2% | 41.6 3% |
| Maximum Bottom * (°C) | 49.7 | 43.7 12% | 45.8 8% | 44 11% | 41.1 17% | 40 20% | 42.5 14% |
| Idle Upper Side * (°C) | 24 | 26.5 -10% | 25 -4% | 31 -29% | 29.9 -25% | 25.5 -6% | 29.7 -24% |
| Idle Bottom * (°C) | 23.7 | 28.4 -20% | 24.9 -5% | 29.4 -24% | 30.9 -30% | 23.6 -0% | 29.4 -24% |
* ... menor é melhor
Lenovo IdeaPad 320-15IKBRN 81BG001KGE análise de áudio
(±) | o volume do alto-falante é médio, mas bom (###valor### dB)
Graves 100 - 315Hz
(-) | quase nenhum baixo - em média 18.8% menor que a mediana
(-) | graves não são lineares (15.2% delta para frequência anterior)
Médios 400 - 2.000 Hz
(+) | médios equilibrados - apenas 4.3% longe da mediana
(±) | a linearidade dos médios é média (7.2% delta para frequência anterior)
Altos 2 - 16 kHz
(±) | máximos mais altos - em média 7.1% maior que a mediana
(+) | os máximos são lineares (6% delta da frequência anterior)
Geral 100 - 16.000 Hz
(±) | a linearidade do som geral é média (24% diferença em relação à mediana)
Comparado com a mesma classe
» 85% de todos os dispositivos testados nesta classe foram melhores, 6% semelhantes, 10% piores
» O melhor teve um delta de 5%, a média foi 17%, o pior foi 45%
Comparado com todos os dispositivos testados
» 72% de todos os dispositivos testados foram melhores, 6% semelhantes, 22% piores
» O melhor teve um delta de 4%, a média foi 23%, o pior foi 134%
Asus ZenBook UX530UX-FY070T análise de áudio
(-) | alto-falantes não muito altos (###valor### dB)
Graves 100 - 315Hz
(-) | quase nenhum baixo - em média 15.8% menor que a mediana
(±) | a linearidade dos graves é média (7.6% delta para a frequência anterior)
Médios 400 - 2.000 Hz
(+) | médios equilibrados - apenas 3.9% longe da mediana
(+) | médios são lineares (5.4% delta para frequência anterior)
Altos 2 - 16 kHz
(±) | máximos mais altos - em média 5.9% maior que a mediana
(±) | a linearidade dos máximos é média (9.7% delta para frequência anterior)
Geral 100 - 16.000 Hz
(±) | a linearidade do som geral é média (23.8% diferença em relação à mediana)
Comparado com a mesma classe
» 84% de todos os dispositivos testados nesta classe foram melhores, 6% semelhantes, 10% piores
» O melhor teve um delta de 5%, a média foi 17%, o pior foi 45%
Comparado com todos os dispositivos testados
» 71% de todos os dispositivos testados foram melhores, 6% semelhantes, 22% piores
» O melhor teve um delta de 4%, a média foi 23%, o pior foi 134%
| desligado | |
| Ocioso | |
| Carga |
|
Key:
min: | |
| Lenovo IdeaPad 320-15IKBRN 81BG001KGE i5-8250U, GeForce MX150, Ramaxel RTNTE256PCA8EADL, TN LED, 1920x1080, 15.6" | Lenovo IdeaPad 320-15IKB 80XL01NEGE i5-7200U, GeForce 940MX, SK Hynix HFS256G3BTND, TN LED, 1920x1080, 15.6" | Asus ZenBook UX530UX-FY070T i7-7500U, GeForce GTX 950M, SK Hynix HFS256G39TND-N210A, IPS, 1920x1080, 15.6" | Asus VivoBook 15 X510UQ-BQ534T i5-8250U, GeForce 940MX, , , 1920x1080, 15.6" | Acer Swift 3 SF315-41-R4W1 R5 2500U, Vega 8, Intel SSD 600p SSDPEKKW256G7, IPS, 1920x1080, 15.6" | HP Pavilion 15-cc107ng i5-8250U, GeForce 940MX, SanDisk SD8SN8U256G1006, TN LED, 1920x1080, 15.6" | Acer Aspire 7 A715-71G-53TU i5-7300HQ, GeForce GTX 1050 Mobile, Kingston RBUSNS8180DS3128GH, a-Si TFT-LCD, IPS, 1920x1080, 15.6" | |
|---|---|---|---|---|---|---|---|
| Power Consumption | 17% | -7% | -29% | -30% | 5% | -39% | |
| Idle Minimum * (Watt) | 4.03 | 2.9 28% | 3.5 13% | 5.6 -39% | 7.3 -81% | 2.8 31% | 4 1% |
| Idle Average * (Watt) | 6.81 | 5.9 13% | 5.3 22% | 9.2 -35% | 9.7 -42% | 5.8 15% | 6.9 -1% |
| Idle Maximum * (Watt) | 8.34 | 7.3 12% | 9.1 -9% | 9.7 -16% | 13 -56% | 7.5 10% | 9.4 -13% |
| Load Average * (Watt) | 37.3 | 39.5 -6% | 60 -61% | 58 -55% | 40.4 -8% | 54 -45% | 72.6 -95% |
| Witcher 3 ultra * (Watt) | 52 | ||||||
| Load Maximum * (Watt) | 65.5 | 42 36% | 65 1% | 64.2 2% | 42.2 36% | 56 15% | 122 -86% |
* ... menor é melhor

| Lenovo IdeaPad 320-15IKBRN 81BG001KGE i5-8250U, GeForce MX150, 30 Wh | Lenovo IdeaPad 320-15IKB 80XL01NEGE i5-7200U, GeForce 940MX, 30 Wh | Asus ZenBook UX530UX-FY070T i7-7500U, GeForce GTX 950M, 50 Wh | Asus VivoBook 15 X510UQ-BQ534T i5-8250U, GeForce 940MX, 42 Wh | Acer Swift 3 SF315-41-R4W1 R5 2500U, Vega 8, 48 Wh | HP Pavilion 15-cc107ng i5-8250U, GeForce 940MX, 41.7 Wh | Acer Aspire 7 A715-71G-53TU i5-7300HQ, GeForce GTX 1050 Mobile, 48 Wh | |
|---|---|---|---|---|---|---|---|
| Duração da bateria | 4% | 16% | -13% | 3% | 47% | 2% | |
| Reader / Idle (h) | 10.5 | 8.8 -16% | 12.2 16% | 9.9 -6% | |||
| H.264 (h) | 5 | 7 40% | 5.1 2% | ||||
| WiFi v1.3 (h) | 4.5 | 4.7 4% | 6.2 38% | 3.9 -13% | 5.2 16% | 6.6 47% | 5.6 24% |
| Load (h) | 1.8 | 1.8 0% | 1.4 -22% | 1.6 -11% |
Pro
Contra
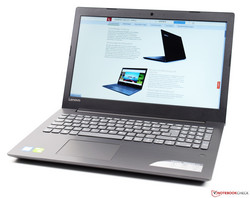
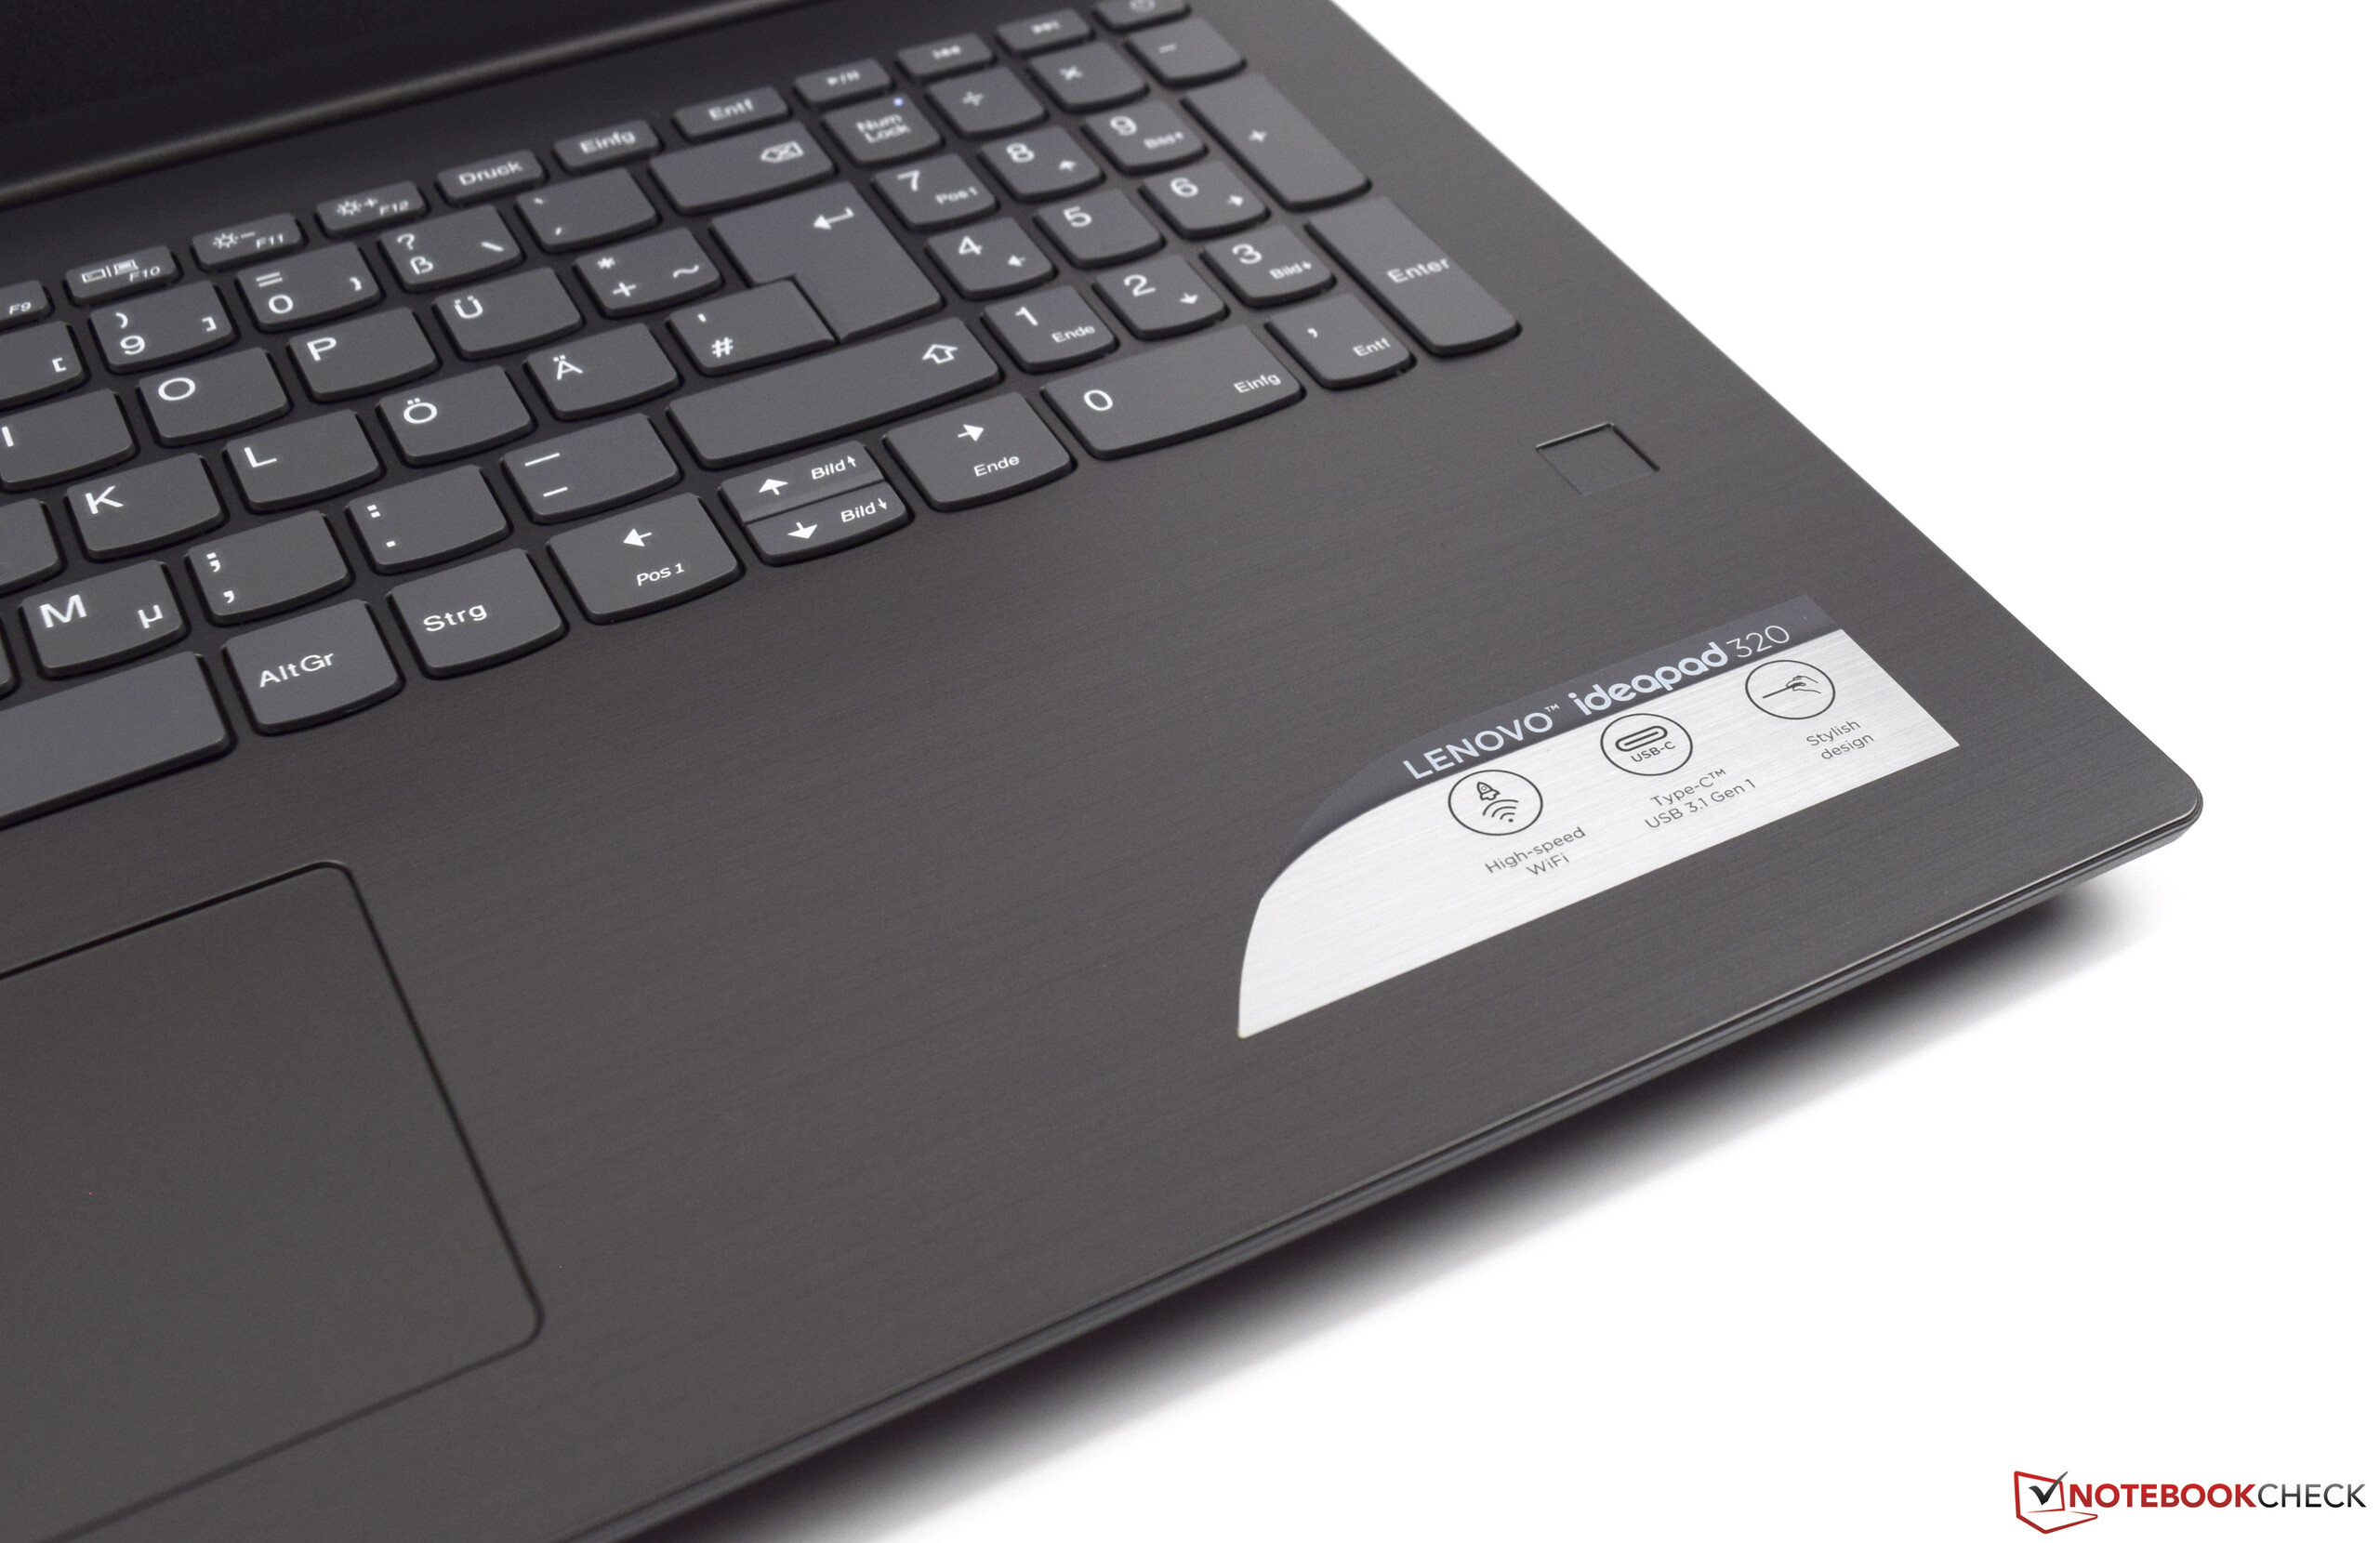
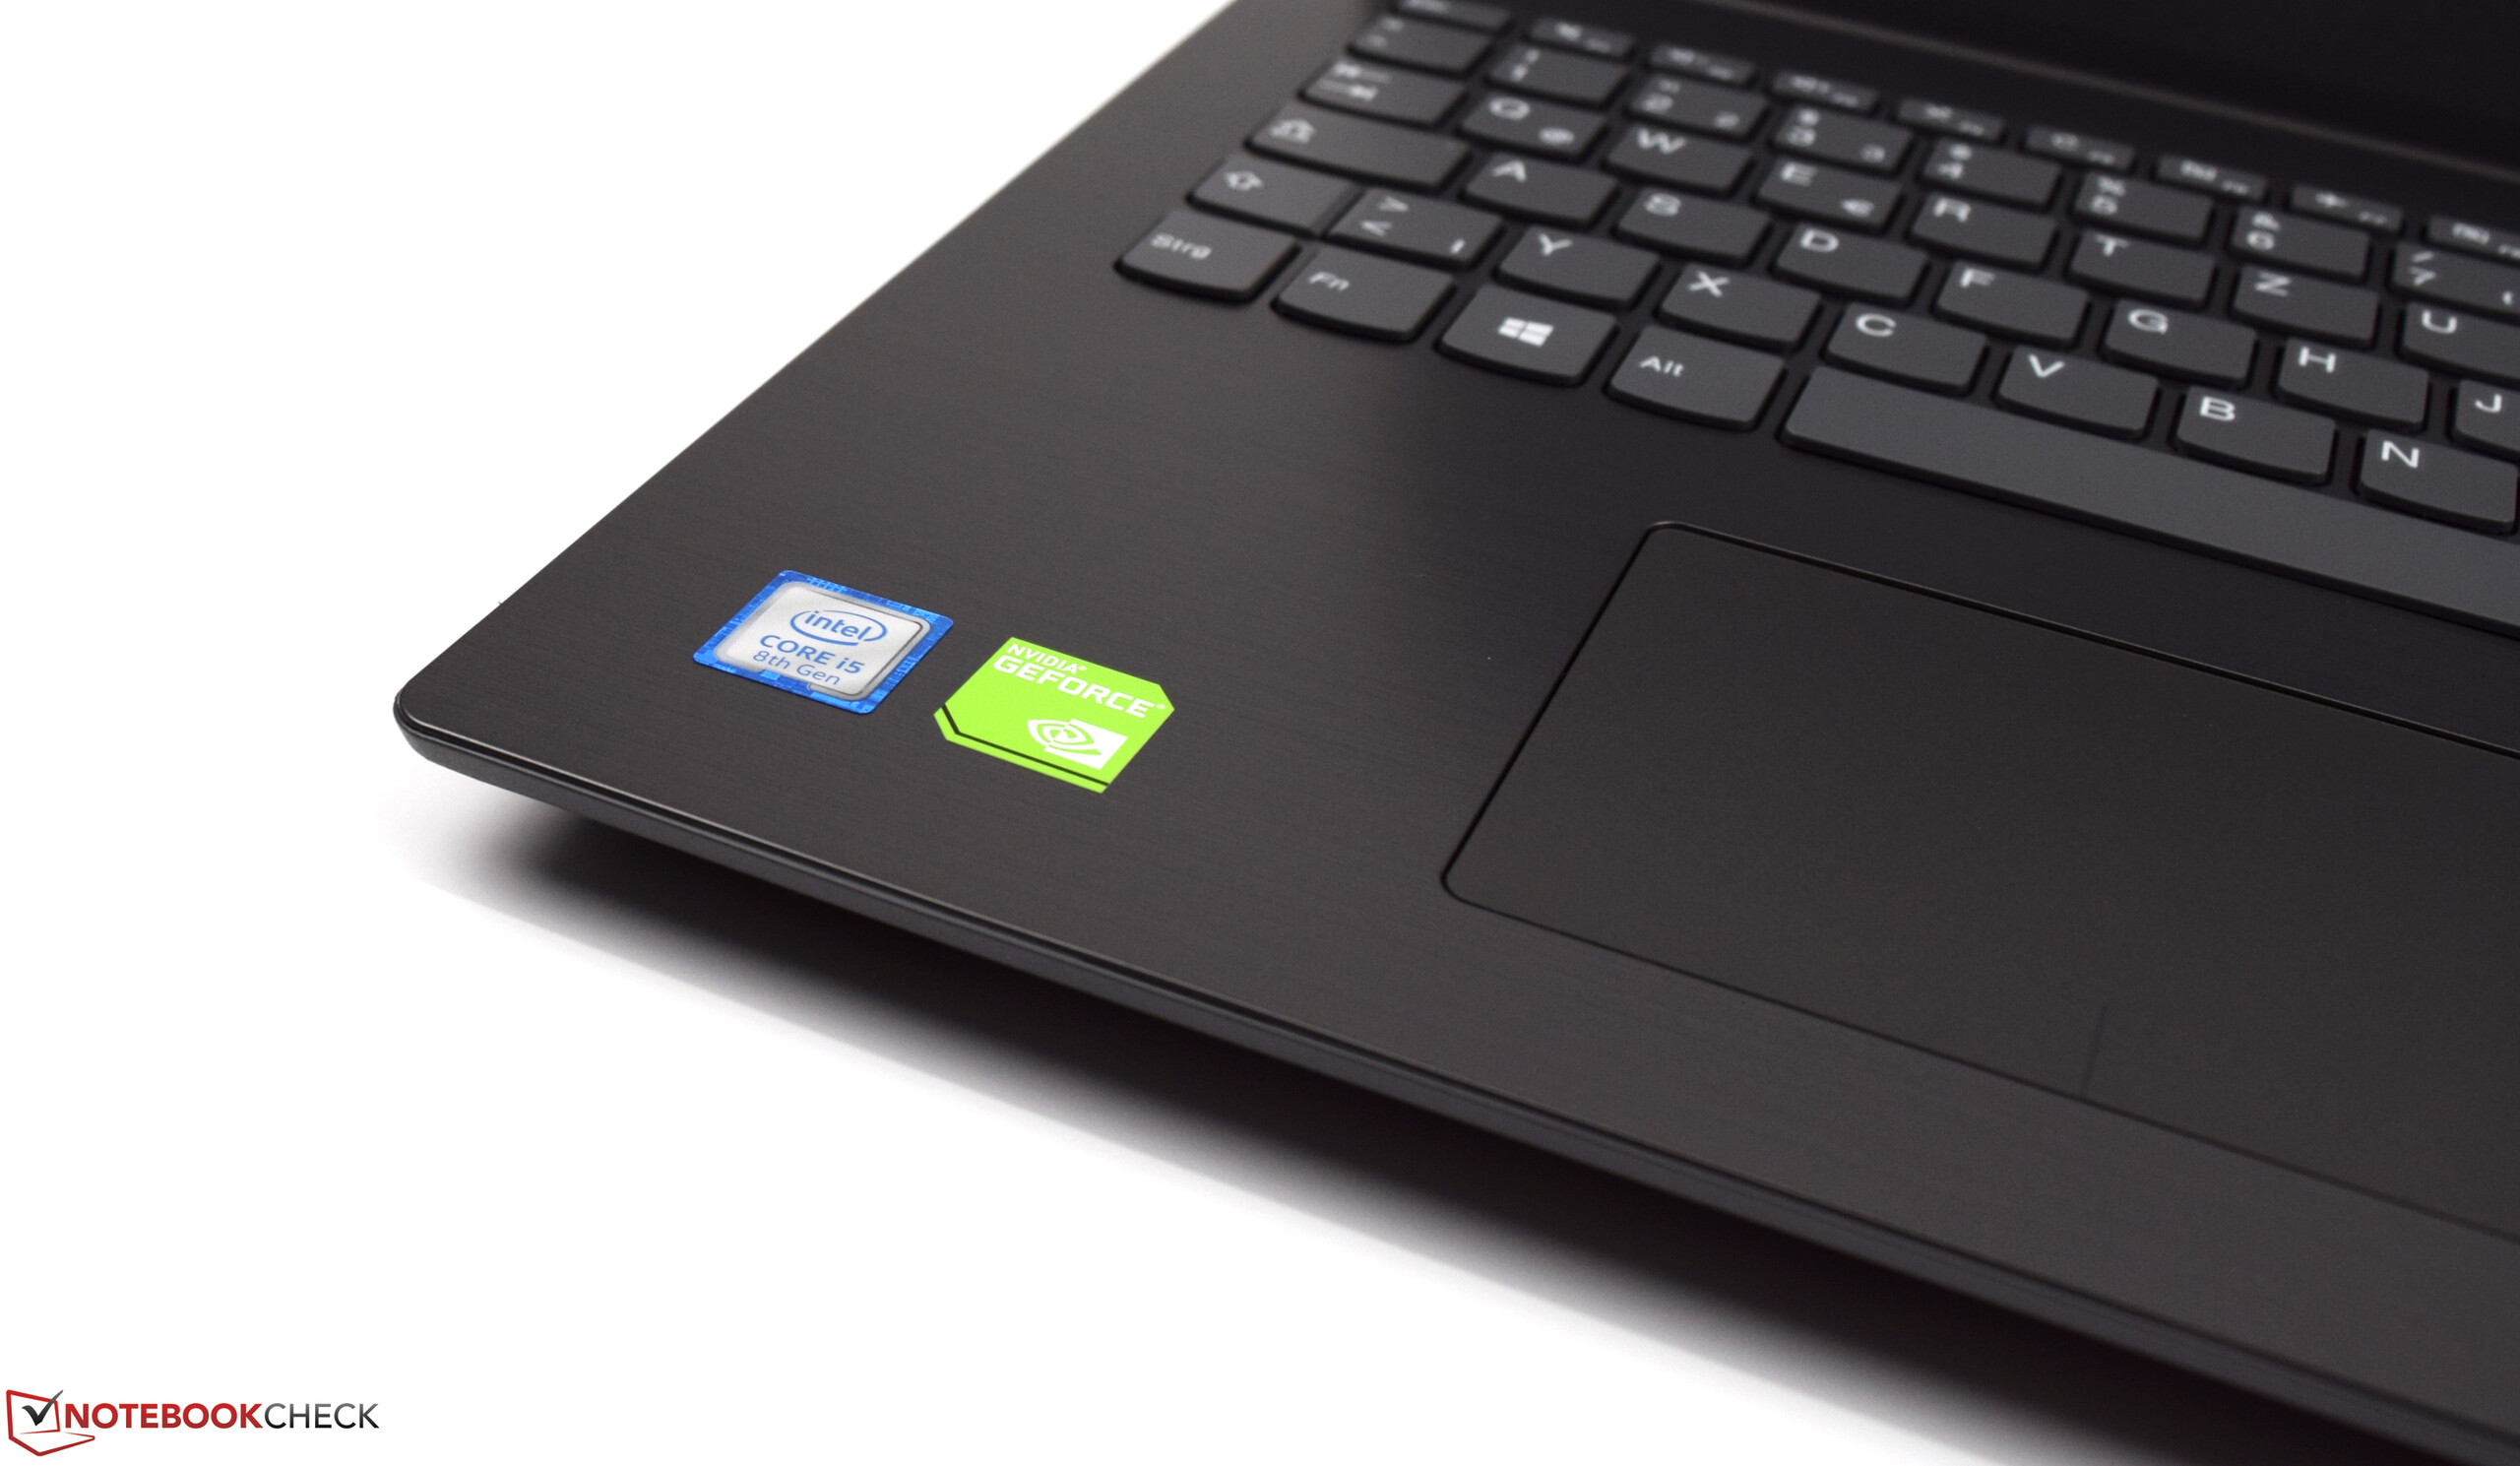
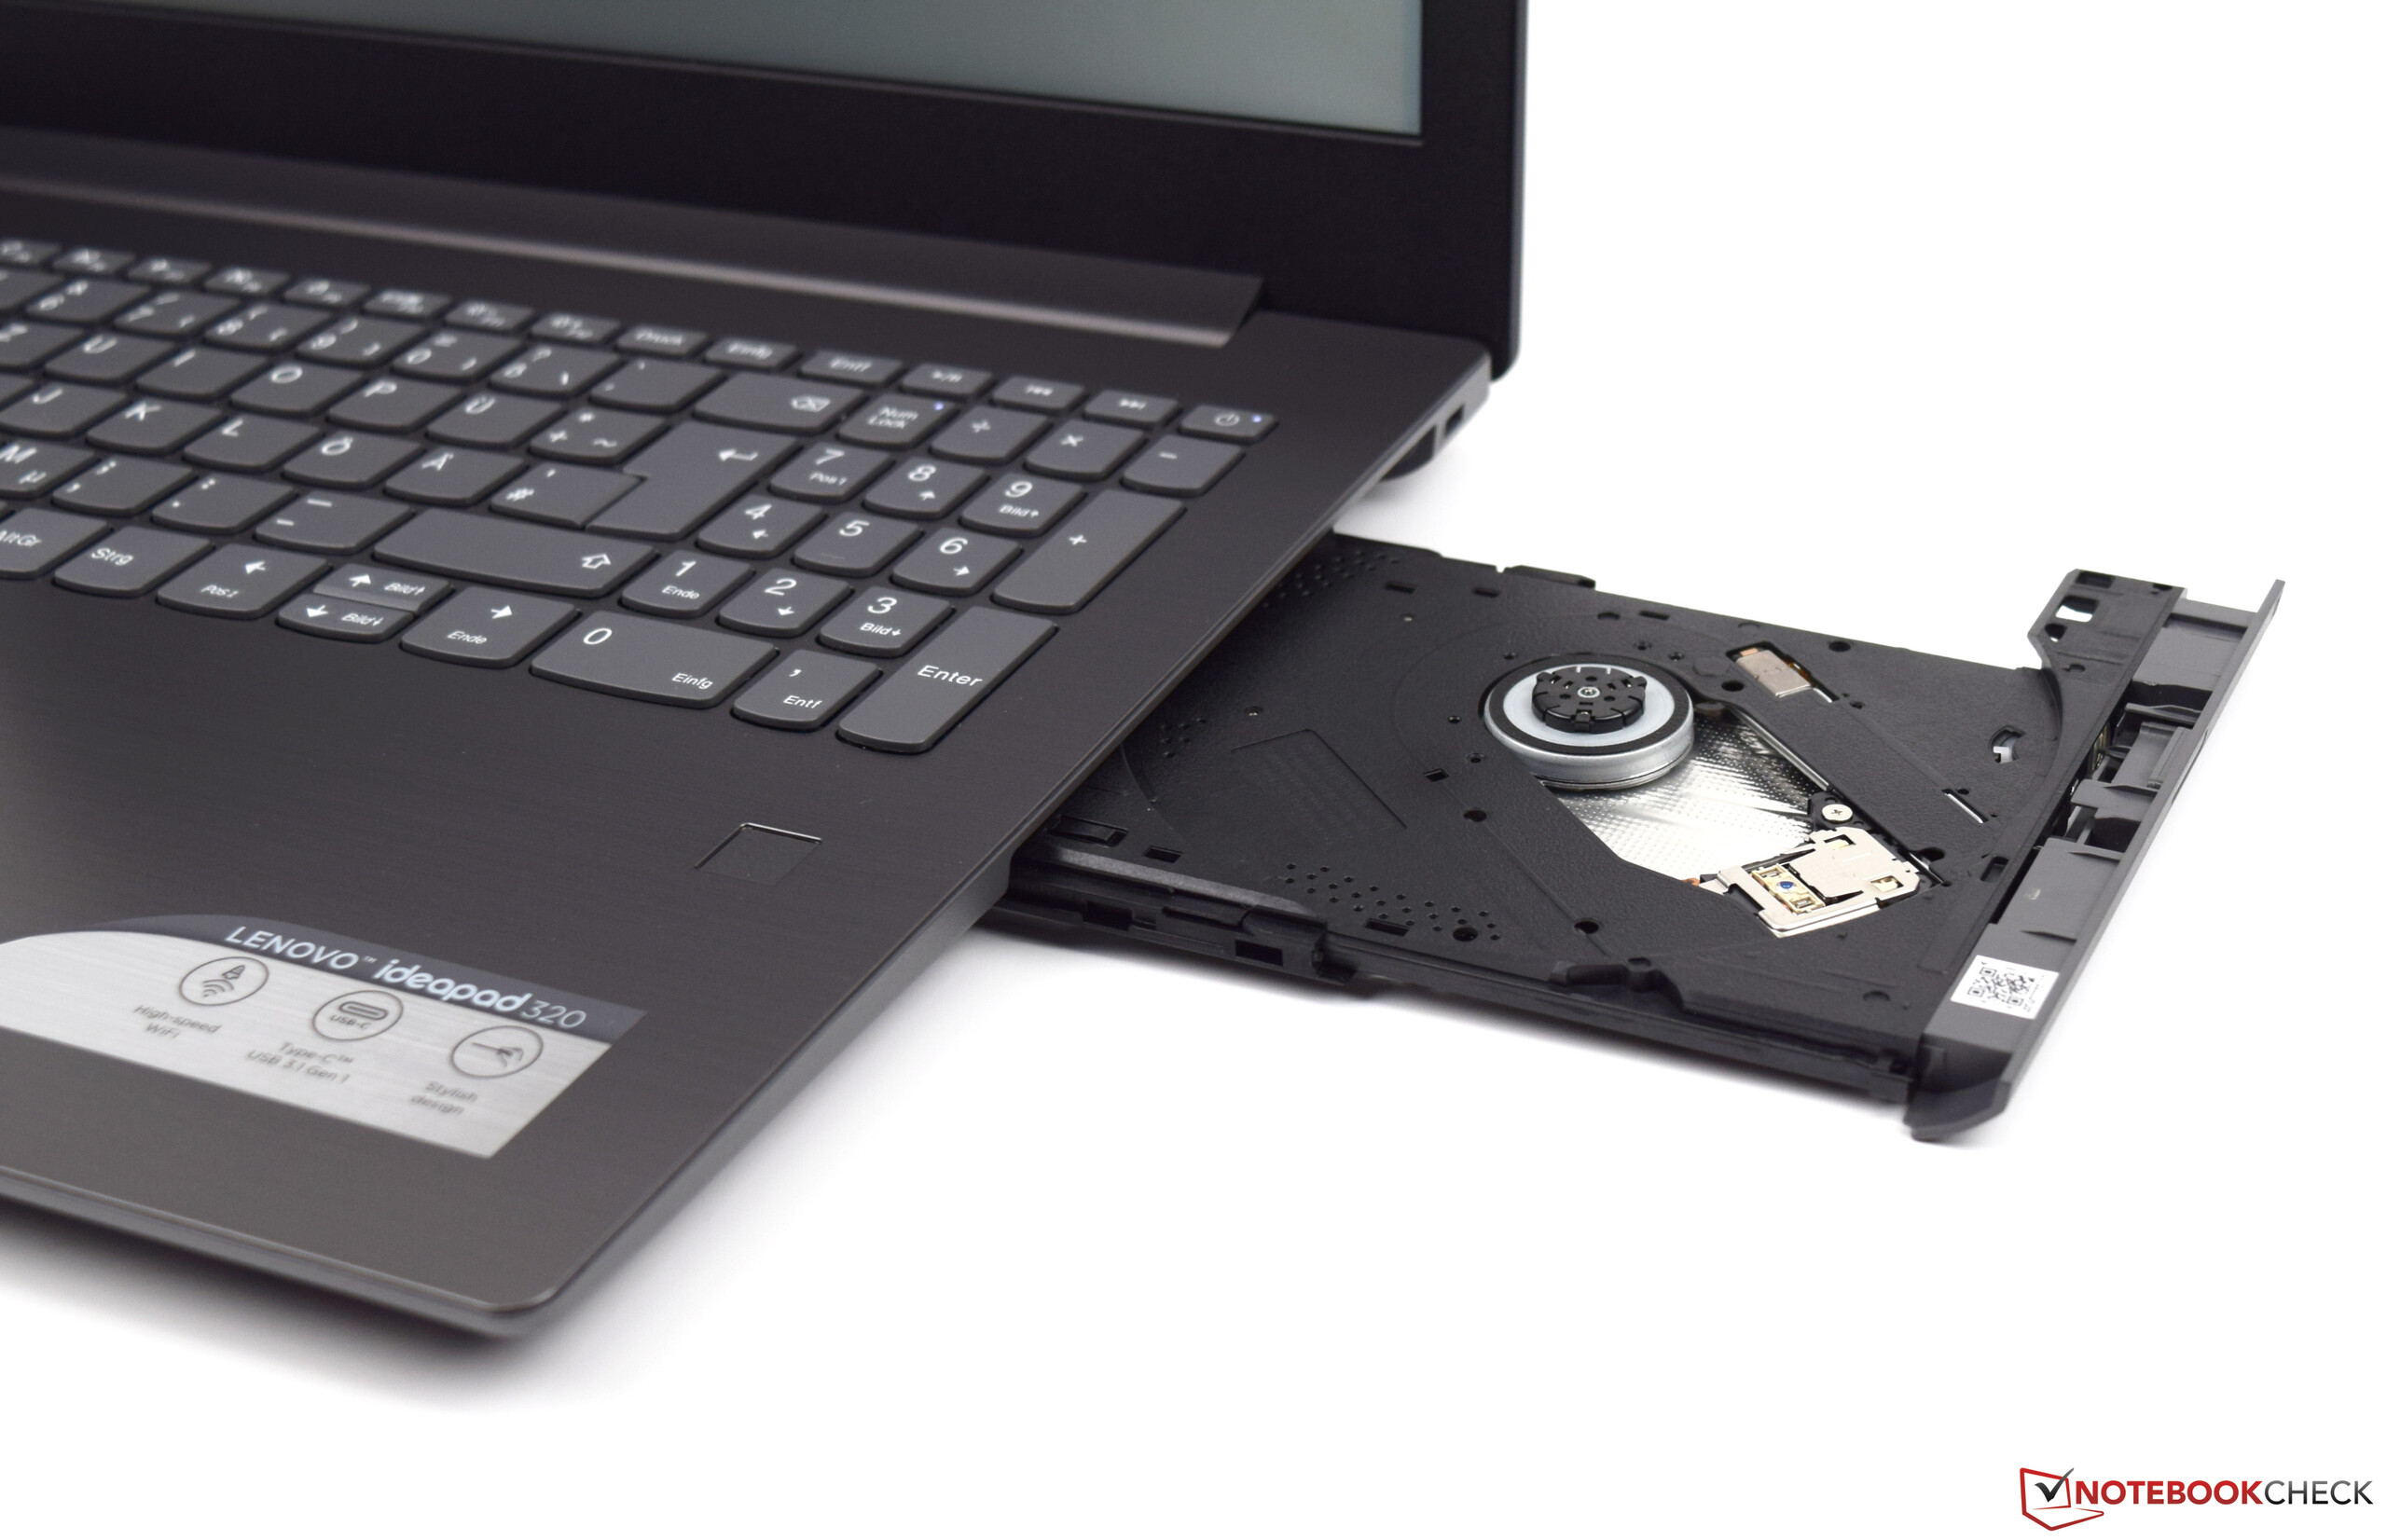
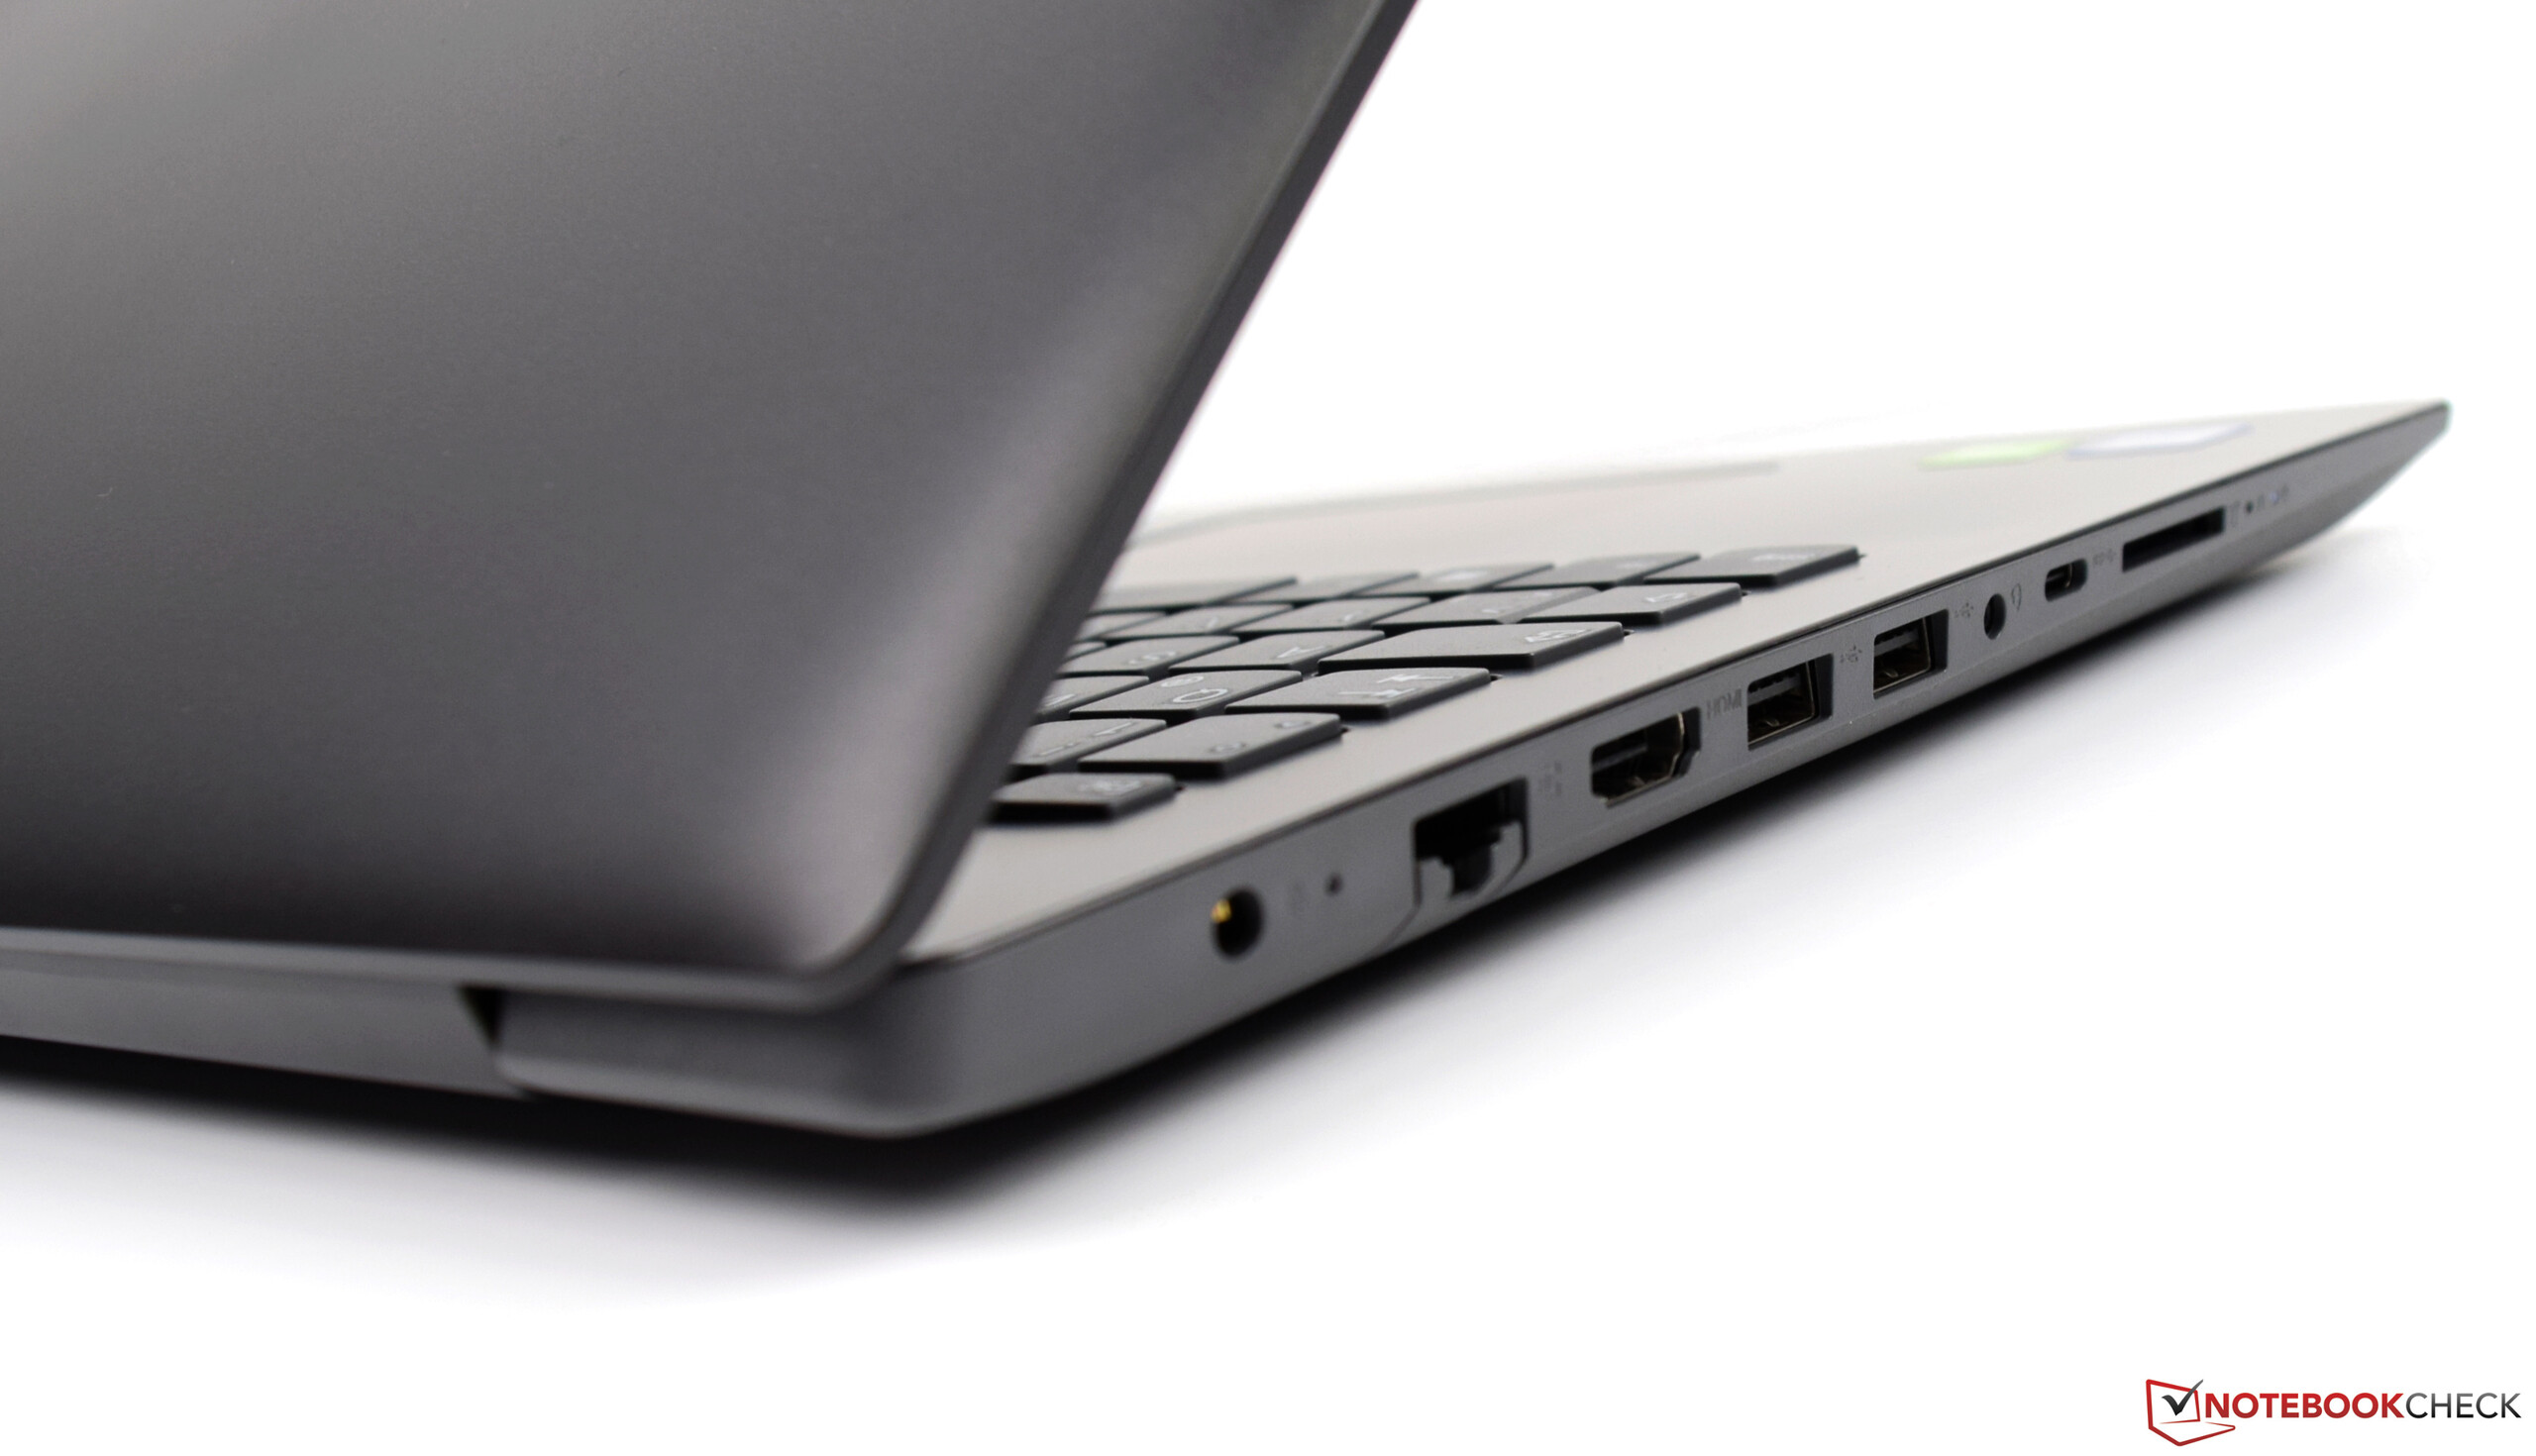
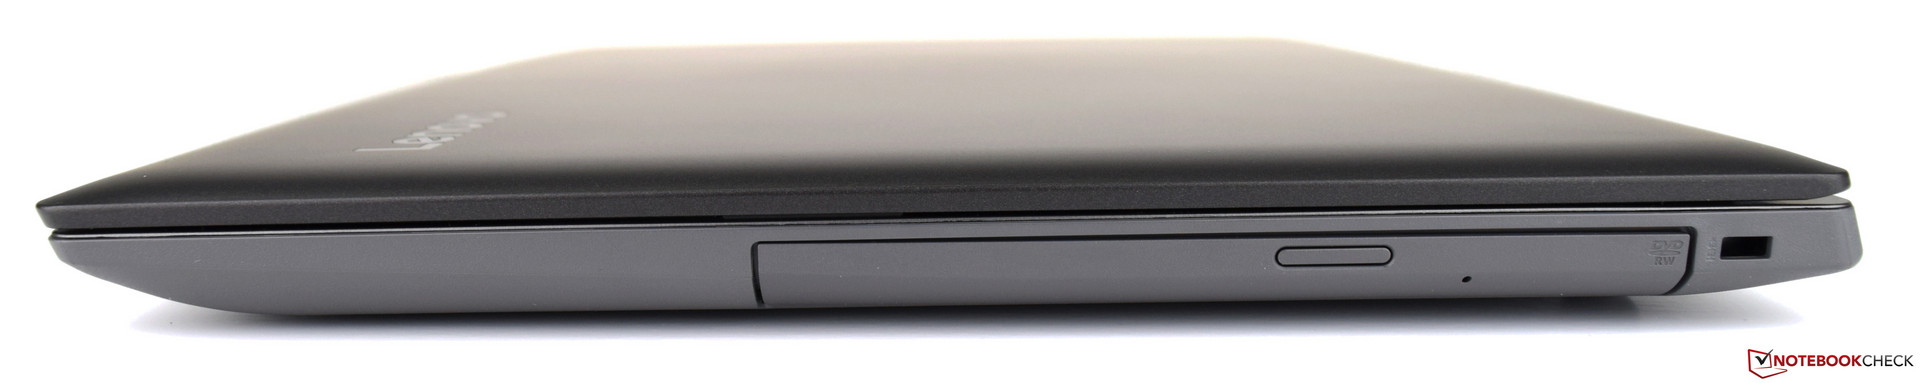
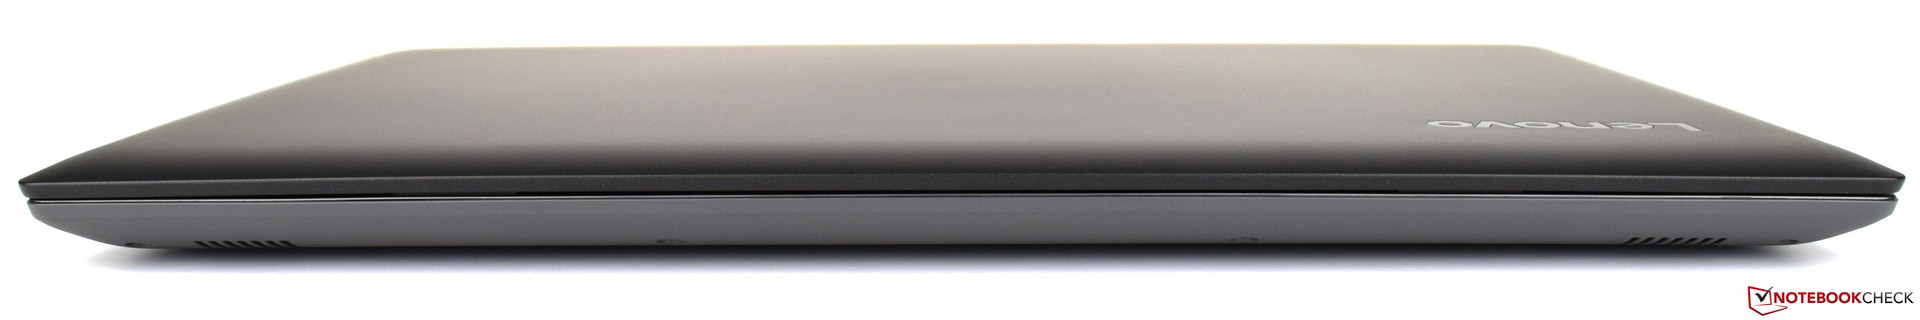
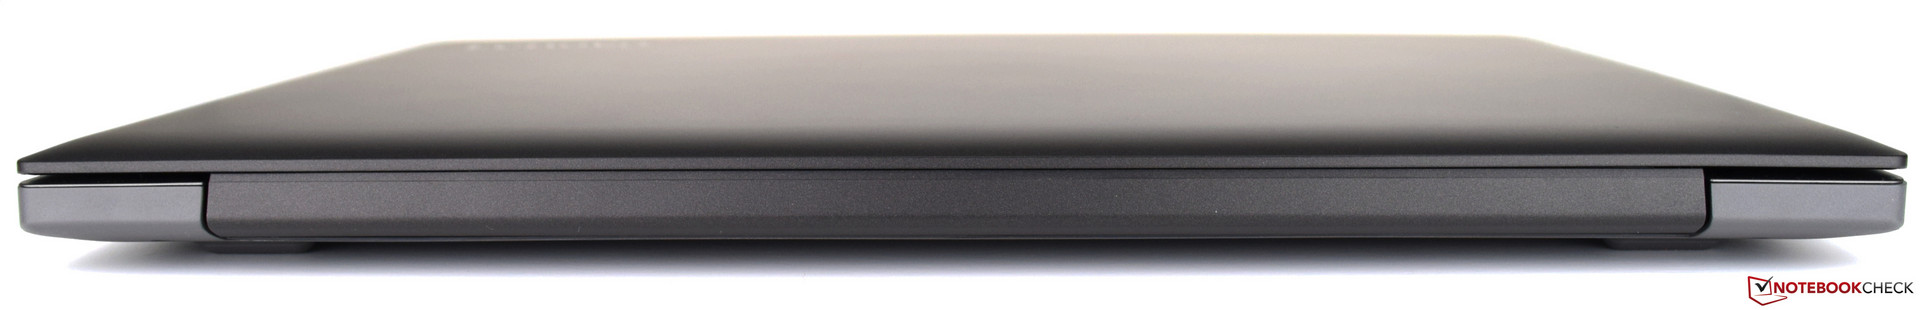
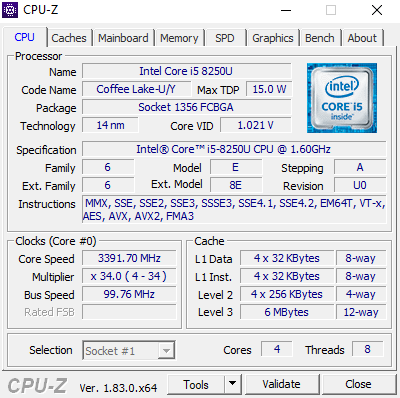
O ProBook 320 é um portátil multimídia de 15,6 polegadas. Infelizmente, a Lenovo não agiu no que diz respeito à nossa crítica da versão anterior, o que nos deixa com um dispositivo com os mesmos problemas que antes, mas melhorou o desempenho. É claro que o atual Intel Core i5-8250Uoferece um desempenho bastante decente e o Lenovo IdeaPad 320-15IKB inclusive pode ser usado para jogos graças à GeForce MX150. Em suma, os compradores receberão um bom portátil completo com uma tela de qualidade inferior por um preço decente de 739 Euros (~$922).
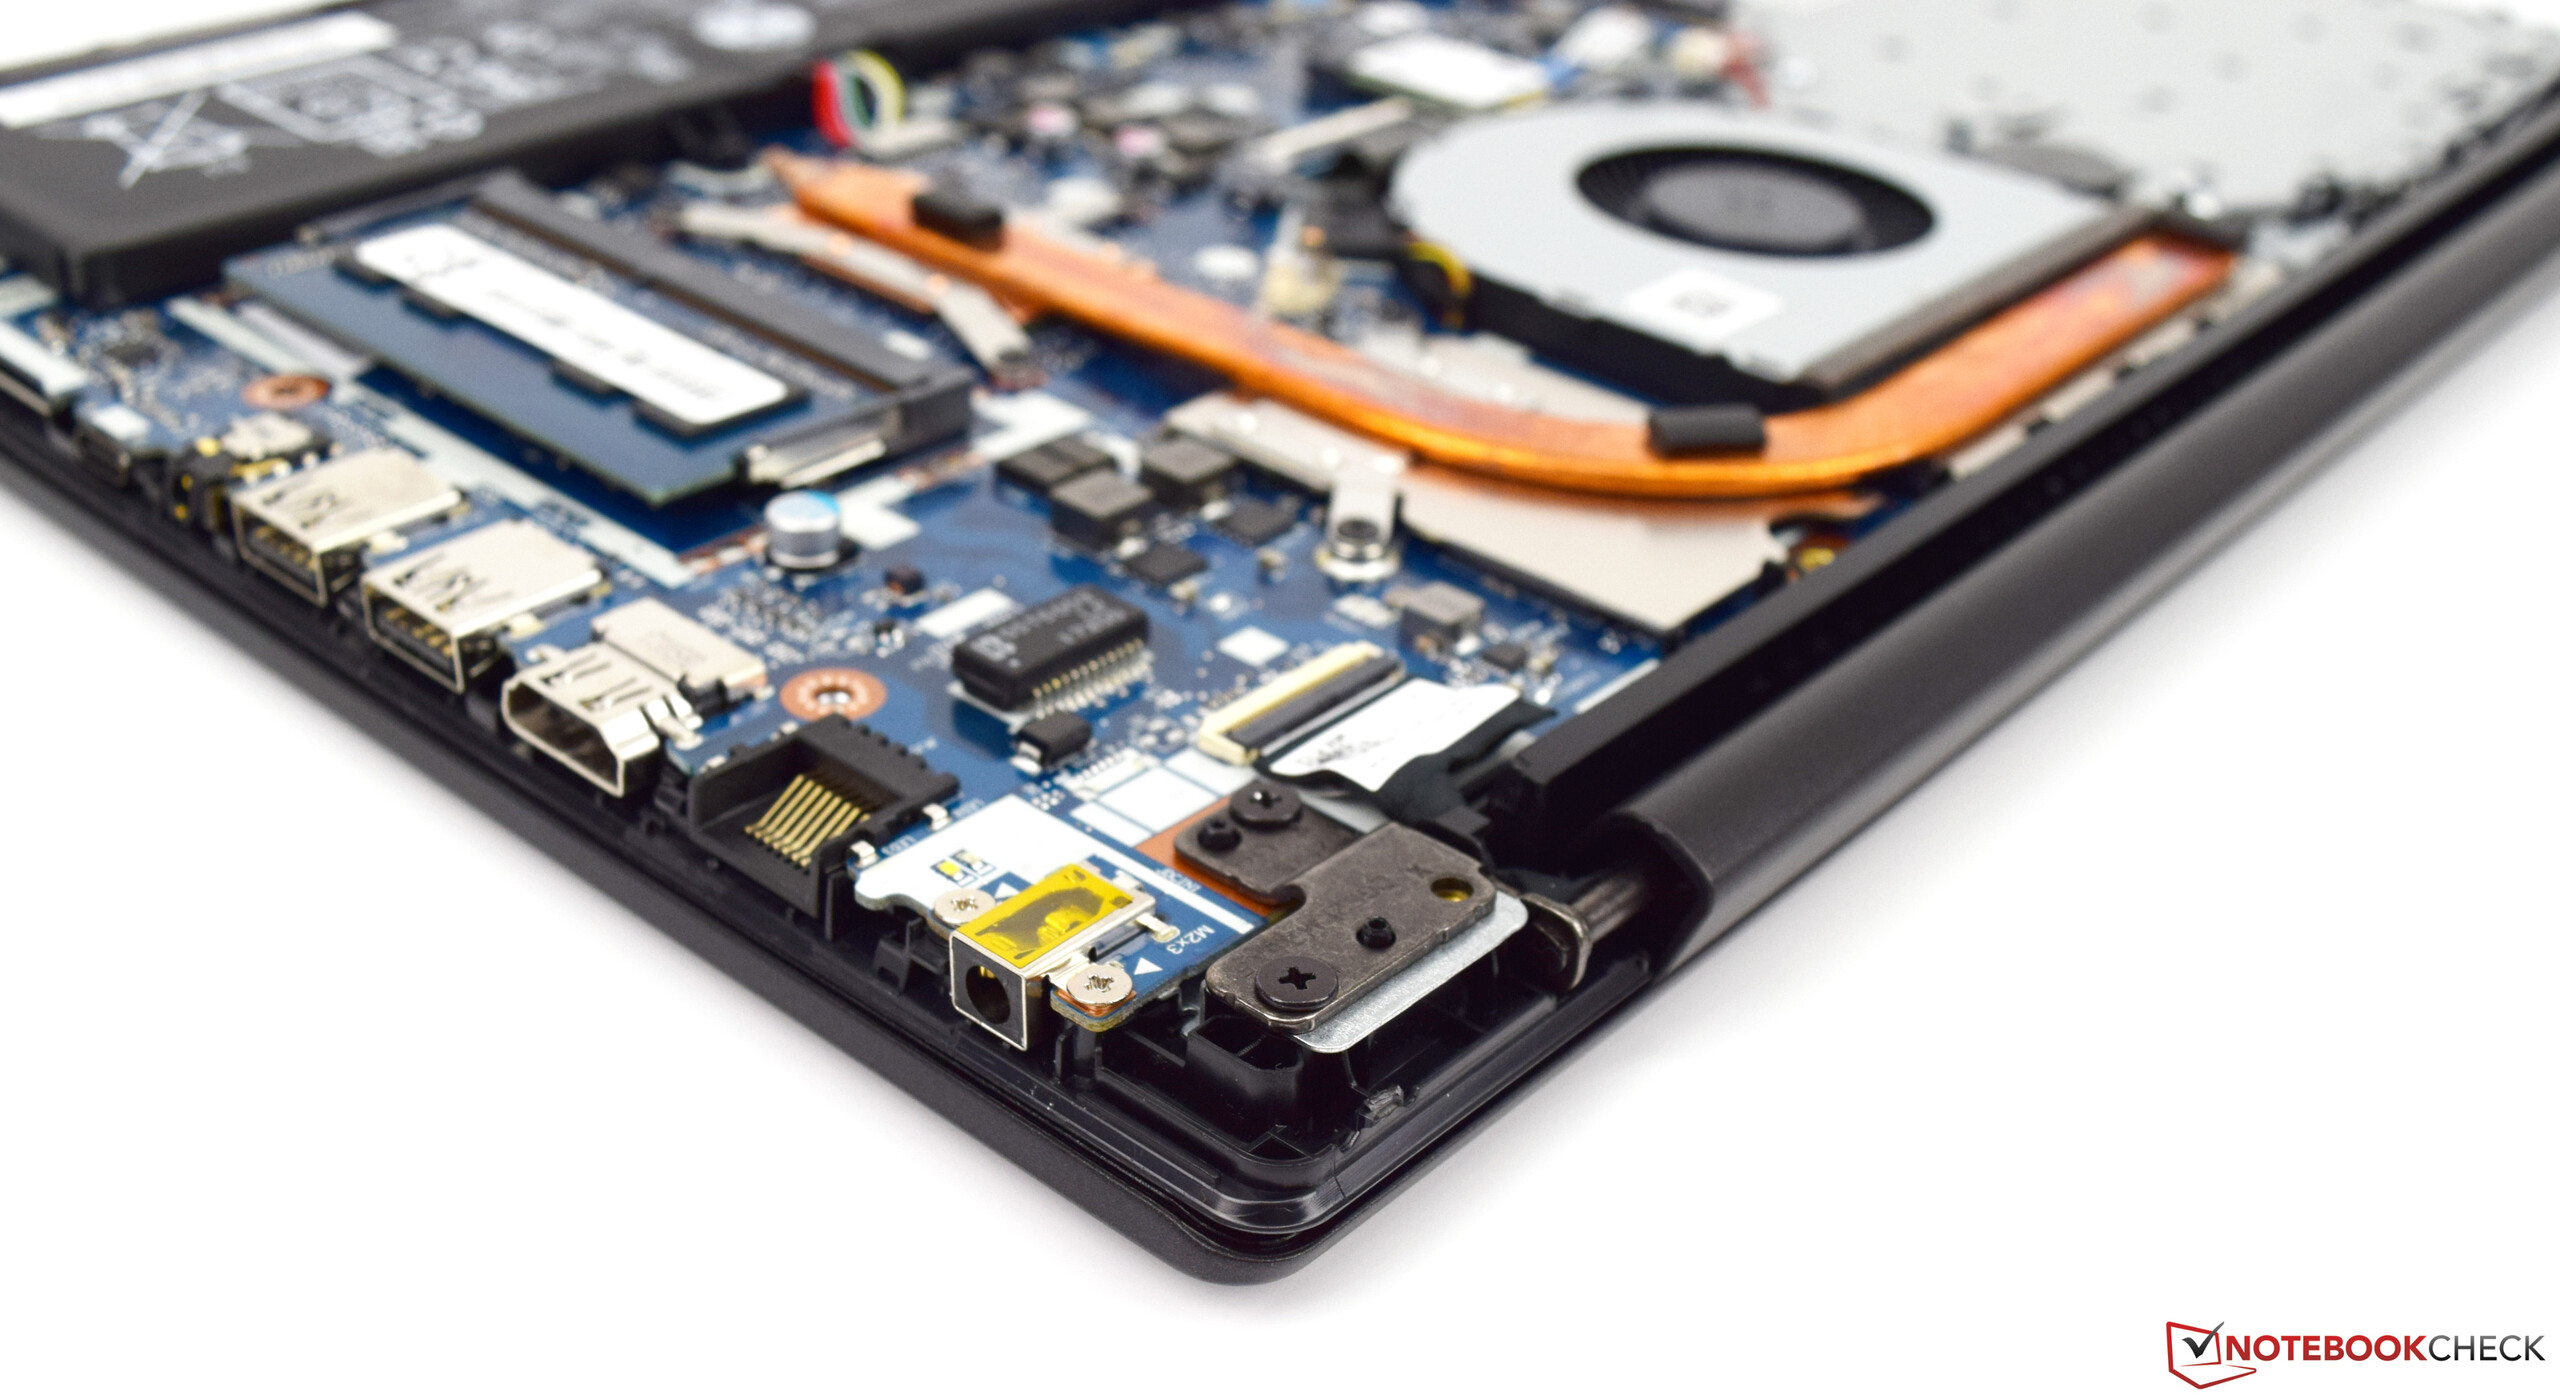
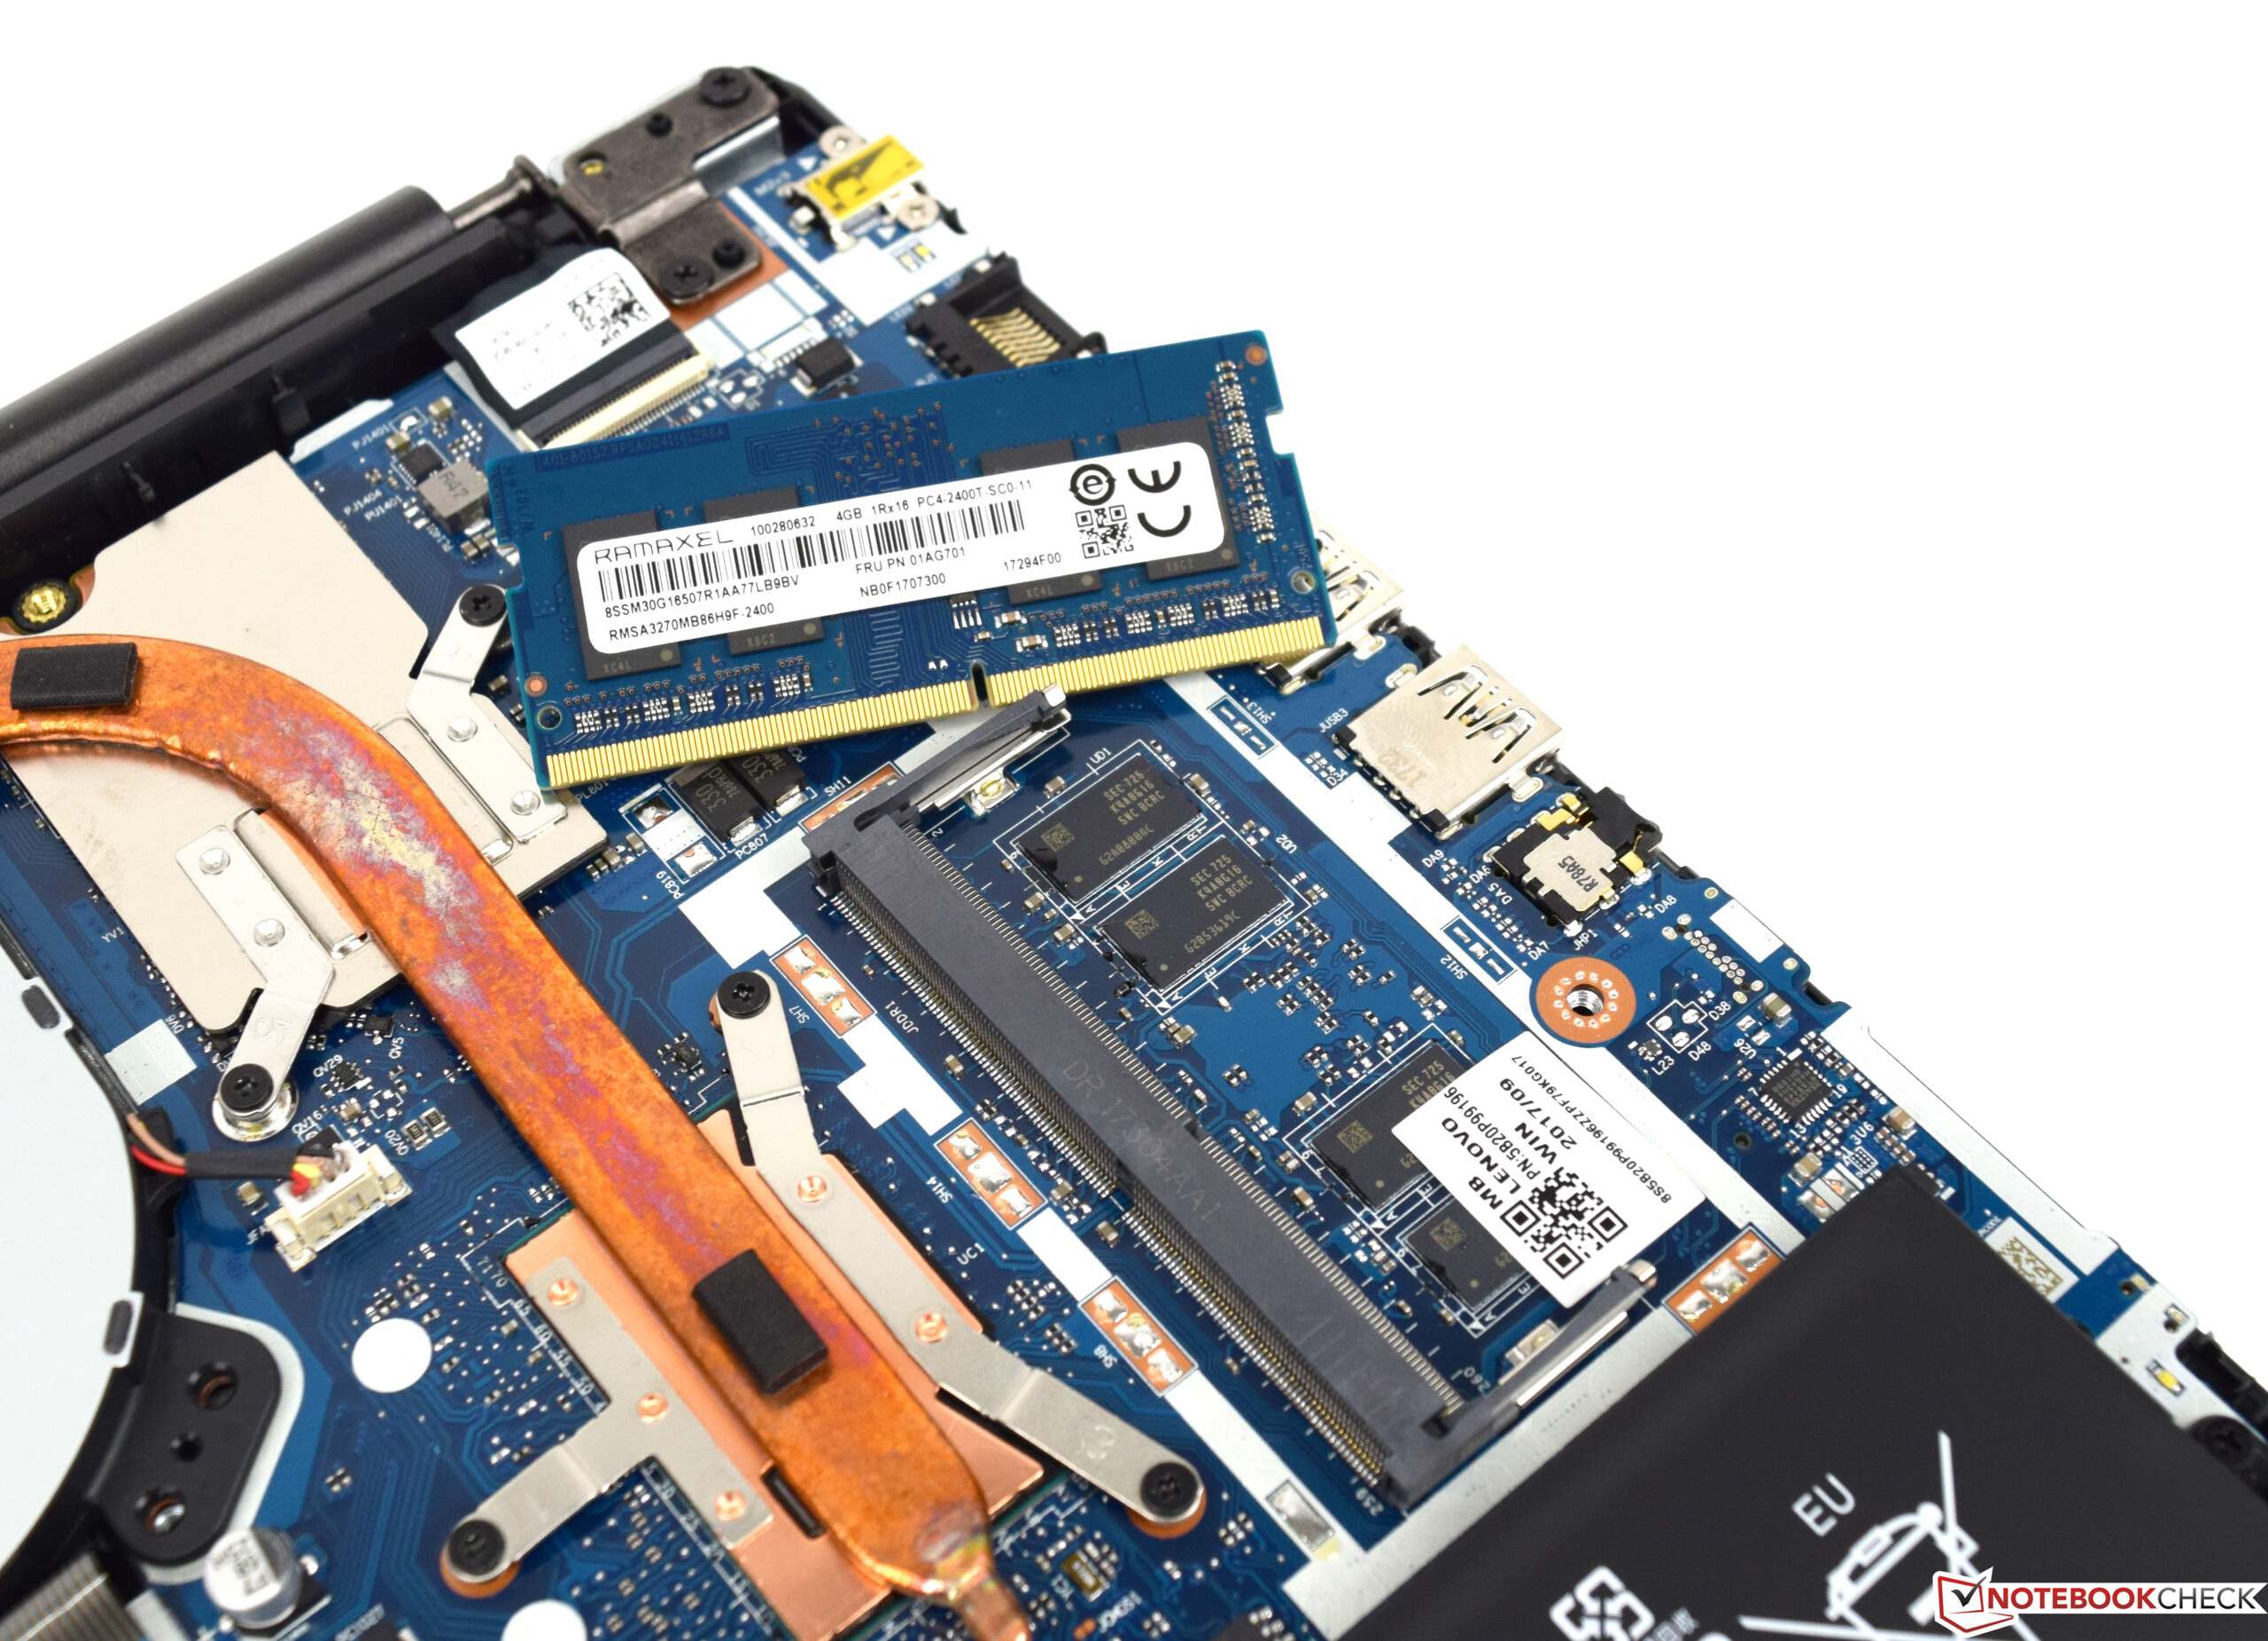
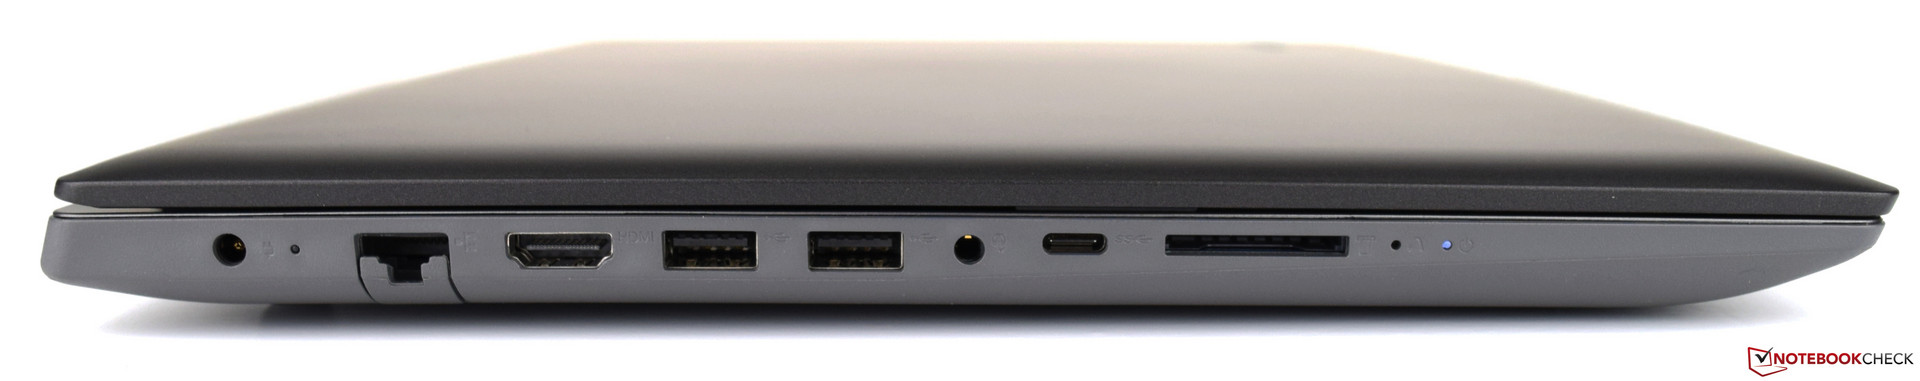
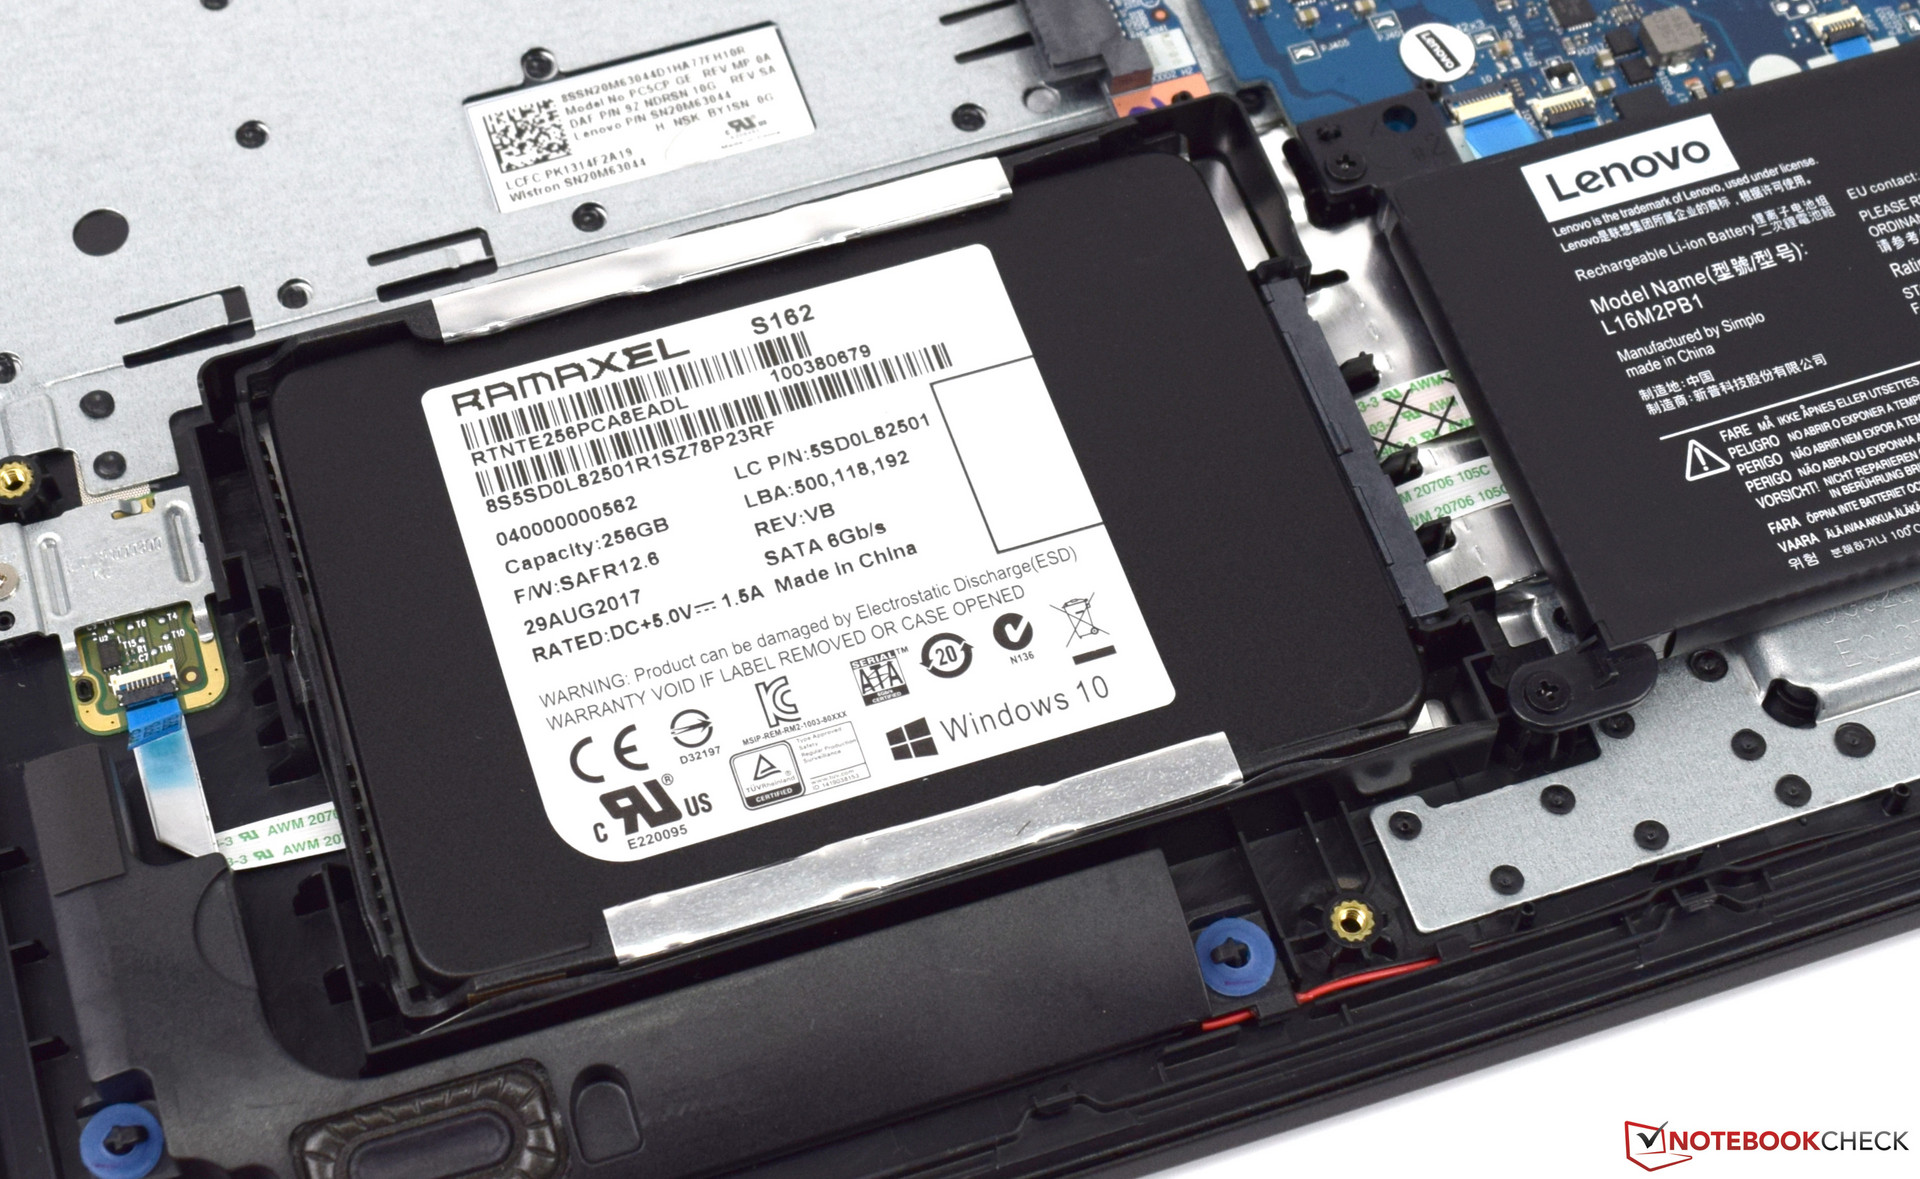
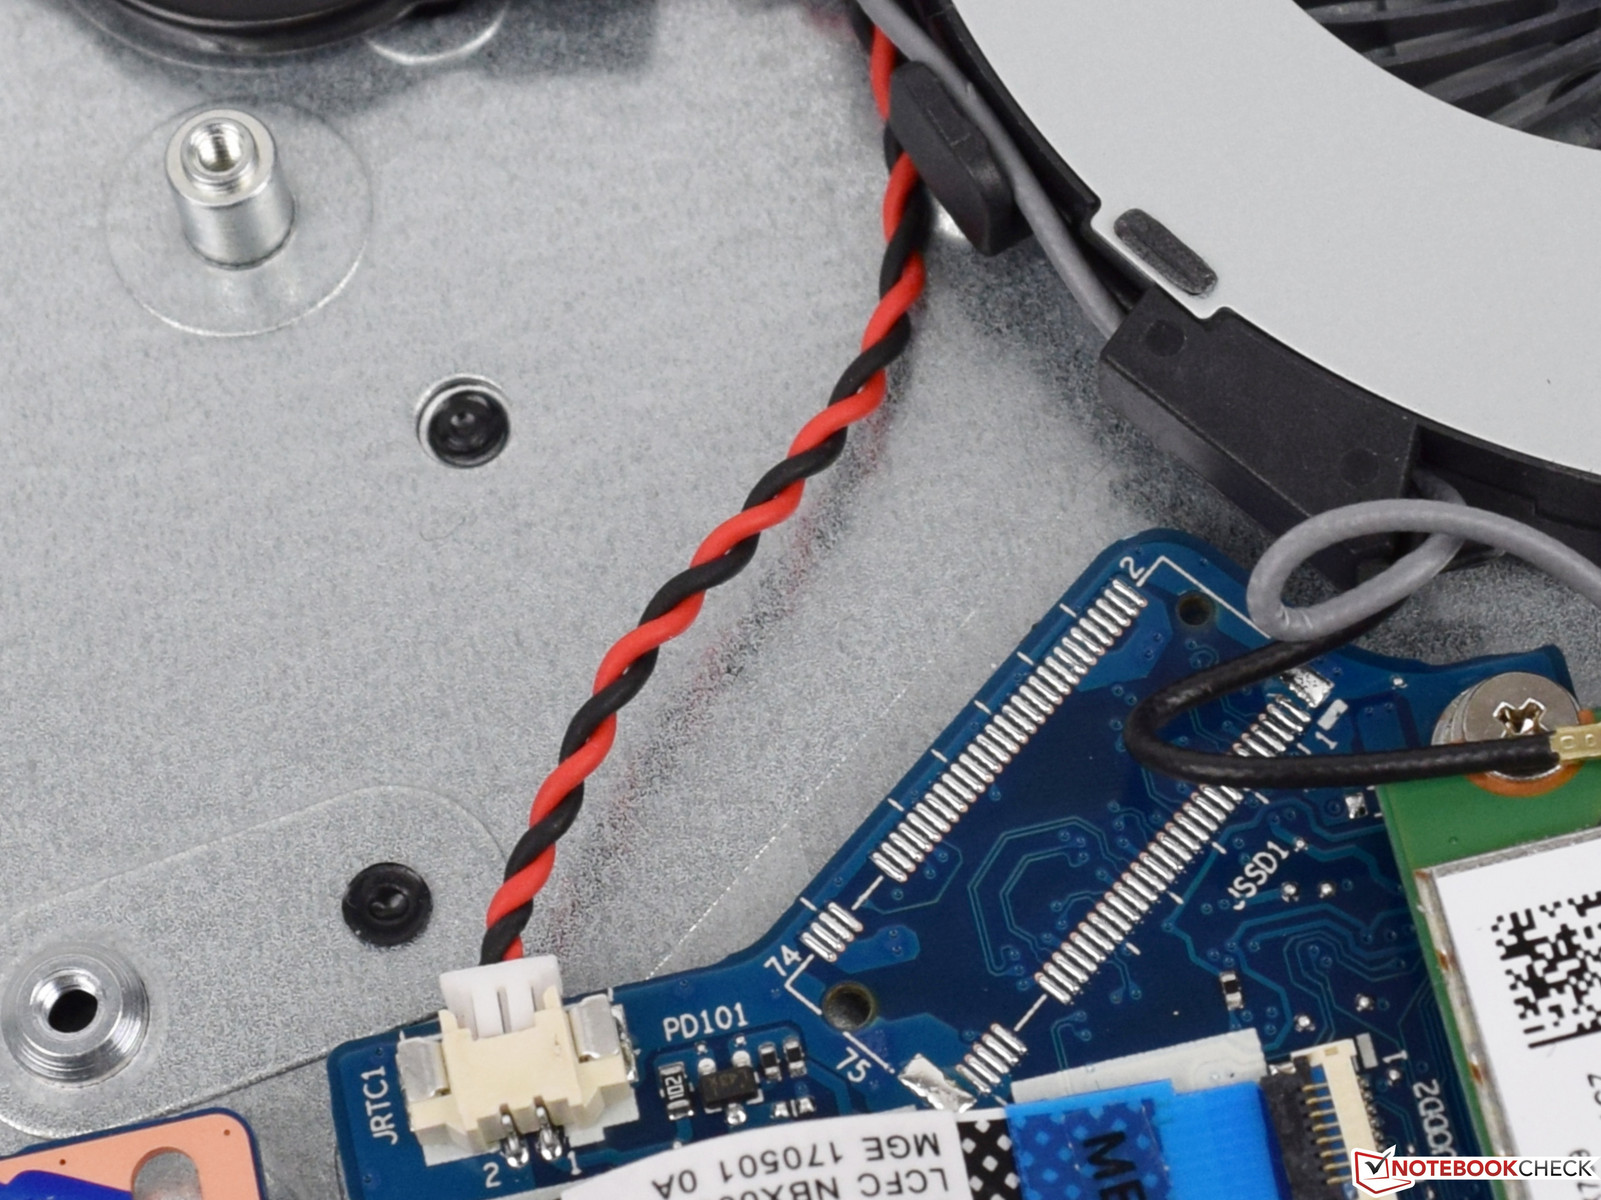
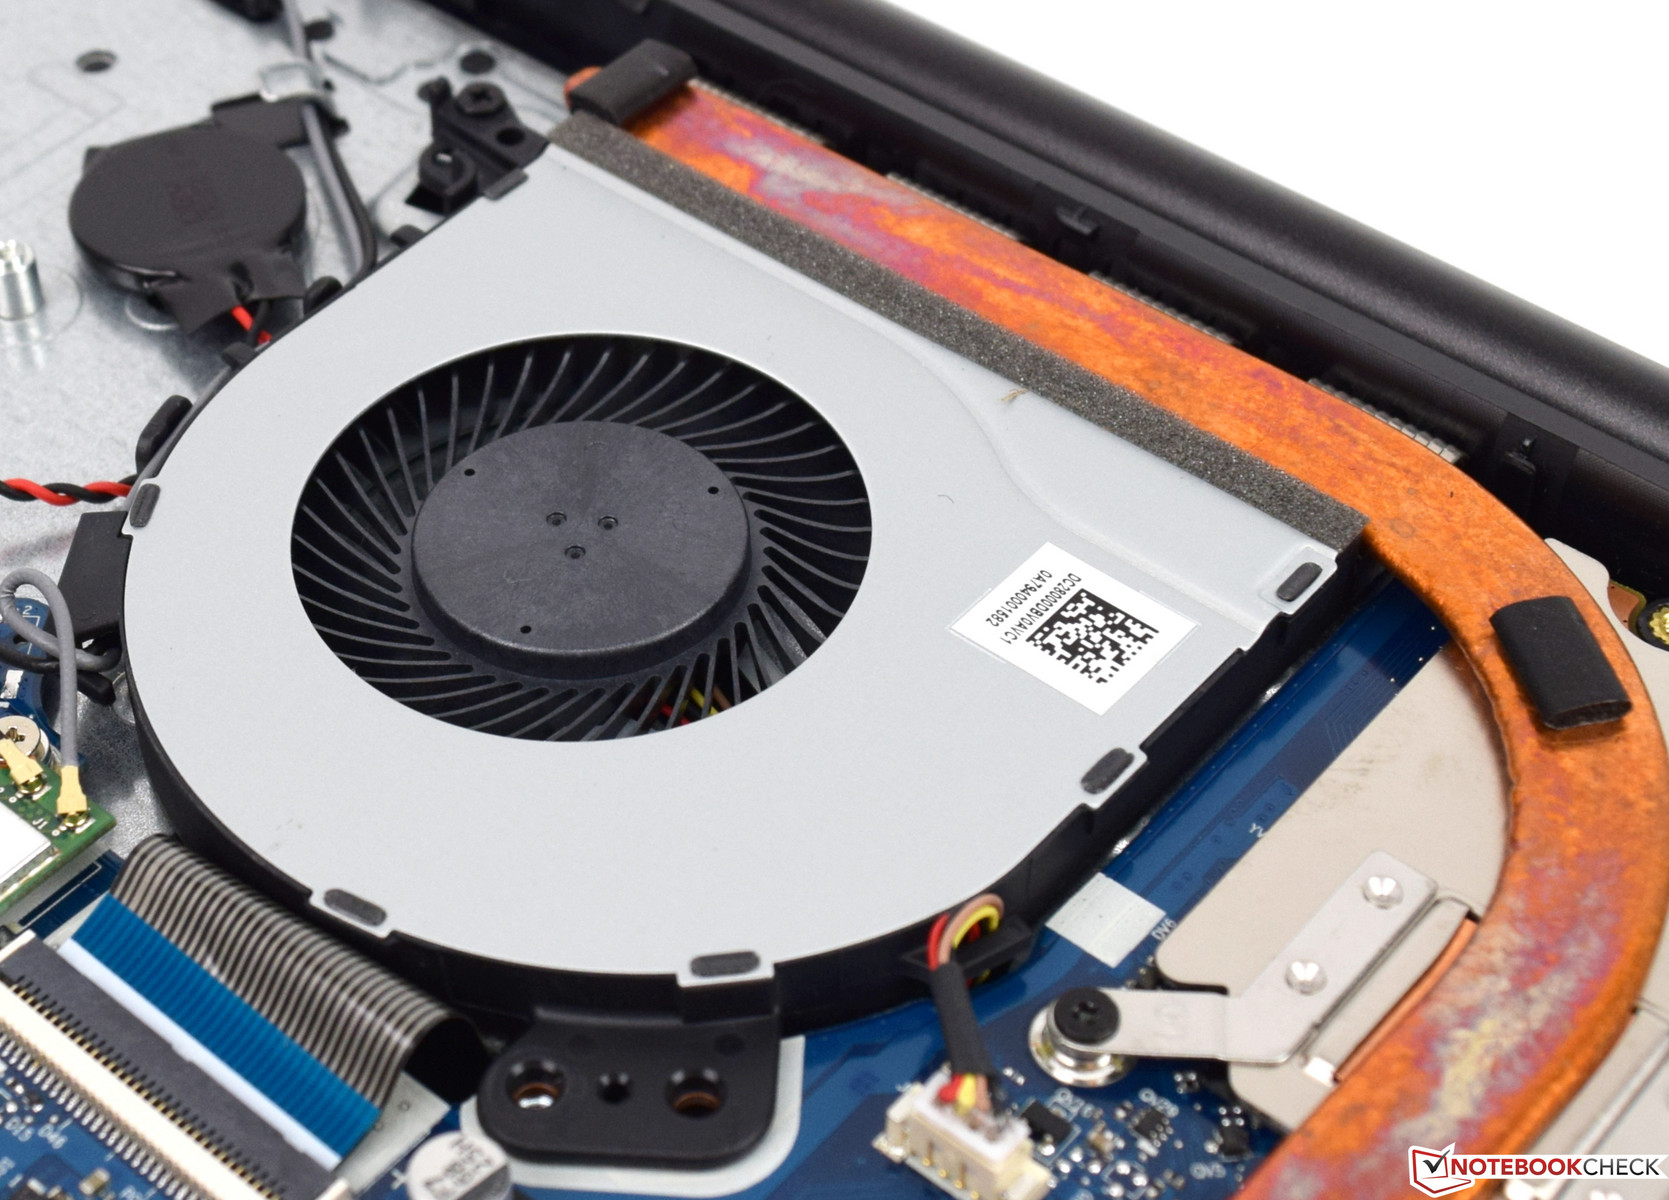
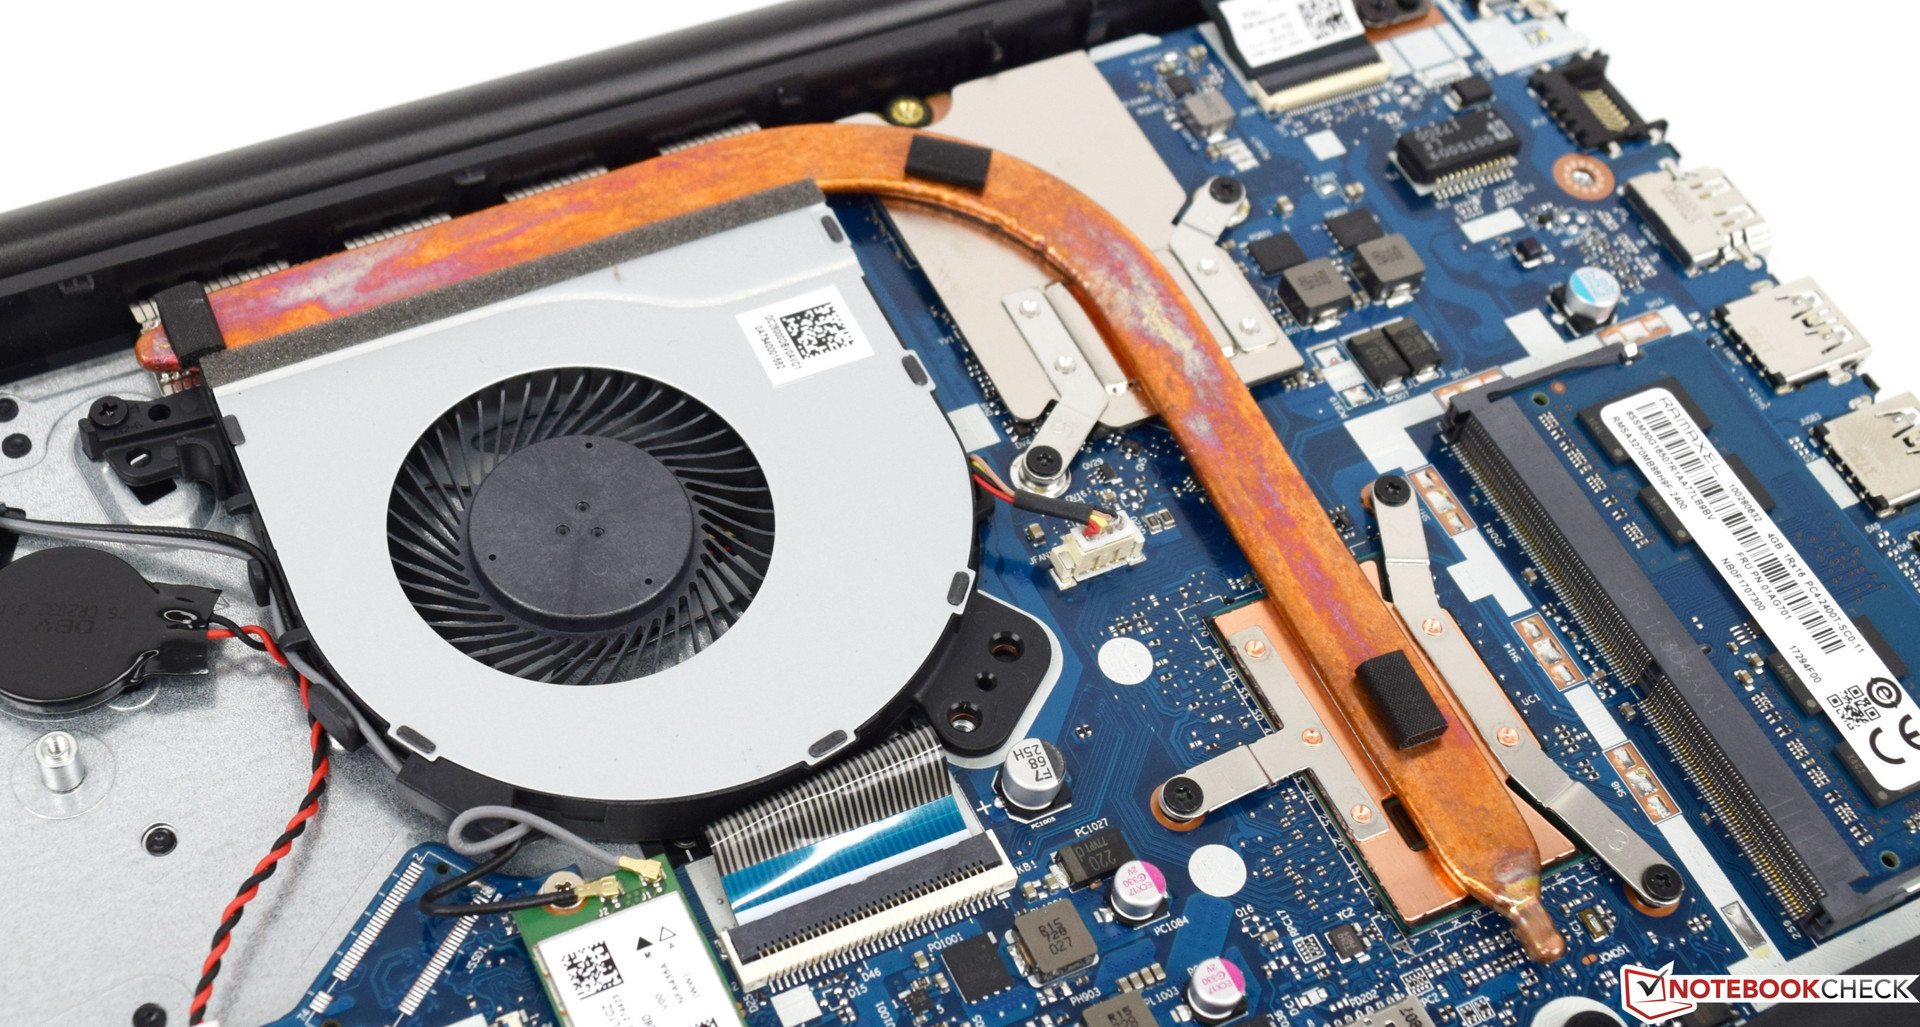
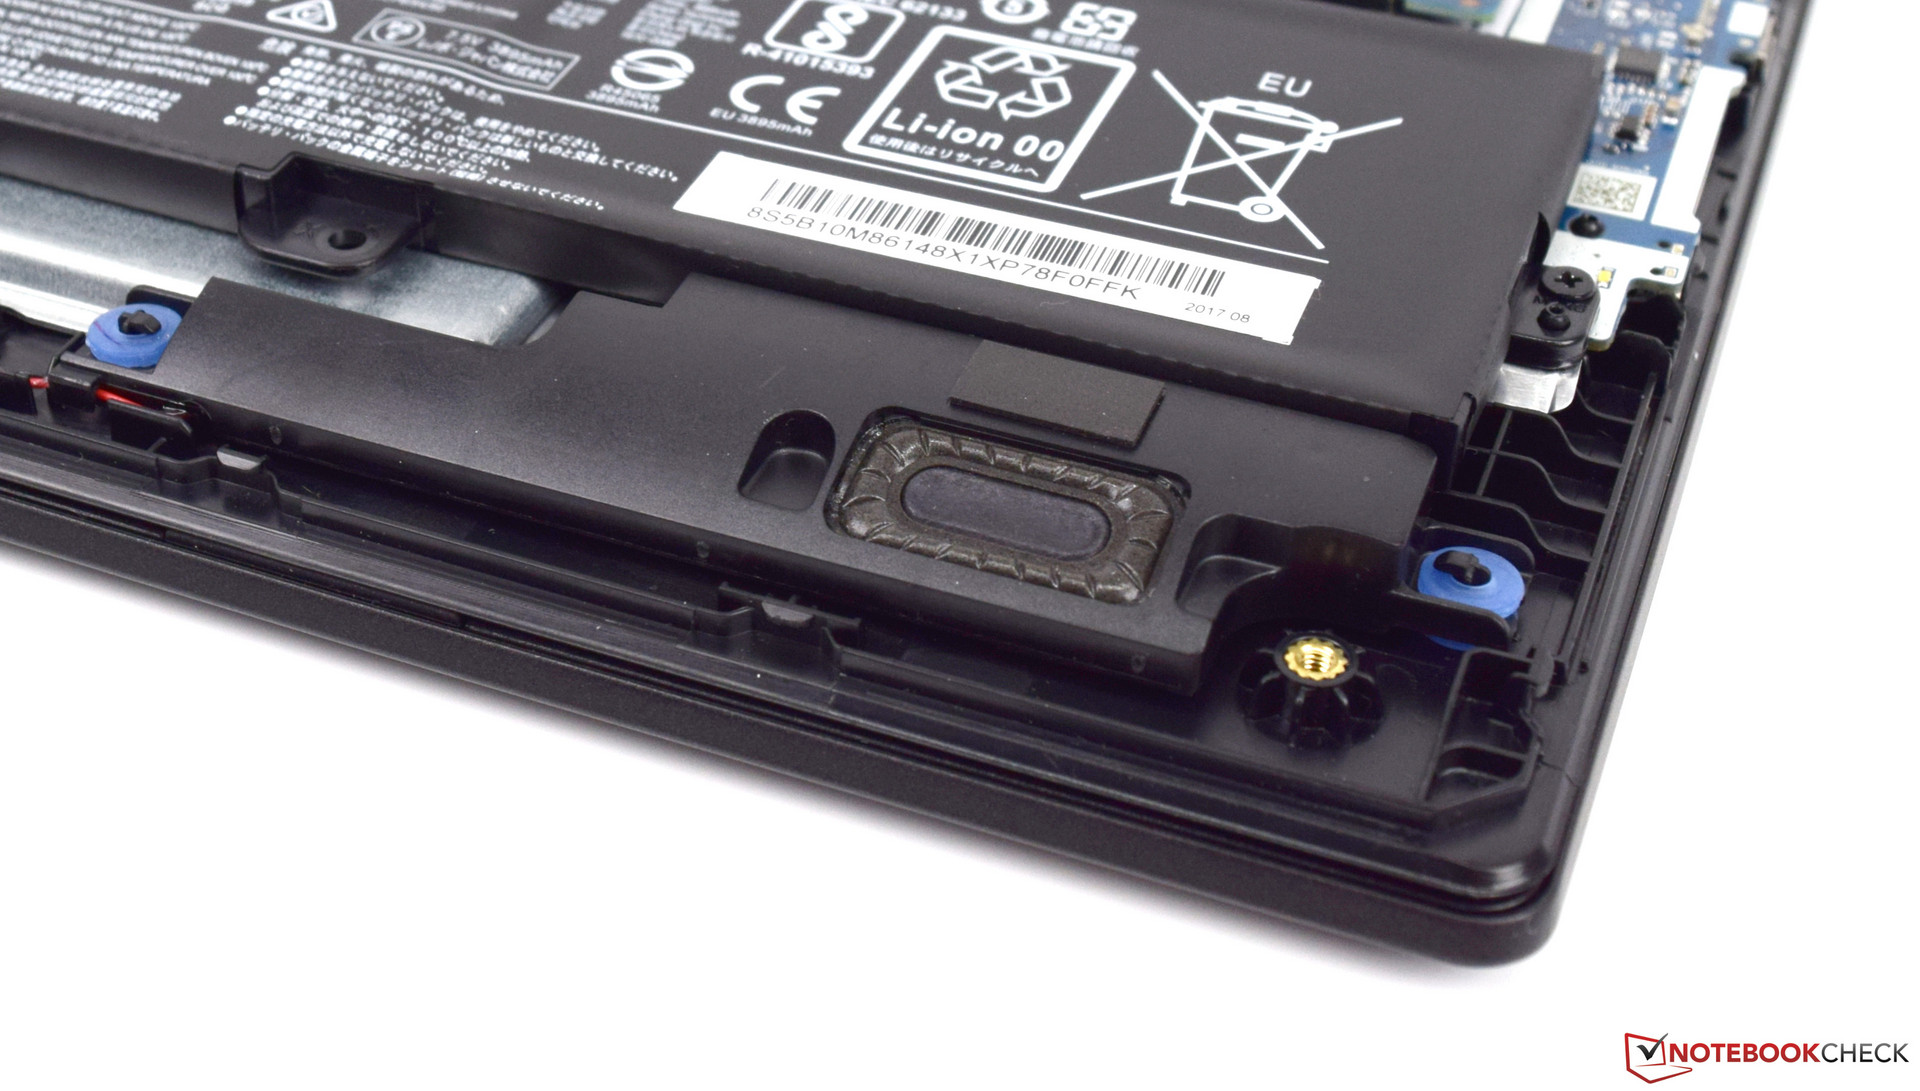
O SSD é uma boa adição que não retarda o sistema desnecessariamente. No entanto, se você não for cuidadoso, não poderá adicionar uma unidade adicional. Se você comprar a configuração com uma combinação de SSD e HD, será recompensado com um slot M.2 adicional. Isso foi omitido em nosso dispositivo. O processador se desempenha bem e oferece uma melhoria notável sobre a versão anterior. O mesmo pode ser dito para a GeForce MX150, que pode ser comparada à GeForce GTX 950M. O fabricante poderia reconsiderar sua escolha de portas - esperávamos uma porta USB adicional, bem como uma porta USB tipo C que ofereça suporte a sinais Thunderbolt 3. Isso melhoraria significativamente a impressão geral deste dispositivo e expandiria sua área de uso.
À primeira vista, o Lenovo IdeaPad 320-15IKB parece ser um bom dispositivo completo. No entanto, a tela exige um grande compromisso.
Lenovo IdeaPad 320-15IKBRN 81BG001KGE
- 02/08/2018 v6 (old)
Sebastian Bade
Price comparison
