Breve Análise do Portátil Lenovo ThinkPad A285 (Ryzen 5 Pro, Vega 8, FHD)


| SD Card Reader | |
| average JPG Copy Test (av. of 3 runs) | |
| Dell Latitude 7390 (Toshiba Exceria Pro M501) | |
| Fujitsu Lifebook U938 (Toshiba Exceria Pro SDXC 64 GB UHS-II) | |
| HP Envy 13-ah0003ng (Toshiba Exceria Pro M501 microSDXC 64GB) | |
| Lenovo ThinkPad X280-20KES01S00 (Toshiba Excerie Pro M501) | |
| Média da turma Subnotebook (23.7 - 188, n=9, últimos 2 anos) | |
| Lenovo ThinkPad A285-20MX0002GE (Toshiba Exceria Pro M501 64 GB UHS-II) | |
| maximum AS SSD Seq Read Test (1GB) | |
| Dell Latitude 7390 (Toshiba Exceria Pro M501) | |
| Fujitsu Lifebook U938 (Toshiba Exceria Pro SDXC 64 GB UHS-II) | |
| Média da turma Subnotebook (24.9 - 195, n=8, últimos 2 anos) | |
| Lenovo ThinkPad A285-20MX0002GE (Toshiba Exceria Pro M501 64 GB UHS-II) | |
| Lenovo ThinkPad X280-20KES01S00 (Toshiba Excerie Pro M501) | |
| HP Envy 13-ah0003ng (Toshiba Exceria Pro M501 microSDXC 64GB) | |
| |||||||||||||||||||||||||
iluminação: 88 %
iluminação com acumulador: 349 cd/m²
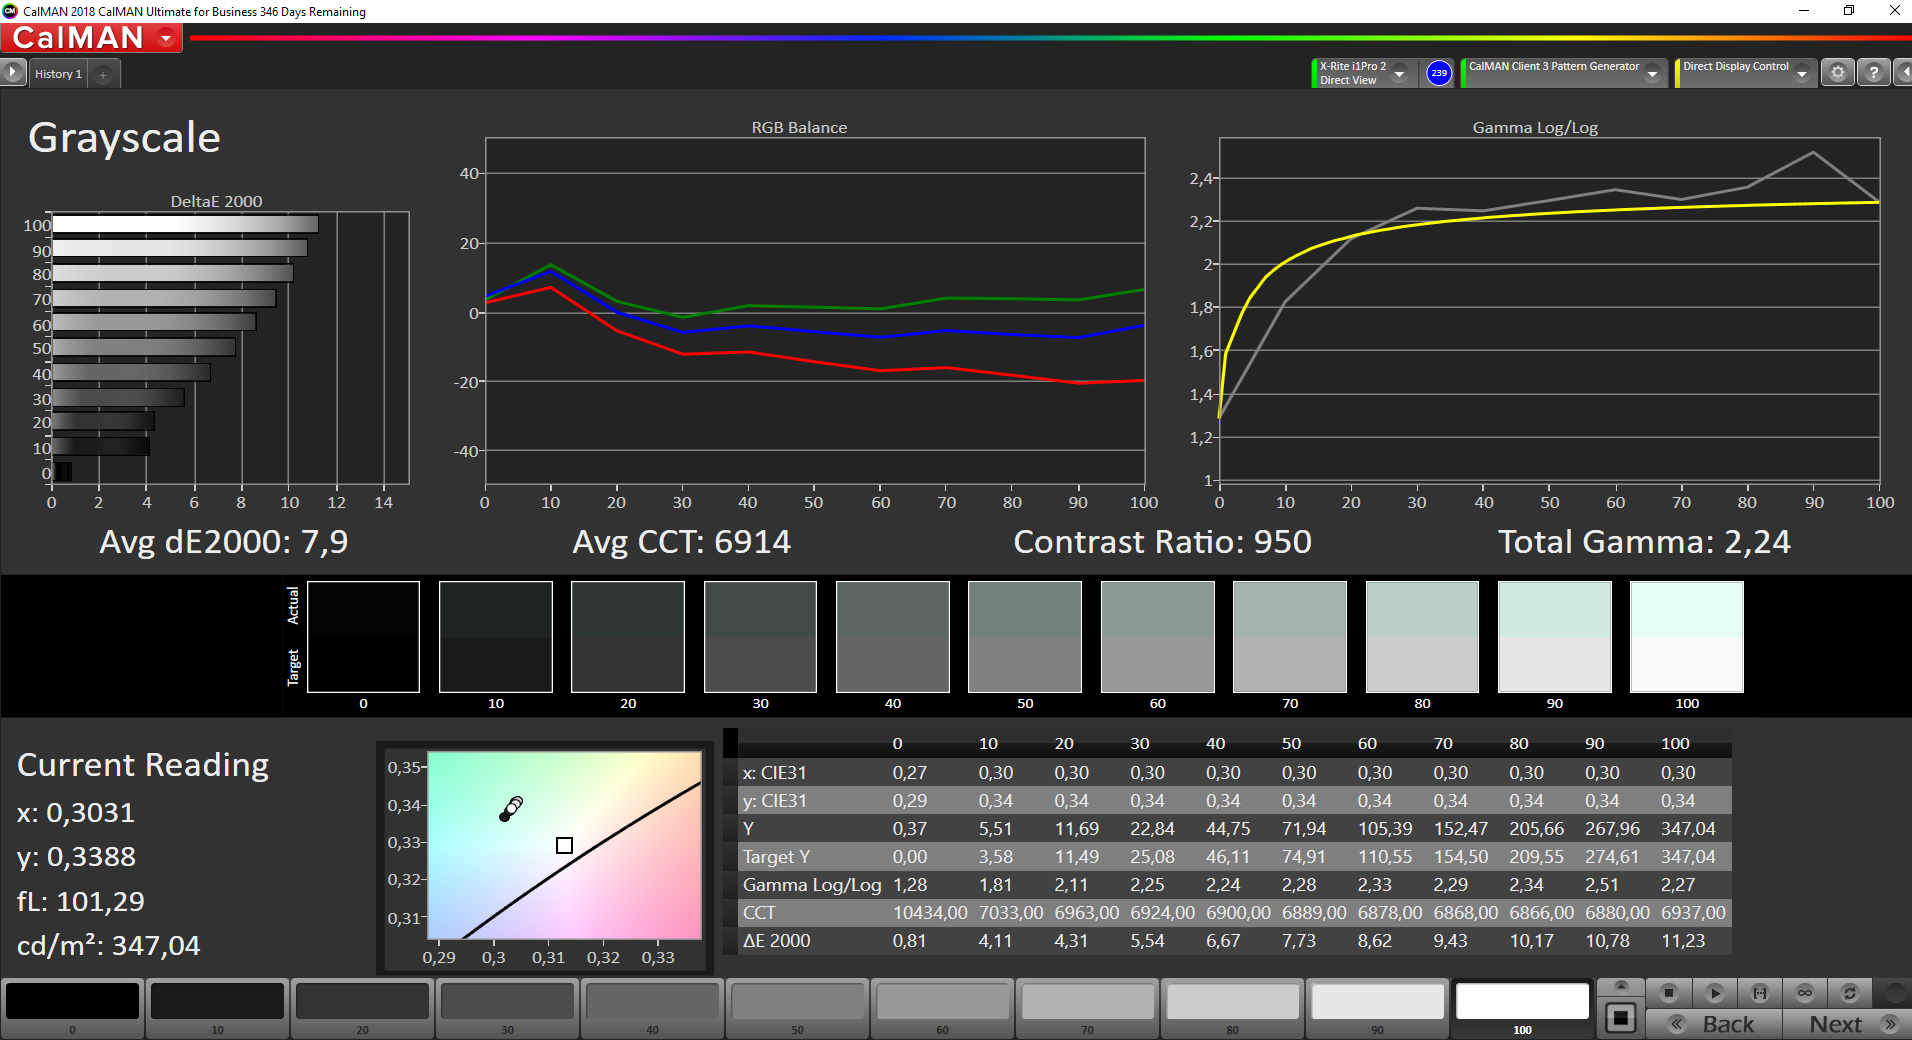
Contraste: 938:1 (Preto: 0.37 cd/m²)
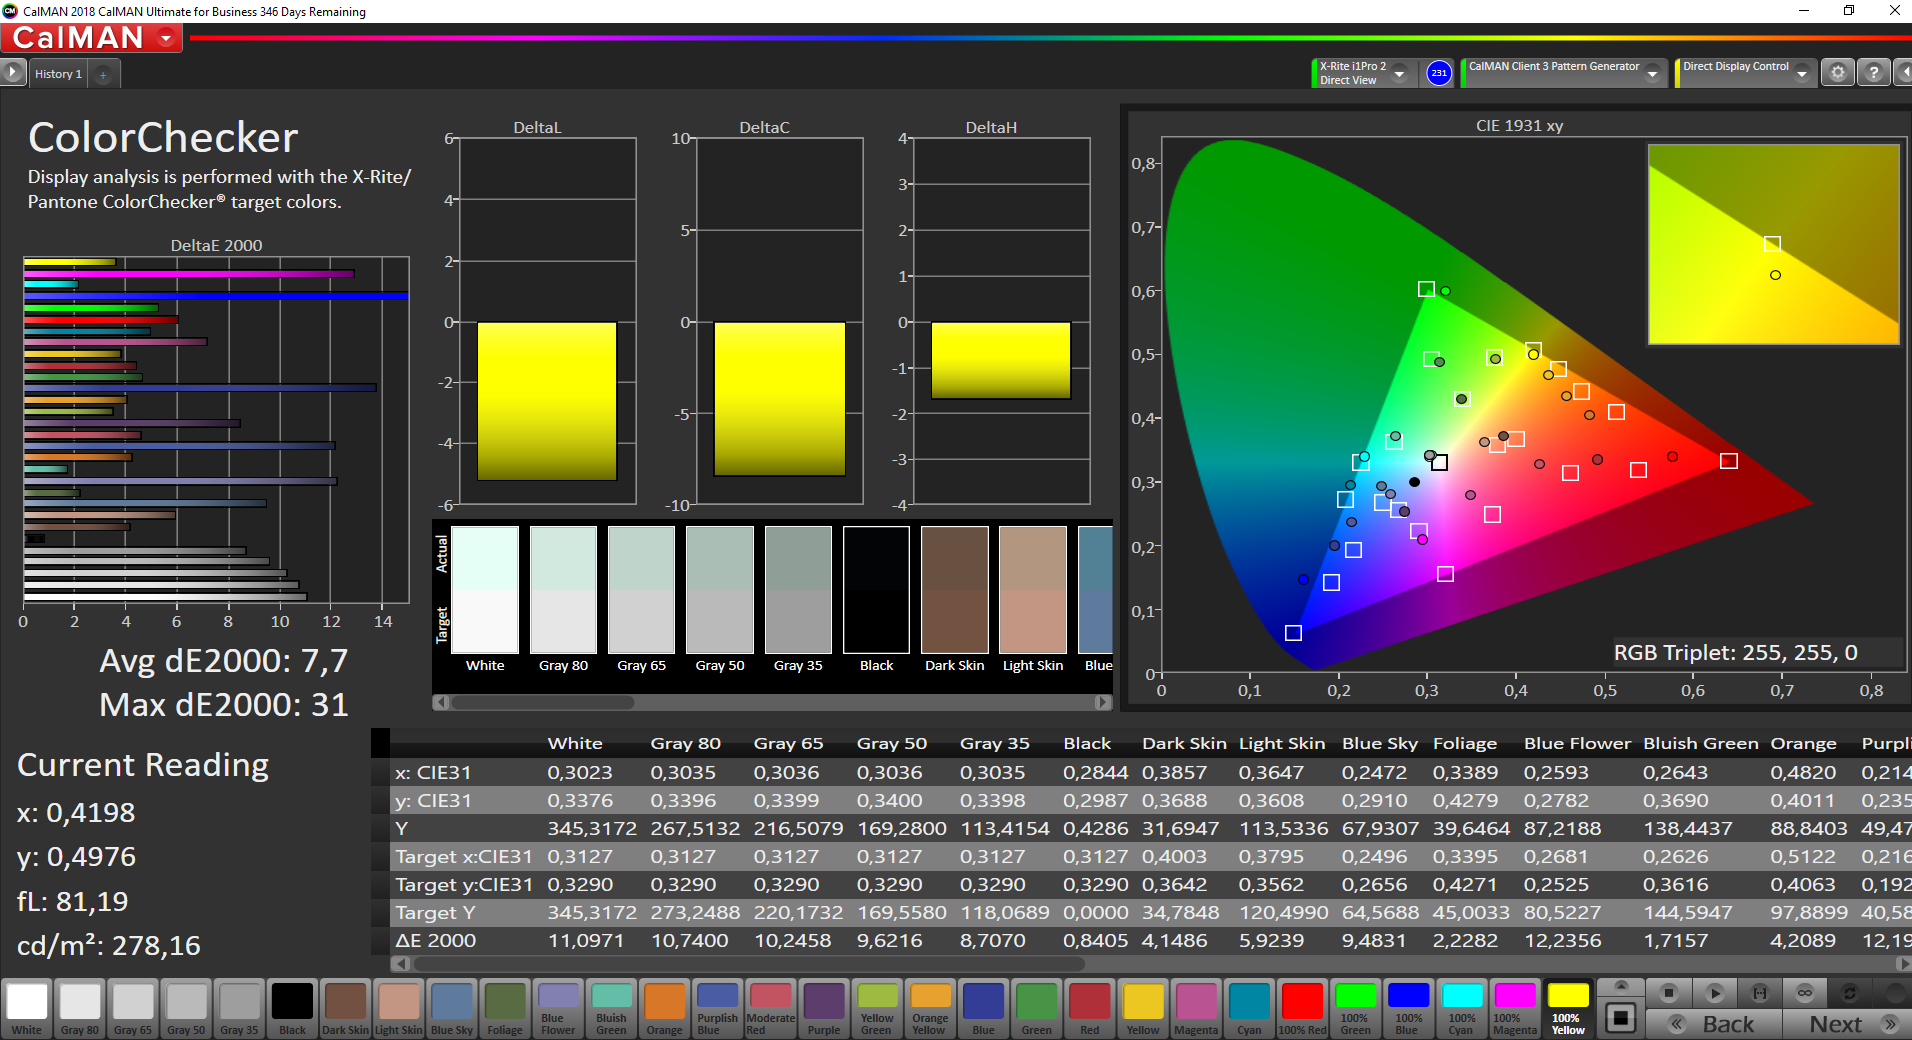
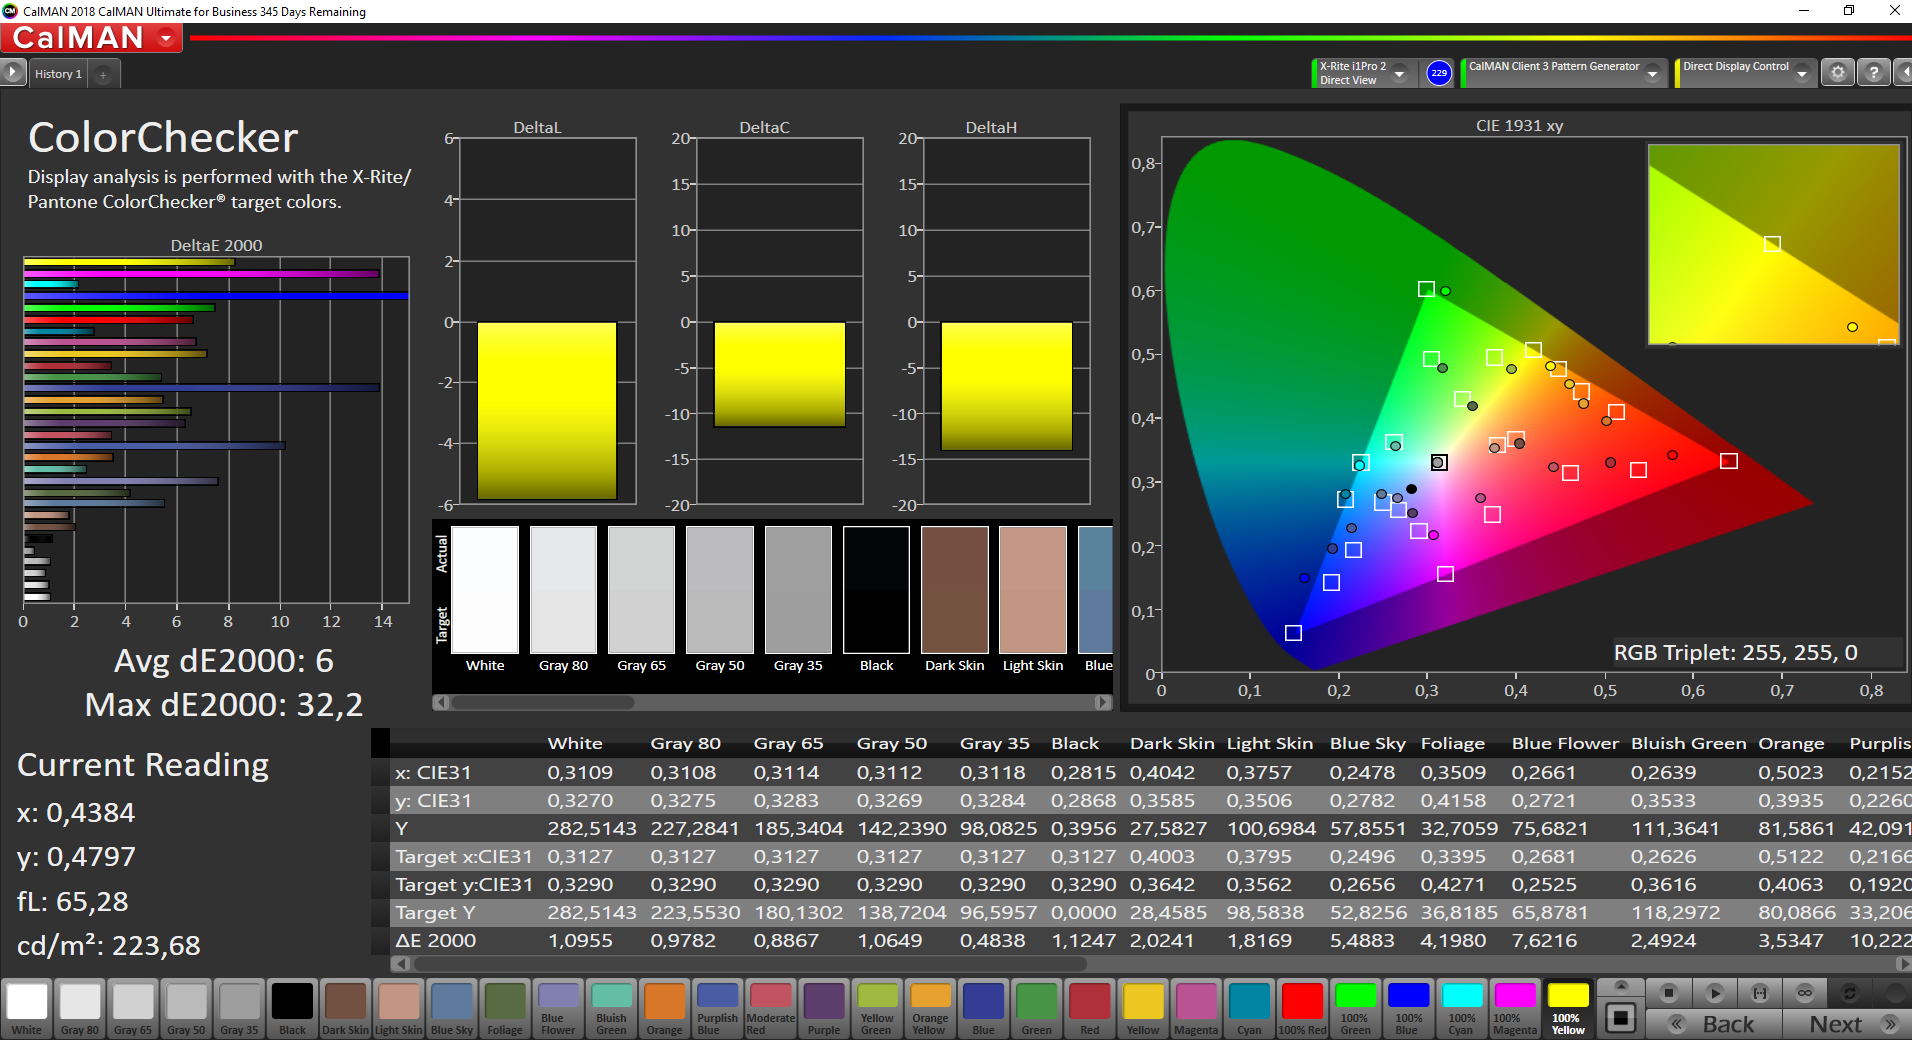
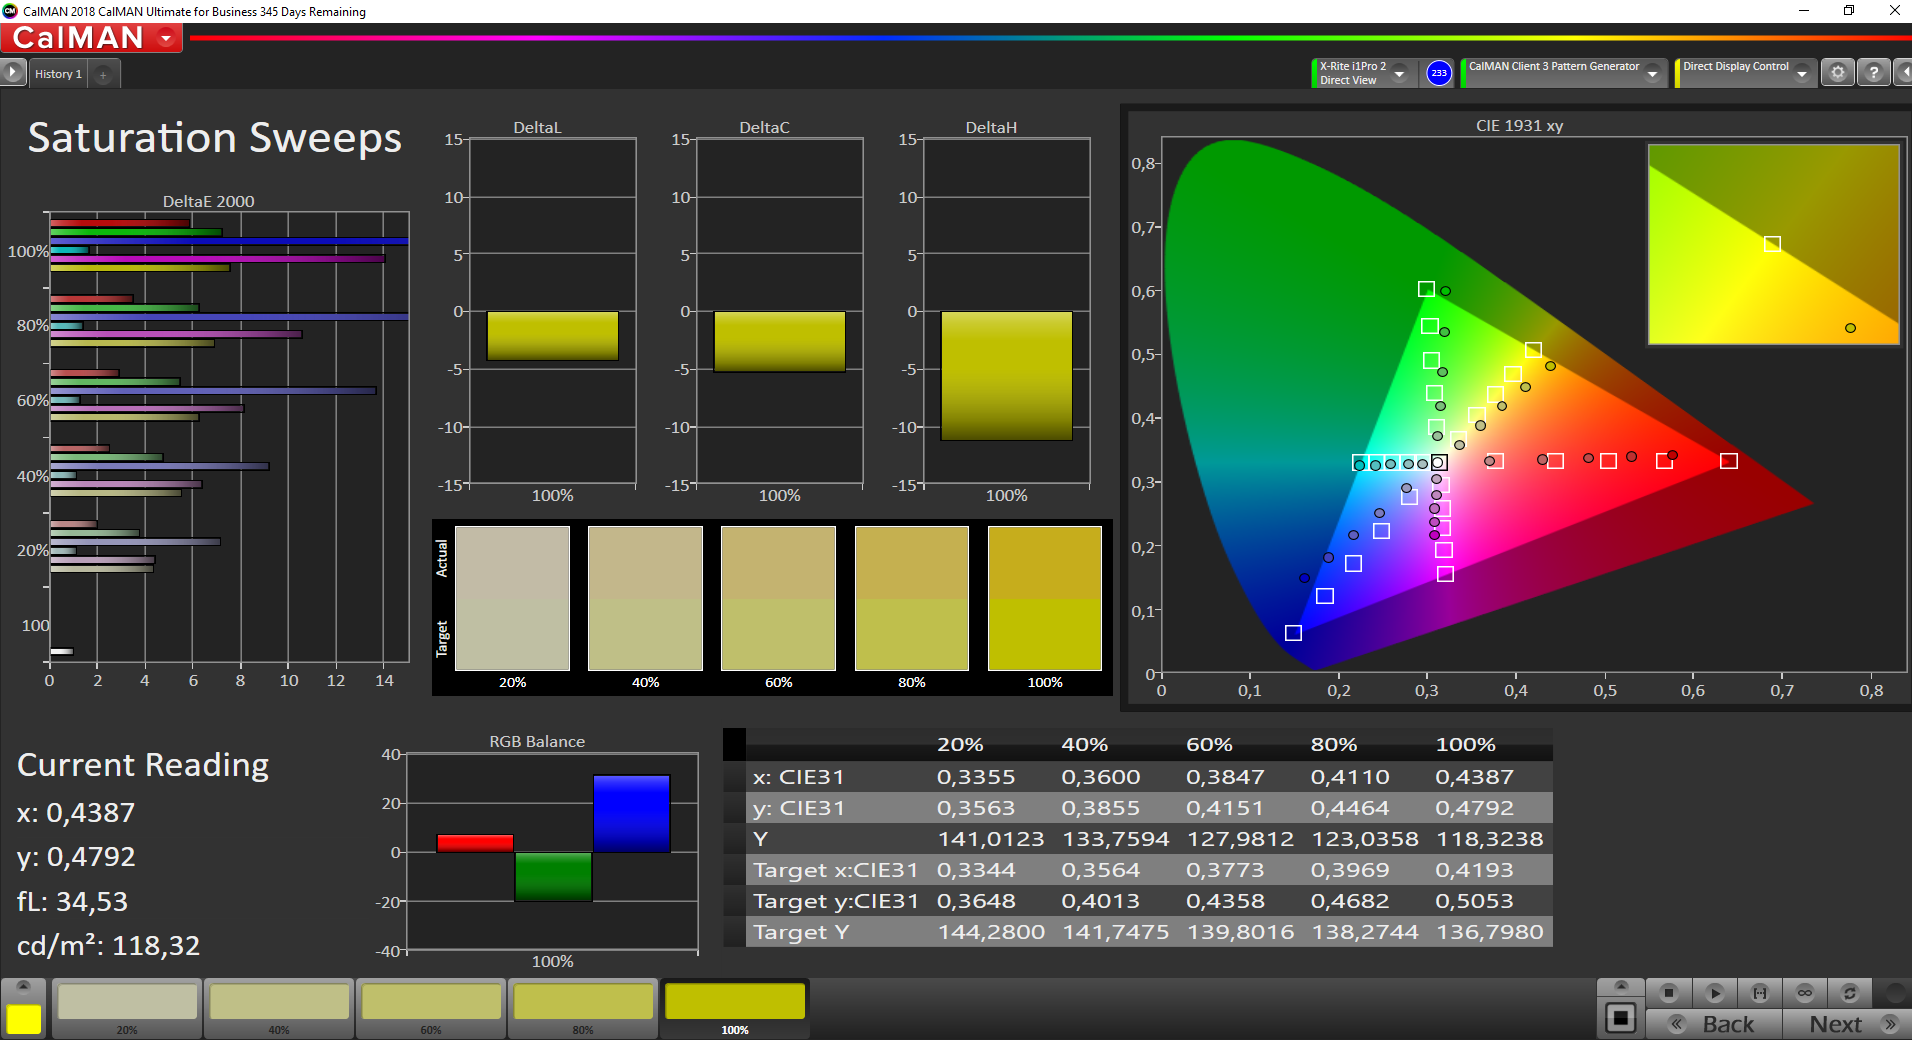
ΔE ColorChecker Calman: 7.7 | ∀{0.5-29.43 Ø4.71}
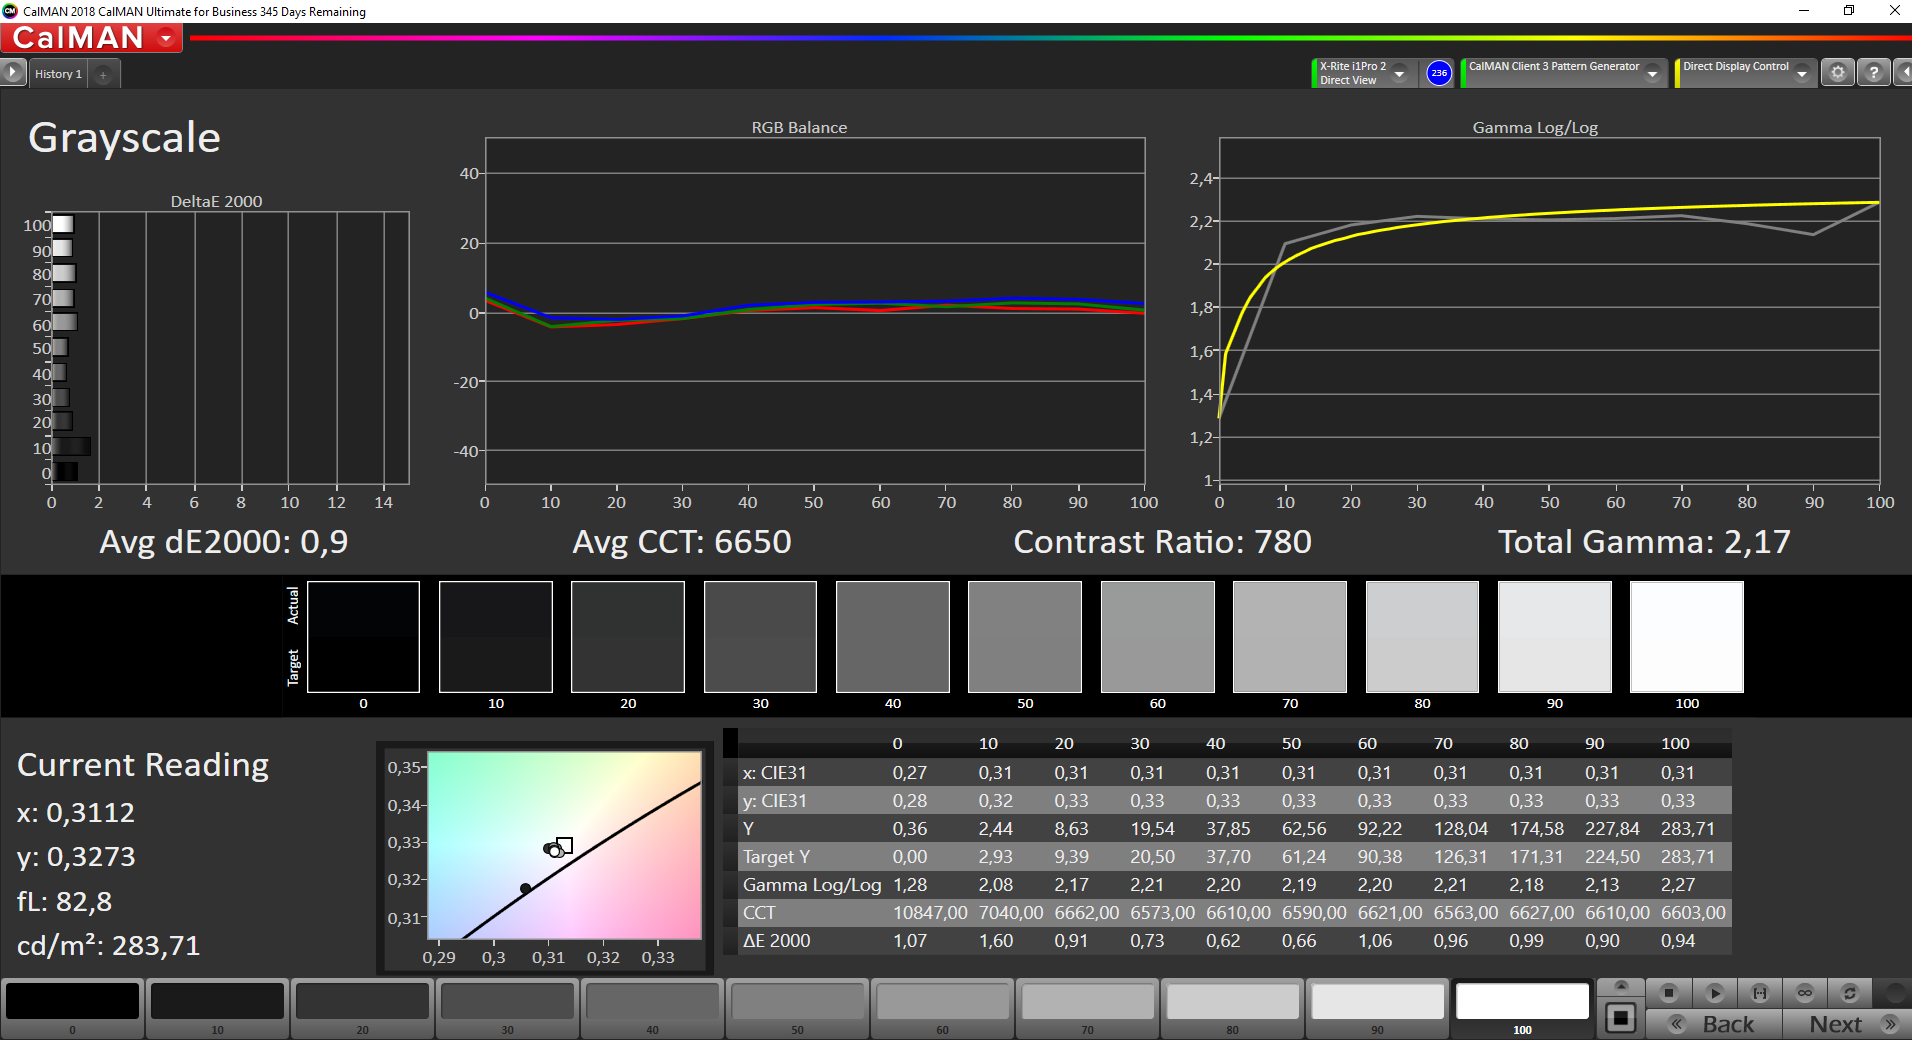
calibrated: 6
ΔE Greyscale Calman: 7.9 | ∀{0.09-98 Ø4.96}
64.9% sRGB (Argyll 1.6.3 3D)
42.2% AdobeRGB 1998 (Argyll 1.6.3 3D)
46.03% AdobeRGB 1998 (Argyll 3D)
65.4% sRGB (Argyll 3D)
44.51% Display P3 (Argyll 3D)
Gamma: 2.24
CCT: 6914 K
| Lenovo ThinkPad A285-20MX0002GE N125HCE-GN1, IPS LED, 1920x1080, 12.5" | Lenovo ThinkPad X280-20KES01S00 B125HAN02.2, IPS LED, 1920x1080, 12.5" | Dell Latitude 7390 AU Optronics AUO462D / B133HAN [DELL P/N:F7VDJ], IPS, 1920x1080, 13.3" | Fujitsu Lifebook U938 Sharp LQ133M1JW28, IPS, 1920x1080, 13.3" | HP Envy 13-ah0003ng M133NVF3 R0, IPS, 1920x1080, 13.3" | |
|---|---|---|---|---|---|
| Display | -1% | 43% | 48% | 24% | |
| Display P3 Coverage (%) | 44.51 | 44 -1% | 65.1 46% | 67.5 52% | 54.8 23% |
| sRGB Coverage (%) | 65.4 | 64.5 -1% | 90.8 39% | 94.5 44% | 82.5 26% |
| AdobeRGB 1998 Coverage (%) | 46.03 | 45.45 -1% | 65.9 43% | 68.7 49% | 56.6 23% |
| Response Times | 4% | -17% | 1% | 24% | |
| Response Time Grey 50% / Grey 80% * (ms) | 41 ? | 40 ? 2% | 48.8 ? -19% | 43 ? -5% | 31 ? 24% |
| Response Time Black / White * (ms) | 31 ? | 29.6 ? 5% | 35.2 ? -14% | 29 ? 6% | 24 ? 23% |
| PWM Frequency (Hz) | 25510 ? | 217 ? | 1000 ? | ||
| Screen | 21% | 35% | 32% | 39% | |
| Brightness middle (cd/m²) | 347 | 344 -1% | 329 -5% | 344 -1% | 289 -17% |
| Brightness (cd/m²) | 321 | 313 -2% | 316 -2% | 320 0% | 310 -3% |
| Brightness Distribution (%) | 88 | 82 -7% | 92 5% | 77 -12% | 85 -3% |
| Black Level * (cd/m²) | 0.37 | 0.25 32% | 0.25 32% | 0.31 16% | 0.23 38% |
| Contrast (:1) | 938 | 1376 47% | 1316 40% | 1110 18% | 1257 34% |
| Colorchecker dE 2000 * | 7.7 | 4.7 39% | 4.3 44% | 2.72 65% | 1.64 79% |
| Colorchecker dE 2000 max. * | 31 | 19.4 37% | 7.8 75% | 5.92 81% | 3.31 89% |
| Colorchecker dE 2000 calibrated * | 6 | 2.5 58% | 0.99 83% | ||
| Greyscale dE 2000 * | 7.9 | 2.2 72% | 3.6 54% | 2.74 65% | 1.71 78% |
| Gamma | 2.24 98% | 2.16 102% | 2.43 91% | 2.38 92% | 2.32 95% |
| CCT | 6914 94% | 6252 104% | 6928 94% | 6794 96% | 6291 103% |
| Color Space (Percent of AdobeRGB 1998) (%) | 42.2 | 41.2 -2% | 59.1 40% | 61 45% | 52 23% |
| Color Space (Percent of sRGB) (%) | 64.9 | 64.1 -1% | 90.6 40% | 94 45% | 82 26% |
| Média Total (Programa/Configurações) | 8% /
15% | 20% /
30% | 27% /
31% | 29% /
34% |
* ... menor é melhor
Exibir tempos de resposta
| ↔ Tempo de resposta preto para branco | ||
|---|---|---|
| 31 ms ... ascensão ↗ e queda ↘ combinadas | ↗ 16 ms ascensão | 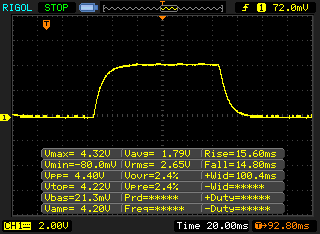 |
| ↘ 15 ms queda | ||
| A tela mostra taxas de resposta lentas em nossos testes e será insatisfatória para os jogadores. Em comparação, todos os dispositivos testados variam de 0.1 (mínimo) a 240 (máximo) ms. » 84 % de todos os dispositivos são melhores. Isso significa que o tempo de resposta medido é pior que a média de todos os dispositivos testados (19.8 ms). | ||
| ↔ Tempo de resposta 50% cinza a 80% cinza | ||
| 41 ms ... ascensão ↗ e queda ↘ combinadas | ↗ 22 ms ascensão | 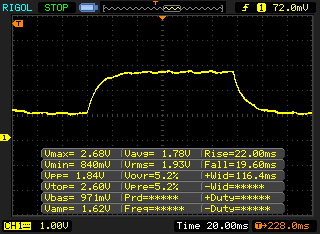 |
| ↘ 19 ms queda | ||
| A tela mostra taxas de resposta lentas em nossos testes e será insatisfatória para os jogadores. Em comparação, todos os dispositivos testados variam de 0.165 (mínimo) a 636 (máximo) ms. » 65 % de todos os dispositivos são melhores. Isso significa que o tempo de resposta medido é pior que a média de todos os dispositivos testados (30.9 ms). | ||
Cintilação da tela / PWM (modulação por largura de pulso)
| Tela tremeluzindo/PWM detectado | 25510 Hz | ≤ 50 % configuração de brilho | 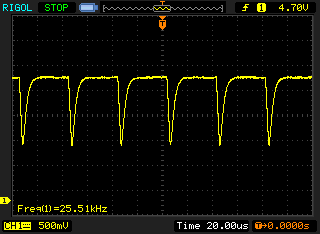 |
A luz de fundo da tela pisca em 25510 Hz (pior caso, por exemplo, utilizando PWM) Cintilação detectada em uma configuração de brilho de 50 % e abaixo. Não deve haver cintilação ou PWM acima desta configuração de brilho. A frequência de 25510 Hz é bastante alta, então a maioria dos usuários sensíveis ao PWM não deve notar nenhuma oscilação. [pwm_comparison] Em comparação: 52 % de todos os dispositivos testados não usam PWM para escurecer a tela. Se PWM foi detectado, uma média de 7744 (mínimo: 5 - máximo: 343500) Hz foi medida. | |||
* ... menor é melhor
| PCMark 8 Home Score Accelerated v2 | 3714 pontos | |
| PCMark 8 Creative Score Accelerated v2 | 4465 pontos | |
| PCMark 8 Work Score Accelerated v2 | 4650 pontos | |
| PCMark 10 Score | 3361 pontos | |
Ajuda | ||
| Lenovo ThinkPad A285-20MX0002GE Samsung SSD PM981 MZVLB256HAHQ | Lenovo ThinkPad X280-20KES01S00 Samsung SSD PM981 MZVLB512HAJQ | Dell Latitude 7390 SK hynix SC311 M.2 | Fujitsu Lifebook U938 Micron 1100 MTFDDAV256TBN | HP Envy 13-ah0003ng SK Hynix BC501 HFM512GDJTNG | Média Samsung SSD PM981 MZVLB256HAHQ | |
|---|---|---|---|---|---|---|
| AS SSD | 22% | -60% | -63% | -26% | -6% | |
| Seq Read (MB/s) | 2483 | 2316 -7% | 485.5 -80% | 455.5 -82% | 494.3 -80% | 2032 ? -18% |
| Seq Write (MB/s) | 1315 | 1385 5% | 369.9 -72% | 364.5 -72% | 720 -45% | 1339 ? 2% |
| 4K Read (MB/s) | 43.16 | 47.2 9% | 27.31 -37% | 24.41 -43% | 38.35 -11% | 46.1 ? 7% |
| 4K Write (MB/s) | 85.7 | 105.3 23% | 63.6 -26% | 73.8 -14% | 98.4 15% | 107.4 ? 25% |
| 4K-64 Read (MB/s) | 763 | 1218 60% | 282.8 -63% | 235.7 -69% | 611 -20% | 712 ? -7% |
| 4K-64 Write (MB/s) | 1067 | 1309 23% | 210.3 -80% | 308.8 -71% | 712 -33% | 999 ? -6% |
| Access Time Read * (ms) | 0.049 | 0.041 16% | 0.075 -53% | 0.099 -102% | 0.061 -24% | 0.07076 ? -44% |
| Access Time Write * (ms) | 0.042 | 0.036 14% | 0.056 -33% | 0.057 -36% | 0.037 12% | 0.04352 ? -4% |
| Score Read (Points) | 1052 | 1497 42% | 359 -66% | 306 -71% | 698 -34% | 961 ? -9% |
| Score Write (Points) | 1285 | 1553 21% | 311 -76% | 419 -67% | 883 -31% | 1240 ? -4% |
| Score Total (Points) | 2829 | 3774 33% | 857 -70% | 885 -69% | 1961 -31% | 2671 ? -6% |
* ... menor é melhor


| 3DMark 11 Performance | 3153 pontos | |
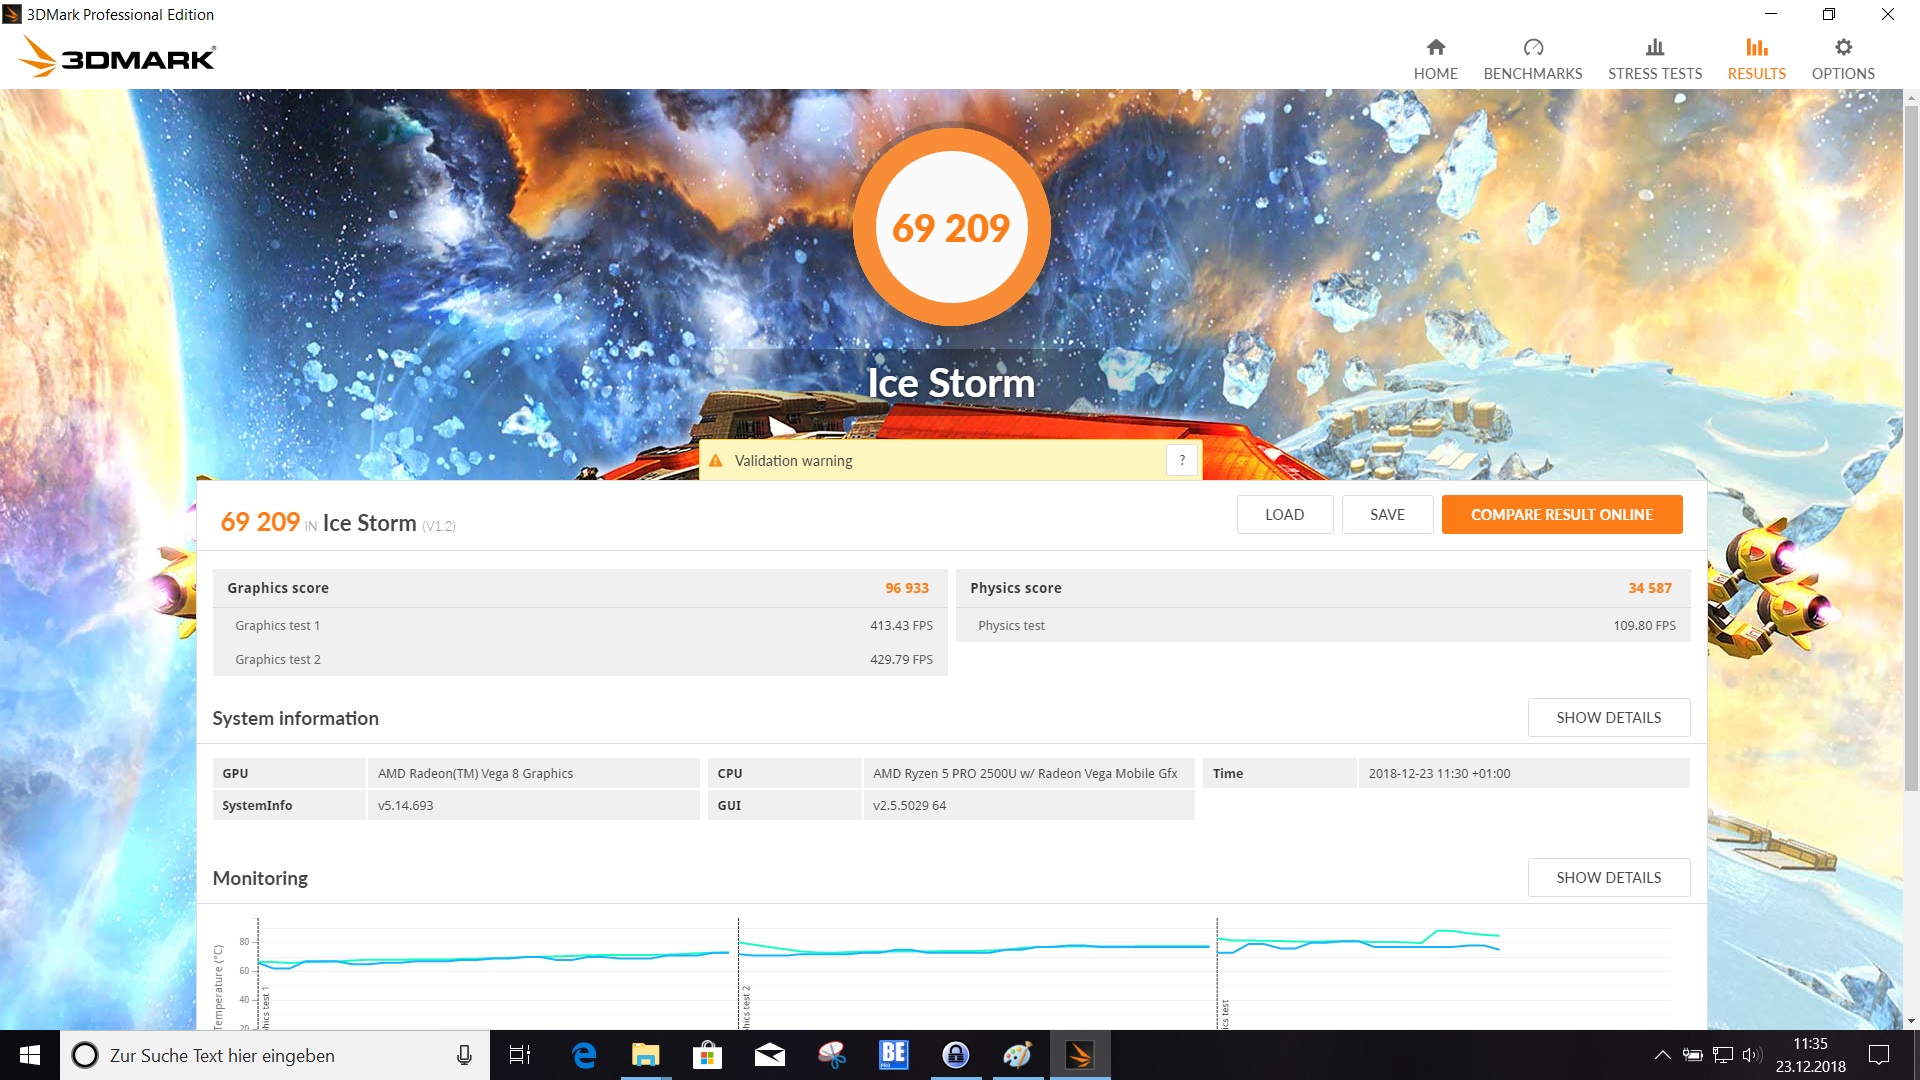
| 3DMark Ice Storm Standard Score | 69209 pontos | |
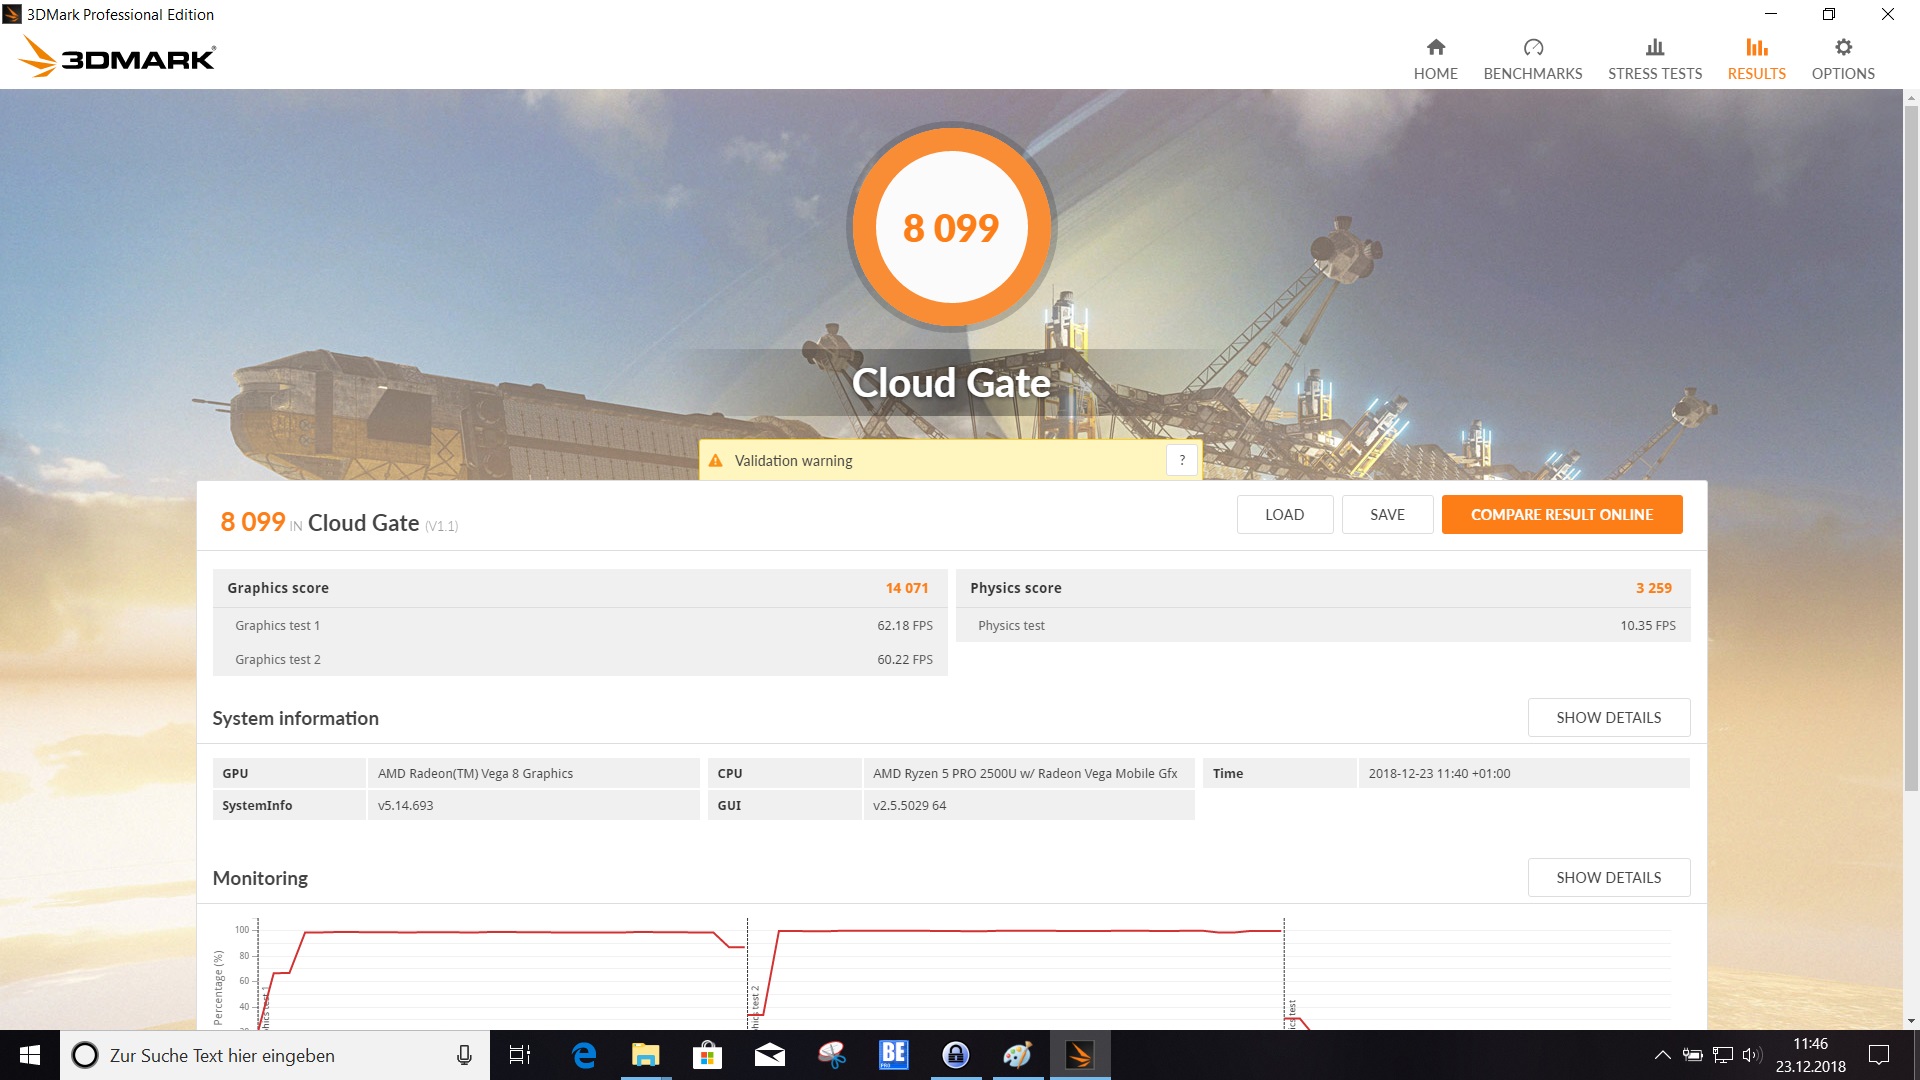
| 3DMark Cloud Gate Standard Score | 8099 pontos | |
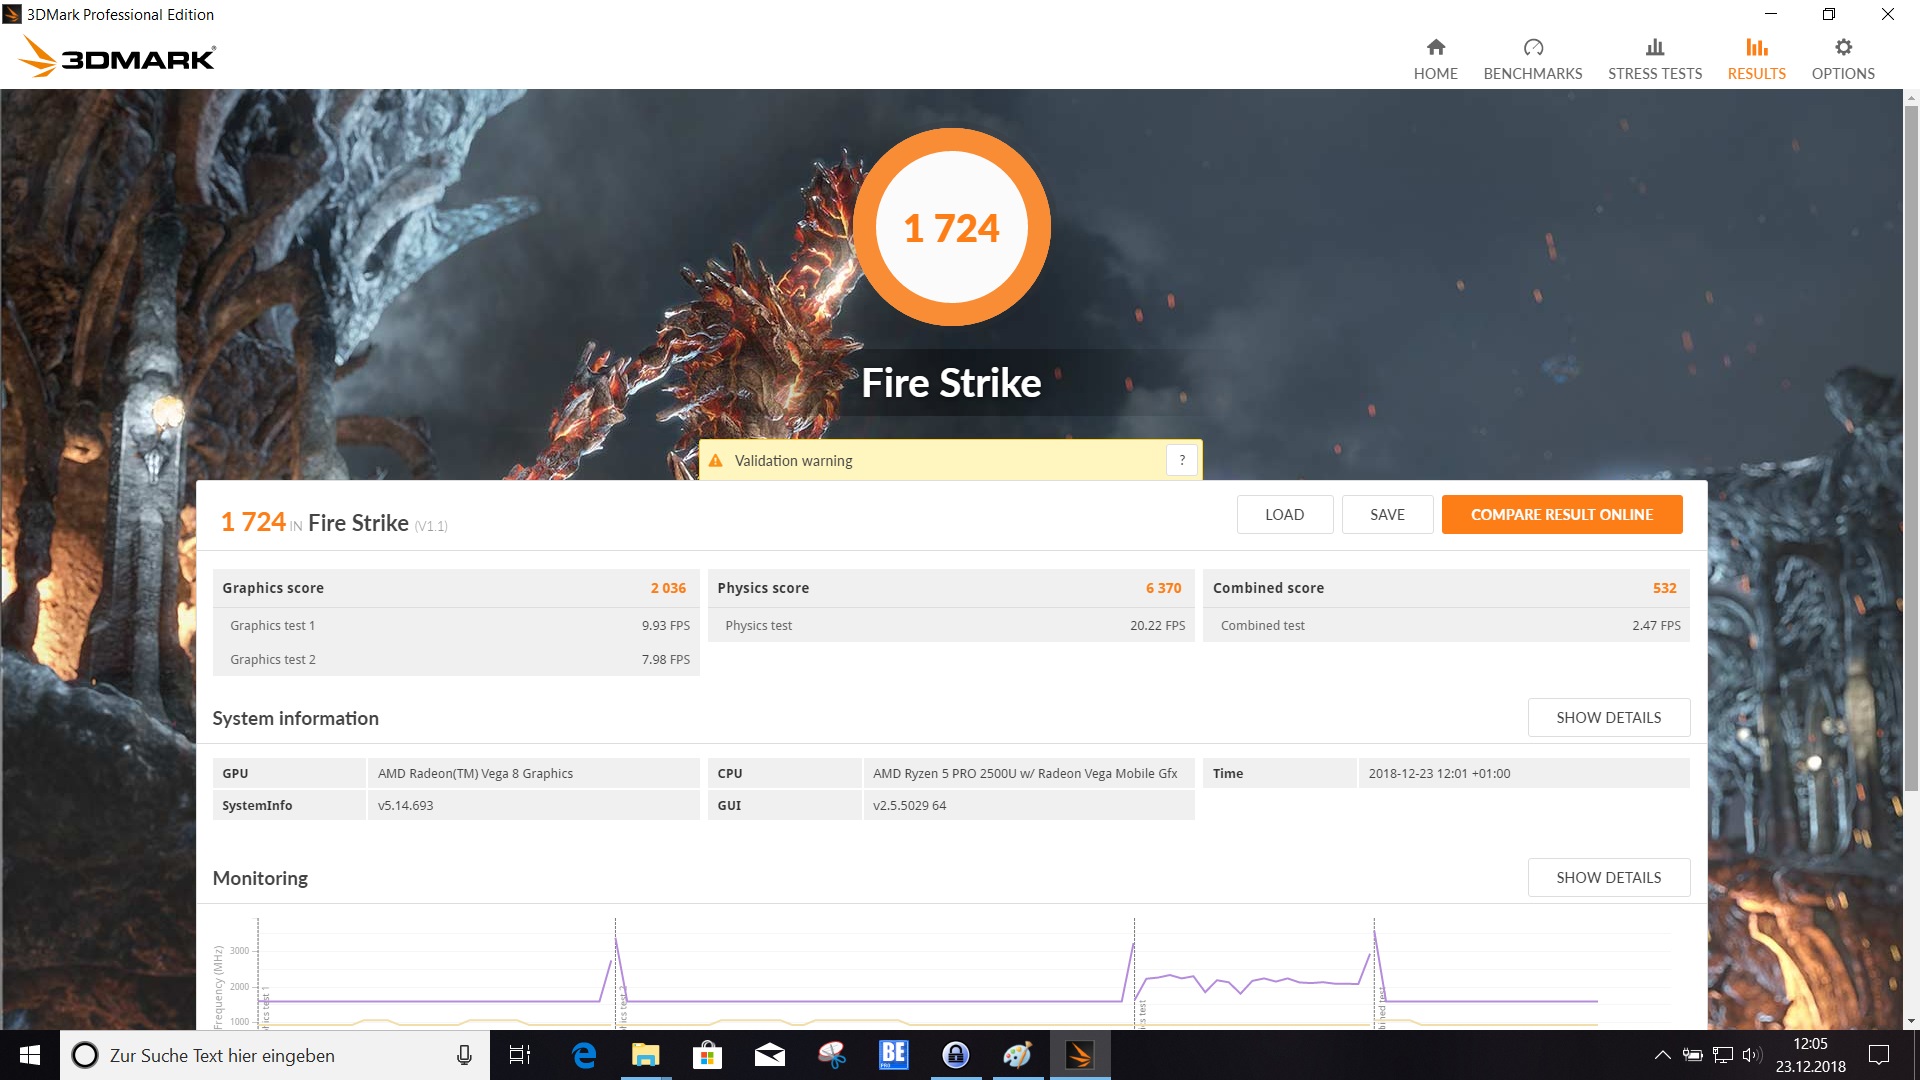
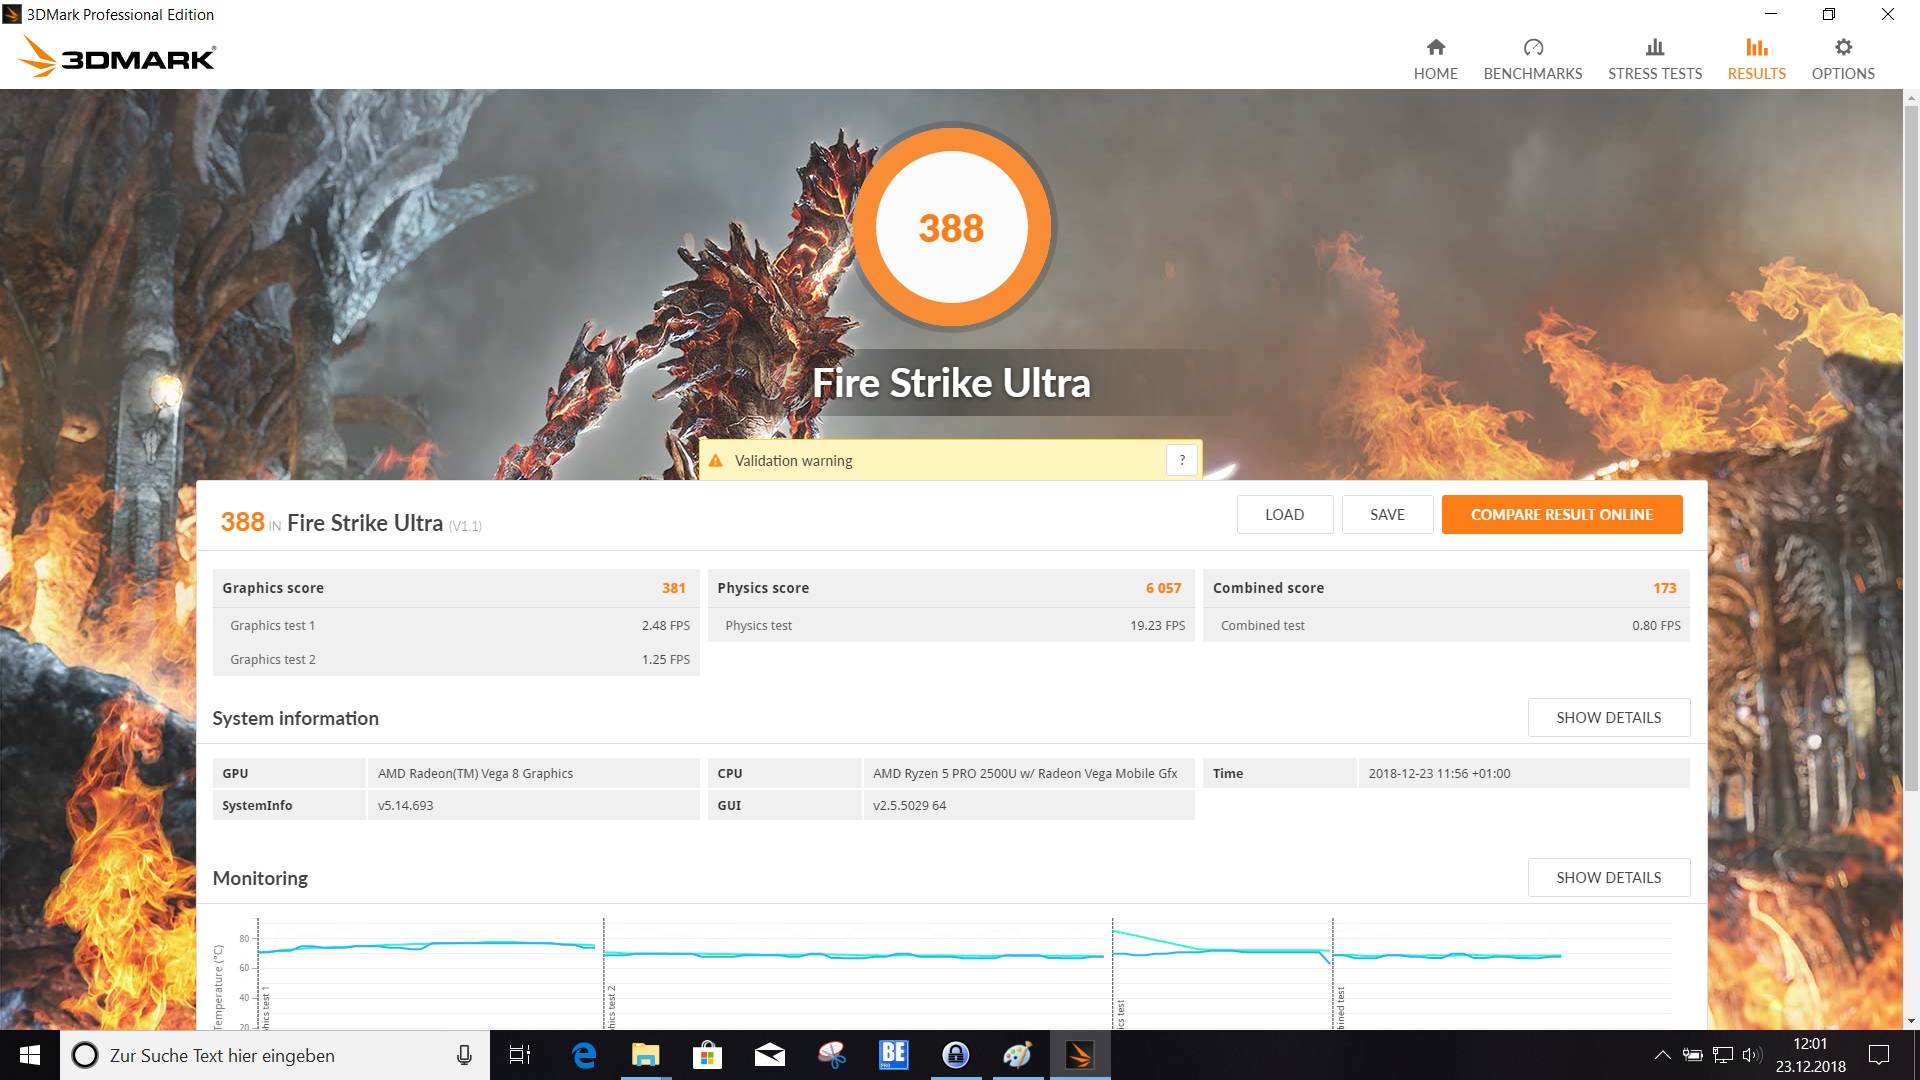
| 3DMark Fire Strike Score | 1724 pontos | |
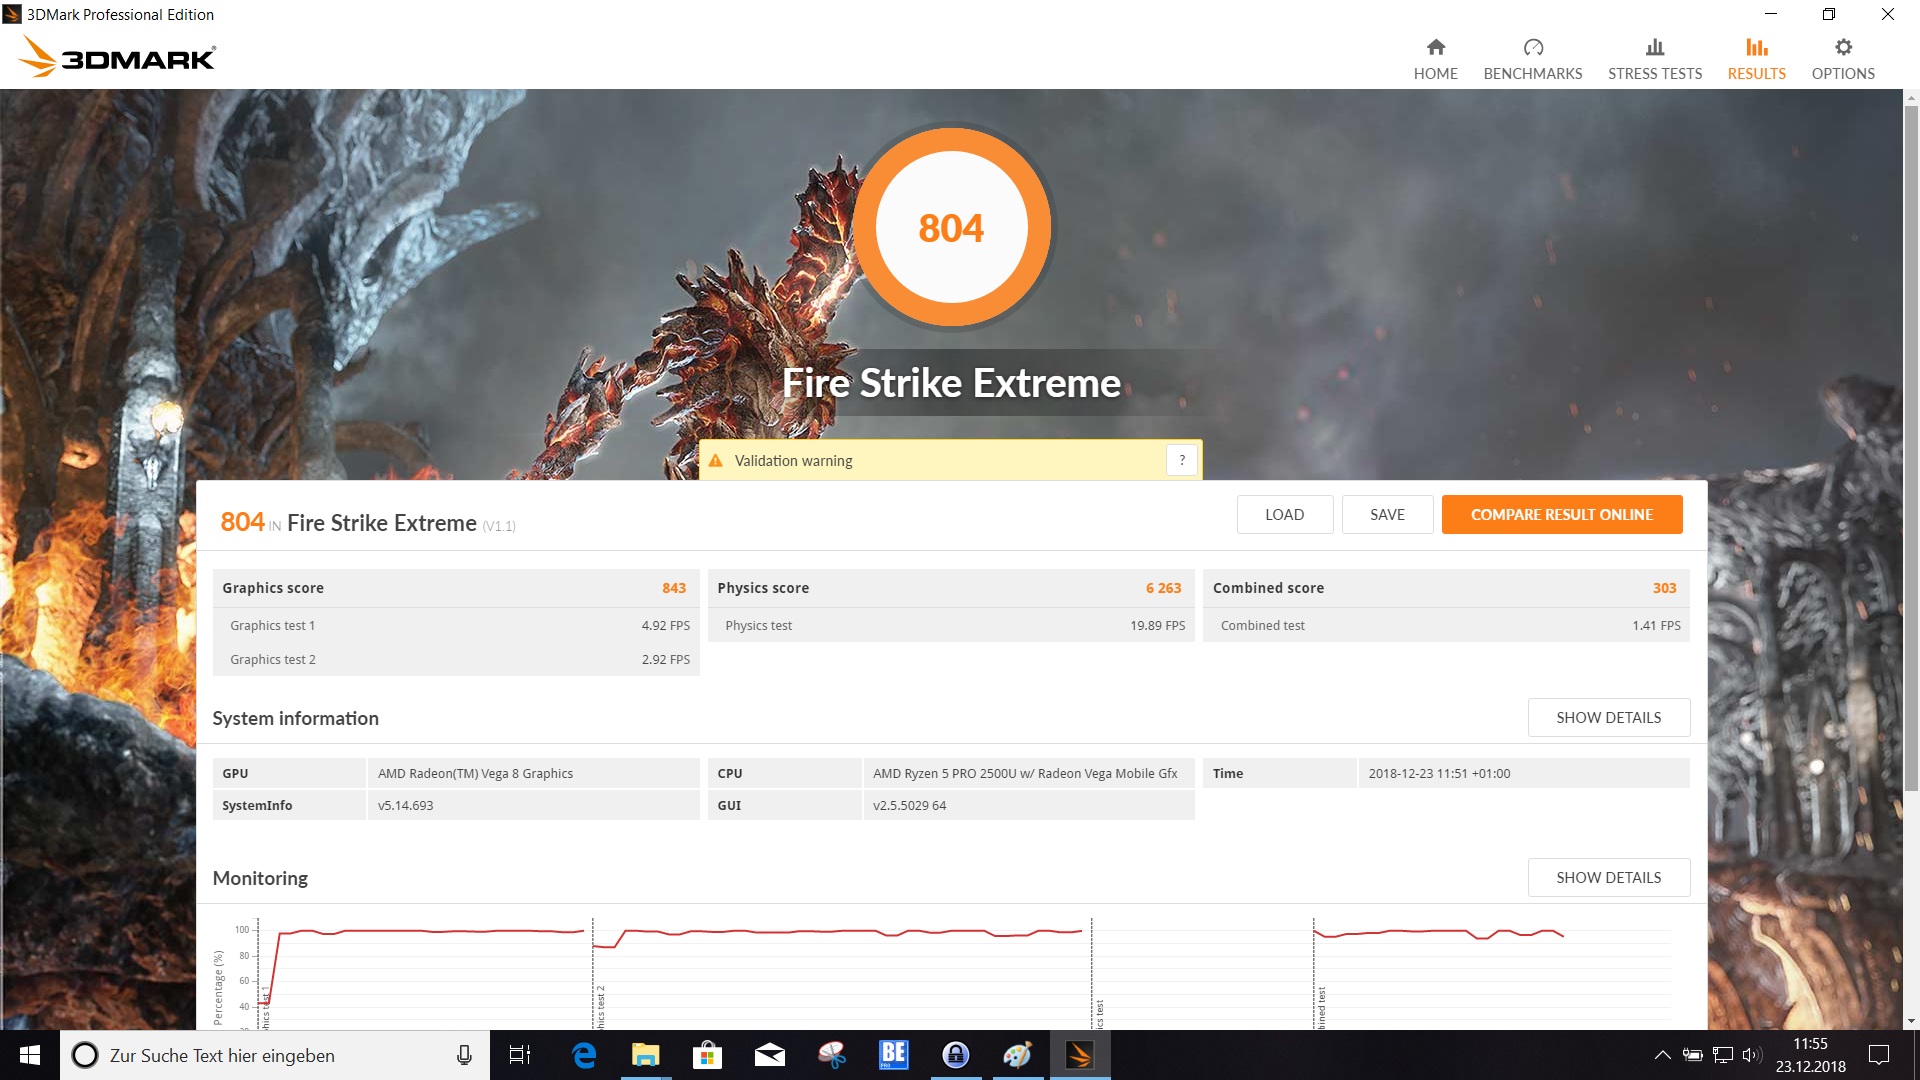
| 3DMark Fire Strike Extreme Score | 807 pontos | |
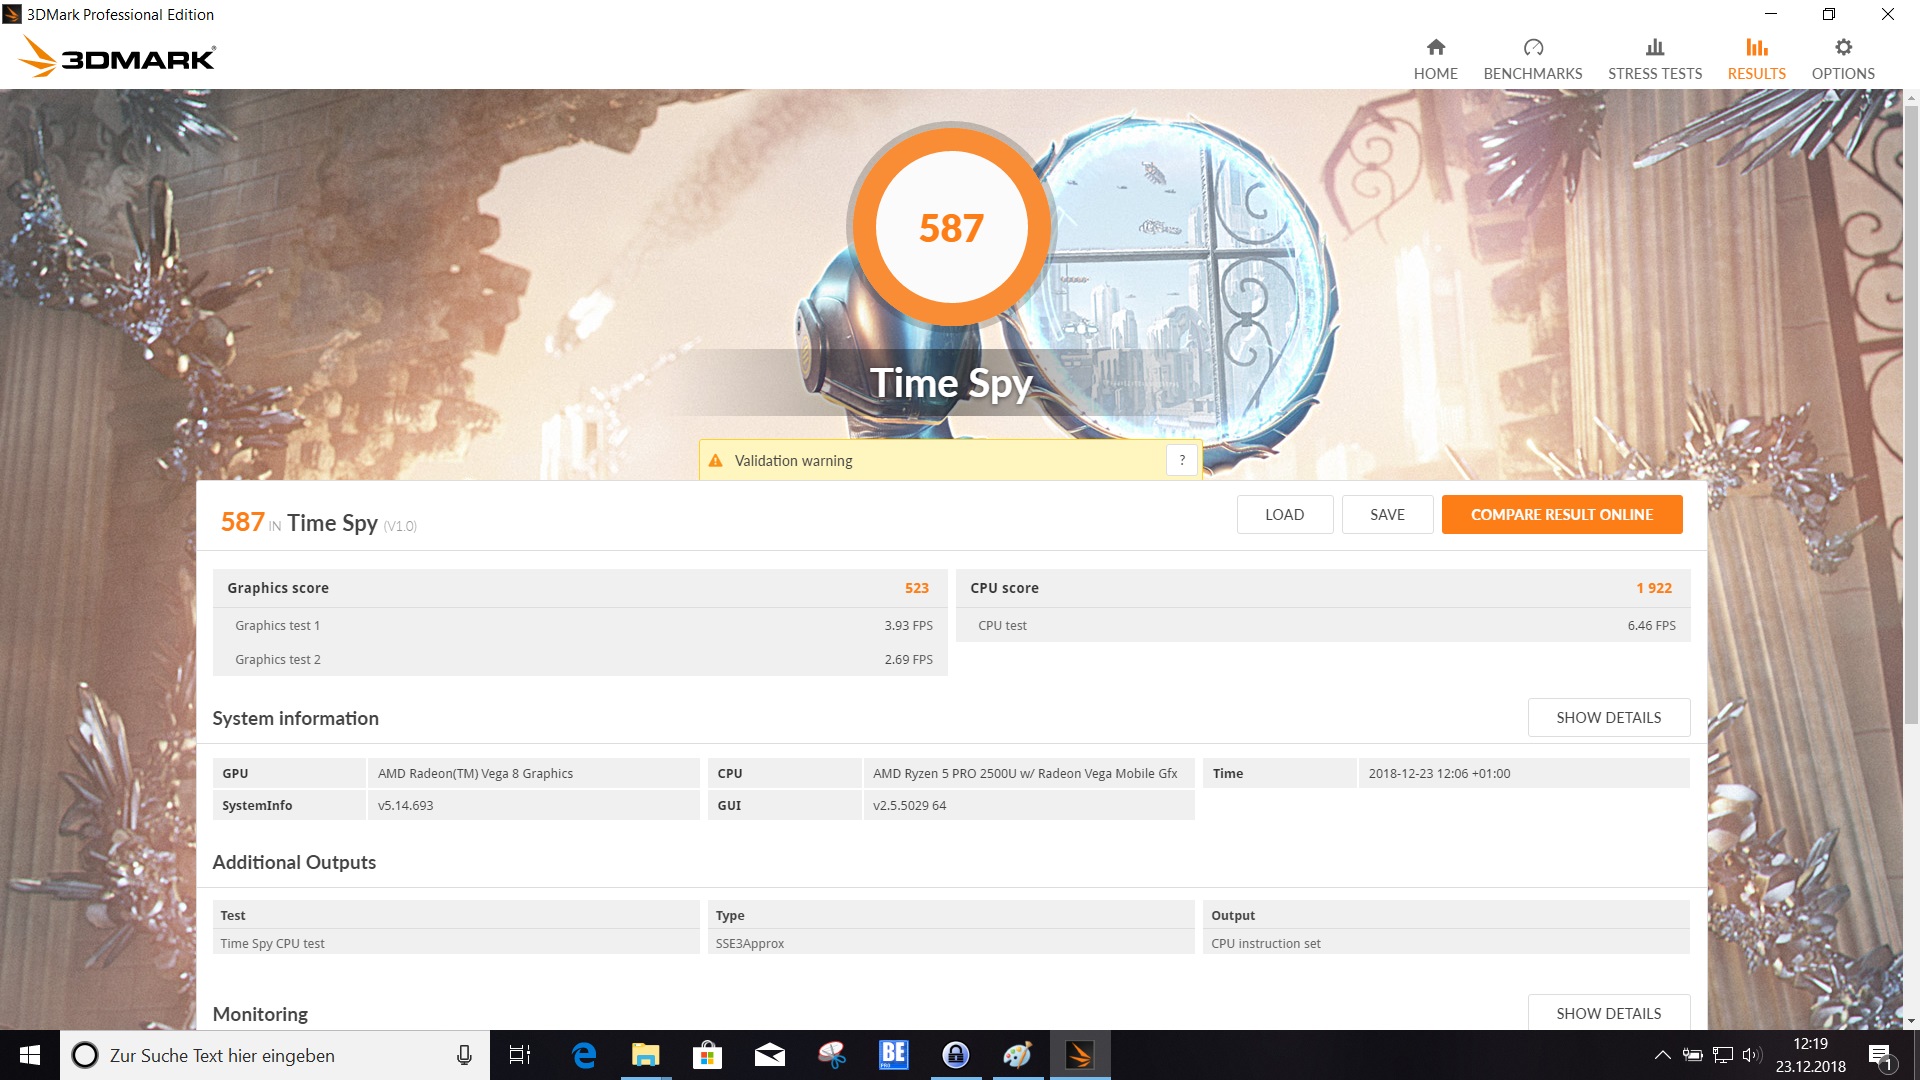
| 3DMark Time Spy Score | 587 pontos | |
Ajuda | ||
| baixo | média | alto | ultra | |
|---|---|---|---|---|
| BioShock Infinite (2013) | 103.1 | 17.2 | ||
| Rise of the Tomb Raider (2016) | 12.3 | |||
| Rocket League (2017) | 52.9 |
Barulho
| Ocioso |
| 28.9 / 28.9 / 28.9 dB |
| Carga |
| 31.2 / 31.2 dB |
 | ||
30 dB silencioso 40 dB(A) audível 50 dB(A) ruidosamente alto |
||
min: | ||
| Lenovo ThinkPad A285-20MX0002GE Vega 8, R5 PRO 2500U, Samsung SSD PM981 MZVLB256HAHQ | Lenovo ThinkPad X280-20KES01S00 UHD Graphics 620, i5-8250U, Samsung SSD PM981 MZVLB512HAJQ | Dell Latitude 7390 UHD Graphics 620, i5-8350U, SK hynix SC311 M.2 | Fujitsu Lifebook U938 UHD Graphics 620, i5-8250U, Micron 1100 MTFDDAV256TBN | HP Envy 13-ah0003ng GeForce MX150, i5-8550U, SK Hynix BC501 HFM512GDJTNG | |
|---|---|---|---|---|---|
| Noise | -10% | -7% | -6% | -12% | |
| desligado / ambiente * (dB) | 28.9 | 29.2 -1% | 29.5 -2% | 30.4 -5% | 30.3 -5% |
| Idle Minimum * (dB) | 28.9 | 29.2 -1% | 29.5 -2% | 30.4 -5% | 30.3 -5% |
| Idle Average * (dB) | 28.9 | 29.2 -1% | 29.5 -2% | 30.4 -5% | 30.3 -5% |
| Idle Maximum * (dB) | 28.9 | 29.2 -1% | 29.5 -2% | 30.4 -5% | 30.3 -5% |
| Load Average * (dB) | 31.2 | 39.7 -27% | 32.4 -4% | 33.7 -8% | 38.9 -25% |
| Load Maximum * (dB) | 31.2 | 39.7 -27% | 39.9 -28% | 33 -6% | 39 -25% |
* ... menor é melhor
(±) A temperatura máxima no lado superior é 43 °C / 109 F, em comparação com a média de 35.9 °C / 97 F , variando de 21.4 a 59 °C para a classe Subnotebook.
(-) A parte inferior aquece até um máximo de 46 °C / 115 F, em comparação com a média de 39.2 °C / 103 F
(+) Em uso inativo, a temperatura média para o lado superior é 23.8 °C / 75 F, em comparação com a média do dispositivo de 30.8 °C / ### class_avg_f### F.
(+) Os apoios para as mãos e o touchpad estão atingindo a temperatura máxima da pele (34.7 °C / 94.5 F) e, portanto, não estão quentes.
(-) A temperatura média da área do apoio para as mãos de dispositivos semelhantes foi 28.2 °C / 82.8 F (-6.5 °C / -11.7 F).
| Lenovo ThinkPad A285-20MX0002GE Vega 8, R5 PRO 2500U, Samsung SSD PM981 MZVLB256HAHQ | Lenovo ThinkPad X280-20KES01S00 UHD Graphics 620, i5-8250U, Samsung SSD PM981 MZVLB512HAJQ | Dell Latitude 7390 UHD Graphics 620, i5-8350U, SK hynix SC311 M.2 | Fujitsu Lifebook U938 UHD Graphics 620, i5-8250U, Micron 1100 MTFDDAV256TBN | HP Envy 13-ah0003ng GeForce MX150, i5-8550U, SK Hynix BC501 HFM512GDJTNG | |
|---|---|---|---|---|---|
| Heat | 3% | -2% | 3% | -14% | |
| Maximum Upper Side * (°C) | 43 | 43.2 -0% | 43.1 -0% | 39.3 9% | 43.1 -0% |
| Maximum Bottom * (°C) | 46 | 43.1 6% | 55.2 -20% | 43.1 6% | 45.9 -0% |
| Idle Upper Side * (°C) | 24.5 | 24.8 -1% | 23.7 3% | 25.4 -4% | 32.4 -32% |
| Idle Bottom * (°C) | 25.9 | 24.1 7% | 23.6 9% | 25.6 1% | 32.2 -24% |
* ... menor é melhor
Lenovo ThinkPad A285-20MX0002GE análise de áudio
(-) | alto-falantes não muito altos (###valor### dB)
Graves 100 - 315Hz
(-) | quase nenhum baixo - em média 25.9% menor que a mediana
(±) | a linearidade dos graves é média (10.3% delta para a frequência anterior)
Médios 400 - 2.000 Hz
(+) | médios equilibrados - apenas 2.7% longe da mediana
(+) | médios são lineares (6.1% delta para frequência anterior)
Altos 2 - 16 kHz
(+) | agudos equilibrados - apenas 2.3% longe da mediana
(+) | os máximos são lineares (5.1% delta da frequência anterior)
Geral 100 - 16.000 Hz
(±) | a linearidade do som geral é média (24% diferença em relação à mediana)
Comparado com a mesma classe
» 82% de todos os dispositivos testados nesta classe foram melhores, 4% semelhantes, 14% piores
» O melhor teve um delta de 5%, a média foi 18%, o pior foi 53%
Comparado com todos os dispositivos testados
» 72% de todos os dispositivos testados foram melhores, 6% semelhantes, 22% piores
» O melhor teve um delta de 4%, a média foi 23%, o pior foi 134%
Dell Latitude 7390 análise de áudio
(+) | os alto-falantes podem tocar relativamente alto (###valor### dB)
Graves 100 - 315Hz
(-) | quase nenhum baixo - em média 22.5% menor que a mediana
(±) | a linearidade dos graves é média (10.7% delta para a frequência anterior)
Médios 400 - 2.000 Hz
(±) | médios mais altos - em média 5% maior que a mediana
(+) | médios são lineares (4.7% delta para frequência anterior)
Altos 2 - 16 kHz
(±) | máximos mais altos - em média 5.8% maior que a mediana
(+) | os máximos são lineares (6% delta da frequência anterior)
Geral 100 - 16.000 Hz
(±) | a linearidade do som geral é média (20.7% diferença em relação à mediana)
Comparado com a mesma classe
» 48% de todos os dispositivos testados nesta classe foram melhores, 10% semelhantes, 42% piores
» O melhor teve um delta de 7%, a média foi 21%, o pior foi 53%
Comparado com todos os dispositivos testados
» 56% de todos os dispositivos testados foram melhores, 8% semelhantes, 36% piores
» O melhor teve um delta de 4%, a média foi 23%, o pior foi 134%
| desligado | |
| Ocioso | |
| Carga |
|
Key:
min: | |
| Lenovo ThinkPad A285-20MX0002GE R5 PRO 2500U, Vega 8, Samsung SSD PM981 MZVLB256HAHQ, IPS LED, 1920x1080, 12.5" | Lenovo ThinkPad X280-20KES01S00 i5-8250U, UHD Graphics 620, Samsung SSD PM981 MZVLB512HAJQ, IPS LED, 1920x1080, 12.5" | Dell Latitude 7390 i5-8350U, UHD Graphics 620, SK hynix SC311 M.2, IPS, 1920x1080, 13.3" | Fujitsu Lifebook U938 i5-8250U, UHD Graphics 620, Micron 1100 MTFDDAV256TBN, IPS, 1920x1080, 13.3" | HP Envy 13-ah0003ng i5-8550U, GeForce MX150, SK Hynix BC501 HFM512GDJTNG, IPS, 1920x1080, 13.3" | Média AMD Radeon RX Vega 8 (Ryzen 2000/3000) | Média da turma Subnotebook | |
|---|---|---|---|---|---|---|---|
| Power Consumption | 12% | 10% | 34% | 2% | -4% | 1% | |
| Idle Minimum * (Watt) | 5.8 | 3.11 46% | 2.34 60% | 2.4 59% | 5.3 9% | 5.68 ? 2% | 3.71 ? 36% |
| Idle Average * (Watt) | 8.2 | 5.01 39% | 5.6 32% | 5.5 33% | 7.3 11% | 8.75 ? -7% | 6.54 ? 20% |
| Idle Maximum * (Watt) | 9.96 | 8.11 19% | 6.5 35% | 6 40% | 9.3 7% | 10.1 ? -1% | 7.89 ? 21% |
| Load Average * (Watt) | 37.9 | 44.6 -18% | 43 -13% | 31 18% | 39 -3% | 37.8 ? -0% | 42.1 ? -11% |
| Load Maximum * (Watt) | 40.5 | 51.7 -28% | 67.4 -66% | 32.6 20% | 46 -14% | 46.2 ? -14% | 65.1 ? -61% |
* ... menor é melhor

| Lenovo ThinkPad A285-20MX0002GE R5 PRO 2500U, Vega 8, 48 Wh | Lenovo ThinkPad X280-20KES01S00 i5-8250U, UHD Graphics 620, 50 Wh | Dell Latitude 7390 i5-8350U, UHD Graphics 620, 60 Wh | Fujitsu Lifebook U938 i5-8250U, UHD Graphics 620, 50 Wh | HP Envy 13-ah0003ng i5-8550U, GeForce MX150, 53.2 Wh | Média da turma Subnotebook | |
|---|---|---|---|---|---|---|
| Duração da bateria | 62% | 114% | 48% | 29% | 131% | |
| Reader / Idle (h) | 9.6 | 20.2 110% | 27.7 189% | 19.5 103% | 15.5 61% | 28.6 ? 198% |
| H.264 (h) | 4.8 | 9.5 98% | 12.5 160% | 7.2 50% | 6.3 31% | 15.3 ? 219% |
| WiFi v1.3 (h) | 7.8 | 8.9 14% | 8.4 8% | 8 3% | 14.1 ? 81% | |
| Load (h) | 1.6 | 2 25% | 1.5 -6% | 2.1 31% | 1.9 19% | 1.998 ? 25% |
Pro
Contra
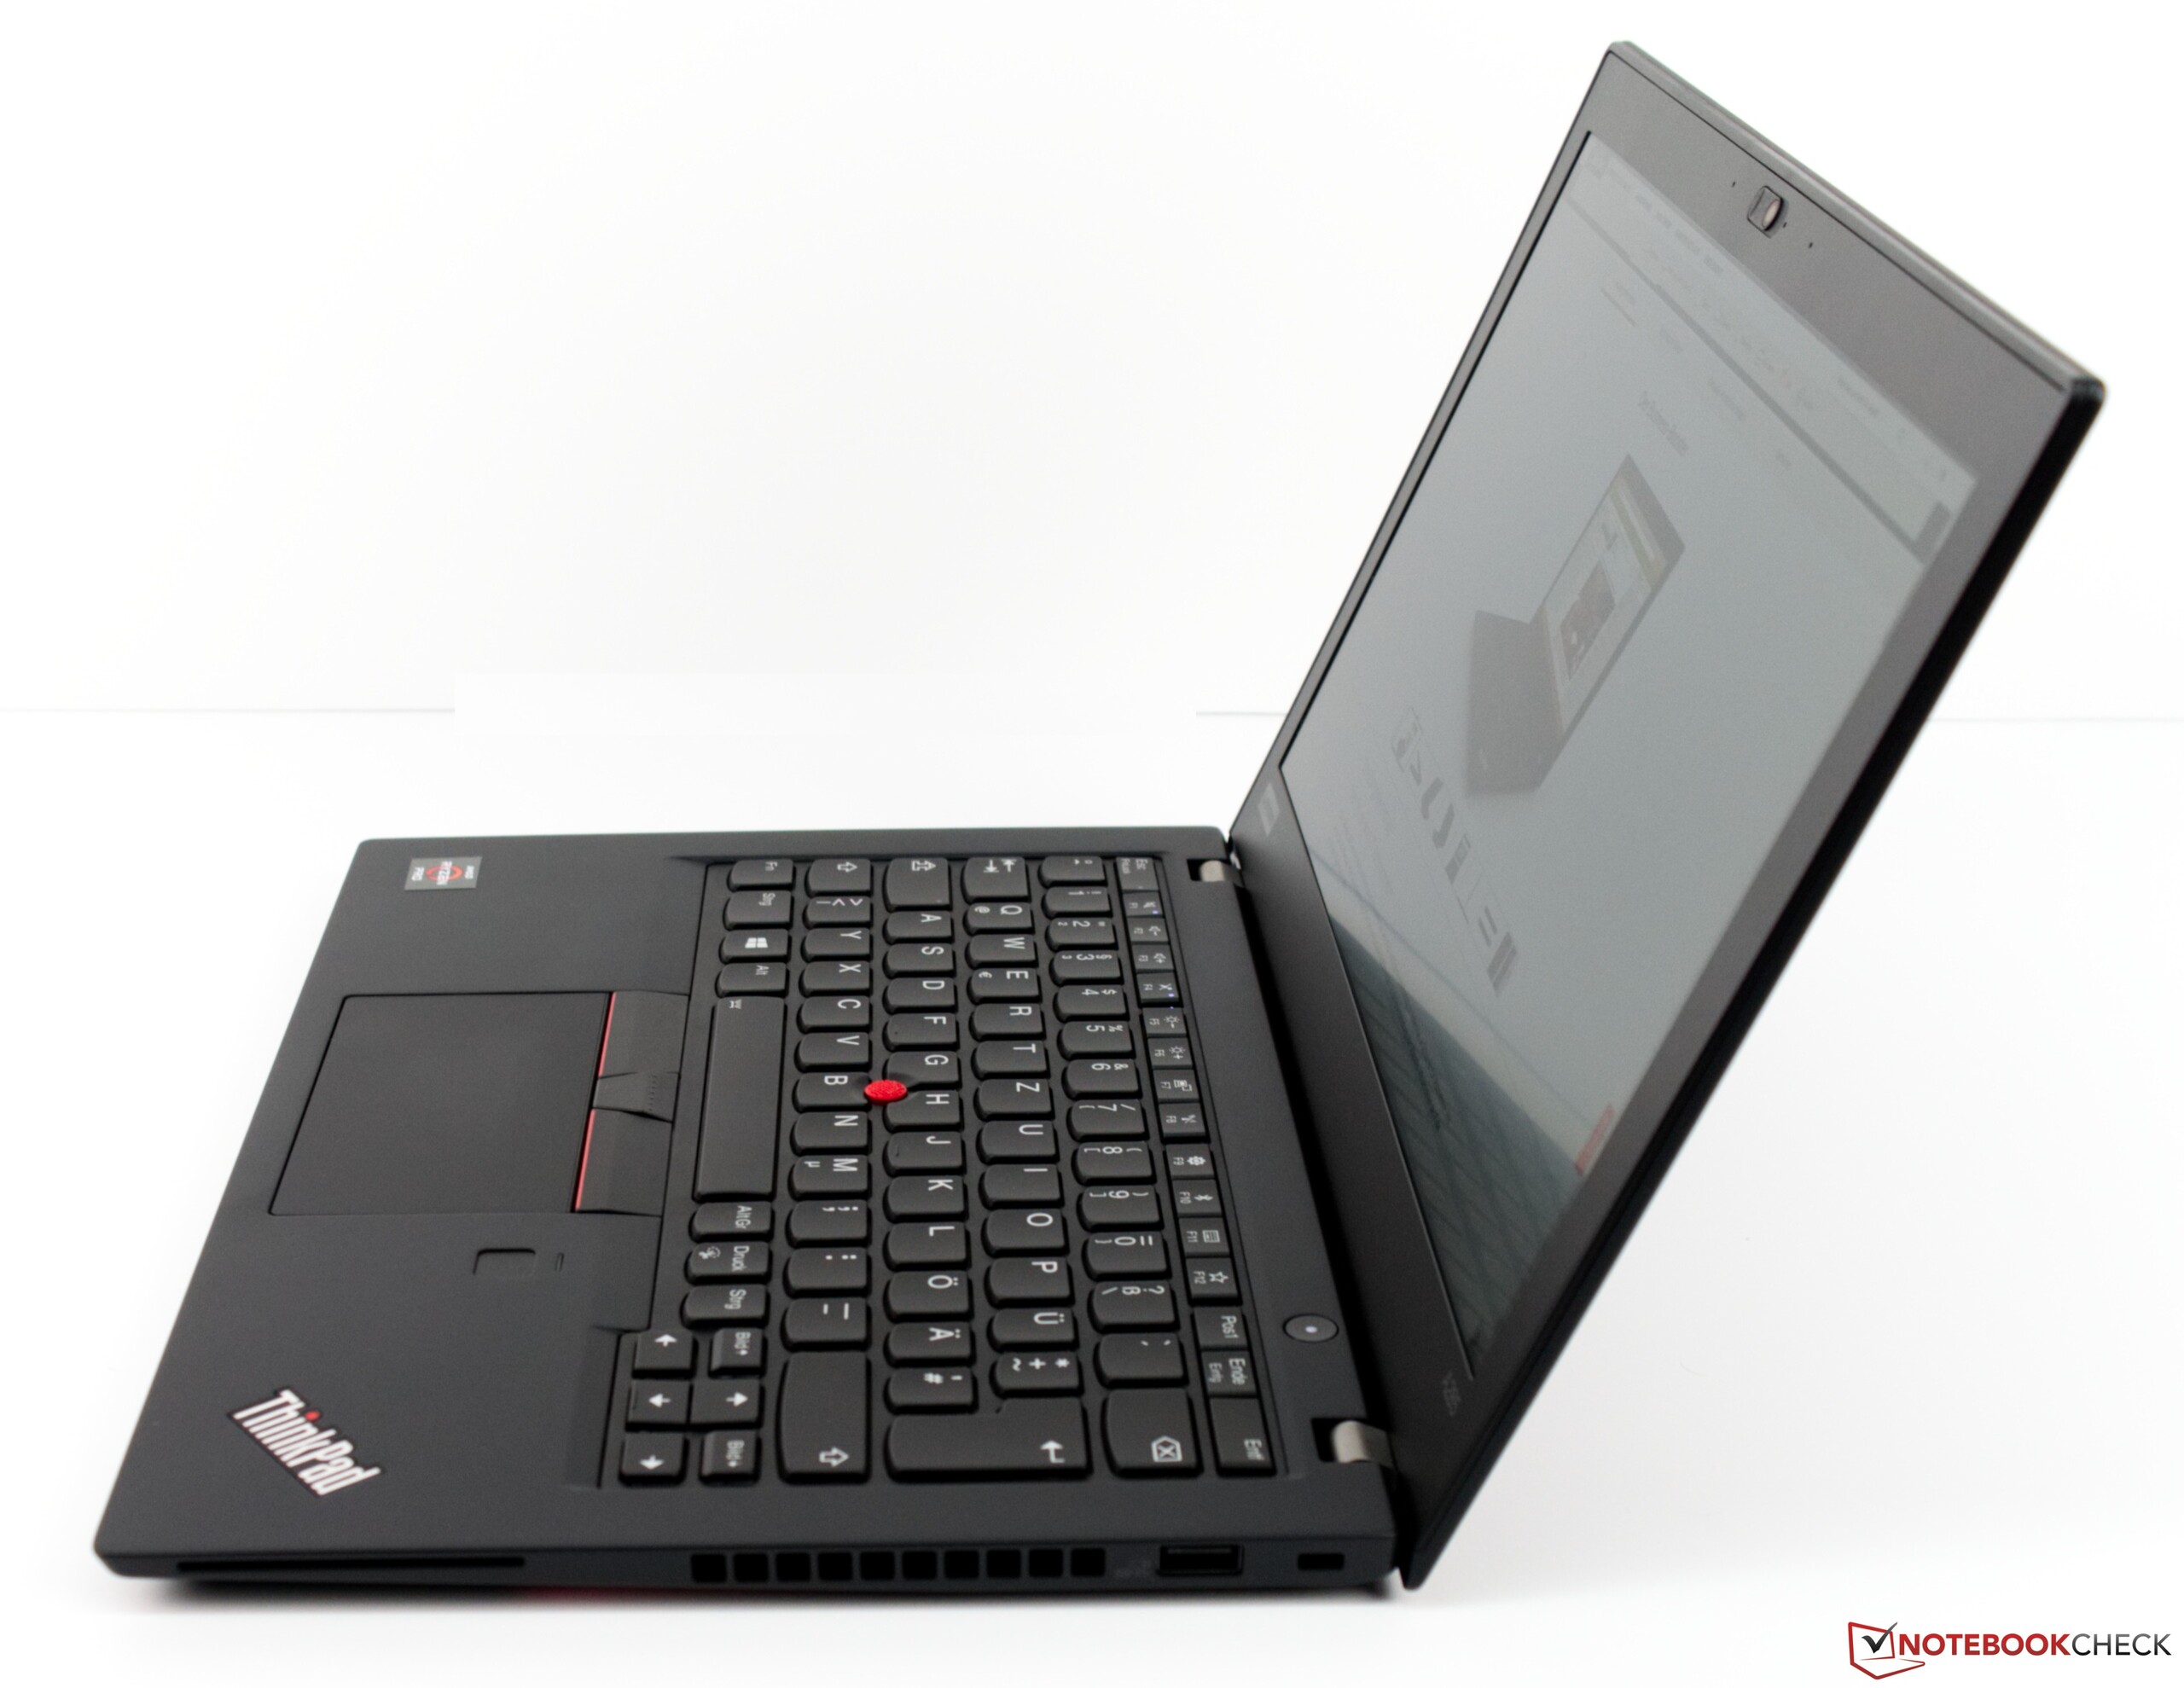
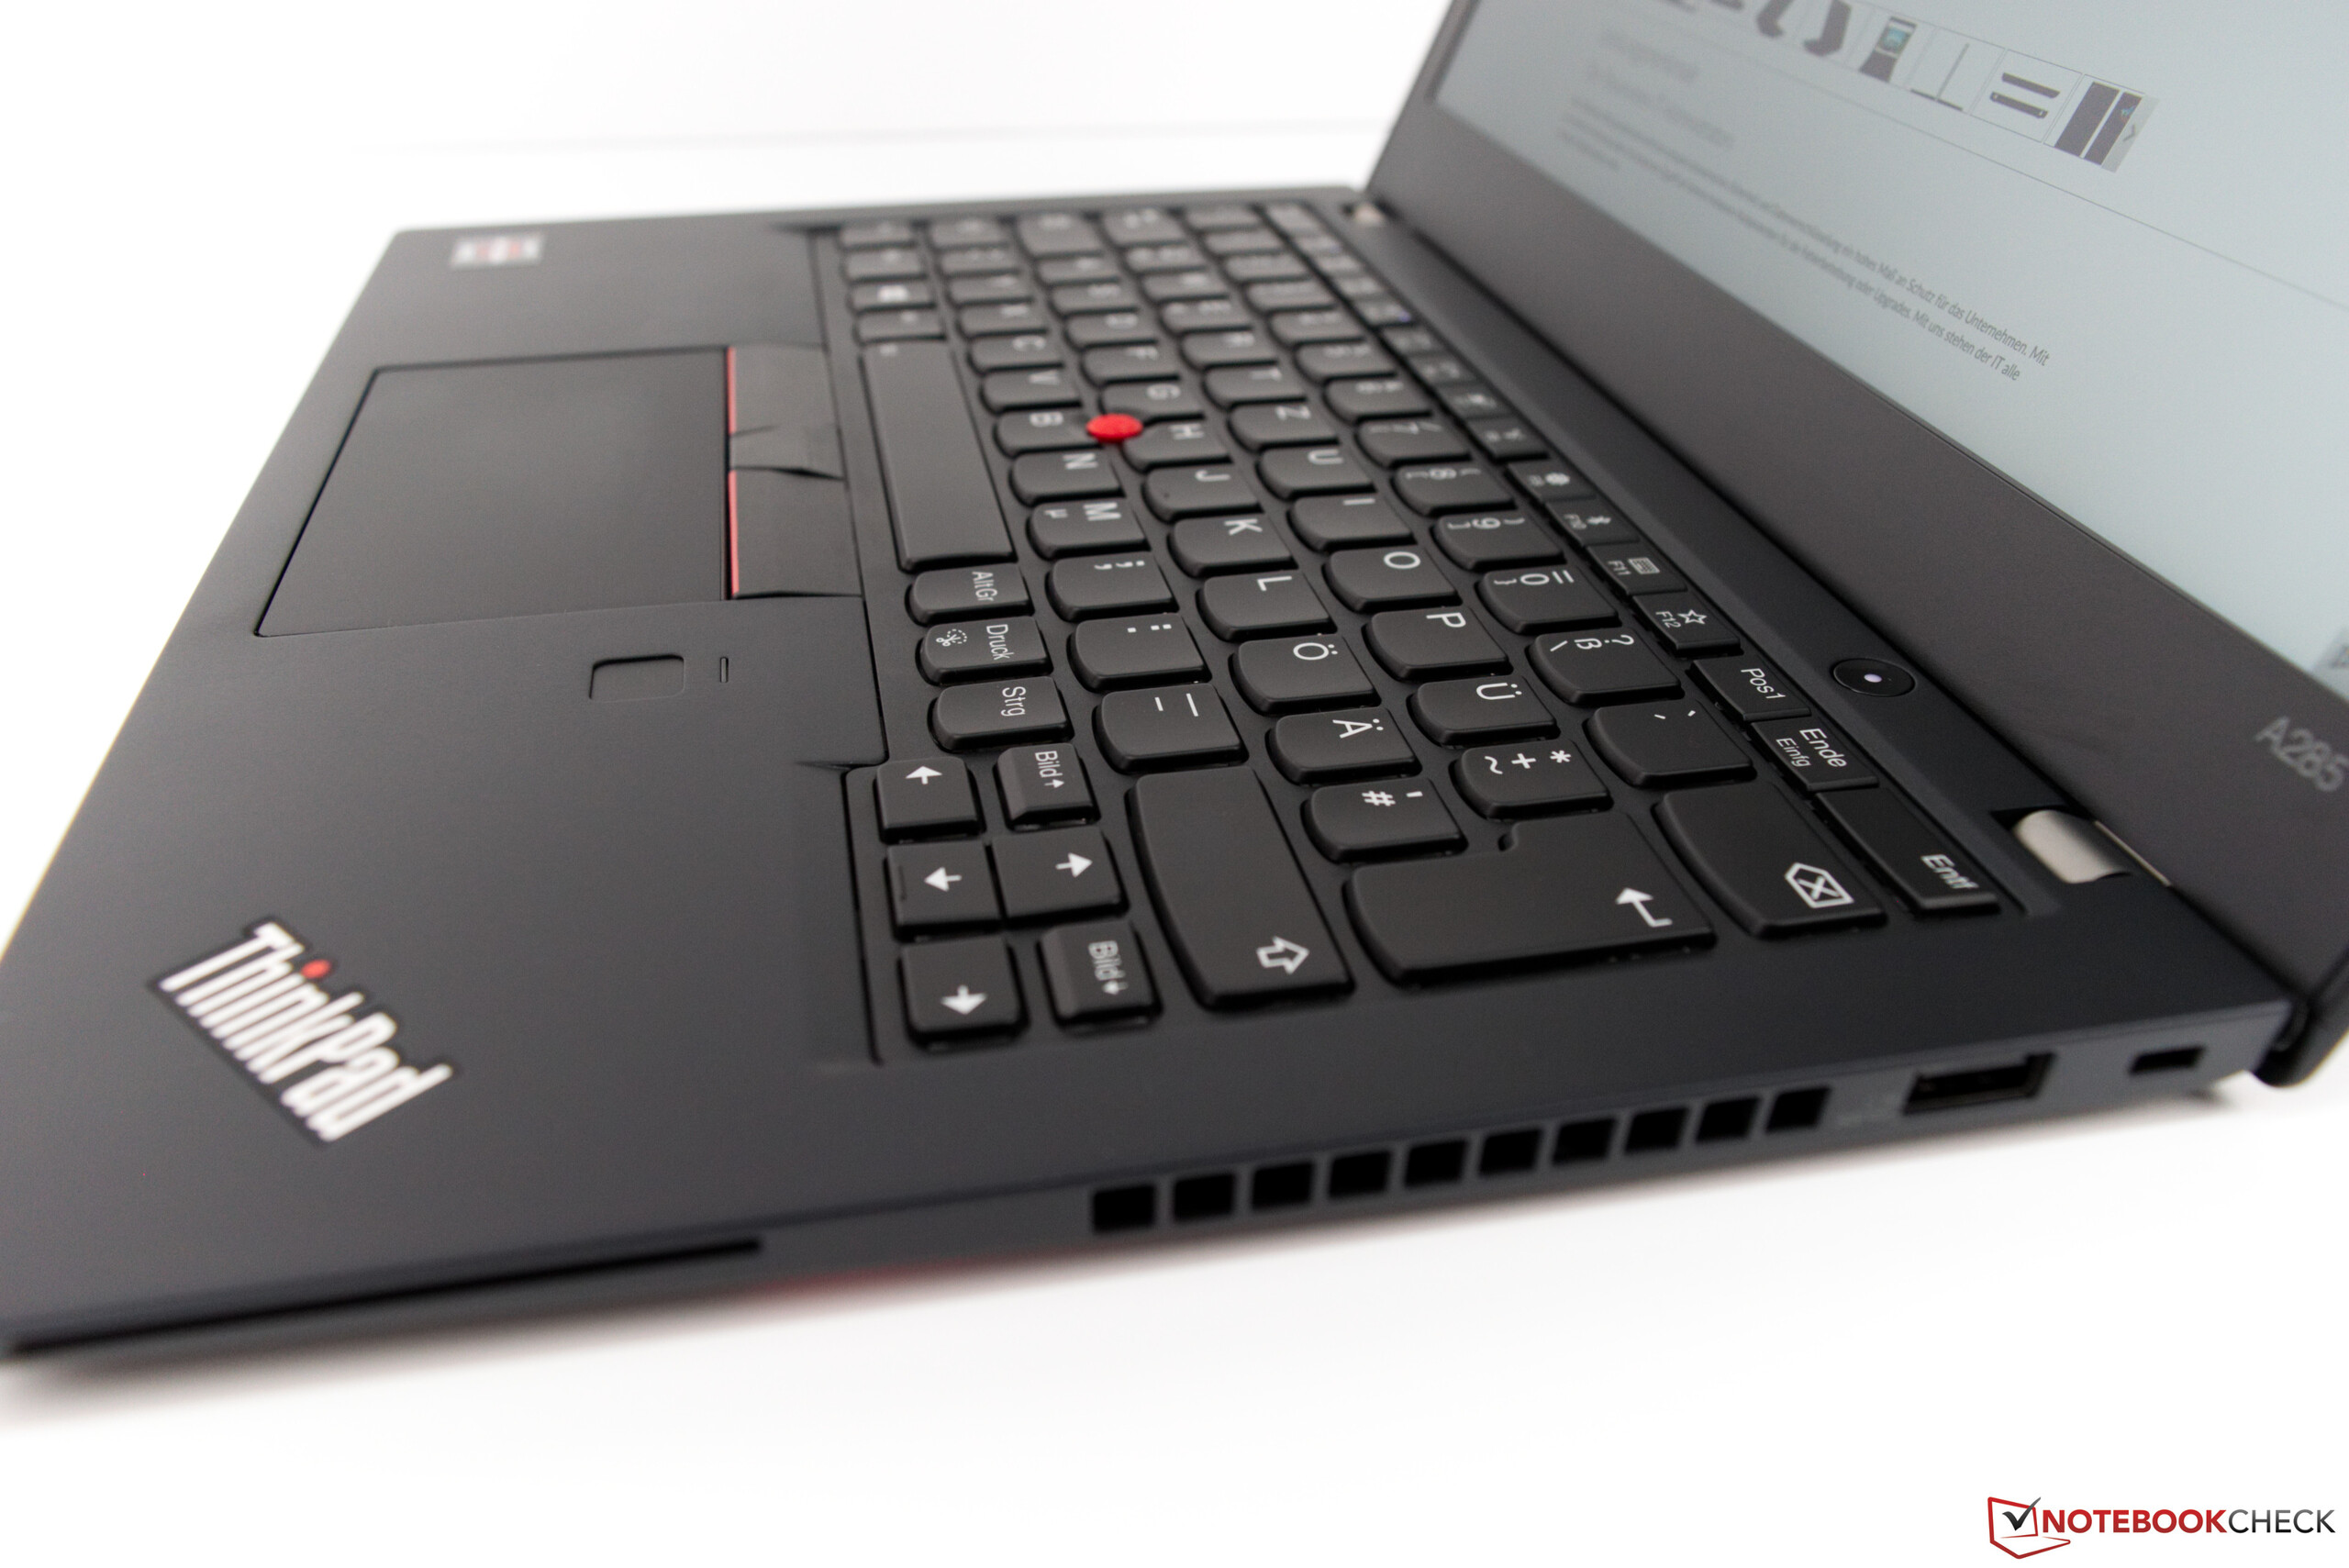
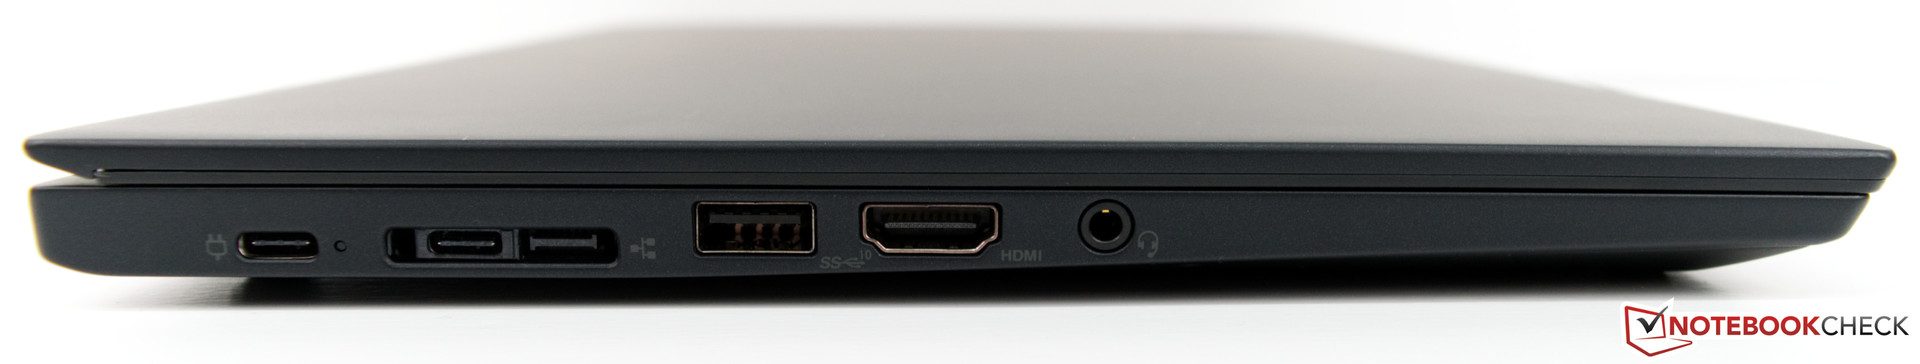
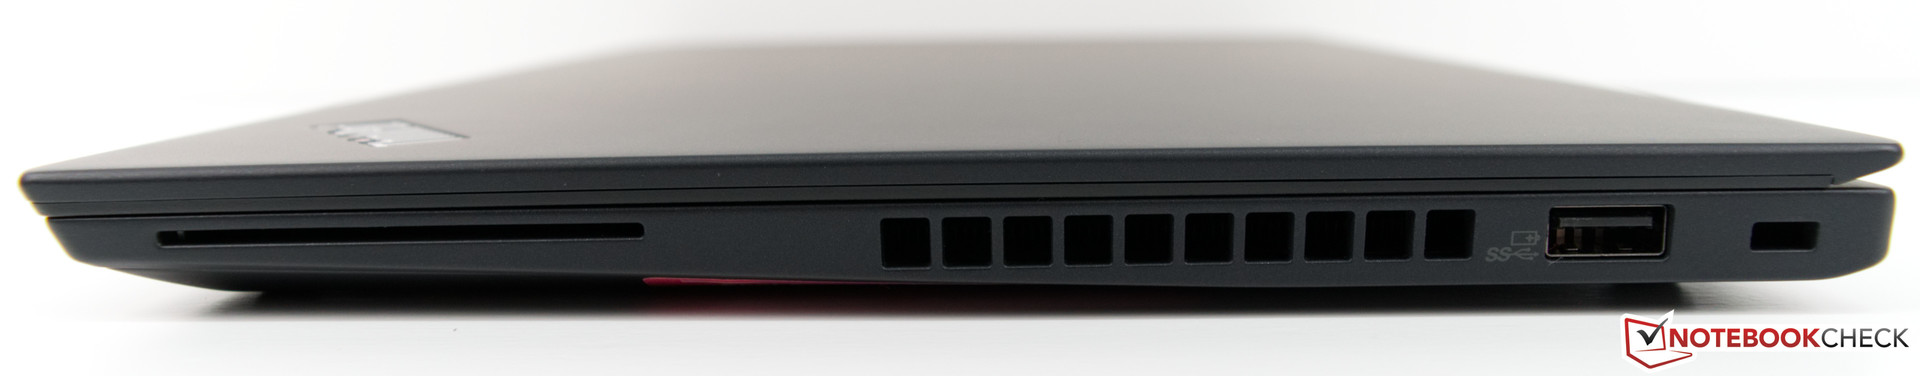
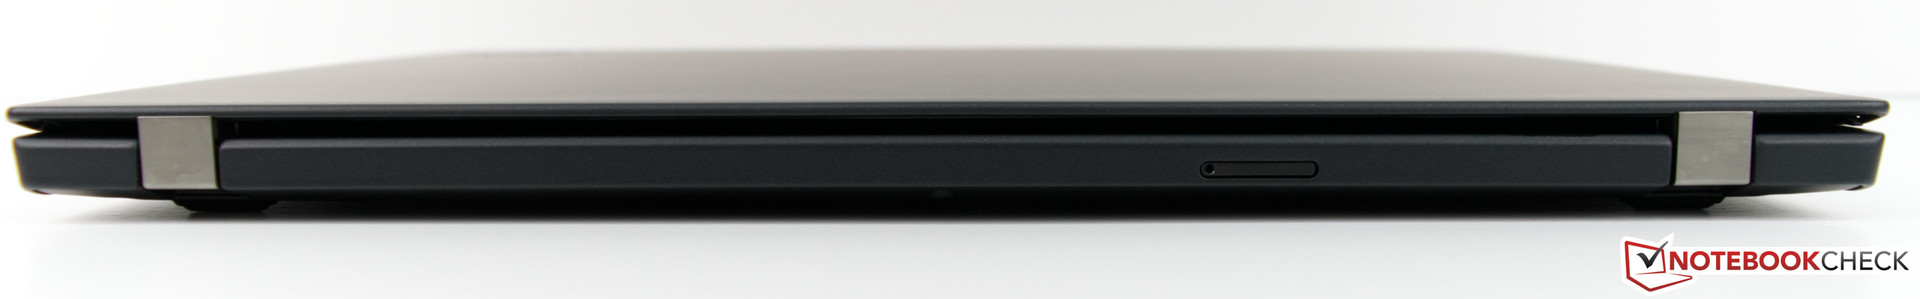
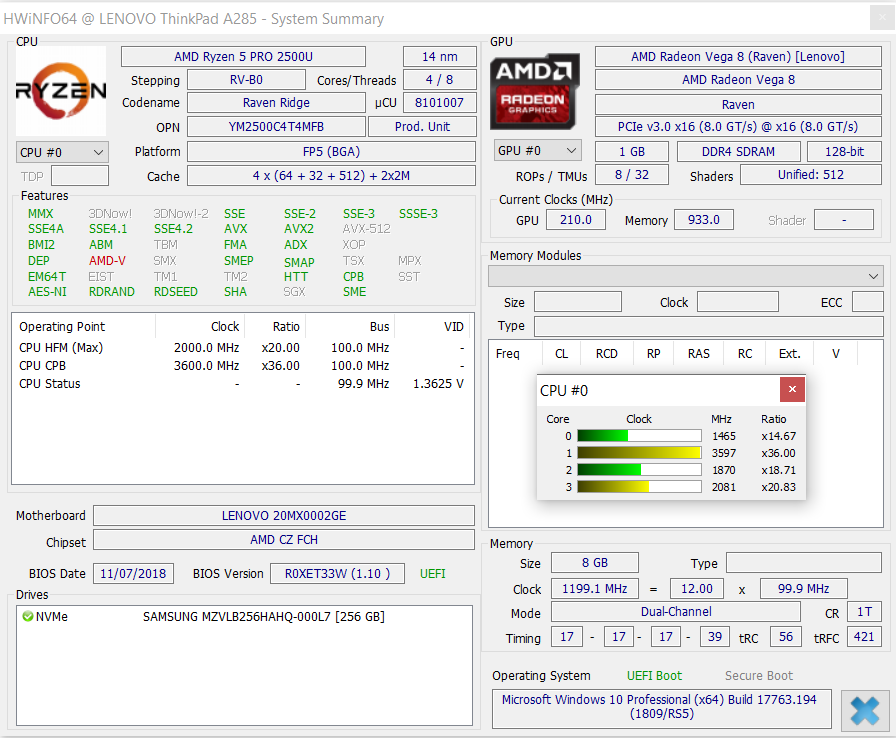
O Lenovo ThinkPad A285 finalmente oferece aos usuários a chance de adquirir um portátil ThinkPad compacto baseado em um processador AMD. Além de três modelos básicos, o dispositivo compacto de 12,5 polegadas pode ser ainda mais configurado e está disponível com recursos úteis, como um leitor de cartão inteligente ou scanner de digitais. O fabricante também oferece um módulo WWAN opcional, para que você possa usar Internet na estrada.
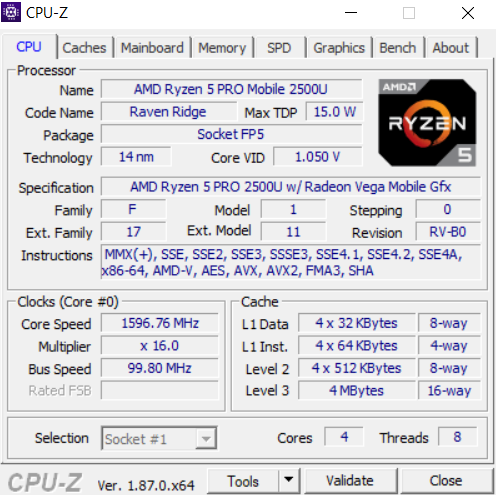
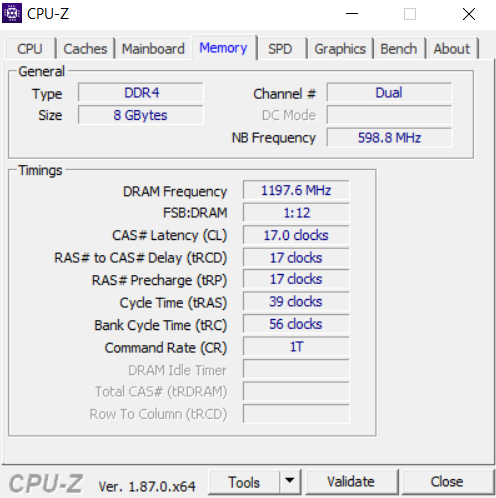
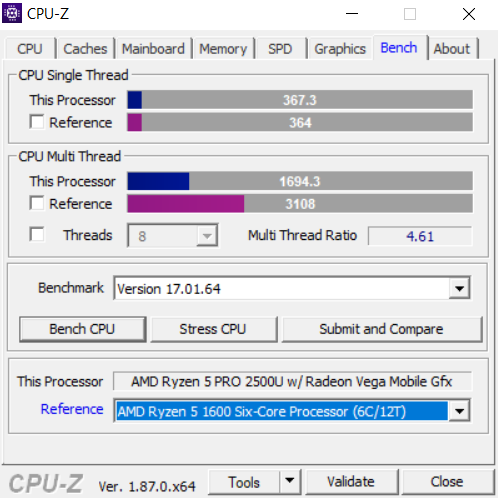
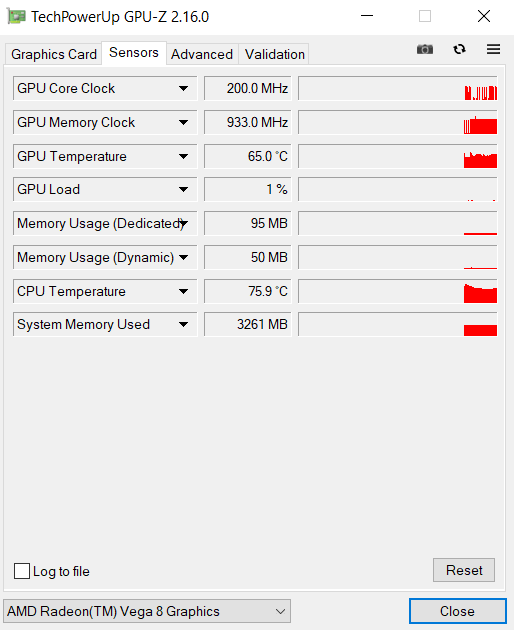
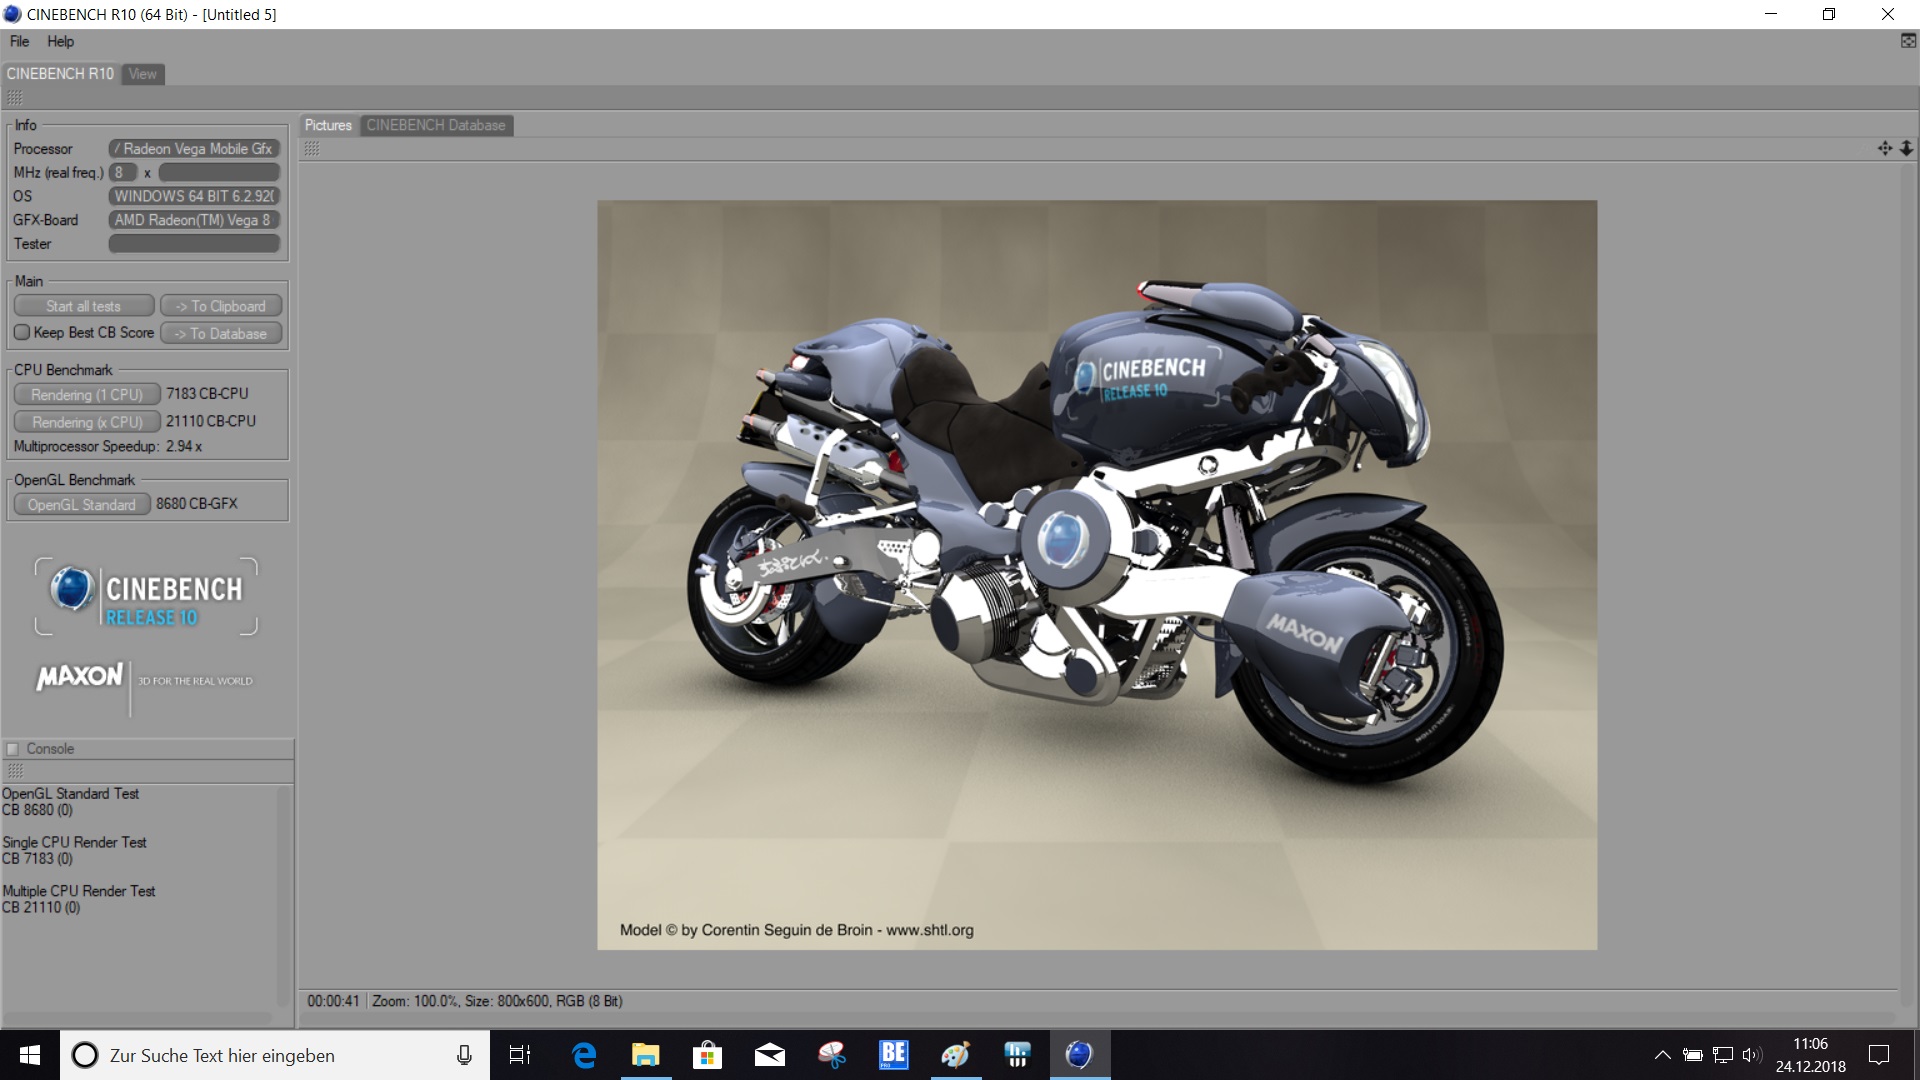
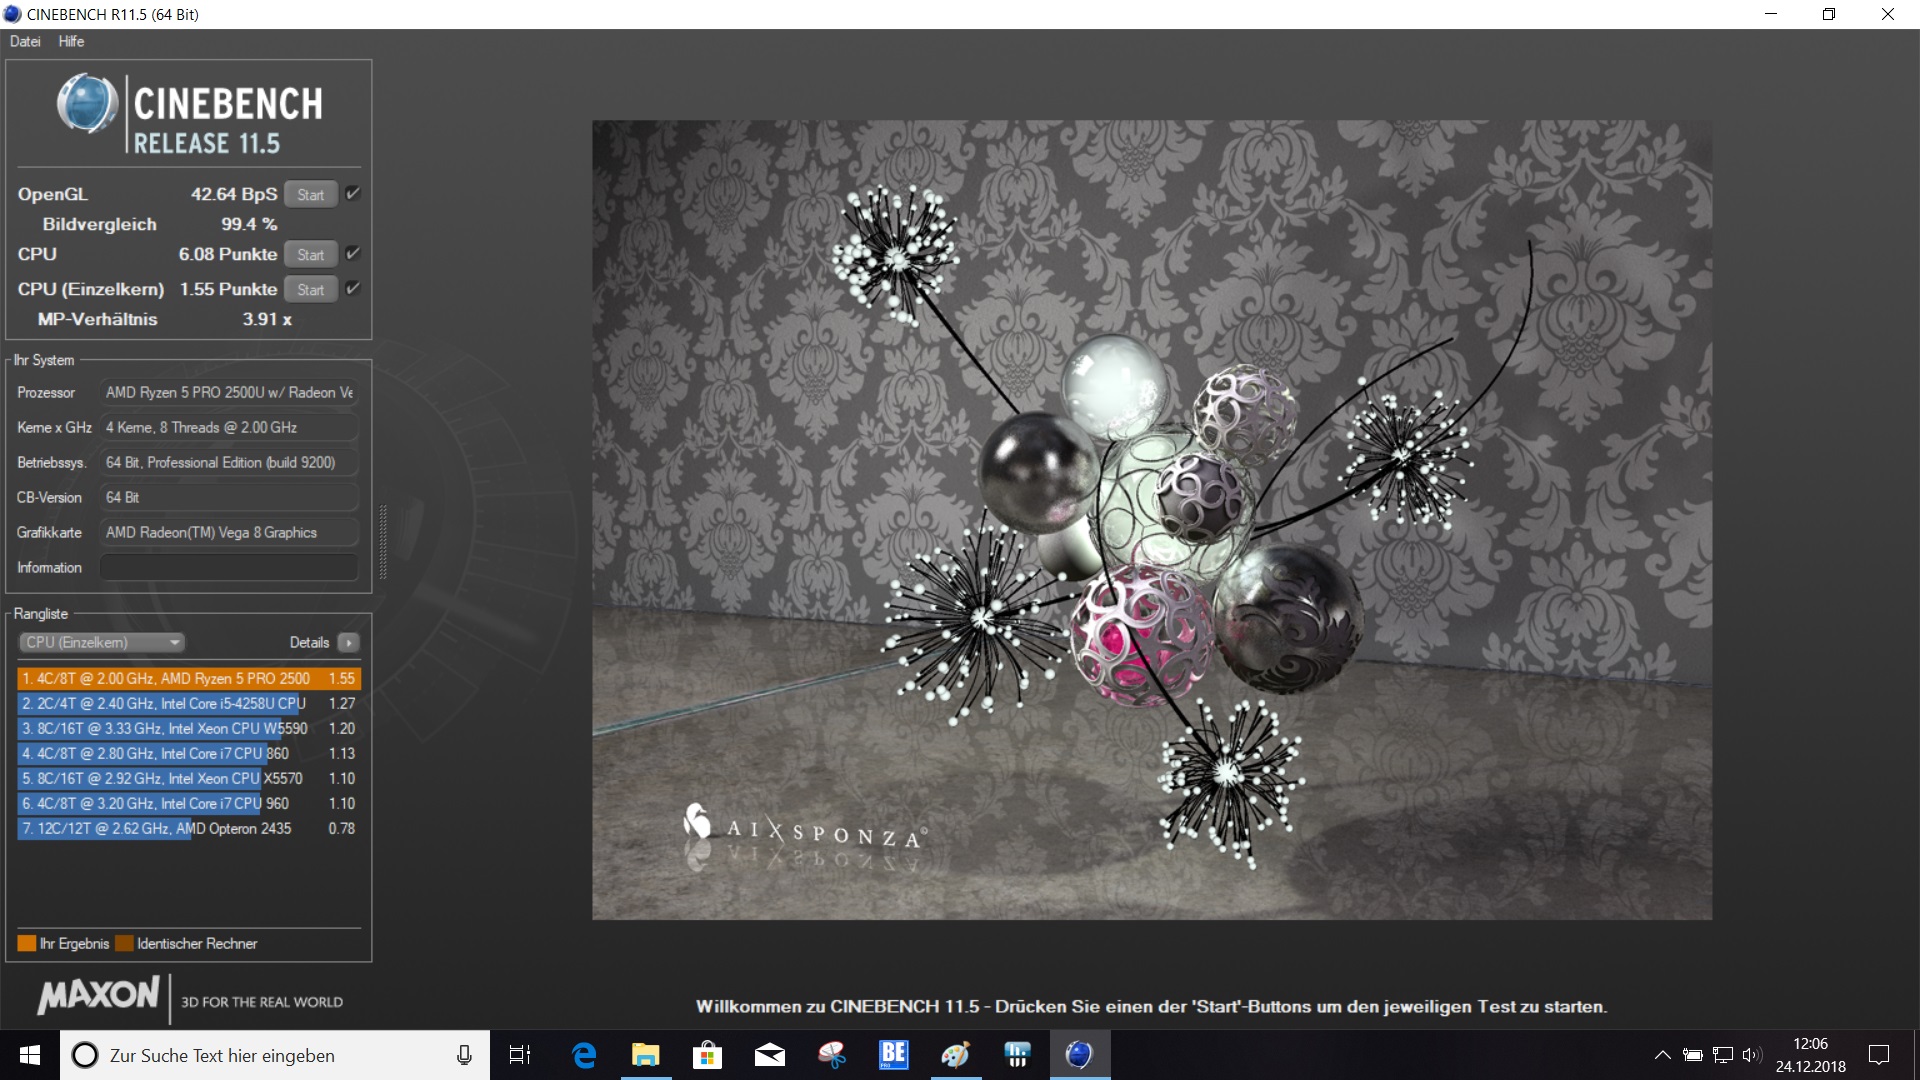
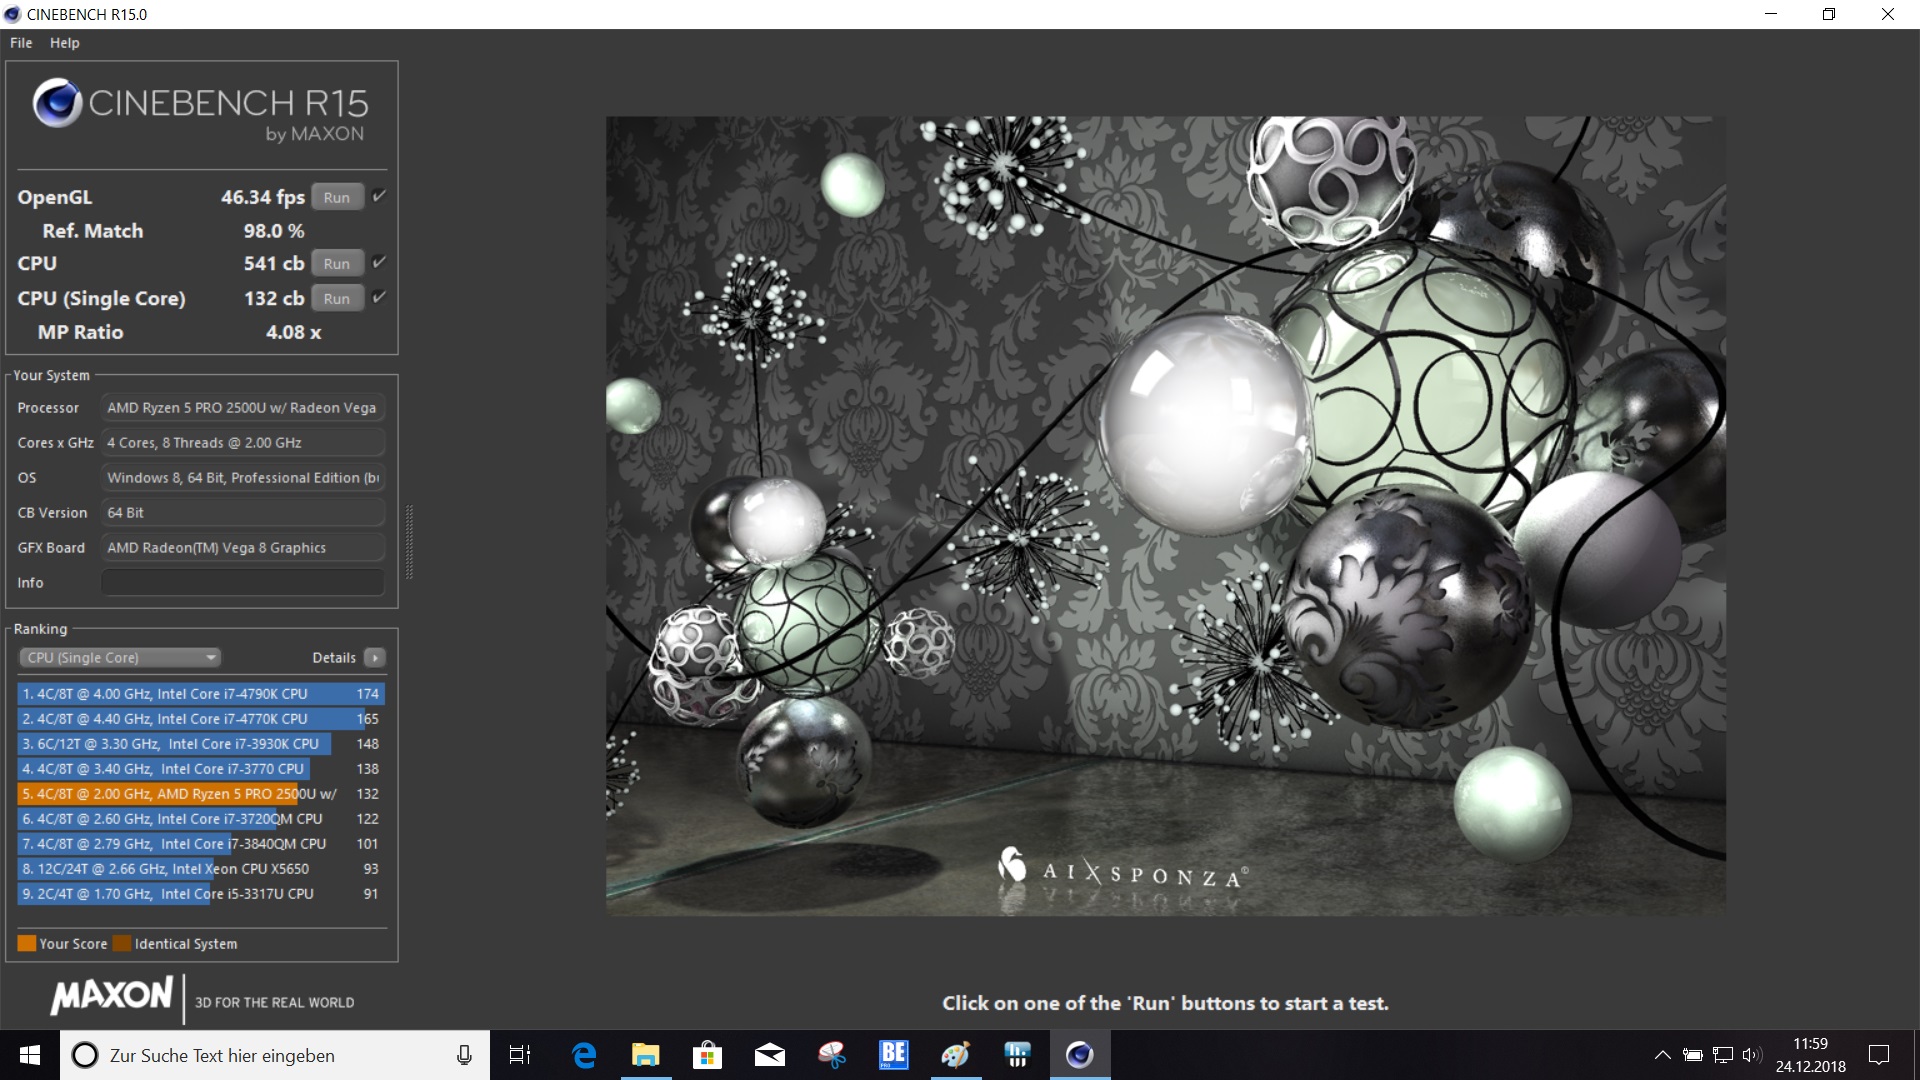
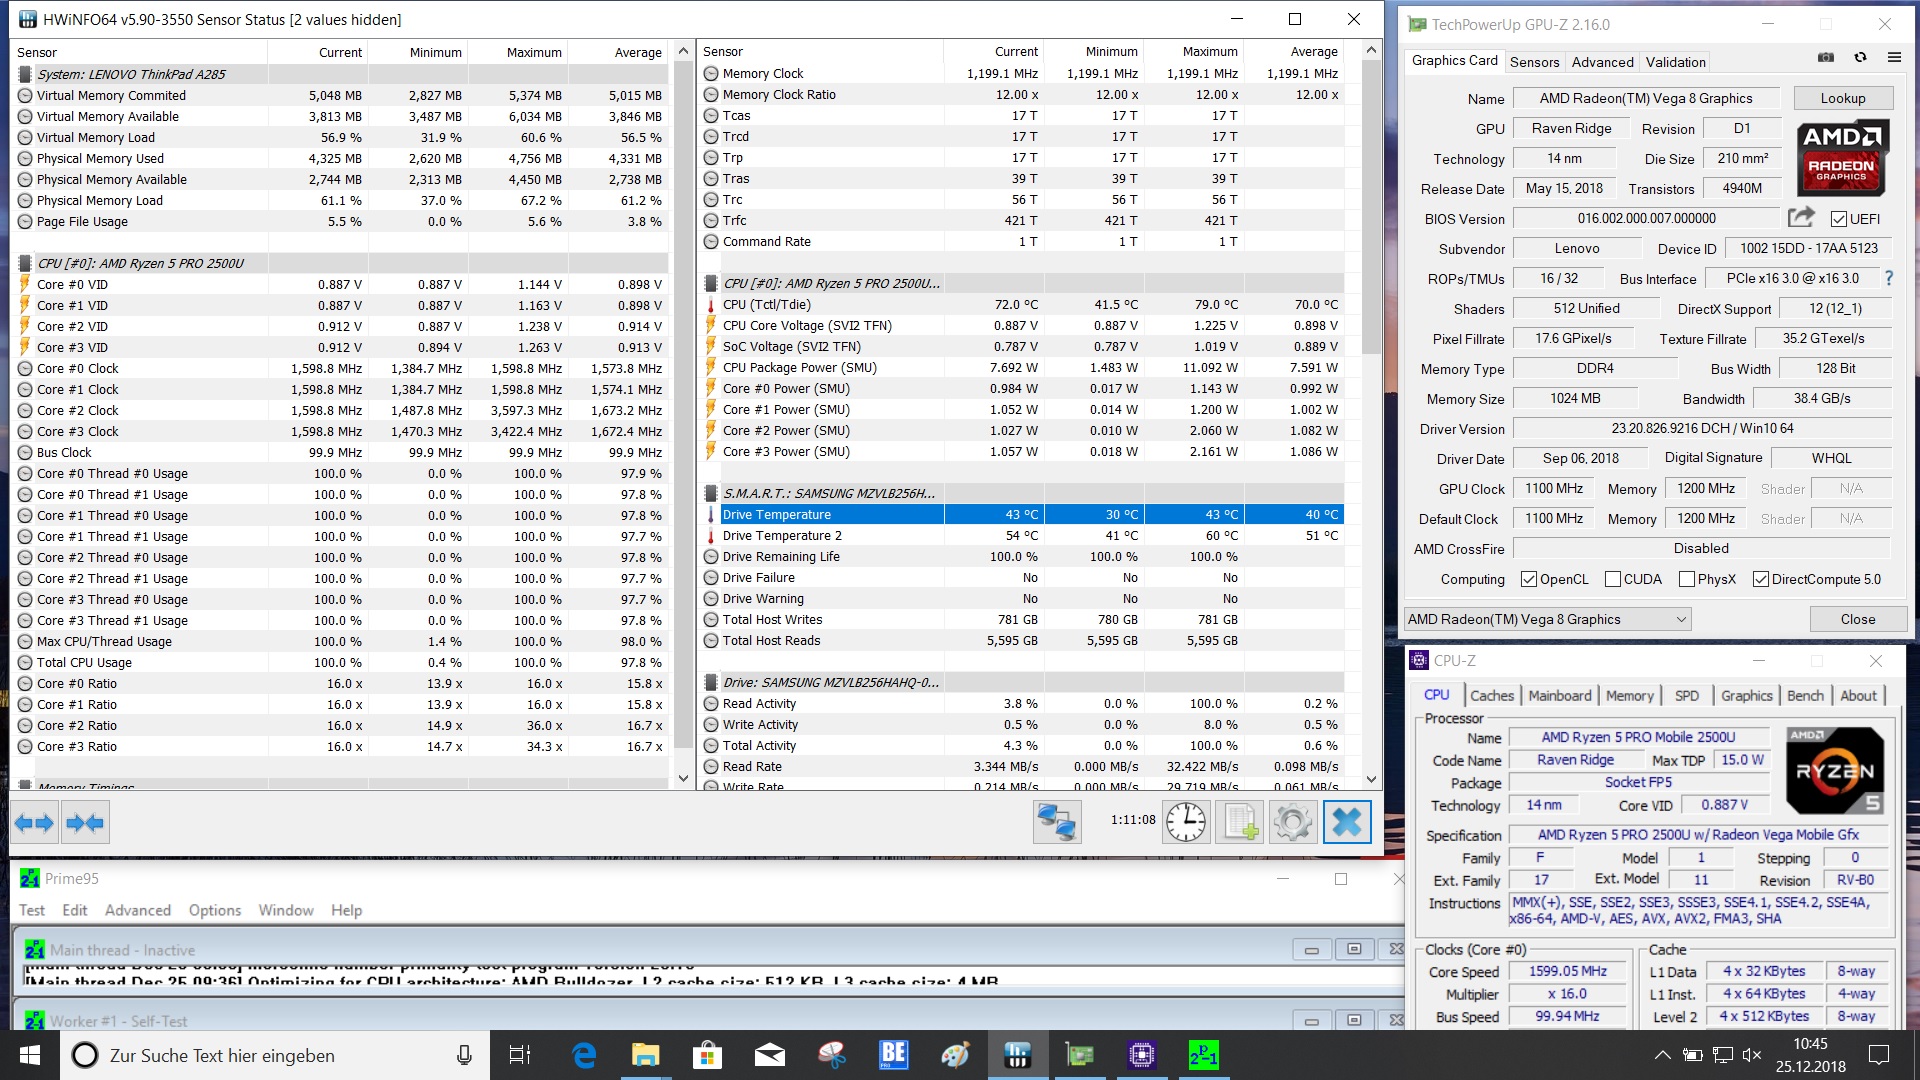
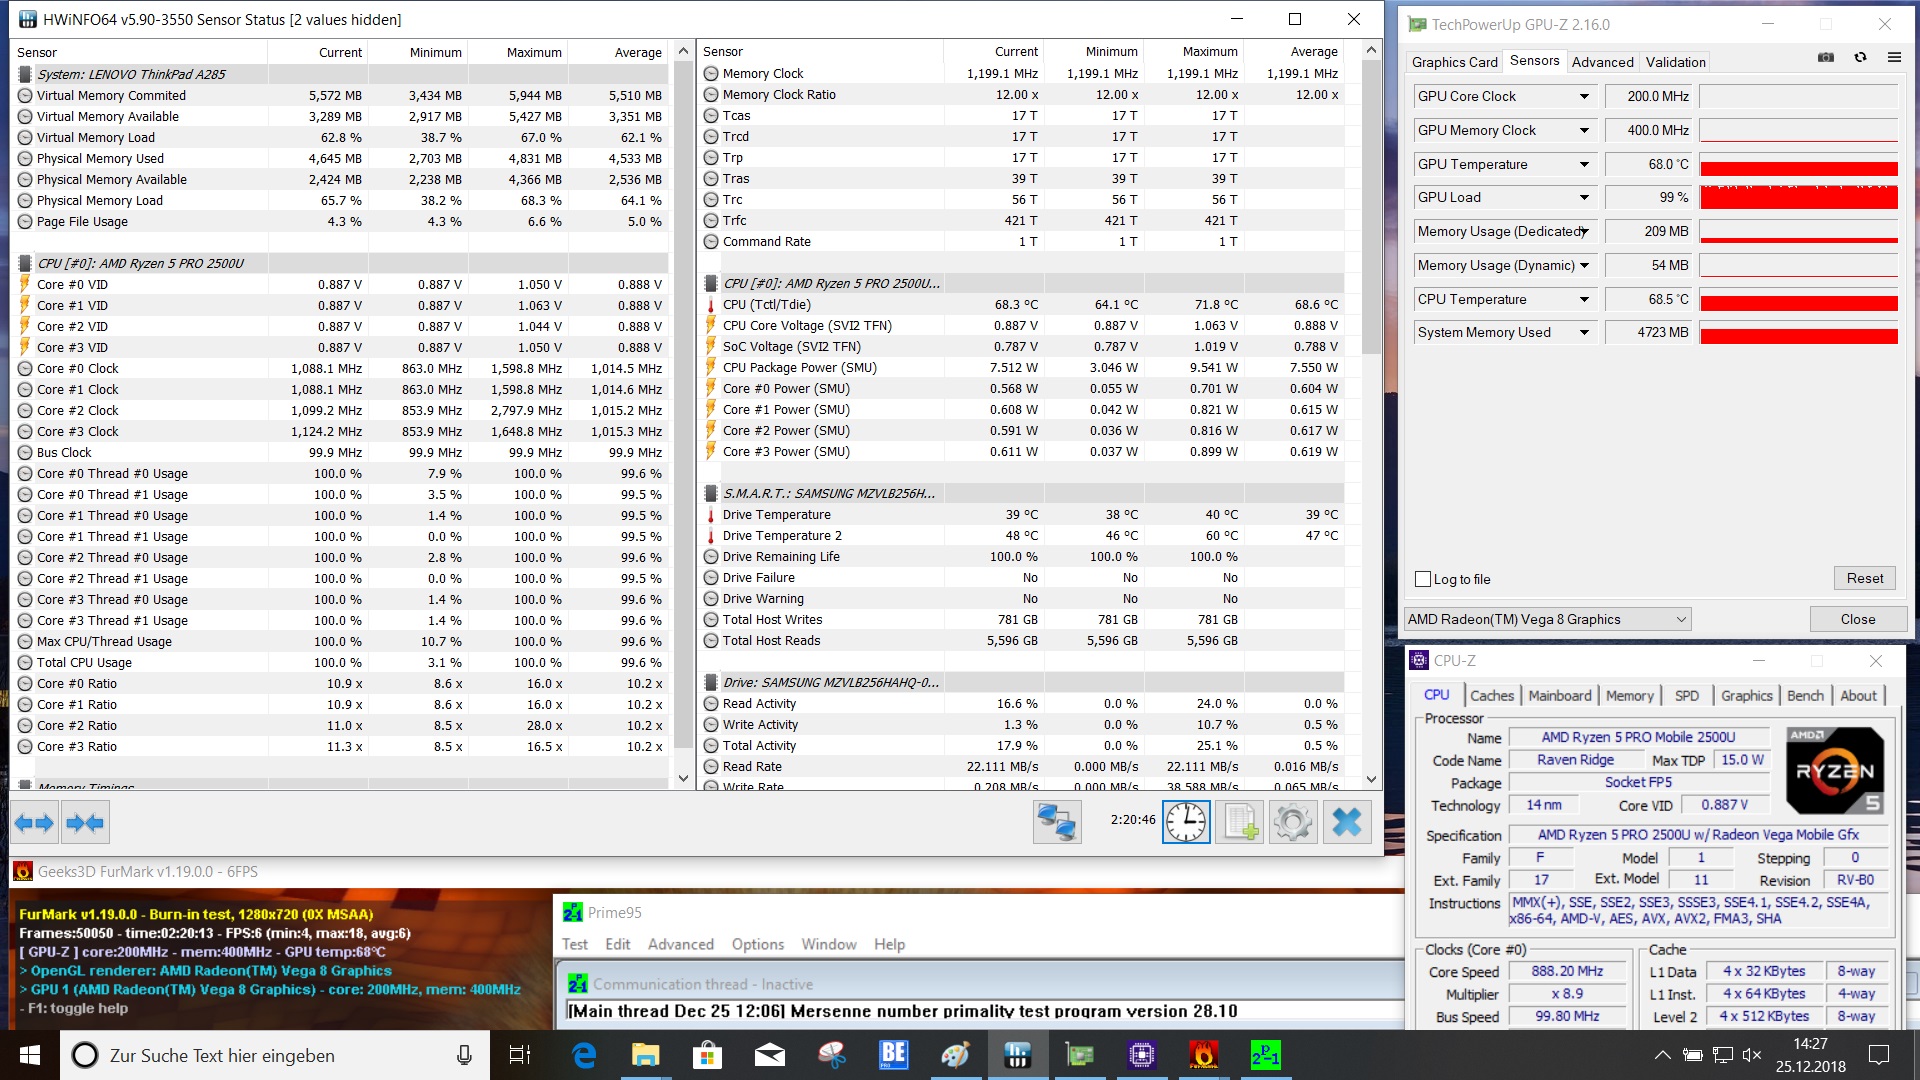
O Ryzen 5 Pro 2500U da AMD é um bom processador para o A285 e oferece bastante desempenho para tarefas comuns. O processador é comparável a um Intel Core i5-8250U, mas não para cargas de trabalho contínuas. O X280 com a CPU Intel é mais rápido, mas isso também é resultado de diferentes configurações do TDP, que foram definidas pela Lenovo.
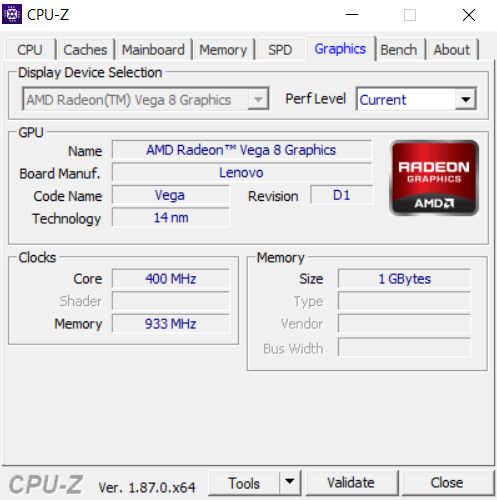
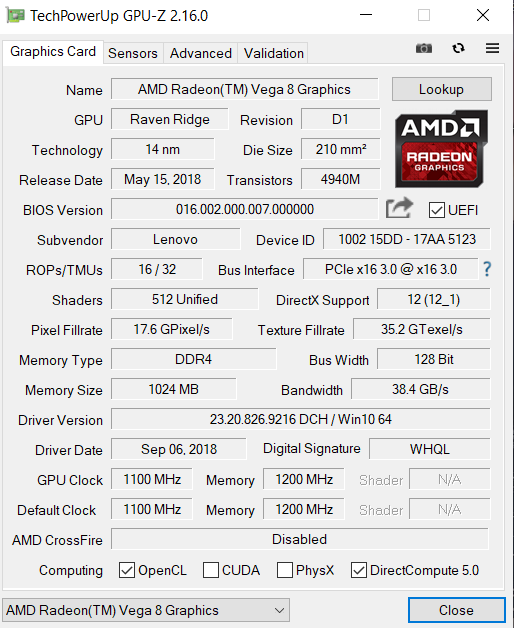
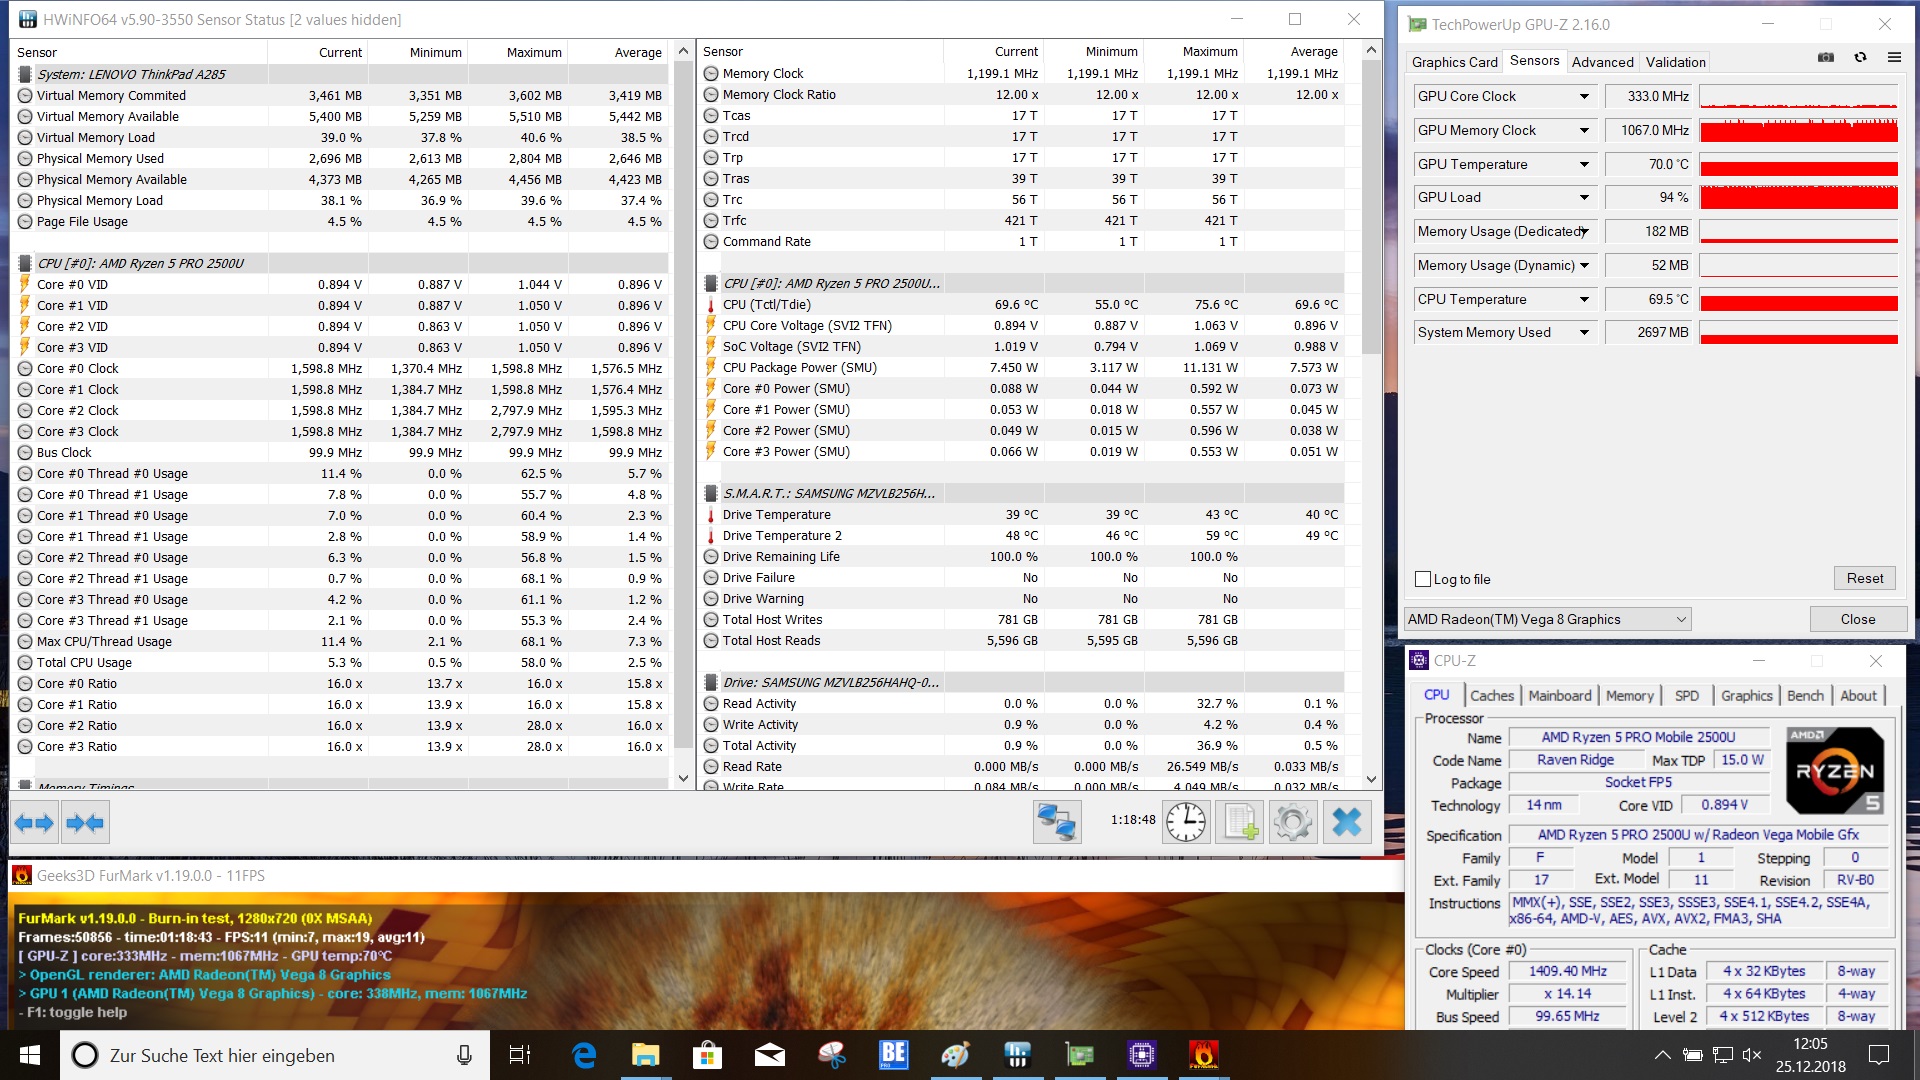
A maior diferença entre os dois chips é o adaptador gráfico integrado. A Radeon Vega 8 da AMD é uma unidade muito mais rápida e pode facilmente superar o Intel UHD Graphics 620 nos benchmarks.
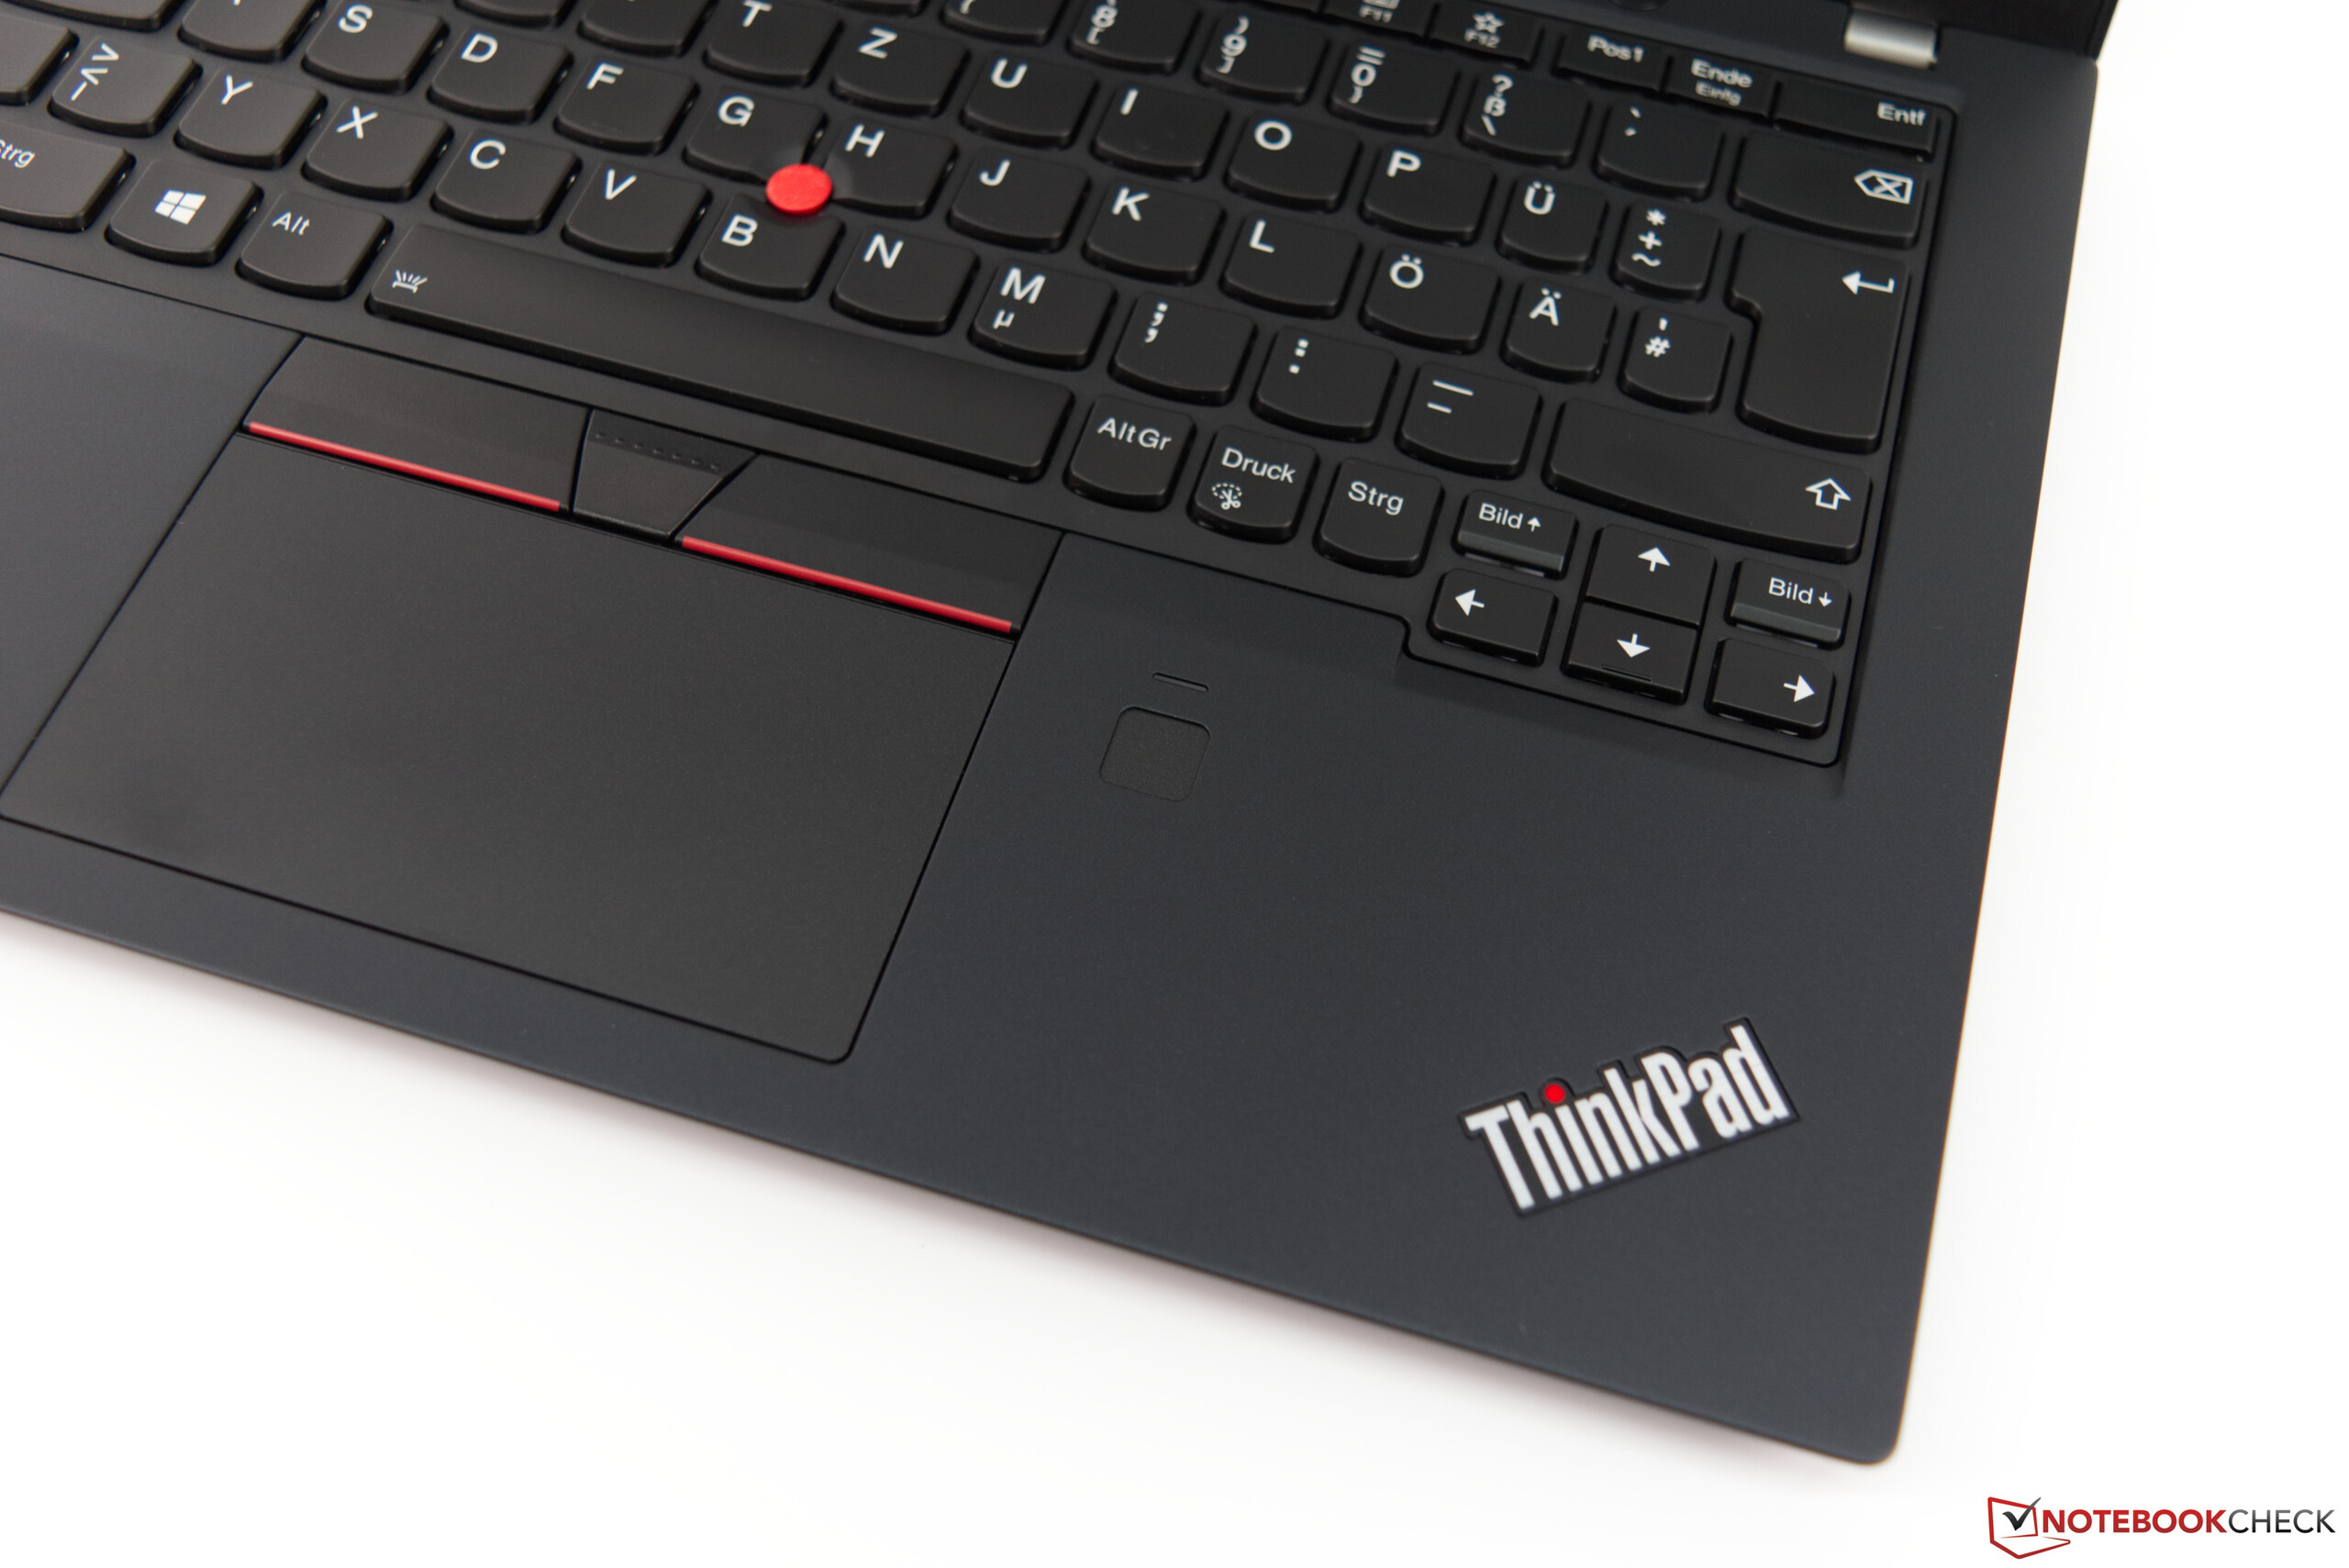
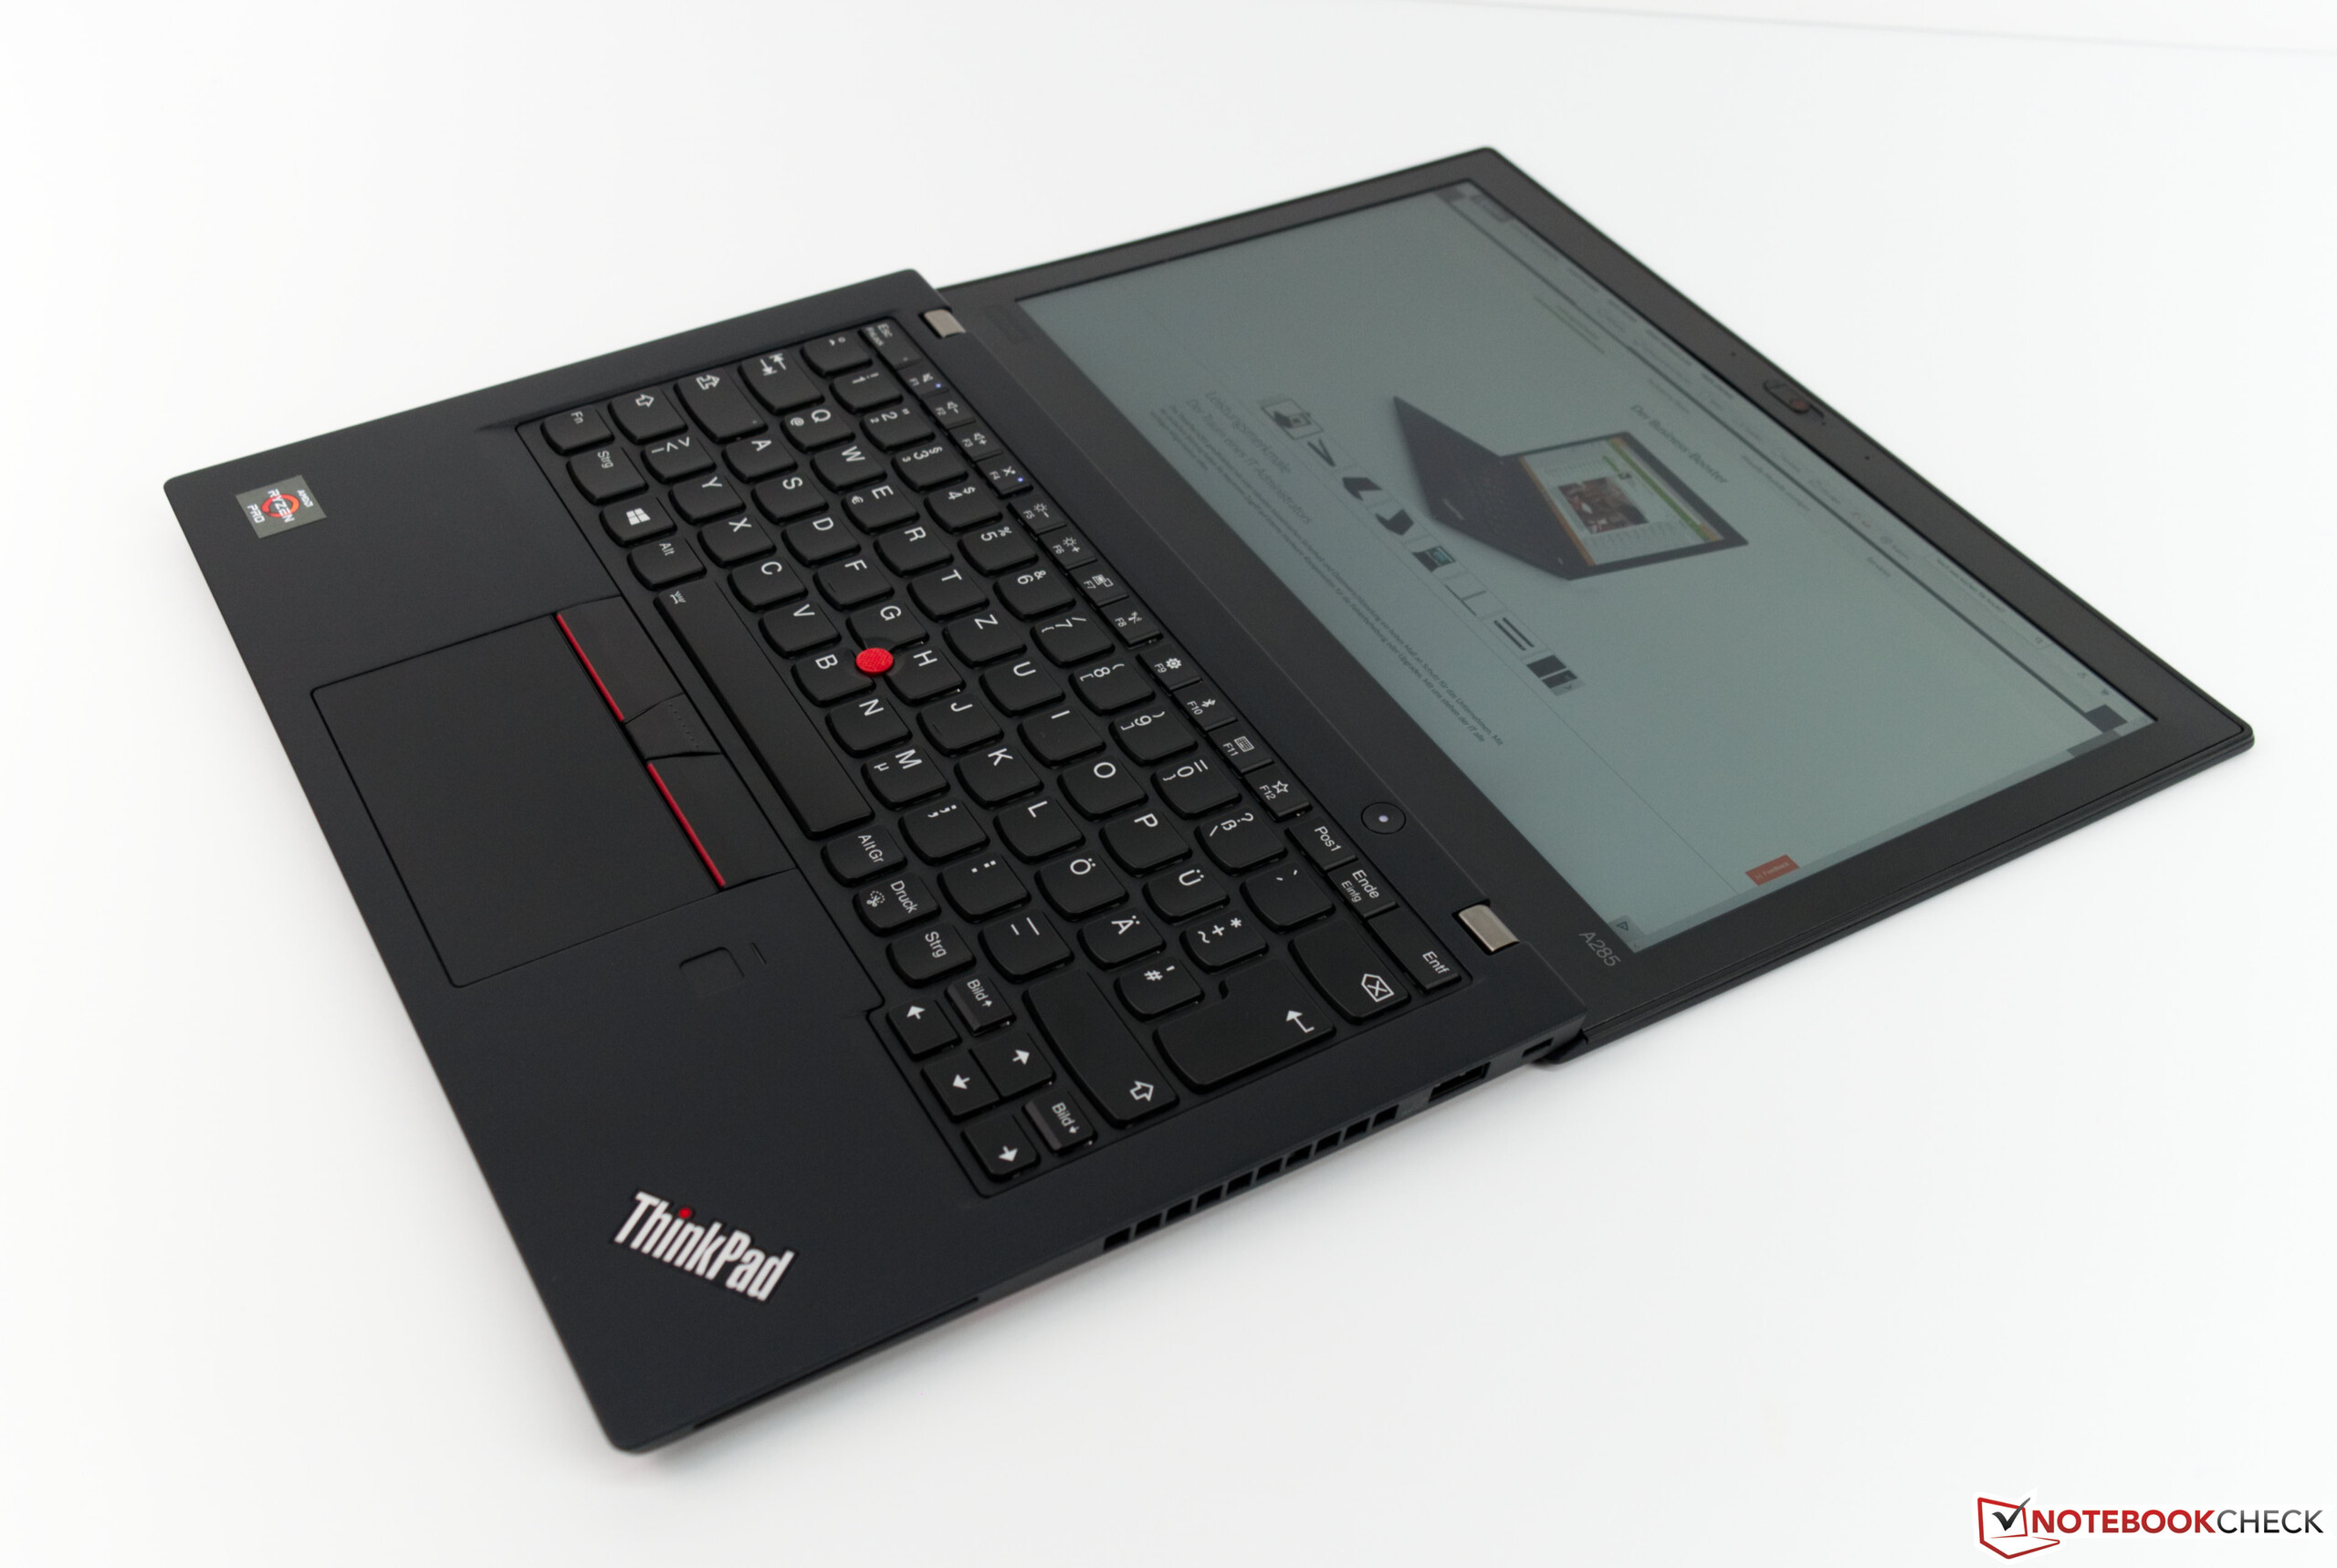
Nosso modelo de teste do Lenovo ThinkPad A285 é vendido por 1439 Euros (~$1640). Gostamos particularmente dos excelentes dispositivos de entrada, e o SSD PCIe de 256 GB garante altas taxas de transferência para um bom desempenho do sistema. O chassi robusto e de alta qualidade completa o pacote. Ele inclina a balança em apenas 1,1 kg (~2,4 lb), para que você possa carregá-lo facilmente ou colocá-lo em sua bolsa.
O Lenovo ThinkPad A285 é um bom dispositivo de escritório baseado em um processador AMD e se beneficia do preço mais baixo comparado ao X280. O A285 é uma boa opção se você não precisar do desempenho adicional da CPU do X280 ou dos tempos de duração mais longos da bateria.
Ainda existem algumas desvantagens, como o aumento do consumo no modo inativo, que afeta o tempo de duração da bateria em comparação com o X280. A tela em nosso modelo de teste também é um pouco pior, mas isso é resultado da loteria de paineis da Lenovo. O fabricante conta com diferentes fornecedores e você nunca sabe qual painel você obterá antes da compra.
A memória soldada é definitivamente um mau desenvolvimento para dispositivos comerciais e você não pode atualizá-la mais tarde. O A285 também não possui suporte para Thunderbolt 3 do X280. Ainda assim, a impressão geral do dispositivo é boa e podemos recomendá-lo. Ainda vamos ver se os usuários estão dispostos a mudar para um sistema AMD para seu dispositivo de negócios, mas o preço mais baixo é
Lenovo ThinkPad A285-20MX0002GE
- 01/06/2019 v6 (old)
Sebastian Bade
Price comparison
