Breve Análise do Portátil Lenovo ThinkPad X280 (i5-8250U, FHD)
| SD Card Reader | |
| average JPG Copy Test (av. of 3 runs) | |
| Lenovo ThinkPad X1 Carbon 2018-20KGS03900 (Toshiba Exceria Pro M501) | |
| HP EliteBook 820 G4 Z2V72ET (Toshiba Exceria Pro SDXC 64 GB UHS-II) | |
| Dell Latitude 7280 (Toshiba THN-M401S0640E2) | |
| Lenovo ThinkPad X280-20KES01S00 (Toshiba Excerie Pro M501) | |
| Dell Latitude 13 7380 (Toshiba Exceria Pro SDXC 64 GB UHS-II) | |
| Média da turma Subnotebook (23.7 - 188, n=9, últimos 2 anos) | |
| Lenovo ThinkPad X270-20HMS00T00 (Toshiba Exceria Pro SDXC 64 GB UHS-II) | |
| maximum AS SSD Seq Read Test (1GB) | |
| Lenovo ThinkPad X1 Carbon 2018-20KGS03900 (Toshiba Exceria Pro M501) | |
| Média da turma Subnotebook (24.9 - 195, n=8, últimos 2 anos) | |
| Dell Latitude 7280 (Toshiba THN-M401S0640E2) | |
| Lenovo ThinkPad X270-20HMS00T00 (Toshiba Exceria Pro SDXC 64 GB UHS-II) | |
| Dell Latitude 13 7380 (Toshiba Exceria Pro SDXC 64 GB UHS-II) | |
| HP EliteBook 820 G4 Z2V72ET (Toshiba Exceria Pro SDXC 64 GB UHS-II) | |
| Lenovo ThinkPad X280-20KES01S00 (Toshiba Excerie Pro M501) | |
| |||||||||||||||||||||||||
iluminação: 82 %
iluminação com acumulador: 336 cd/m²
Contraste: 1376:1 (Preto: 0.25 cd/m²)
ΔE ColorChecker Calman: 4.7 | ∀{0.5-29.43 Ø4.71}
ΔE Greyscale Calman: 2.2 | ∀{0.09-98 Ø4.96}
64.1% sRGB (Argyll 1.6.3 3D)
41.2% AdobeRGB 1998 (Argyll 1.6.3 3D)
45.45% AdobeRGB 1998 (Argyll 3D)
64.5% sRGB (Argyll 3D)
44% Display P3 (Argyll 3D)
Gamma: 2.16
CCT: 6252 K
| Lenovo ThinkPad X280-20KES01S00 B125HAN02.2, , 1920x1080, 12.5" | Lenovo ThinkPad X270-20HMS00T00 Innolux N125HCE-GN1, , 1920x1080, 12.5" | HP EliteBook 820 G4 Z2V72ET Chi Mei, , 1920x1080, 12.5" | Dell Latitude 7280 AUO236D , , 1920x1080, 12.5" | Lenovo ThinkPad X1 Carbon 2018-20KGS03900 B140QAN02.0, , 2560x1440, 14" | Dell Latitude 13 7380 LGD0589, , 1920x1080, 13.3" | |
|---|---|---|---|---|---|---|
| Display | 1% | 1% | 1% | 91% | 45% | |
| Display P3 Coverage (%) | 44 | 44.6 1% 44.6 1% | 44.45 1% | 44.41 1% | 87.7 99% | 65.5 49% |
| sRGB Coverage (%) | 64.5 | 65.9 2% 65.9 2% | 65.5 2% | 65.4 1% | 100 55% | 91.8 42% |
| AdobeRGB 1998 Coverage (%) | 45.45 | 46.11 1% 46.11 1% | 46.04 1% | 45.9 1% | 99.9 120% | 65.8 45% |
| Response Times | -3% | 12% | 7% | -32% | 8% | |
| Response Time Grey 50% / Grey 80% * (ms) | 40 ? | 40.8 ? -2% | 35 ? 12% | 32.4 ? 19% | 59.2 ? -48% | 34 ? 15% |
| Response Time Black / White * (ms) | 29.6 ? | 30.4 ? -3% | 26 ? 12% | 31.2 ? -5% | 34.4 ? -16% | 29.6 ? -0% |
| PWM Frequency (Hz) | 26040 ? | |||||
| Screen | -21% | -24% | -23% | 38% | -20% | |
| Brightness middle (cd/m²) | 344 | 283 -18% | 326 -5% | 310.4 -10% | 578 68% | 317 -8% |
| Brightness (cd/m²) | 313 | 281 -10% | 304 -3% | 301 -4% | 533 70% | 295 -6% |
| Brightness Distribution (%) | 82 | 94 15% | 81 -1% | 88 7% | 84 2% | 87 6% |
| Black Level * (cd/m²) | 0.25 | 0.25 -0% | 0.29 -16% | 0.32 -28% | 0.38 -52% | 0.3 -20% |
| Contrast (:1) | 1376 | 1132 -18% | 1124 -18% | 970 -30% | 1521 11% | 1057 -23% |
| Colorchecker dE 2000 * | 4.7 | 6.1 -30% | 6.49 -38% | 5.9 -26% | 1.9 60% | 6.3 -34% |
| Colorchecker dE 2000 max. * | 19.4 | 15.4 21% | 15.95 18% | 21 -8% | 3.8 80% | 10.4 46% |
| Greyscale dE 2000 * | 2.2 | 6 -173% | 6.16 -180% | 5.1 -132% | 3 -36% | 7.8 -255% |
| Gamma | 2.16 102% | 2.05 107% | 2.32 95% | 2.33 94% | 2.14 103% | 1.81 122% |
| CCT | 6252 104% | 6832 95% | 7575 86% | 6816 95% | 6377 102% | 7120 91% |
| Color Space (Percent of AdobeRGB 1998) (%) | 41.2 | 42.26 3% | 42 2% | 42 2% | 88.8 116% | 61 48% |
| Color Space (Percent of sRGB) (%) | 64.1 | 65.43 2% | 65 1% | 65 1% | 100 56% | 92 44% |
| Colorchecker dE 2000 calibrated * | 0.8 | |||||
| Média Total (Programa/Configurações) | -8% /
-11% | -4% /
-14% | -5% /
-14% | 32% /
39% | 11% /
-3% |
* ... menor é melhor
Exibir tempos de resposta
| ↔ Tempo de resposta preto para branco | ||
|---|---|---|
| 29.6 ms ... ascensão ↗ e queda ↘ combinadas | ↗ 16.4 ms ascensão | 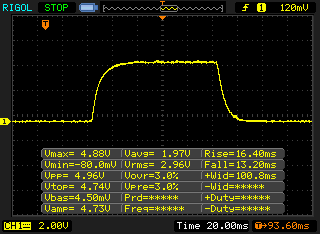 |
| ↘ 13.2 ms queda | ||
| A tela mostra taxas de resposta relativamente lentas em nossos testes e pode ser muito lenta para os jogadores. Em comparação, todos os dispositivos testados variam de 0.1 (mínimo) a 240 (máximo) ms. » 79 % de todos os dispositivos são melhores. Isso significa que o tempo de resposta medido é pior que a média de todos os dispositivos testados (19.8 ms). | ||
| ↔ Tempo de resposta 50% cinza a 80% cinza | ||
| 40 ms ... ascensão ↗ e queda ↘ combinadas | ↗ 22 ms ascensão | 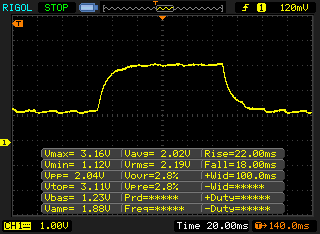 |
| ↘ 18 ms queda | ||
| A tela mostra taxas de resposta lentas em nossos testes e será insatisfatória para os jogadores. Em comparação, todos os dispositivos testados variam de 0.165 (mínimo) a 636 (máximo) ms. » 61 % de todos os dispositivos são melhores. Isso significa que o tempo de resposta medido é pior que a média de todos os dispositivos testados (31 ms). | ||
Cintilação da tela / PWM (modulação por largura de pulso)
| Tela tremeluzindo / PWM não detectado | 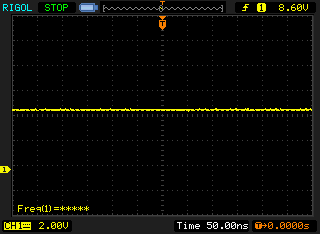 | ||
[pwm_comparison] Em comparação: 52 % de todos os dispositivos testados não usam PWM para escurecer a tela. Se PWM foi detectado, uma média de 7754 (mínimo: 5 - máximo: 343500) Hz foi medida. | |||
| PCMark 8 Home Score Accelerated v2 | 3574 pontos | |
| PCMark 8 Work Score Accelerated v2 | 4868 pontos | |
| PCMark 10 Score | 3860 pontos | |
Ajuda | ||
| Lenovo ThinkPad X280-20KES01S00 Samsung SSD PM981 MZVLB512HAJQ | Lenovo ThinkPad X270-20HMS00T00 Toshiba NVMe THNSF5512GPUK | HP EliteBook 820 G4 Z2V72ET Samsung PM951 NVMe MZVLV512 | Dell Latitude 7280 SanDisk X400 M.2 2280 256GB | Dell Latitude 13 7380 Samsung PM961 MZVLW256HEHP | Lenovo ThinkPad X1 Carbon 2018-20KGS03900 Samsung SSD PM981 MZVLB512HAJQ | Média Samsung SSD PM981 MZVLB512HAJQ | |
|---|---|---|---|---|---|---|---|
| AS SSD | -41% | -29% | -84% | -4% | 7% | -10% | |
| Seq Read (MB/s) | 2316 | 1374 -41% | 1393 -40% | 499.9 -78% | 1330 -43% | 2396 3% | 1976 ? -15% |
| Seq Write (MB/s) | 1385 | 931 -33% | 551 -60% | 473.3 -66% | 805 -42% | 1376 -1% | 1637 ? 18% |
| 4K Read (MB/s) | 47.2 | 42.16 -11% | 38.81 -18% | 27.92 -41% | 45.59 -3% | 52.4 11% | 50.5 ? 7% |
| 4K Write (MB/s) | 105.3 | 100.5 -5% | 125.3 19% | 53.6 -49% | 125.1 19% | 134.3 28% | 112 ? 6% |
| 4K-64 Read (MB/s) | 1218 | 450.6 -63% | 749 -39% | 354.6 -71% | 2072 70% | 876 -28% | 1203 ? -1% |
| 4K-64 Write (MB/s) | 1309 | 375 -71% | 495.1 -62% | 119.1 -91% | 484.5 -63% | 1529 17% | 1504 ? 15% |
| Access Time Read * (ms) | 0.041 | 0.062 -51% | 0.041 -0% | 0.117 -185% | 0.045 -10% | 0.029 29% | 0.05092 ? -24% |
| Access Time Write * (ms) | 0.036 | 0.035 3% | 0.029 19% | 0.076 -111% | 0.028 22% | 0.027 25% | 0.08337 ? -132% |
| Score Read (Points) | 1497 | 630 -58% | 927 -38% | 432 -71% | 2251 50% | 1168 -22% | 1451 ? -3% |
| Score Write (Points) | 1553 | 569 -63% | 675 -57% | 220 -86% | 690 -56% | 1801 16% | 1780 ? 15% |
| Score Total (Points) | 3774 | 1513 -60% | 2043 -46% | 881 -77% | 4063 8% | 3529 -6% | 3966 ? 5% |
* ... menor é melhor

| 3DMark 11 Performance | 2029 pontos | |
| 3DMark Cloud Gate Standard Score | 8541 pontos | |
| 3DMark Fire Strike Score | 1107 pontos | |
Ajuda | ||
| baixo | média | alto | ultra | |
|---|---|---|---|---|
| BioShock Infinite (2013) | 70.1 | 36.69 | 30.85 | 10.15 |
| Rise of the Tomb Raider (2016) | 21.56 | |||
| Civilization 6 (2016) | 43.14 | 15.84 |
Barulho
| Ocioso |
| 29.2 / 29.2 / 29.2 dB |
| Carga |
| 39.7 / 39.7 dB |
 | ||
30 dB silencioso 40 dB(A) audível 50 dB(A) ruidosamente alto |
||
min: | ||
(±) A temperatura máxima no lado superior é 43.2 °C / 110 F, em comparação com a média de 35.9 °C / 97 F , variando de 21.4 a 59 °C para a classe Subnotebook.
(±) A parte inferior aquece até um máximo de 43.1 °C / 110 F, em comparação com a média de 39.2 °C / 103 F
(+) Em uso inativo, a temperatura média para o lado superior é 23.8 °C / 75 F, em comparação com a média do dispositivo de 30.8 °C / ### class_avg_f### F.
(+) Os apoios para as mãos e o touchpad estão atingindo a temperatura máxima da pele (34.1 °C / 93.4 F) e, portanto, não estão quentes.
(-) A temperatura média da área do apoio para as mãos de dispositivos semelhantes foi 28.2 °C / 82.8 F (-5.9 °C / -10.6 F).
Lenovo ThinkPad X280-20KES01S00 análise de áudio
(±) | o volume do alto-falante é médio, mas bom (###valor### dB)
Graves 100 - 315Hz
(-) | quase nenhum baixo - em média 17% menor que a mediana
(±) | a linearidade dos graves é média (11.8% delta para a frequência anterior)
Médios 400 - 2.000 Hz
(+) | médios equilibrados - apenas 4.1% longe da mediana
(±) | a linearidade dos médios é média (9.9% delta para frequência anterior)
Altos 2 - 16 kHz
(+) | agudos equilibrados - apenas 1.9% longe da mediana
(+) | os máximos são lineares (4.7% delta da frequência anterior)
Geral 100 - 16.000 Hz
(±) | a linearidade do som geral é média (17.7% diferença em relação à mediana)
Comparado com a mesma classe
» 49% de todos os dispositivos testados nesta classe foram melhores, 7% semelhantes, 44% piores
» O melhor teve um delta de 5%, a média foi 18%, o pior foi 53%
Comparado com todos os dispositivos testados
» 35% de todos os dispositivos testados foram melhores, 8% semelhantes, 57% piores
» O melhor teve um delta de 4%, a média foi 23%, o pior foi 134%
Lenovo ThinkPad X270-20HMS00T00 análise de áudio
(-) | alto-falantes não muito altos (###valor### dB)
Graves 100 - 315Hz
(-) | quase nenhum baixo - em média 18.8% menor que a mediana
(±) | a linearidade dos graves é média (11.1% delta para a frequência anterior)
Médios 400 - 2.000 Hz
(+) | médios equilibrados - apenas 1.5% longe da mediana
(+) | médios são lineares (5.4% delta para frequência anterior)
Altos 2 - 16 kHz
(+) | agudos equilibrados - apenas 3.1% longe da mediana
(+) | os máximos são lineares (6.4% delta da frequência anterior)
Geral 100 - 16.000 Hz
(±) | a linearidade do som geral é média (22.3% diferença em relação à mediana)
Comparado com a mesma classe
» 59% de todos os dispositivos testados nesta classe foram melhores, 9% semelhantes, 32% piores
» O melhor teve um delta de 7%, a média foi 21%, o pior foi 53%
Comparado com todos os dispositivos testados
» 65% de todos os dispositivos testados foram melhores, 6% semelhantes, 29% piores
» O melhor teve um delta de 4%, a média foi 23%, o pior foi 134%
| desligado | |
| Ocioso | |
| Carga |
|
Key:
min: | |
| Lenovo ThinkPad X280-20KES01S00 i5-8250U, UHD Graphics 620, Samsung SSD PM981 MZVLB512HAJQ, IPS LED, 1920x1080, 12.5" | Lenovo ThinkPad X270-20HMS00T00 i5-7200U, HD Graphics 620, Toshiba NVMe THNSF5512GPUK, IPS LED, 1920x1080, 12.5" | HP EliteBook 820 G4 Z2V72ET i7-7500U, HD Graphics 620, Samsung PM951 NVMe MZVLV512, IPS, 1920x1080, 12.5" | Dell Latitude 7280 i7-7600U, HD Graphics 620, SanDisk X400 M.2 2280 256GB, IPS, 1920x1080, 12.5" | Dell Latitude 13 7380 i7-7600U, HD Graphics 620, Samsung PM961 MZVLW256HEHP, IPS, 1920x1080, 13.3" | Lenovo ThinkPad X1 Carbon 2018-20KGS03900 i5-8550U, UHD Graphics 620, Samsung SSD PM981 MZVLB512HAJQ, IPS, 2560x1440, 14" | |
|---|---|---|---|---|---|---|
| Power Consumption | 5% | 23% | 13% | 17% | -31% | |
| Idle Minimum * (Watt) | 3.11 | 3.5 -13% | 2.7 13% | 4.28 -38% | 3.2 -3% | 3.8 -22% |
| Idle Average * (Watt) | 5.01 | 5.8 -16% | 4.8 4% | 5.11 -2% | 5.5 -10% | 8.9 -78% |
| Idle Maximum * (Watt) | 8.11 | 7.6 6% | 6.6 19% | 5.49 32% | 6.1 25% | 11.9 -47% |
| Load Average * (Watt) | 44.6 | 33.2 26% | 28.5 36% | 29.83 33% | 29.5 34% | 47.5 -7% |
| Load Maximum * (Watt) | 51.7 | 40.4 22% | 29 44% | 30.05 42% | 32 38% | 52.5 -2% |
* ... menor é melhor
| Lenovo ThinkPad X280-20KES01S00 i5-8250U, UHD Graphics 620, 50 Wh | Lenovo ThinkPad X270-20HMS00T00 i5-7200U, HD Graphics 620, 46 Wh | HP EliteBook 820 G4 Z2V72ET i7-7500U, HD Graphics 620, 49 Wh | Dell Latitude 7280 i7-7600U, HD Graphics 620, 60 Wh | Dell Latitude 13 7380 i7-7600U, HD Graphics 620, 60 Wh | Lenovo ThinkPad X1 Carbon 2018-20KGS03900 i5-8550U, UHD Graphics 620, 57 Wh | Média da turma Subnotebook | |
|---|---|---|---|---|---|---|---|
| Duração da bateria | -24% | 20% | 30% | 23% | -1% | 40% | |
| Reader / Idle (h) | 20.2 | 17.1 -15% | 22.4 11% | 25.9 28% | 26.6 32% | 22.1 9% | 28.6 ? 42% |
| H.264 (h) | 9.5 | 6.8 -28% | 8.9 -6% | 9.4 -1% | 15.3 ? 61% | ||
| WiFi v1.3 (h) | 8.9 | 5.4 -39% | 9.4 6% | 11.4 28% | 10.5 18% | 8.7 -2% | 14 ? 57% |
| Load (h) | 2 | 1.7 -15% | 3.4 70% | 2.7 35% | 2.4 20% | 1.8 -10% | 1.998 ? 0% |
Pro
Contra
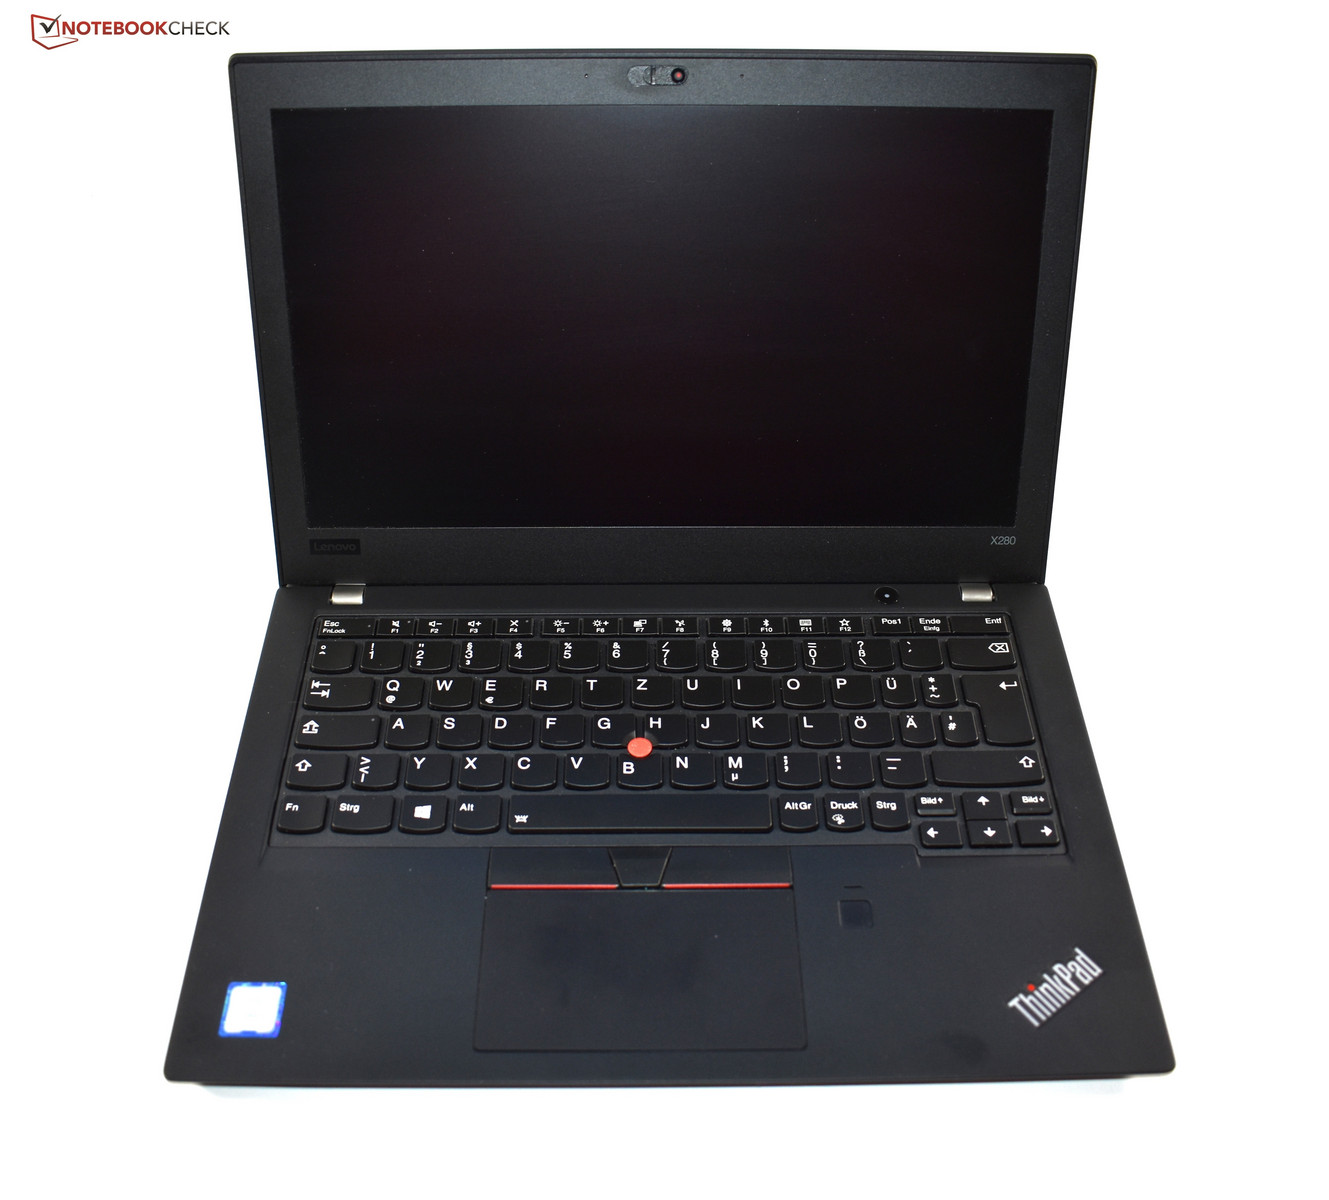
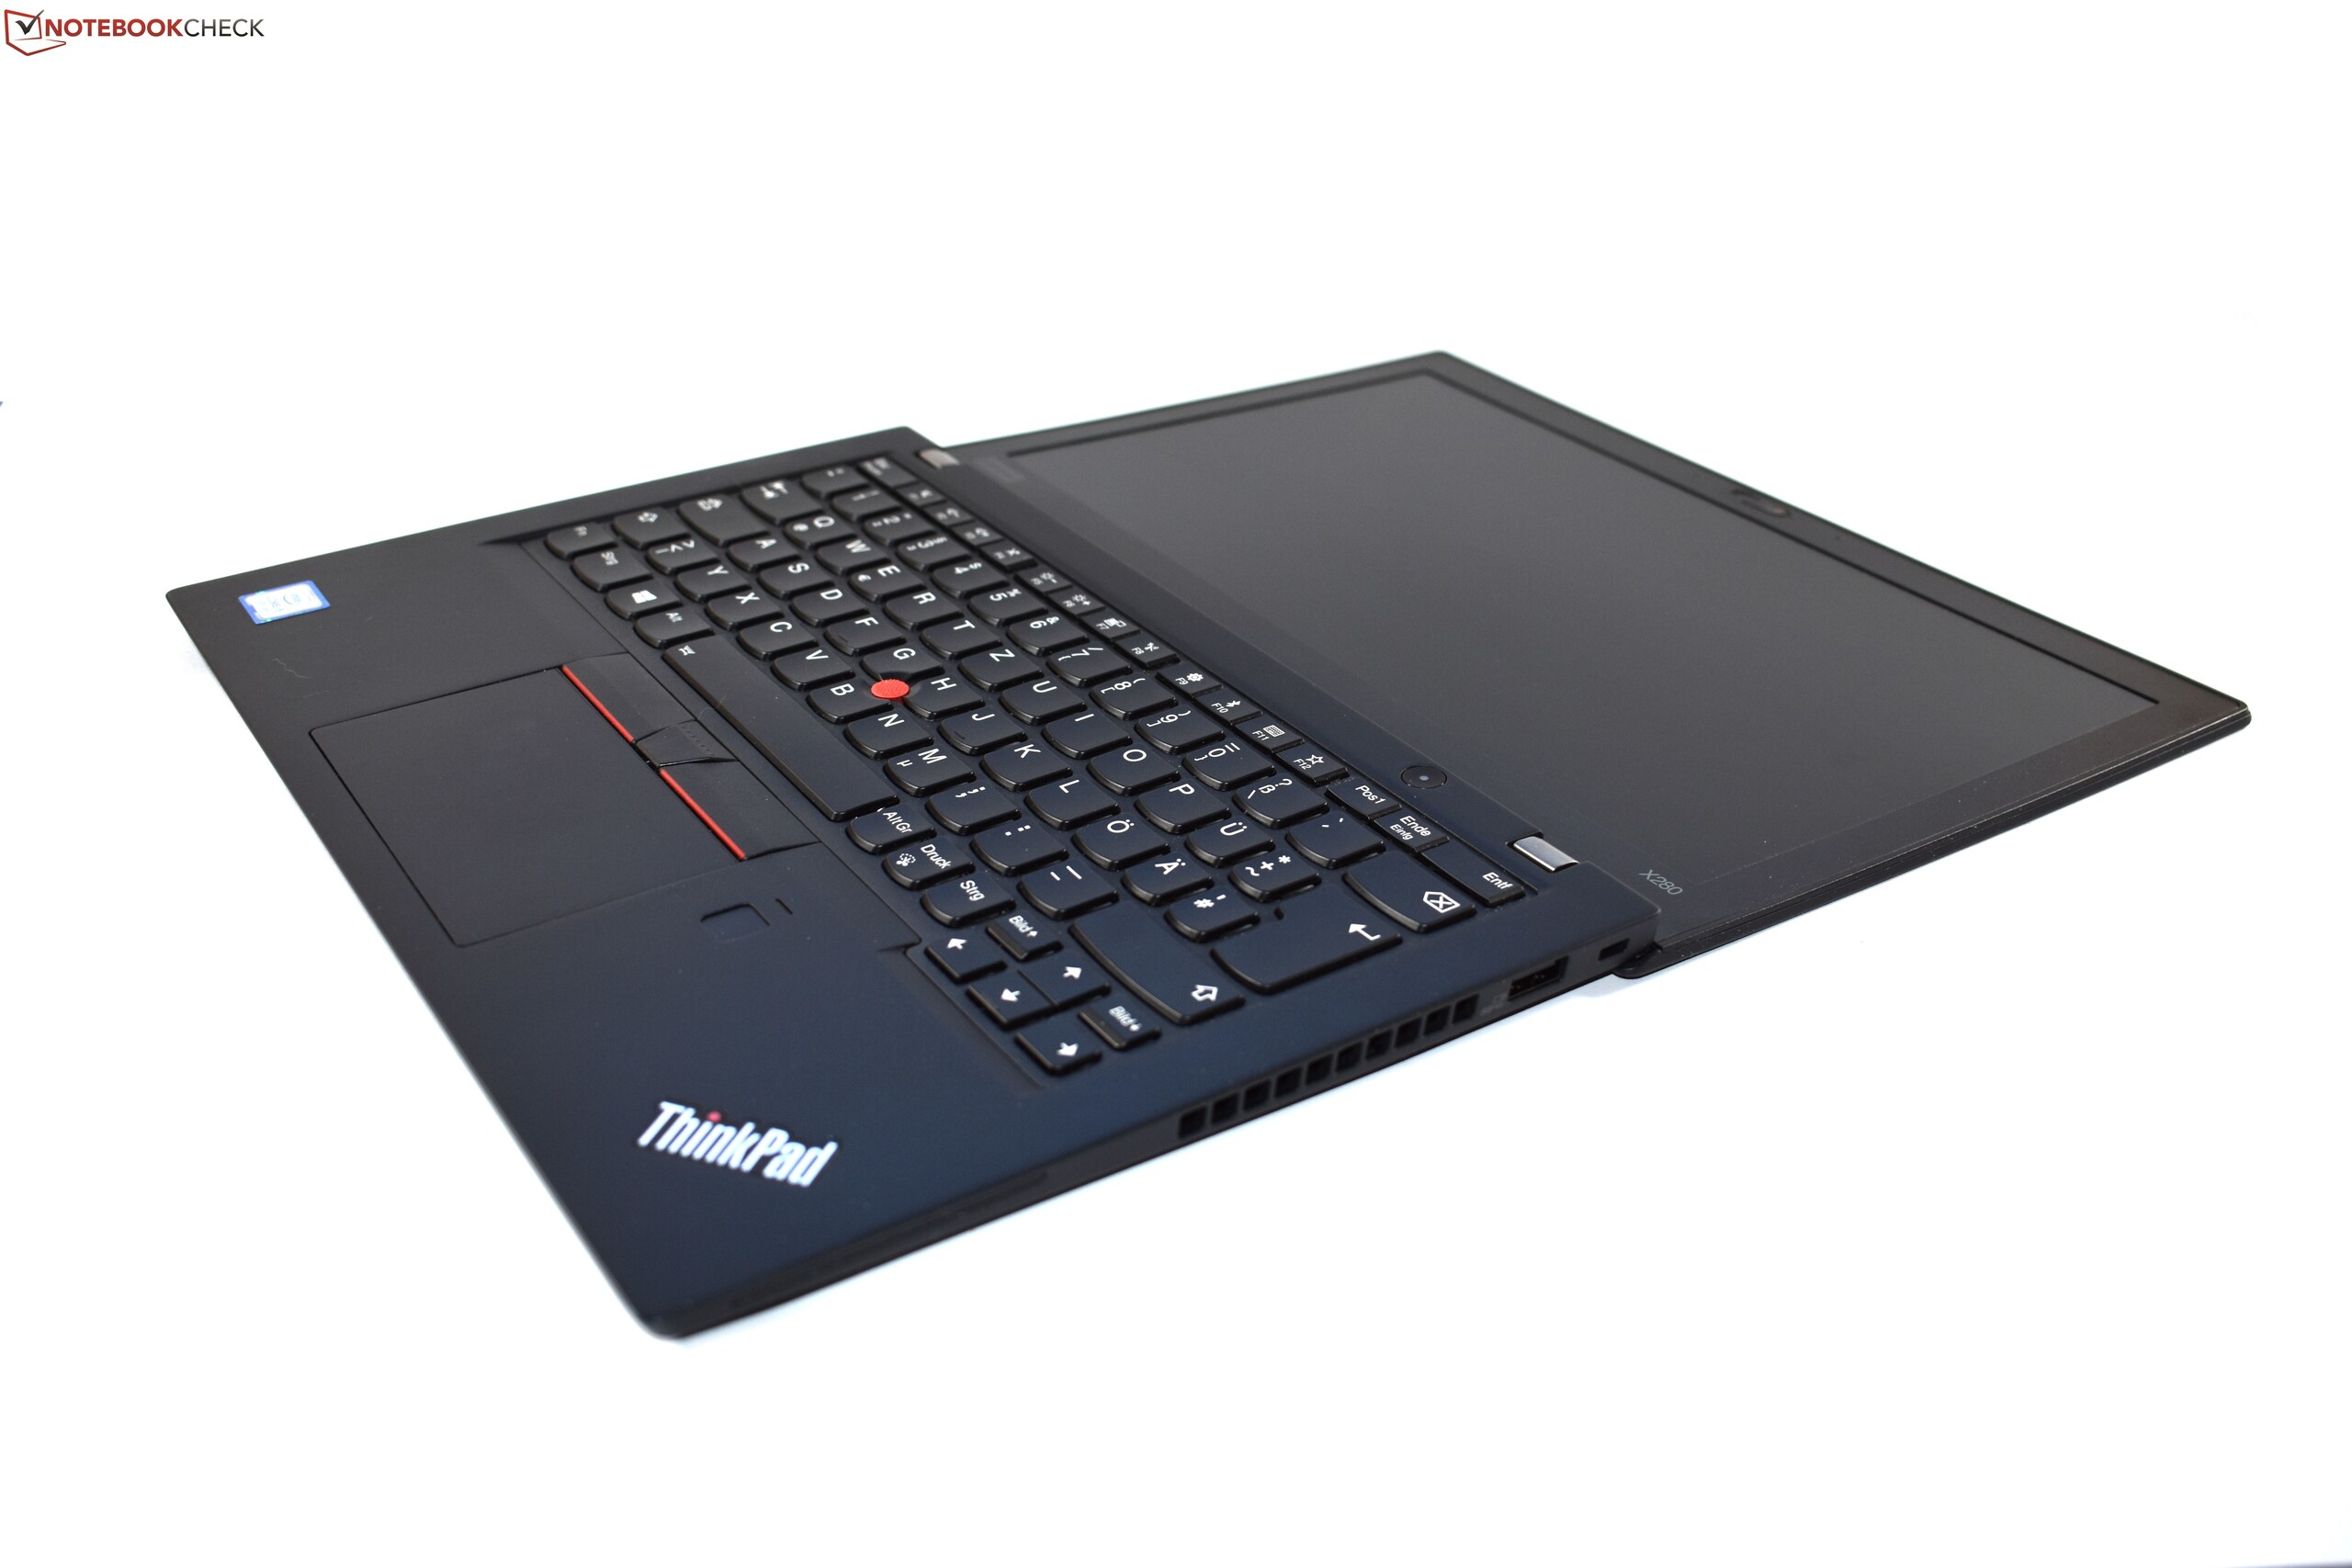
O X280 é provavelmente o redesenho mais abrangente da geração atual de ThinkPads, um fator que nos emociona sobre esse dispositivo. É um portátil conceitualmente diferente do que o ThinkPad X270, que pode assustar alguns de seus fãs. No geral, o X280 é um portátil melhor do que o antecessor.
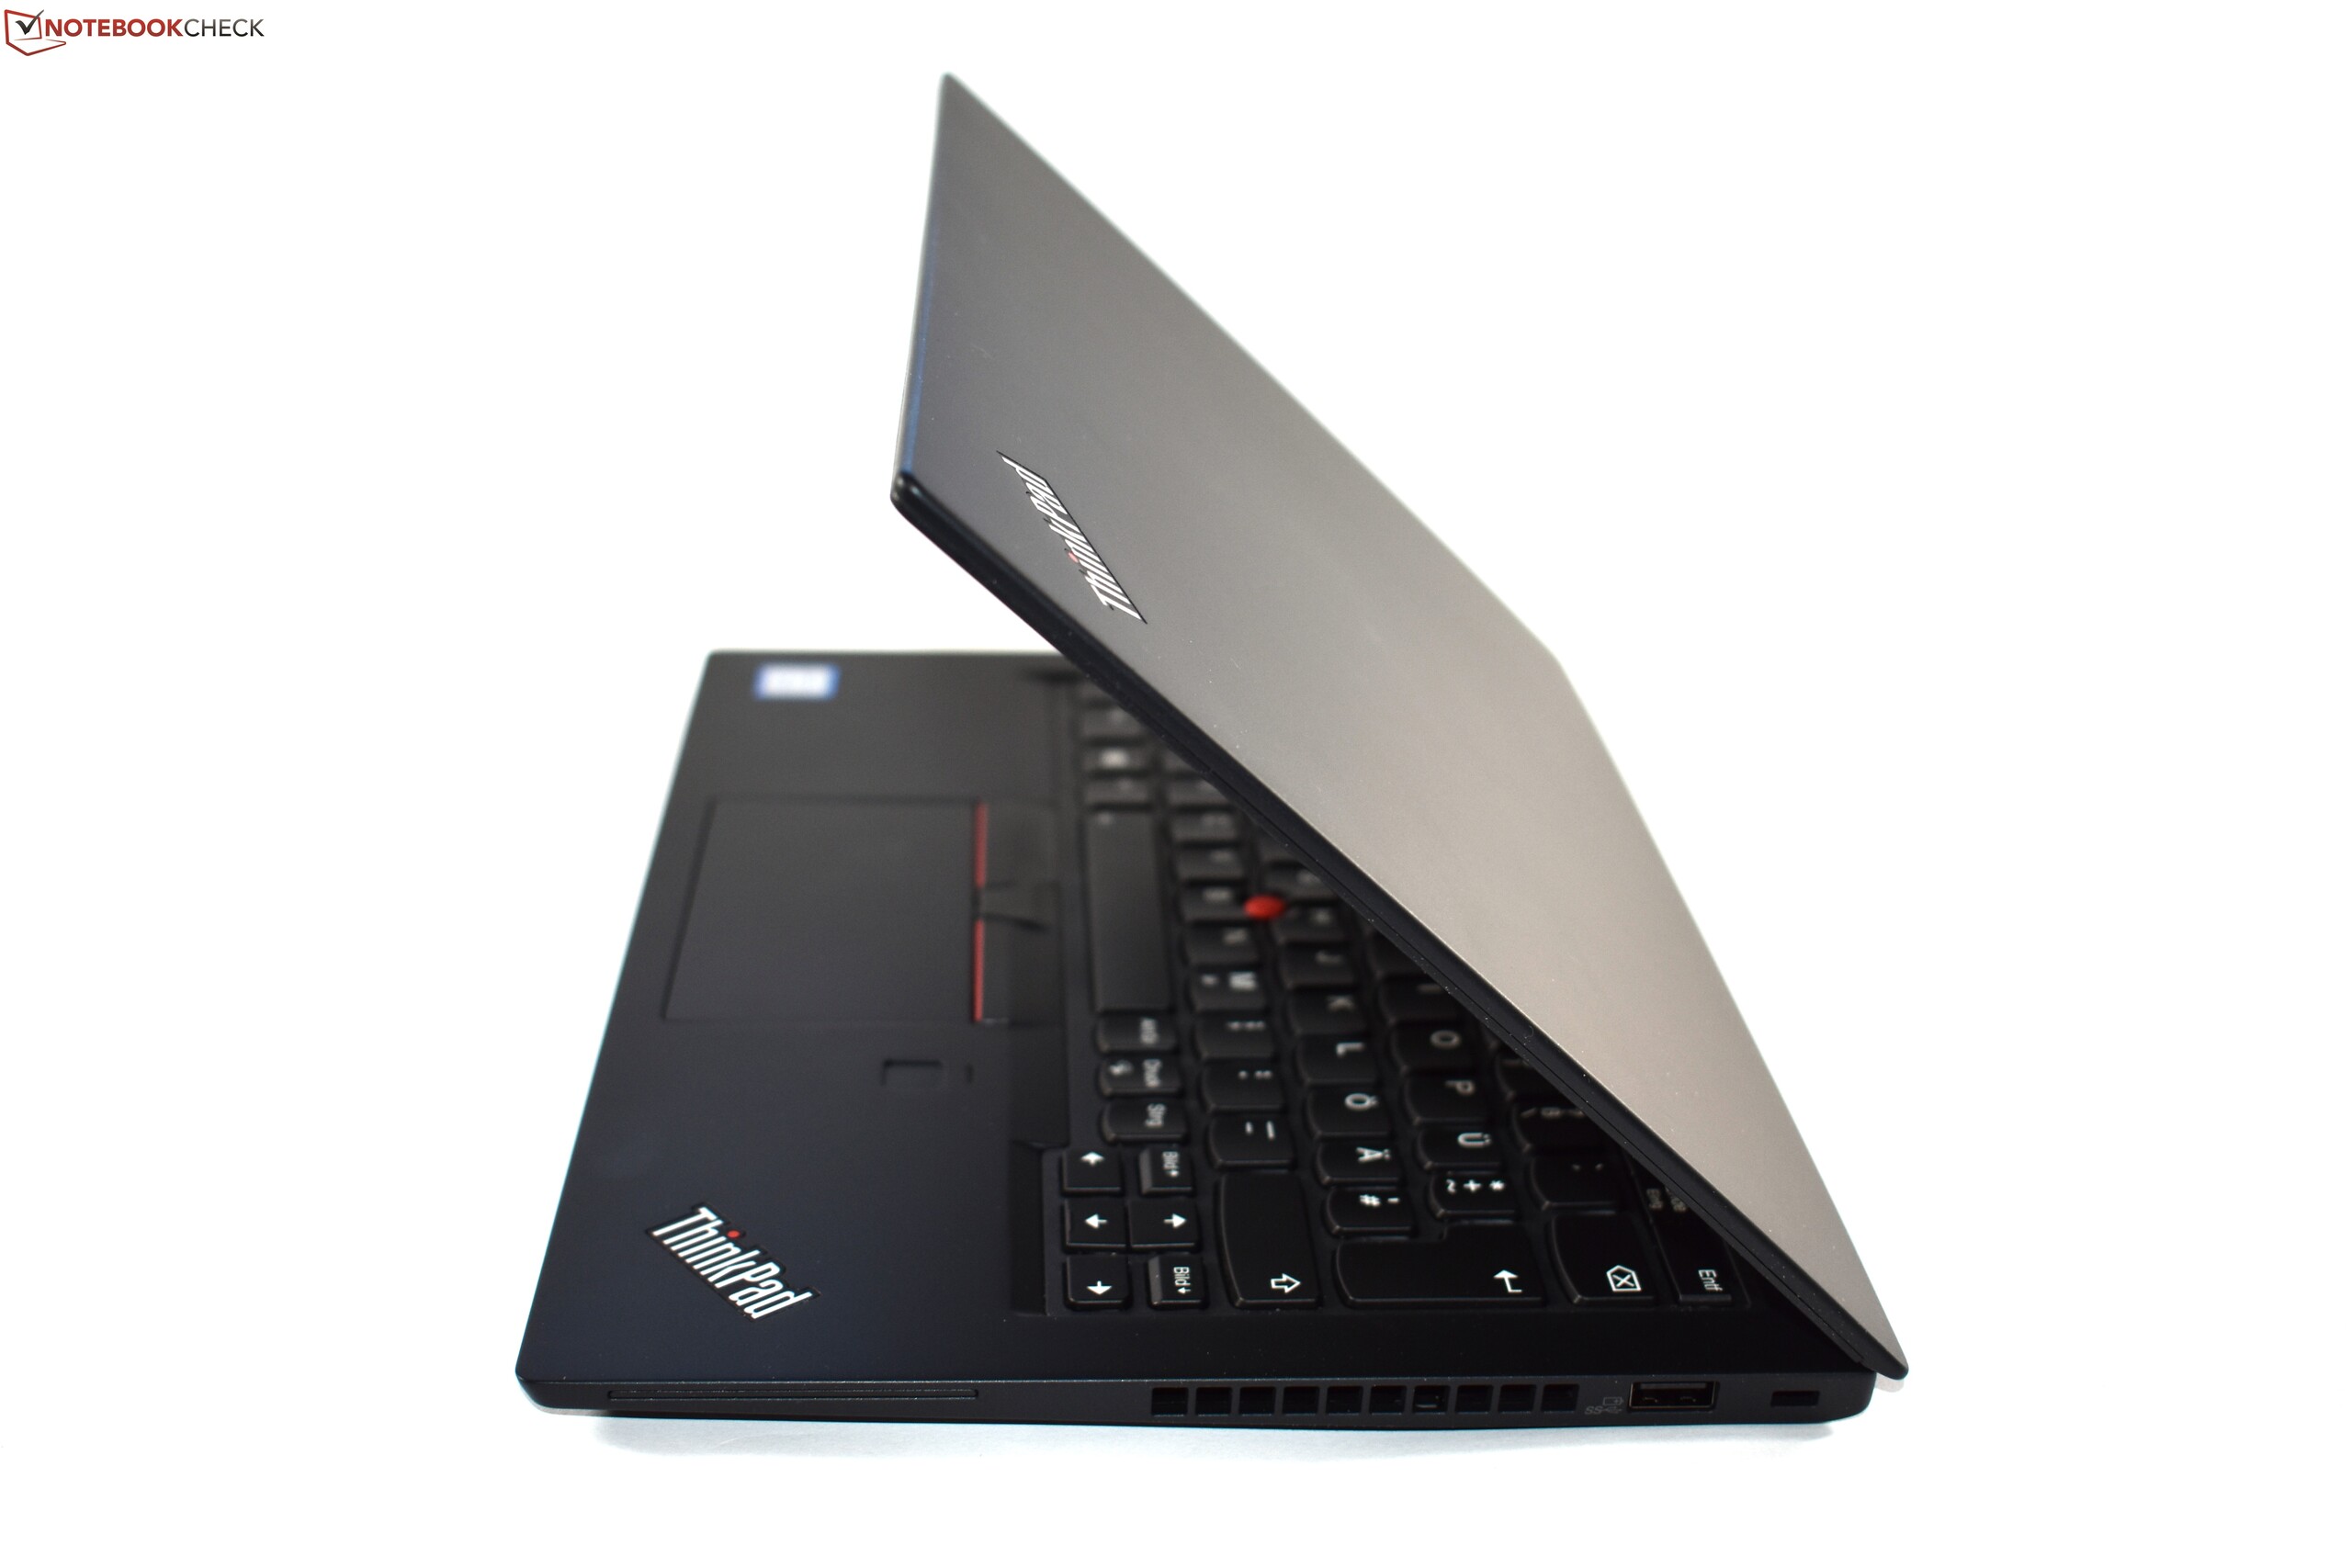
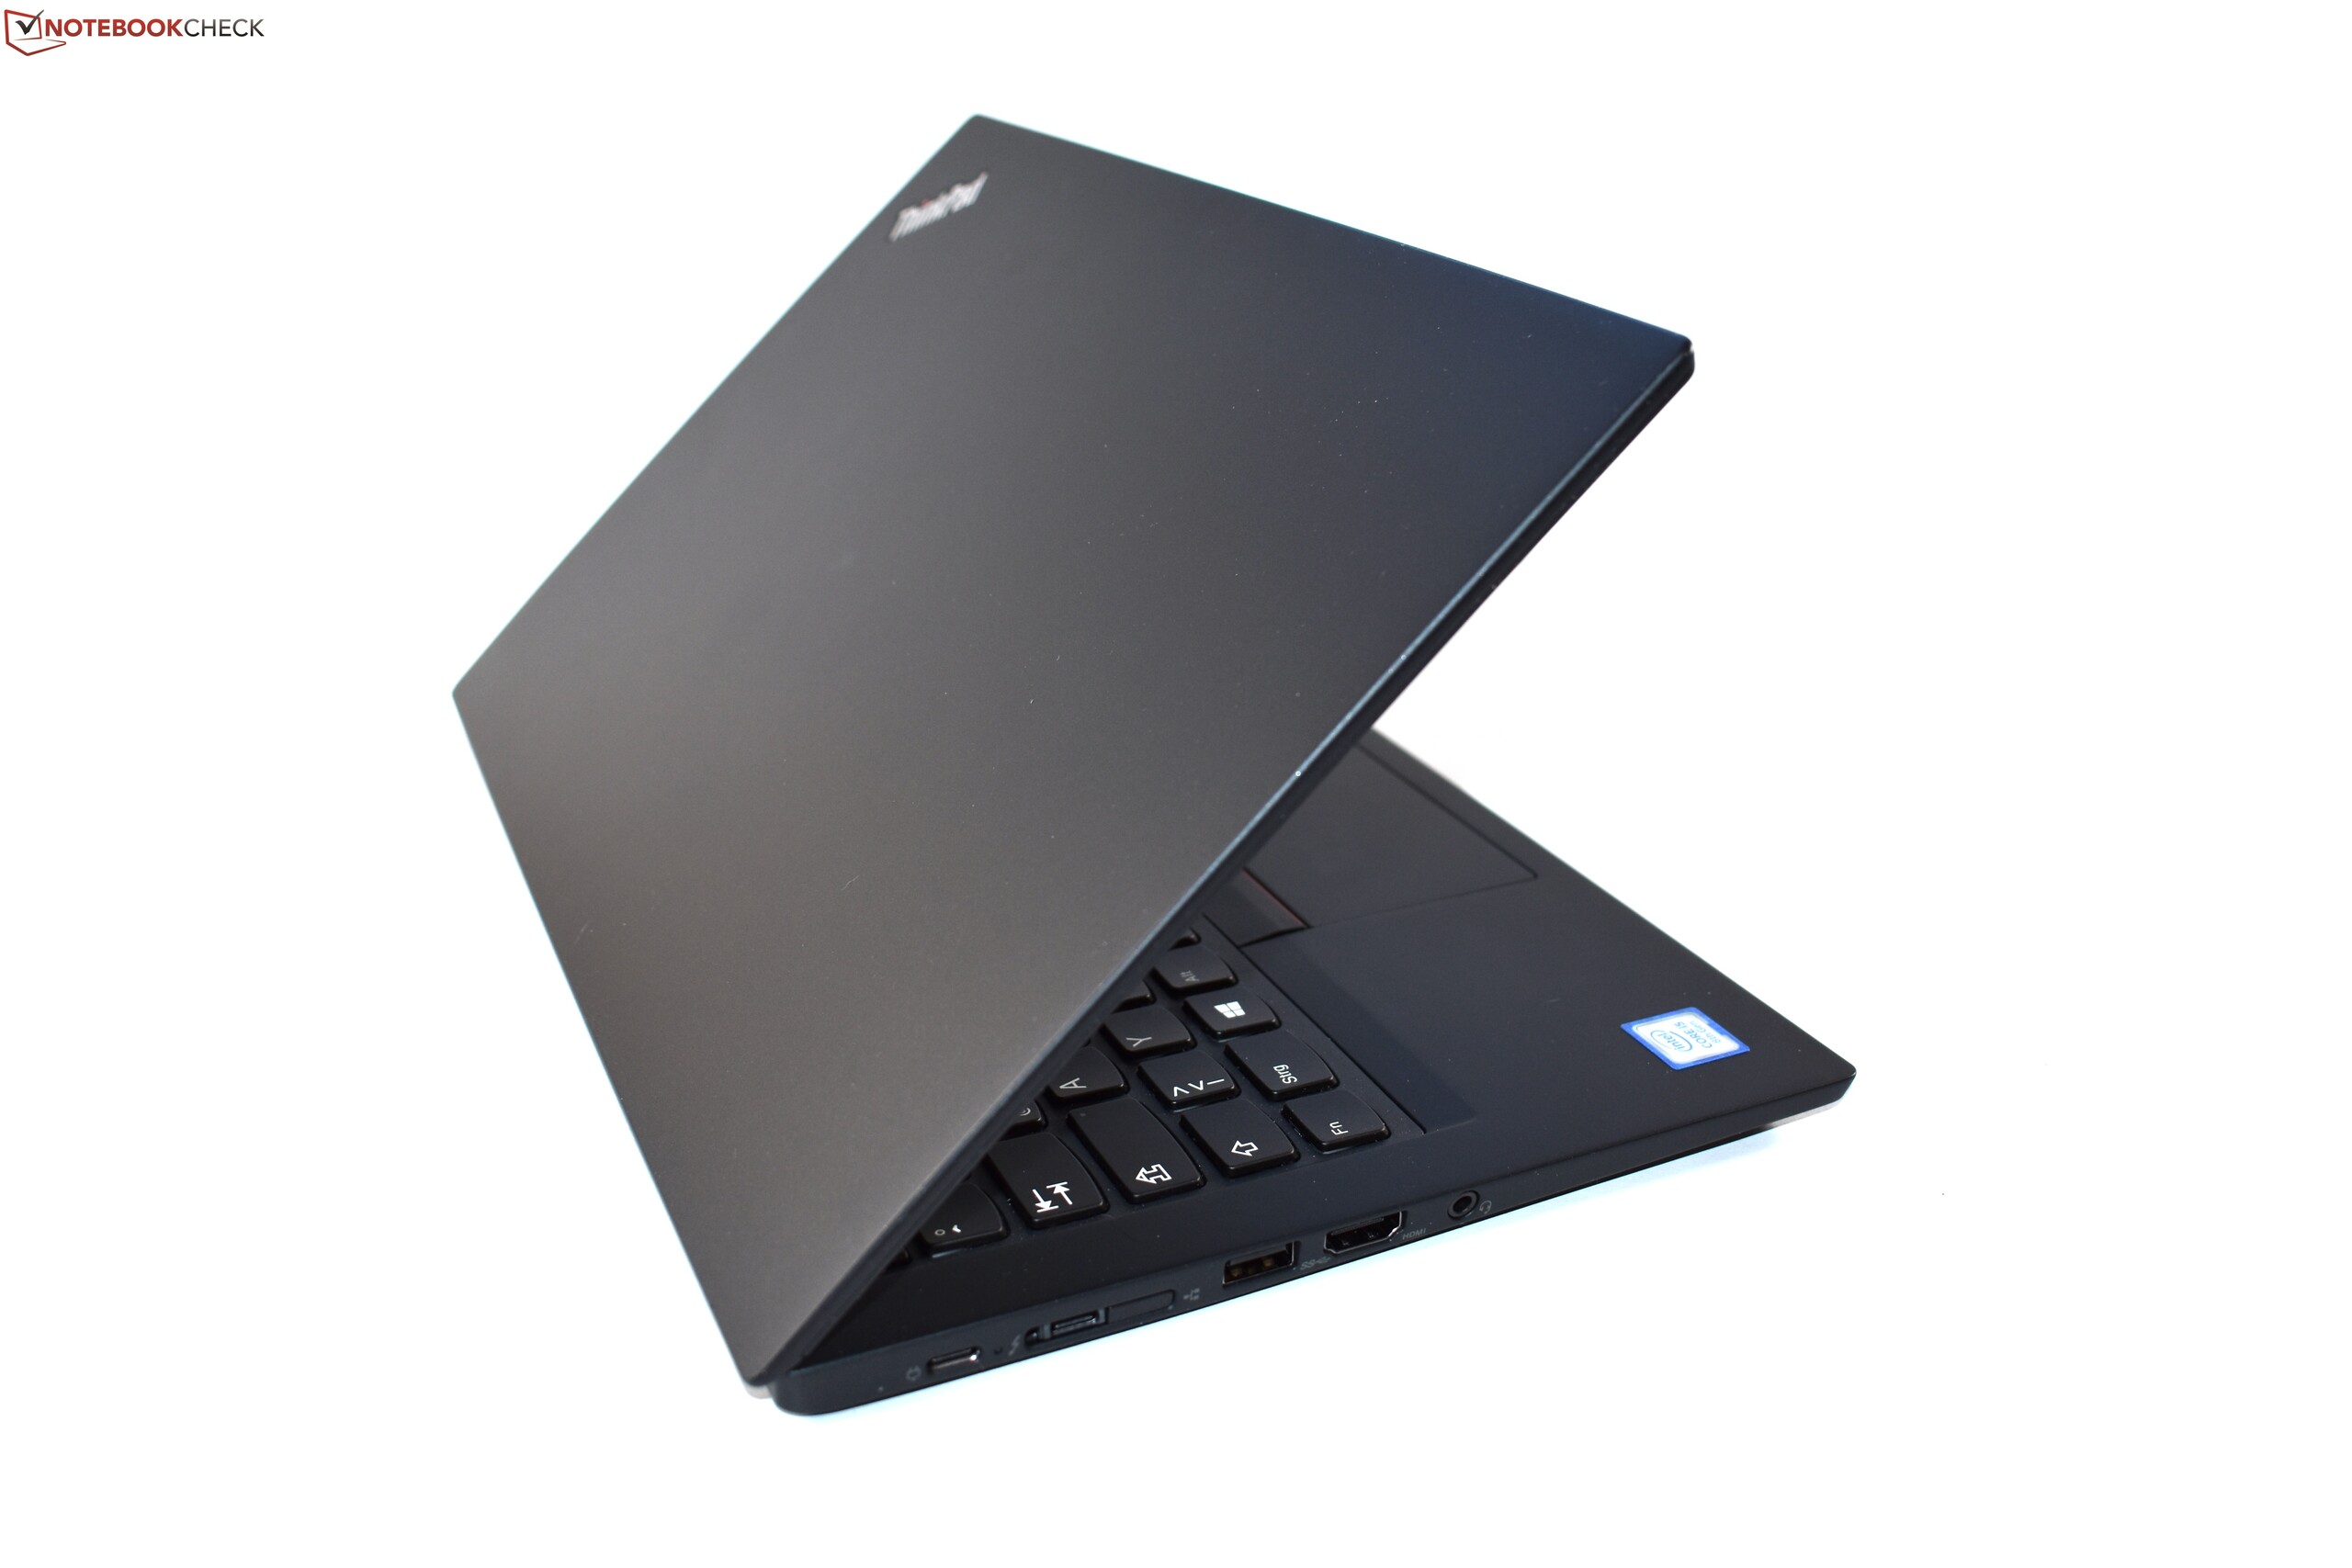
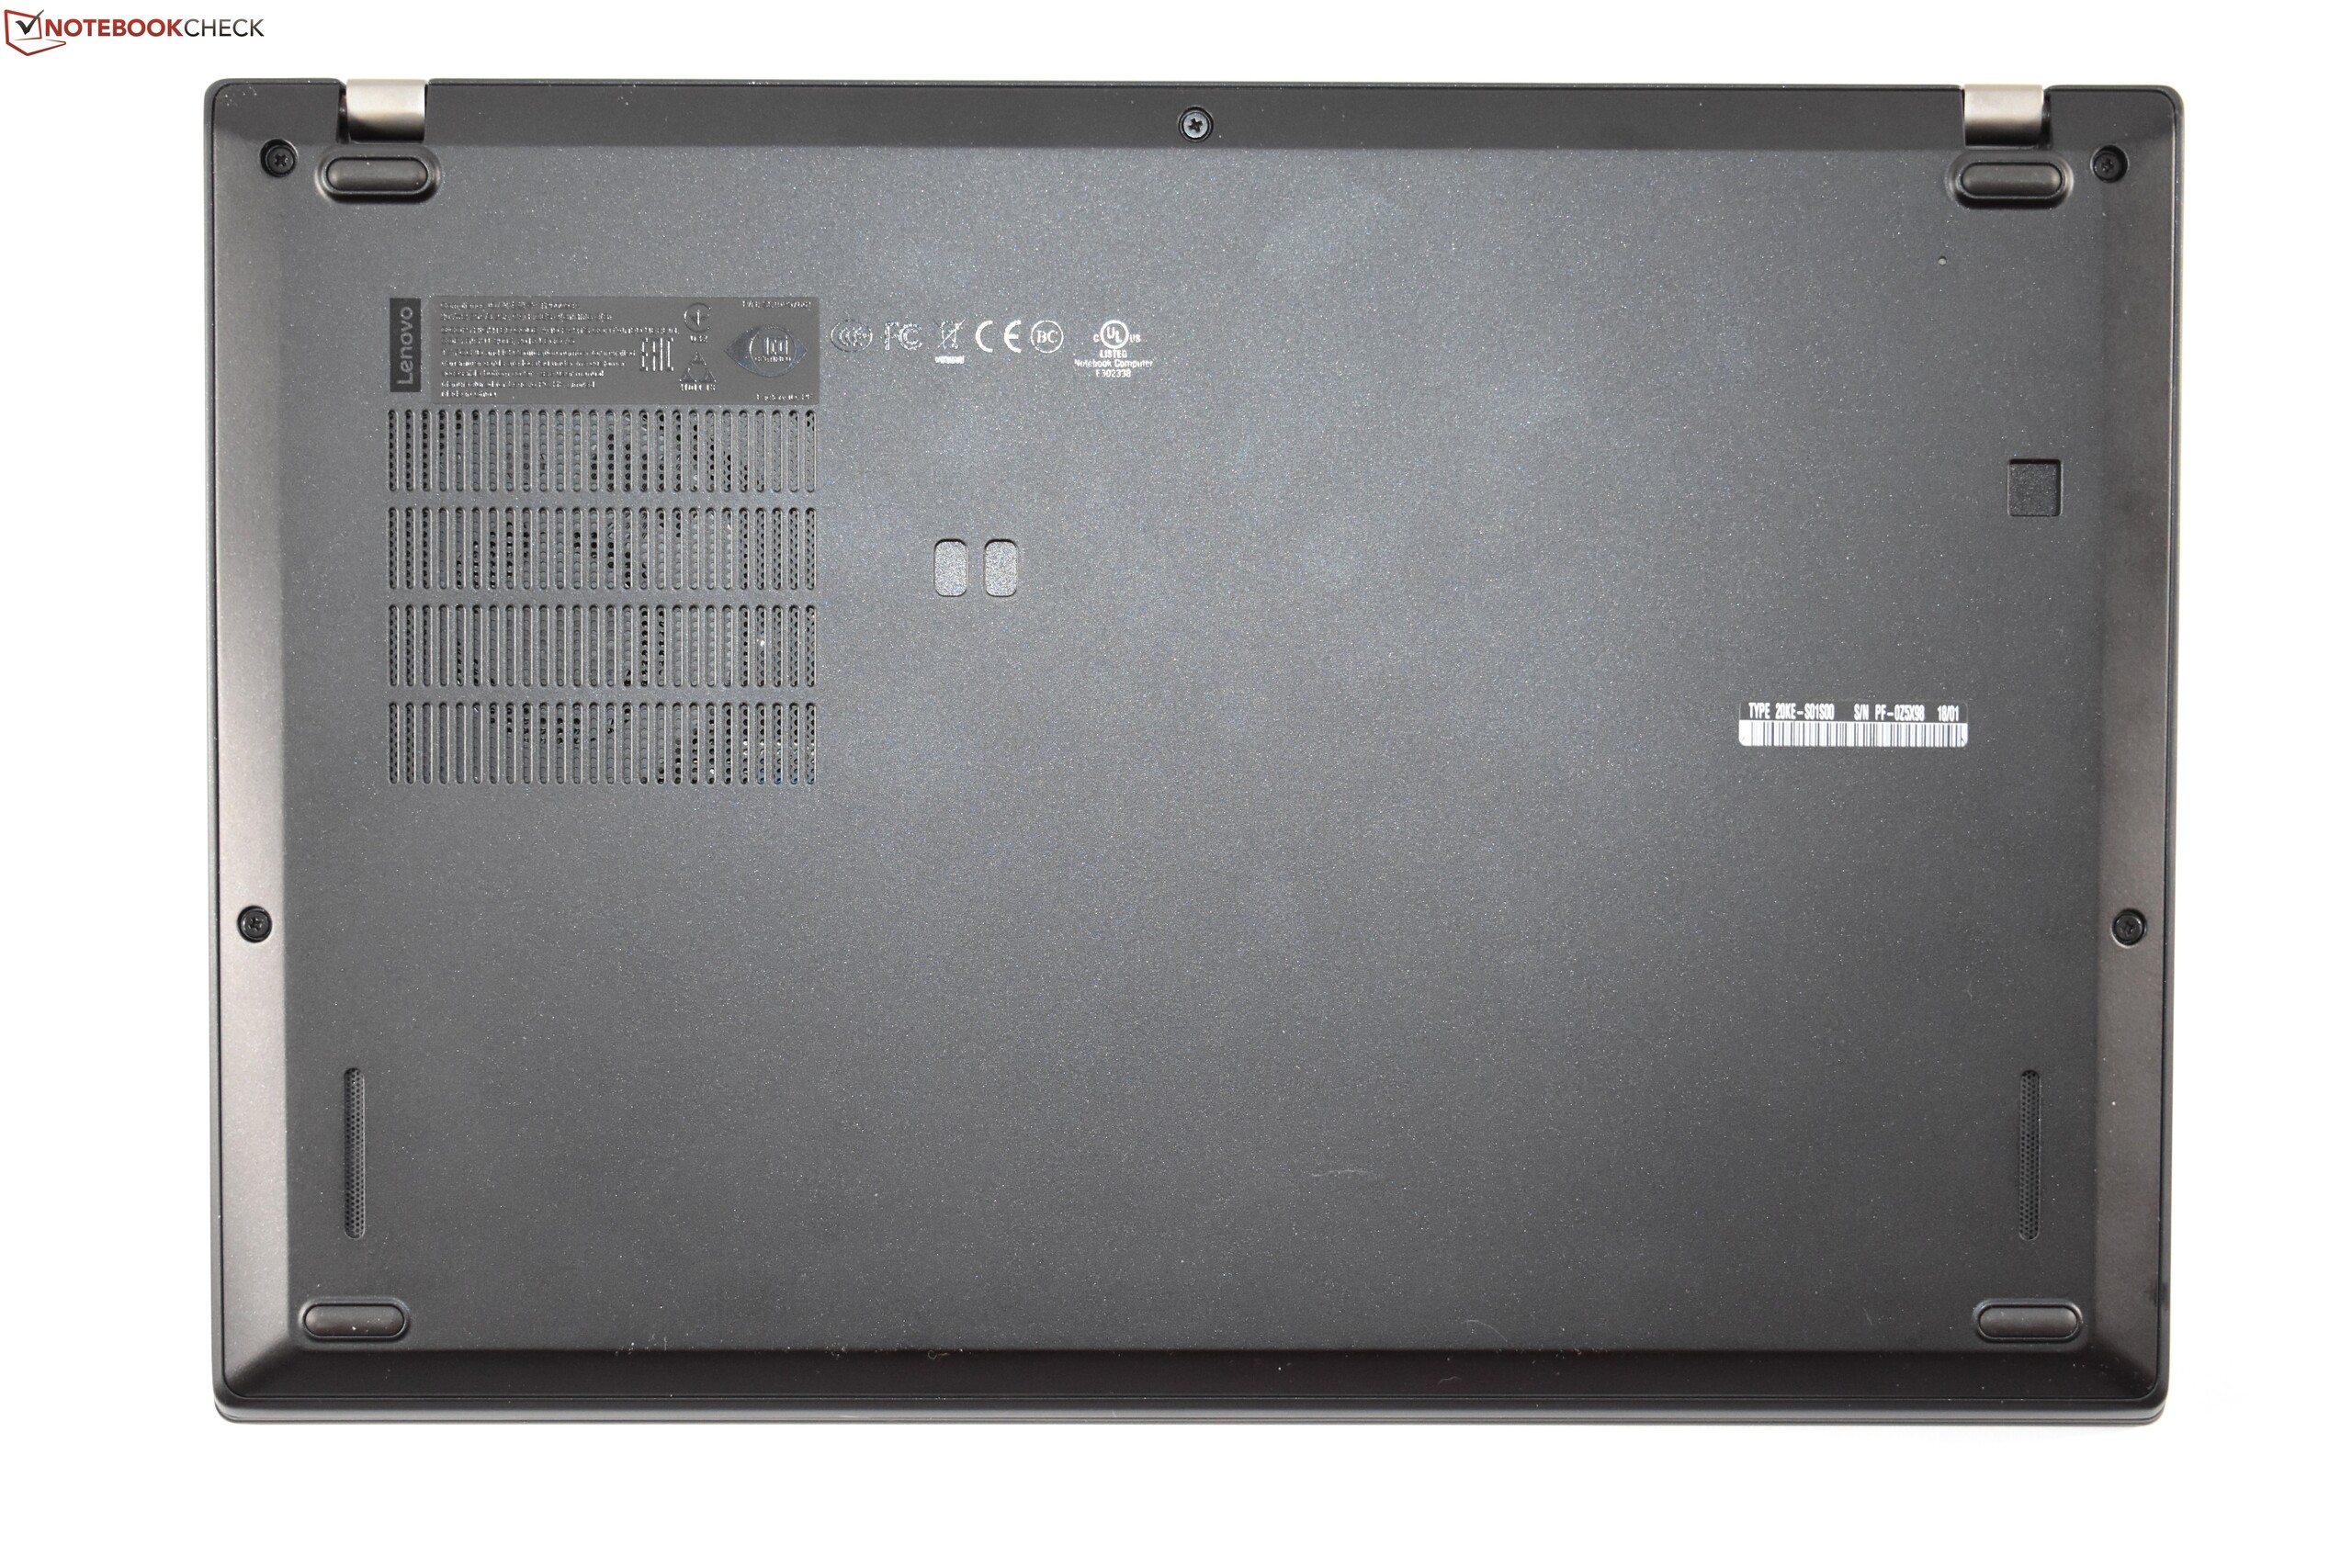
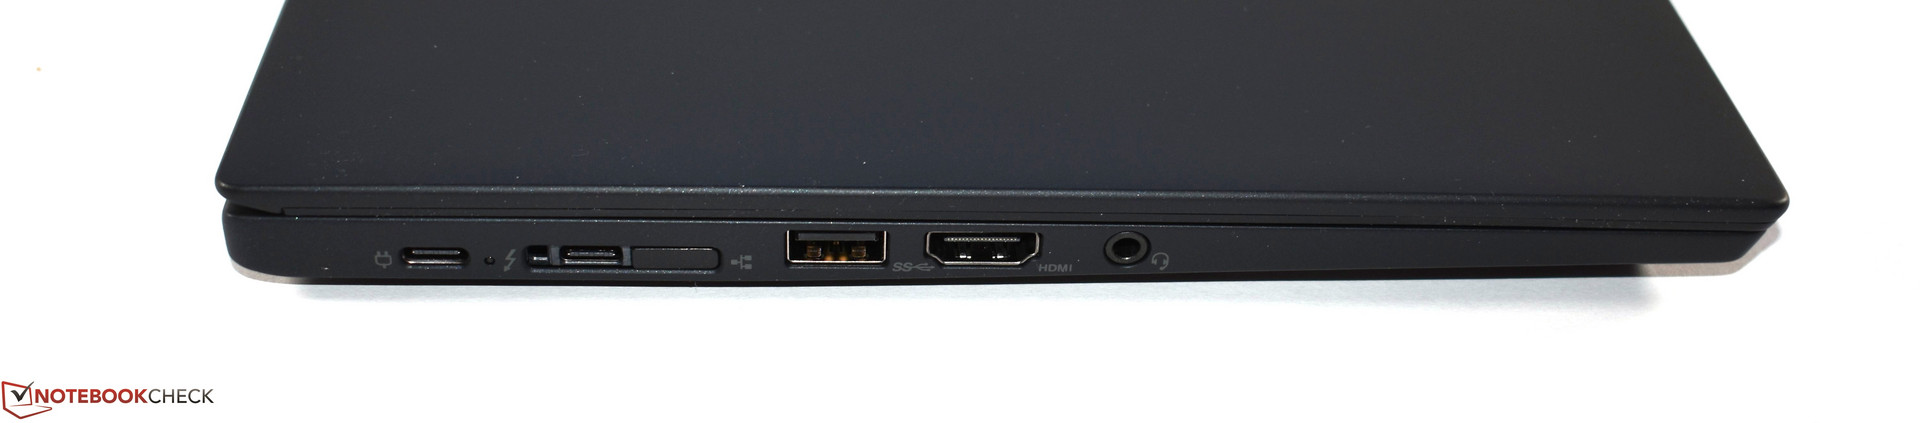
O aspecto mais importante deste novo design é a carcaça, que é significativamente melhor que a do seu antecessor. A mudança do material de plástico de fibra de vidro para magnésio e fibra de carbono funcionou em termos de redução de espessura e peso. O X280 pesa aproximadamente o mesmo que o X1 Carbon. Essa redução de peso mudou o anacronismo do X270, um portátil de 12 polegadas, mais grosso e pesado do que seus irmãos de 14 polegadas. A carcaça não é apenas mais fina e mais leve, mas também mais fácil de usar, pois a Lenovo removeu os grampos irritantes e que quebravam facilmente da parte inferior. Além disso, a Lenovo resolveu a maioria dos outros problemas que experimentamos com o X270. O ventilador funciona menos, o dispositivo funciona mais frio, o consumo de energia melhorou e a tela é mais brilhante. O X280 manteve a tradição ThinkPad de ter excelentes E/S, com o menor ThinkPad finalmente suportando Thunderbolt 3. Melhor ainda e ao contrário de seus antecessores, o X280 se beneficia do potencial máximo do desempenho da GPU, graças à sua RAM de dois canais.
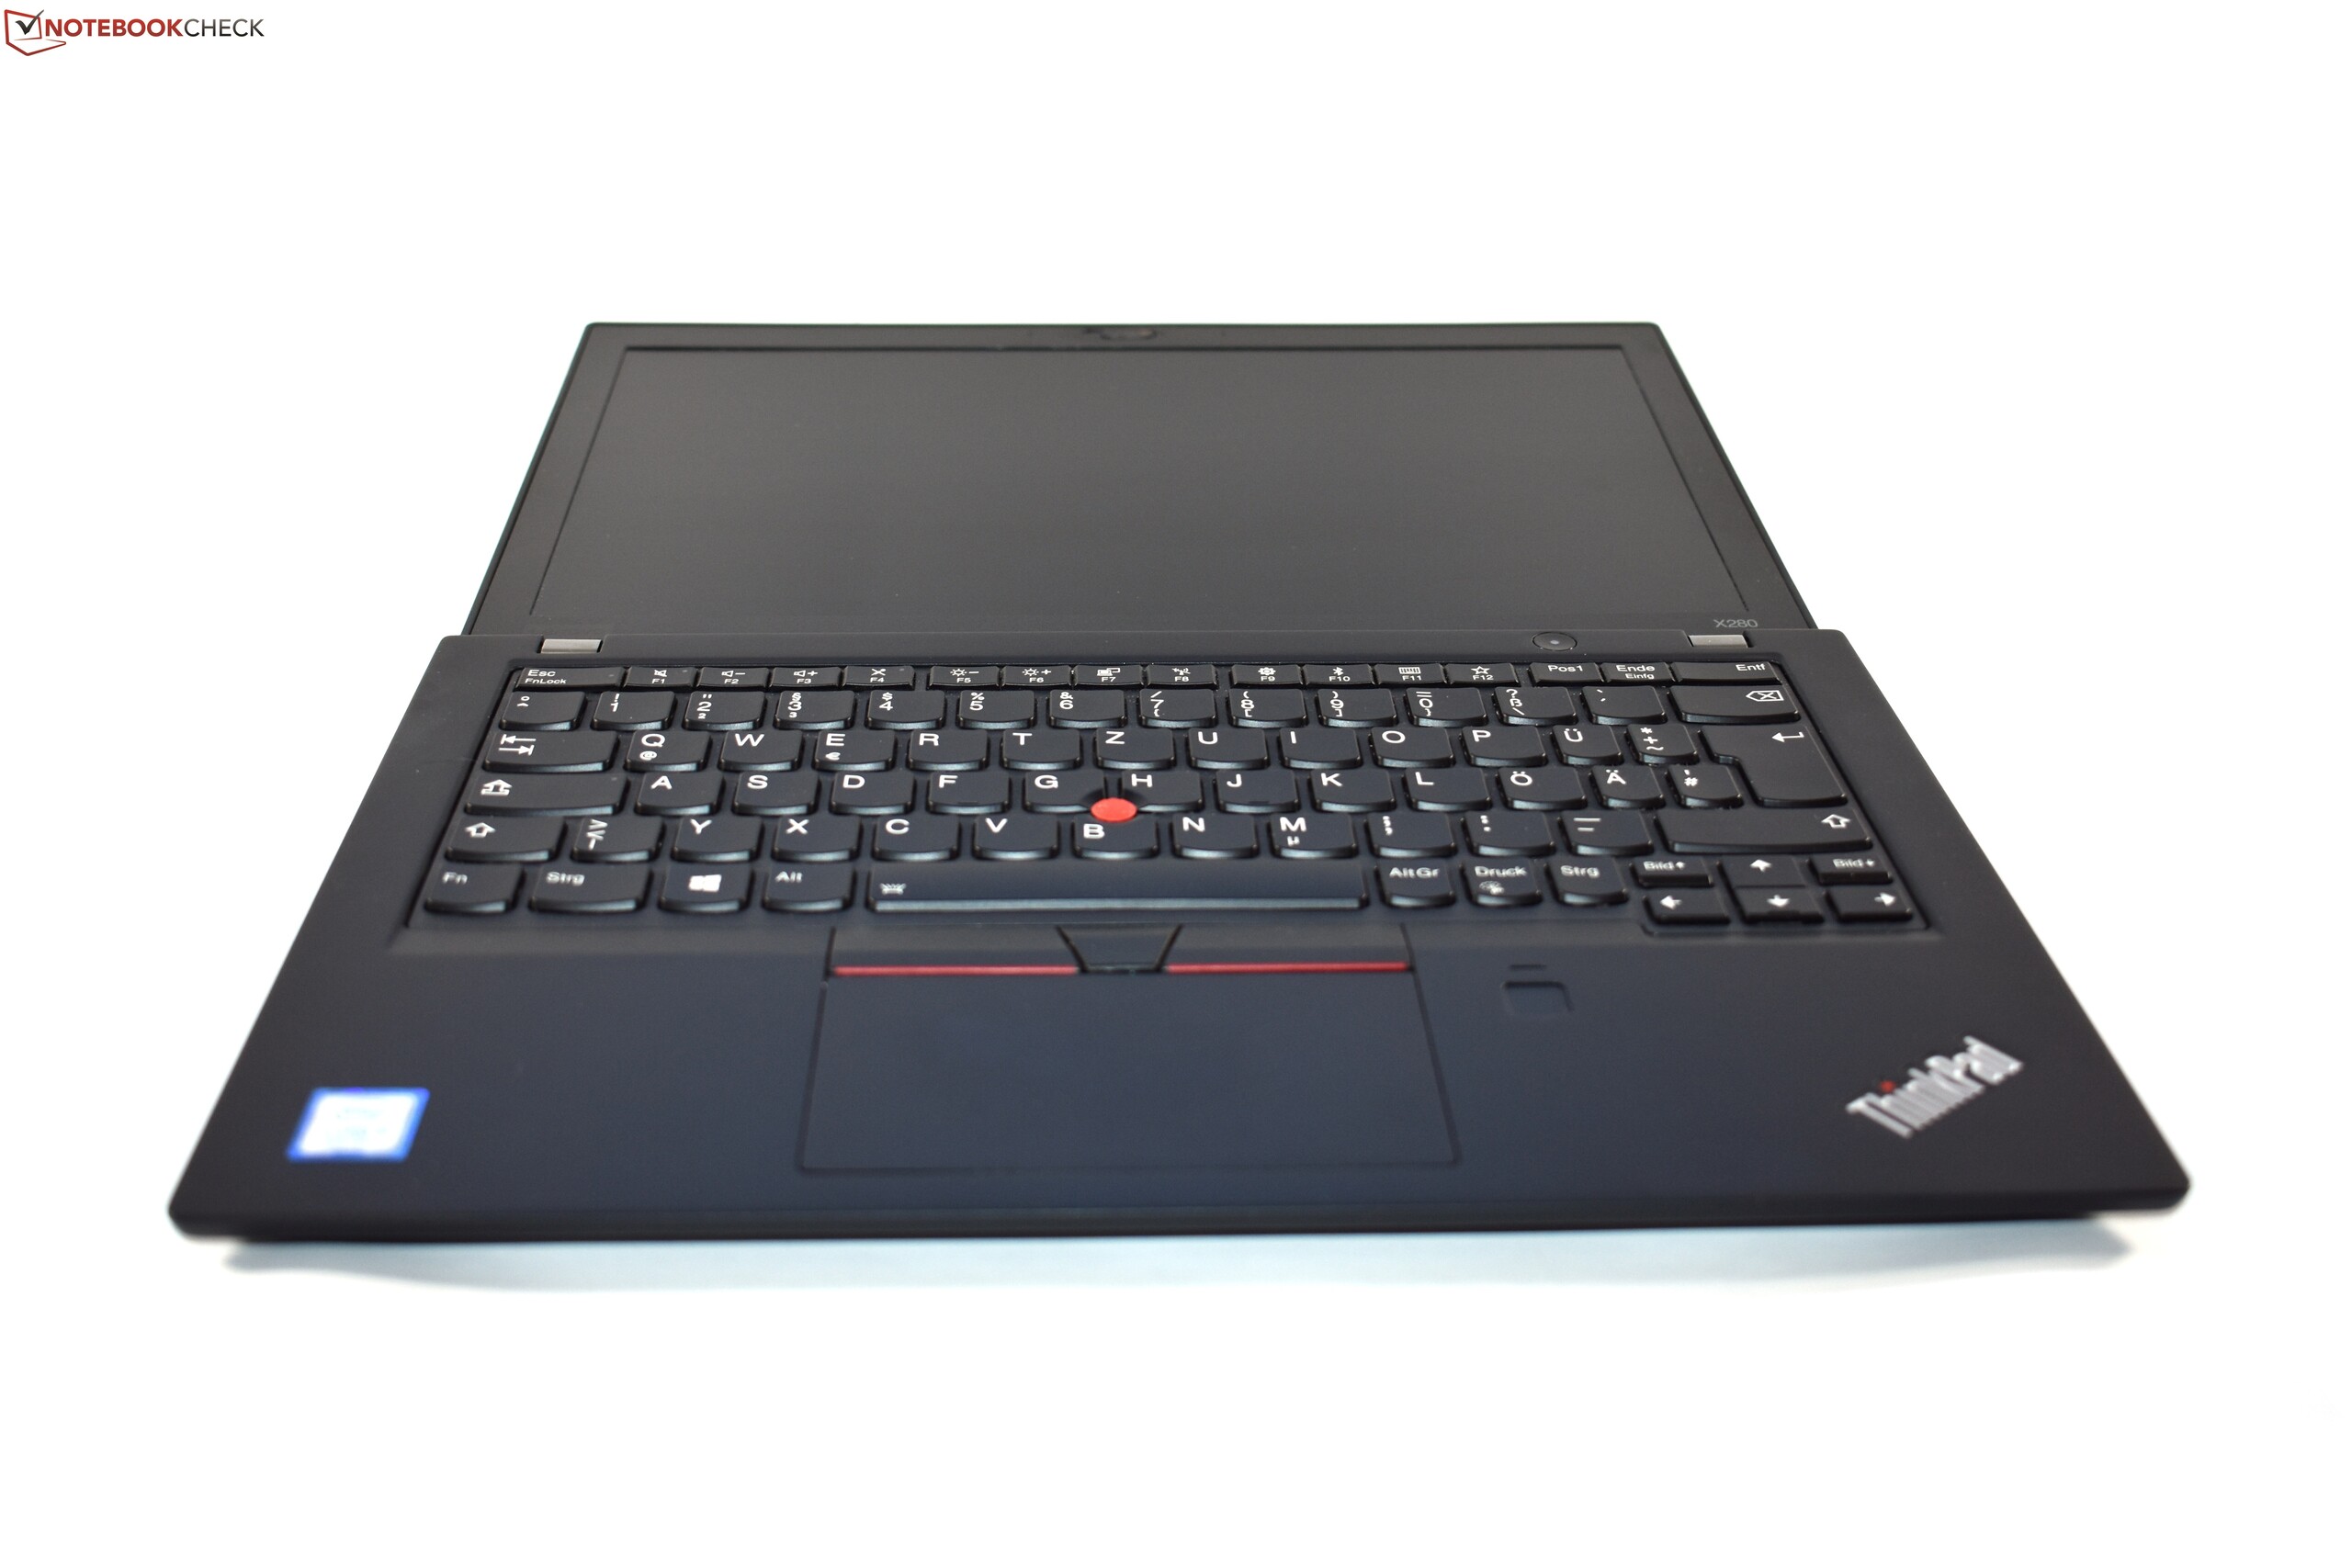
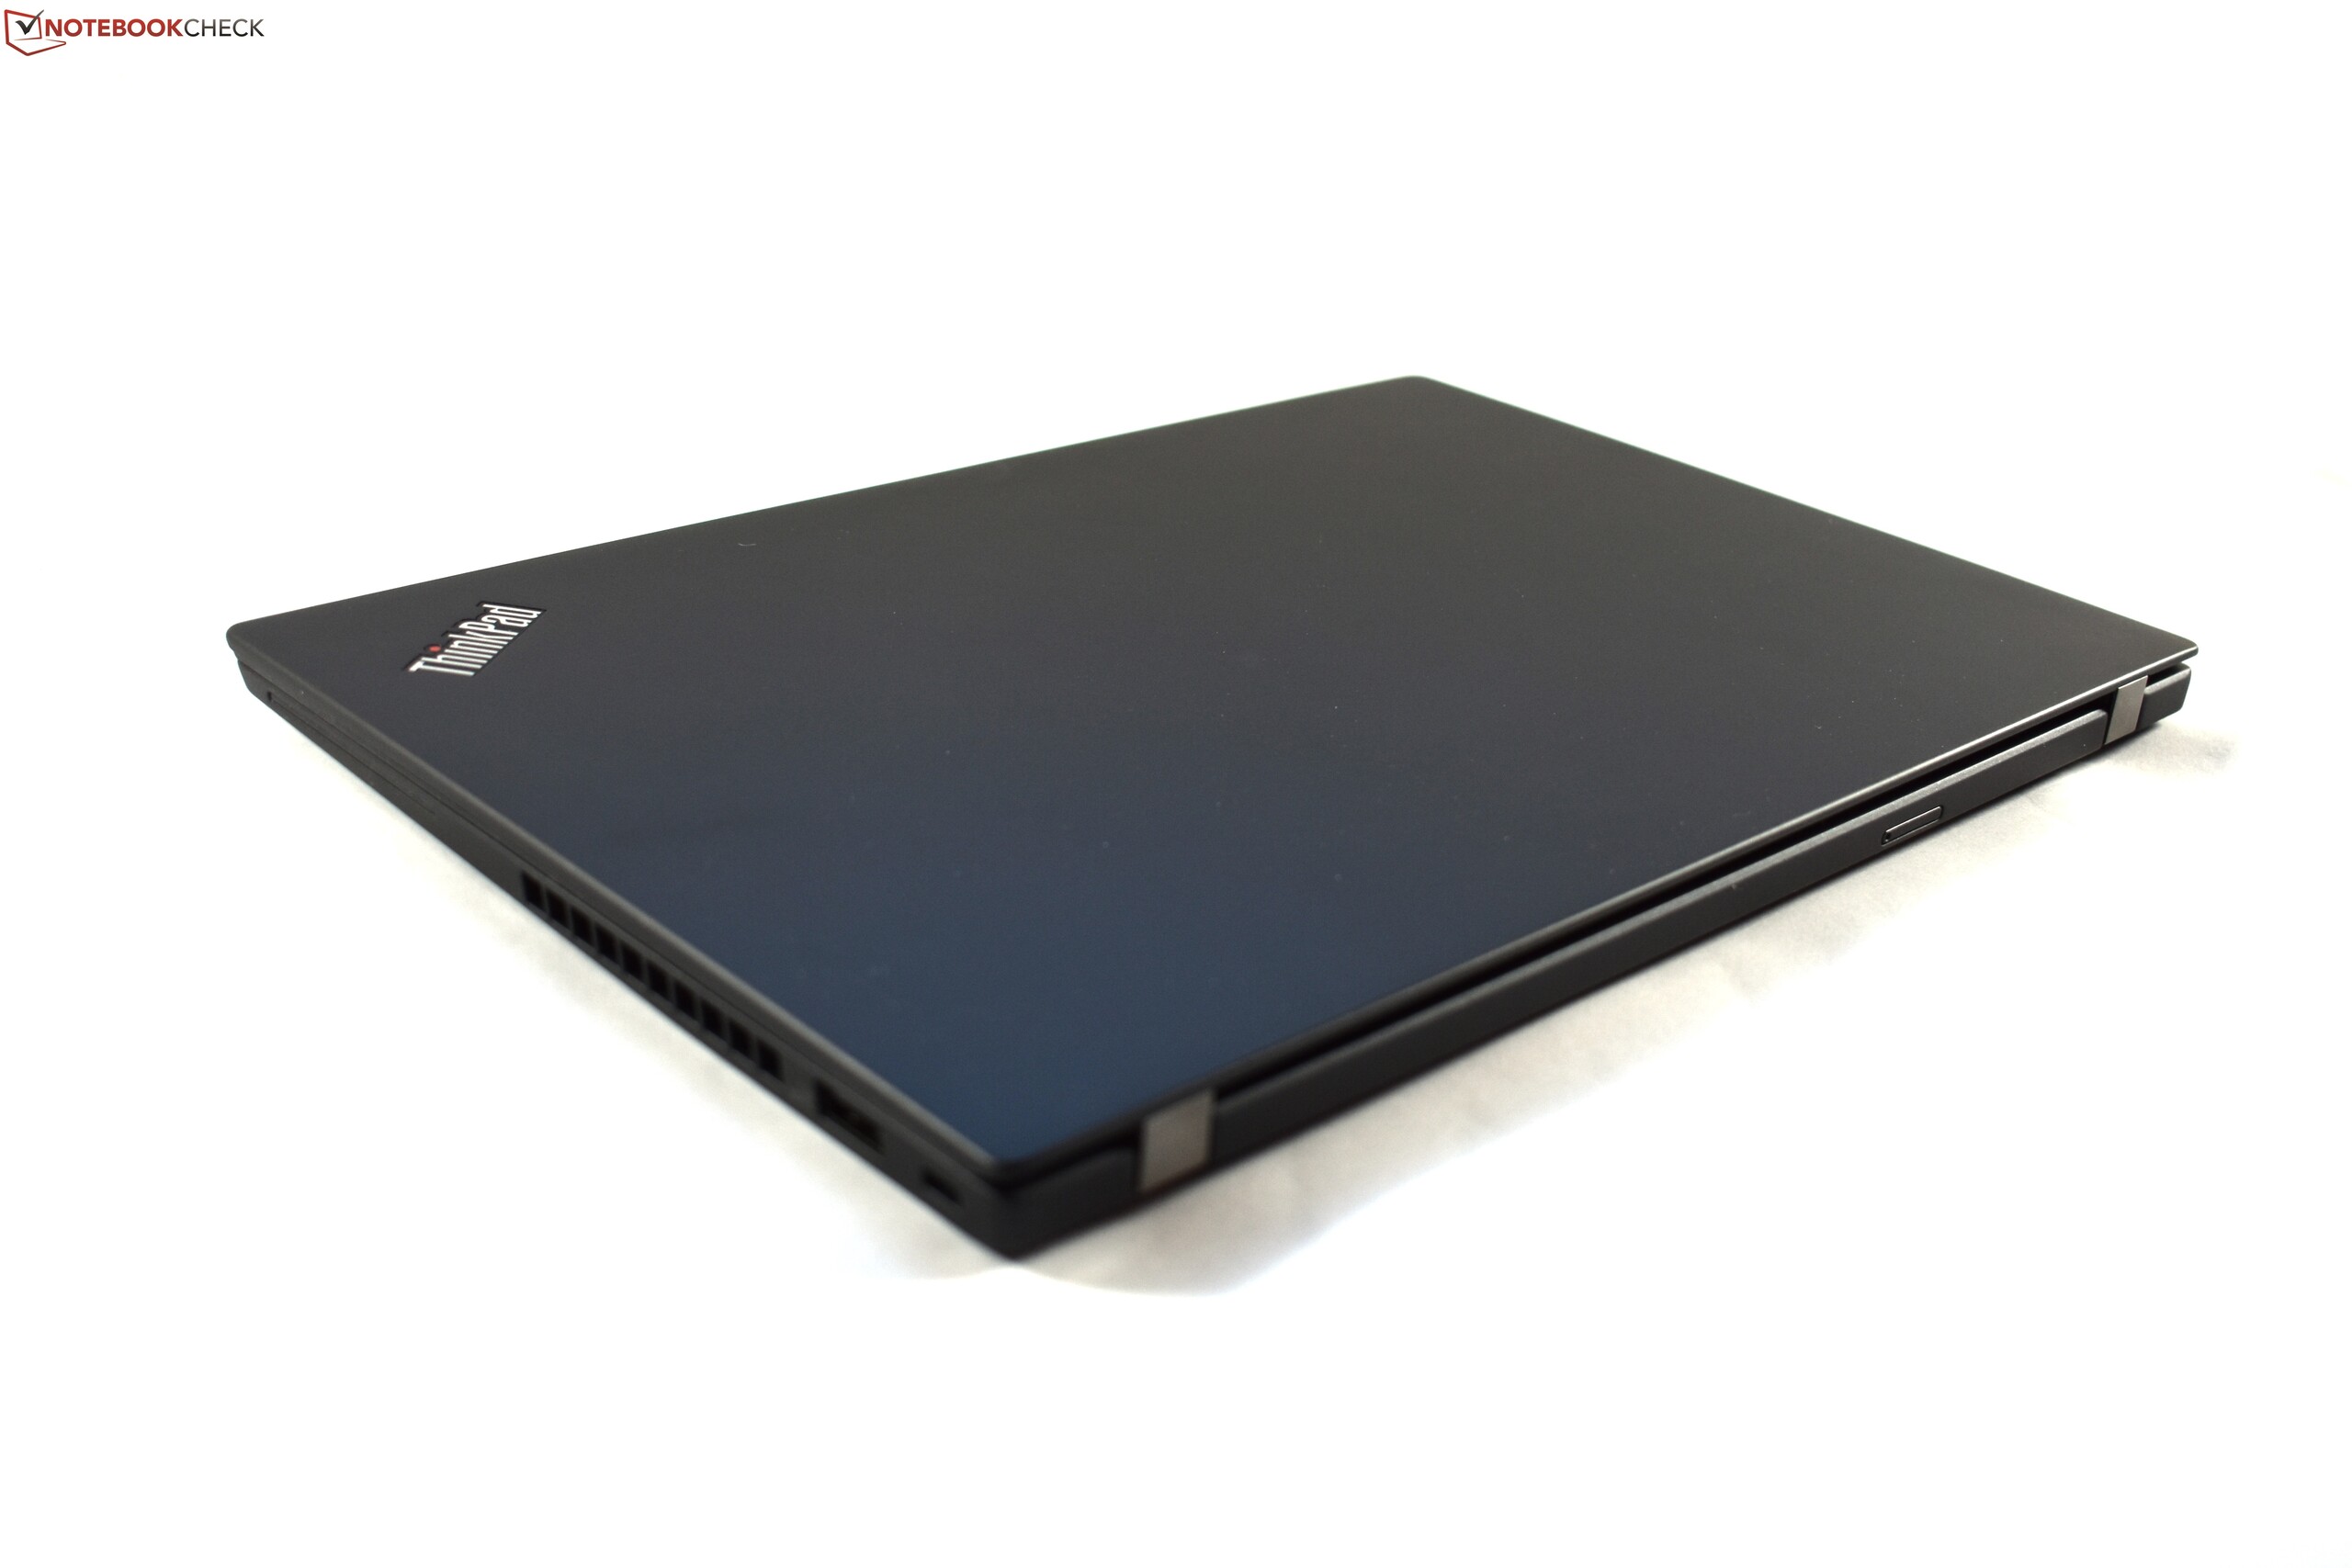
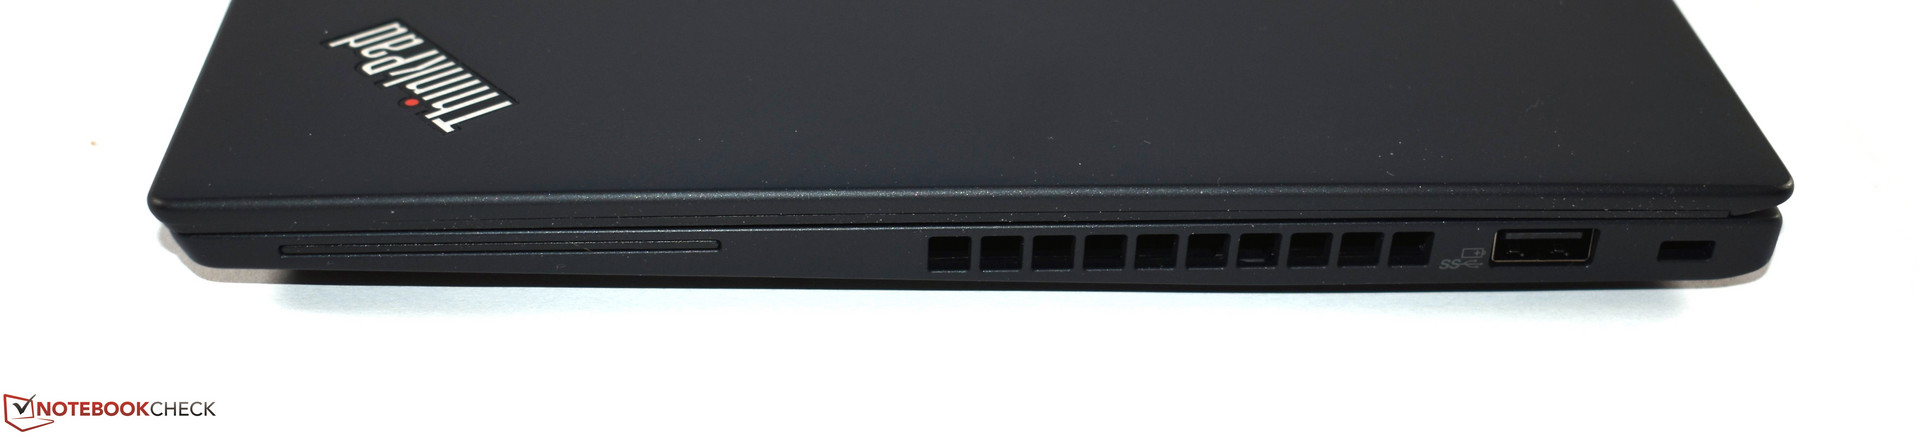
Onde há pontos positivos, também há negativos, e os negativos ocasionalmente superando os positivos. Curiosamente, os pontos fracos do X280 são aqueles que louvamos no X270. O X280 não é tão flexível quanto o antecessor sem a bateria PowerBridge removível extensível, embora a decisão de omitir a porta Ethernet RJ45 em um dispositivo empresarial é difícil de entender. A redução de um slot de cartão SD para microSD para economizar espaço é compreensível, mas seu posicionamento e acessibilidade não são. A RAM também é vítima de economia de espaço, com a Lenovo optando pela RAM soldada à placa-mãe, em vez da RAM removível, que a concorrência continua a oferecer. Uma desvantagem adicional está relacionada à forma como o X280 gerencia o desempenho da CPU. Normalmente, quando uma CPU baixa sua velocidade devido a altas temperaturas, essa velocidade retornará ao seu estado anterior, uma vez que as temperaturas caírem. Este não é o caso com o X280, com a velocidade permanecendo baixa mesmo quando as temperaturas caíram. Isso pode ser corrigido com uma atualização do BIOS, mas ainda não houve notícias sobre se a Lenovo planeja resolver isso. Além disso, a CPU é afogada com a bateria, no entanto, a Lenovo pode ter feito isso intencionalmente. Esperamos mais do que a média de espaço de cores pobre, uma vez que o X280 é um portátil tão caro. Este é um ponto em que criticamos o X270 e o conjunto mais amplo de portáteis da classe executiva também. Por fim, a Lenovo provavelmente poderia ter equipado o X280 com uma tela de 13,3 polegadas, dado os marcos largos que a tela de 12 polegadas possui.
Se você pode sobreviver sem suporte de ethernet dedicado e uma bateria removível, o X280 é um pacote muito melhor do que o modelo do ano passado, e é por isso que o recomendamos.
Recomendamos o X280 apesar das críticas porque, em geral, é simplesmente um subportátil bem sucedido. O X280 é muito mais econômico que o X1 Carbon 2018, tornando a Versão Campus uma opção atraente para estudantes. A concorrência também possui alguns modelos interessantes, como o Dell Latitude 7290 e o HP EliteBook 830 G5, que ainda estamos para testar. Em algumas áreas, esses competidores superaram o X280, como a inclusão de uma porta Ethernet e RAM expansível. O X280 tem, como é o caso dos ThinkPads, E/S incomparável, e é o mais leve dos três portáteis. Embora recomendamos o Lenovo ThinkPad X280, os potenciais compradores devem fazer sua escolha com base em suas próprias necessidades e preferências.
Lenovo ThinkPad X280-20KES01S00
- 03/02/2018 v6 (old)
Benjamin Herzig
Price comparison
