Breve Análise do Portátil Lenovo ThinkPad E15: Muito desempenho com muito pouco resfriamento
Avaliação | Data | Modelo | Peso | Altura | Size | Resolução | Preço |
|---|---|---|---|---|---|---|---|
| 82.1 % v7 (old) | 03/2020 | Lenovo ThinkPad E15 20RD0011GE i7-10510U, Radeon RX 640 | 1.8 kg | 18.9 mm | 15.60" | 1920x1080 | |
| 87.6 % v6 (old) | 04/2019 | Lenovo ThinkPad E590-20NB0012GE i7-8565U, Radeon RX 550X (Laptop) | 1.9 kg | 19.9 mm | 15.60" | 1920x1080 | |
| 86.6 % v7 (old) | 07/2019 | Lenovo ThinkPad T590-20N4002VGE i7-8565U, GeForce MX250 | 1.9 kg | 19.95 mm | 15.60" | 1920x1080 | |
| 81.1 % v6 (old) | 06/2019 | Dell Vostro 15-5581 i5-8265U, GeForce MX130 | 2 kg | 18.04 mm | 15.60" | 1920x1080 | |
| 80.1 % v7 (old) | 02/2020 | MSI Modern 15 A10RB i7-10510U, GeForce MX250 | 1.6 kg | 15.9 mm | 15.60" | 1920x1080 |
| |||||||||||||||||||||||||
iluminação: 81 %
iluminação com acumulador: 284 cd/m²
Contraste: 1286:1 (Preto: 0.22 cd/m²)
ΔE ColorChecker Calman: 7.9 | ∀{0.5-29.43 Ø4.71}
calibrated: 5.8
ΔE Greyscale Calman: 6.6 | ∀{0.09-98 Ø4.96}
57.1% sRGB (Argyll 1.6.3 3D)
37% AdobeRGB 1998 (Argyll 1.6.3 3D)
41.59% AdobeRGB 1998 (Argyll 3D)
57.7% sRGB (Argyll 3D)
40.25% Display P3 (Argyll 3D)
Gamma: 2.18
CCT: 5735 K
| Lenovo ThinkPad E15 20RD0011GE NV156FHM-N48, IPS LED, 1920x1080, 15.6" | Lenovo ThinkPad E590-20NB0012GE Lenovo B156HAN02.1, IPS, 1920x1080, 15.6" | Lenovo ThinkPad T590-20N4002VGE LP156WFC-SPD1, aSi IPS LED, 1920x1080, 15.6" | Dell Vostro 15-5581 156CL04 1G2XW, IPS, 1920x1080, 15.6" | MSI Modern 15 A10RB Chi Mei N156HCE-EN1, IPS, 1920x1080, 15.6" | |
|---|---|---|---|---|---|
| Display | 1% | -2% | -2% | 61% | |
| Display P3 Coverage (%) | 40.25 | 39.88 -1% | 38.79 -4% | 38.86 -3% | 66 64% |
| sRGB Coverage (%) | 57.7 | 59.9 4% | 58.3 1% | 58.5 1% | 92.1 60% |
| AdobeRGB 1998 Coverage (%) | 41.59 | 41.21 -1% | 40.11 -4% | 40.15 -3% | 66.5 60% |
| Response Times | 7% | 25% | 26% | 9% | |
| Response Time Grey 50% / Grey 80% * (ms) | 49.6 ? | 47.2 ? 5% | 37.2 ? 25% | 36 ? 27% | 43.2 ? 13% |
| Response Time Black / White * (ms) | 36 ? | 32.8 ? 9% | 27.2 ? 24% | 27 ? 25% | 34.4 ? 4% |
| PWM Frequency (Hz) | 1250 ? | 208 ? | 26040 ? | ||
| Screen | 15% | 12% | 19% | 32% | |
| Brightness middle (cd/m²) | 283 | 284 0% | 276 -2% | 231 -18% | 289.4 2% |
| Brightness (cd/m²) | 258 | 272 5% | 262 2% | 213 -17% | 273 6% |
| Brightness Distribution (%) | 81 | 92 14% | 88 9% | 87 7% | 82 1% |
| Black Level * (cd/m²) | 0.22 | 0.21 5% | 0.23 -5% | 0.13 41% | 0.27 -23% |
| Contrast (:1) | 1286 | 1352 5% | 1200 -7% | 1777 38% | 1072 -17% |
| Colorchecker dE 2000 * | 7.9 | 5.3 33% | 5.6 29% | 4.81 39% | 2.32 71% |
| Colorchecker dE 2000 max. * | 23.6 | 18.9 20% | 16.4 31% | 8.33 65% | 5.76 76% |
| Colorchecker dE 2000 calibrated * | 5.8 | 4.4 24% | 4.7 19% | 4.2 28% | 2.49 57% |
| Greyscale dE 2000 * | 6.6 | 3.2 52% | 3 55% | 5.19 21% | 3 55% |
| Gamma | 2.18 101% | 2.41 91% | 2.18 101% | 2.33 94% | 2.22 99% |
| CCT | 5735 113% | 6736 96% | 7075 92% | 7088 92% | 6867 95% |
| Color Space (Percent of AdobeRGB 1998) (%) | 37 | 37.9 2% | 36.9 0% | 37 0% | 59.8 62% |
| Color Space (Percent of sRGB) (%) | 57.1 | 59.7 5% | 58.1 2% | 58 2% | 92 61% |
| Média Total (Programa/Configurações) | 8% /
11% | 12% /
11% | 14% /
16% | 34% /
35% |
* ... menor é melhor
Exibir tempos de resposta
| ↔ Tempo de resposta preto para branco | ||
|---|---|---|
| 36 ms ... ascensão ↗ e queda ↘ combinadas | ↗ 18.8 ms ascensão | 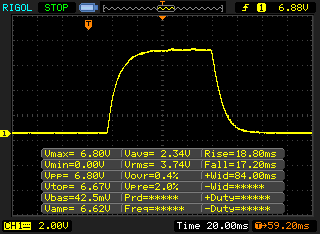 |
| ↘ 17.2 ms queda | ||
| A tela mostra taxas de resposta lentas em nossos testes e será insatisfatória para os jogadores. Em comparação, todos os dispositivos testados variam de 0.1 (mínimo) a 240 (máximo) ms. » 94 % de todos os dispositivos são melhores. Isso significa que o tempo de resposta medido é pior que a média de todos os dispositivos testados (19.8 ms). | ||
| ↔ Tempo de resposta 50% cinza a 80% cinza | ||
| 49.6 ms ... ascensão ↗ e queda ↘ combinadas | ↗ 24.4 ms ascensão | 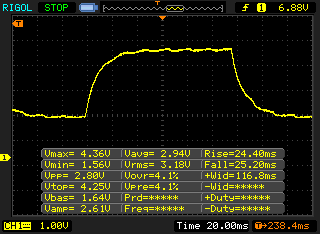 |
| ↘ 25.2 ms queda | ||
| A tela mostra taxas de resposta lentas em nossos testes e será insatisfatória para os jogadores. Em comparação, todos os dispositivos testados variam de 0.165 (mínimo) a 636 (máximo) ms. » 86 % de todos os dispositivos são melhores. Isso significa que o tempo de resposta medido é pior que a média de todos os dispositivos testados (31 ms). | ||
Cintilação da tela / PWM (modulação por largura de pulso)
| Tela tremeluzindo/PWM detectado | 1250 Hz | ≤ 99 % configuração de brilho | 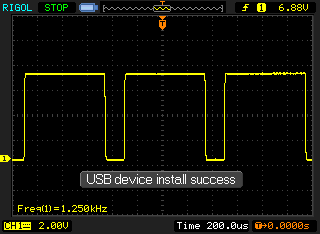 |
A luz de fundo da tela pisca em 1250 Hz (pior caso, por exemplo, utilizando PWM) Cintilação detectada em uma configuração de brilho de 99 % e abaixo. Não deve haver cintilação ou PWM acima desta configuração de brilho. A frequência de 1250 Hz é bastante alta, então a maioria dos usuários sensíveis ao PWM não deve notar nenhuma oscilação. [pwm_comparison] Em comparação: 52 % de todos os dispositivos testados não usam PWM para escurecer a tela. Se PWM foi detectado, uma média de 7757 (mínimo: 5 - máximo: 343500) Hz foi medida. | |||
| PCMark 8 Home Score Accelerated v2 | 4045 pontos | |
| PCMark 8 Work Score Accelerated v2 | 5142 pontos | |
| PCMark 10 Score | 5023 pontos | |
Ajuda | ||
| Lenovo ThinkPad E15 20RD0011GE Samsung PM991 MZALQ512HALU | Lenovo ThinkPad E590-20NB0012GE Toshiba KBG30ZMT256G | Lenovo ThinkPad T590-20N4002VGE Toshiba XG6 KXG60ZNV512G | Dell Vostro 15-5581 SK hynix BC501 HFM128GDJTNG-831 | MSI Modern 15 A10RB WDC PC SN730 SDBPNTY-512G | Média Samsung PM991 MZALQ512HALU | |
|---|---|---|---|---|---|---|
| CrystalDiskMark 5.2 / 6 | -28% | 17% | -48% | 55% | -3% | |
| Write 4K (MB/s) | 144.4 | 111.2 -23% | 126.2 -13% | 129.3 -10% | 208.4 44% | 129.5 ? -10% |
| Read 4K (MB/s) | 52.3 | 49.01 -6% | 48.93 -6% | 41.02 -22% | 51 -2% | 45.1 ? -14% |
| Write Seq (MB/s) | 946 | 586 -38% | 1345 42% | 203.4 -78% | 2687 184% | 1172 ? 24% |
| Read Seq (MB/s) | 1608 | 783 -51% | 1373 -15% | 271.2 -83% | 2168 35% | 1496 ? -7% |
| Write 4K Q32T1 (MB/s) | 592 | 263 -56% | 383.8 -35% | 252.3 -57% | 489.2 -17% | 448 ? -24% |
| Read 4K Q32T1 (MB/s) | 397.7 | 481.5 21% | 434.8 9% | 281.4 -29% | 600 51% | 415 ? 4% |
| Write Seq Q32T1 (MB/s) | 1364 | 784 -43% | 2966 117% | 319.8 -77% | 2699 98% | 1397 ? 2% |
| Read Seq Q32T1 (MB/s) | 2301 | 1602 -30% | 3230 40% | 1589 -31% | 3374 47% | 2307 ? 0% |

| 3DMark 06 Standard Score | 20261 pontos | |
| 3DMark Vantage P Result | 14141 pontos | |
| 3DMark 11 Performance | 5243 pontos | |
| 3DMark Ice Storm Standard Score | 61367 pontos | |
| 3DMark Cloud Gate Standard Score | 13593 pontos | |
| 3DMark Fire Strike Score | 3049 pontos | |
| 3DMark Time Spy Score | 1100 pontos | |
Ajuda | ||
| The Witcher 3 - 1920x1080 High Graphics & Postprocessing (Nvidia HairWorks Off) | |
| Média da turma Office (23.7 - 53.4, n=3, últimos 2 anos) | |
| MSI Modern 15 A10RB | |
| Lenovo ThinkPad T590-20N4002VGE | |
| Lenovo ThinkPad E590-20NB0012GE | |
| Média AMD Radeon RX 640 (19.7 - 19.9, n=2) | |
| Lenovo ThinkPad E15 20RD0011GE | |
| baixo | média | alto | ultra | |
|---|---|---|---|---|
| BioShock Infinite (2013) | 150.5 | 94.1 | 74.4 | 27.3 |
| The Witcher 3 (2015) | 63.2 | 38.4 | 19.7 | 11.3 |
| Dota 2 Reborn (2015) | 110 | 95.5 | 51.7 | 48.2 |
| Rise of the Tomb Raider (2016) | 64.7 | 28.6 | 19.8 | |
| Far Cry 5 (2018) | 48 | 21 | ||
| Shadow of the Tomb Raider (2018) | 42 | 22 | ||
| Assassin´s Creed Odyssey (2018) | 39 | 20 | ||
| Battlefield V (2018) | 61.8 | 29.8 | 23.2 | |
| Apex Legends (2019) | 72 | 27 | 20 | |
| Far Cry New Dawn (2019) | 37 | 17 | ||
| The Division 2 (2019) | 52 | 18 | ||
| Anno 1800 (2019) | 61.8 | 20.5 | ||
| Total War: Three Kingdoms (2019) | 51.4 | 16.9 | ||
| F1 2019 (2019) | 55 | 23 | ||
| FIFA 20 (2019) | 112.6 | |||
| Ghost Recon Breakpoint (2019) | 29 | |||
| GRID 2019 (2019) | 60.6 | 20.4 | ||
| Need for Speed Heat (2019) | 31.7 | 14.3 | ||
| Star Wars Jedi Fallen Order (2019) | 25.9 |
Barulho
| Ocioso |
| 29.2 / 29.2 / 31.7 dB |
| Carga |
| 34.8 / 34.8 dB |
 | ||
30 dB silencioso 40 dB(A) audível 50 dB(A) ruidosamente alto |
||
min: | ||
(-) A temperatura máxima no lado superior é 46.1 °C / 115 F, em comparação com a média de 34.3 °C / 94 F , variando de 21.2 a 62.5 °C para a classe Office.
(-) A parte inferior aquece até um máximo de 67.8 °C / 154 F, em comparação com a média de 36.8 °C / 98 F
(+) Em uso inativo, a temperatura média para o lado superior é 23.9 °C / 75 F, em comparação com a média do dispositivo de 29.5 °C / ### class_avg_f### F.
(±) Jogando The Witcher 3, a temperatura média para o lado superior é 35.9 °C / 97 F, em comparação com a média do dispositivo de 29.5 °C / ## #class_avg_f### F.
(+) Os apoios para as mãos e o touchpad são mais frios que a temperatura da pele, com um máximo de 27.8 °C / 82 F e, portanto, são frios ao toque.
(±) A temperatura média da área do apoio para as mãos de dispositivos semelhantes foi 27.5 °C / 81.5 F (-0.3 °C / -0.5 F).
| desligado | |
| Ocioso | |
| Carga |
|
Key:
min: | |
| Lenovo ThinkPad E15 20RD0011GE i7-10510U, Radeon RX 640, Samsung PM991 MZALQ512HALU, IPS LED, 1920x1080, 15.6" | Lenovo ThinkPad E590-20NB0012GE i7-8565U, Radeon RX 550X (Laptop), Toshiba KBG30ZMT256G, IPS, 1920x1080, 15.6" | Lenovo ThinkPad T590-20N4002VGE i7-8565U, GeForce MX250, Toshiba XG6 KXG60ZNV512G, aSi IPS LED, 1920x1080, 15.6" | Dell Vostro 15-5581 i5-8265U, GeForce MX130, SK hynix BC501 HFM128GDJTNG-831, IPS, 1920x1080, 15.6" | MSI Modern 15 A10RB i7-10510U, GeForce MX250, WDC PC SN730 SDBPNTY-512G, IPS, 1920x1080, 15.6" | Média AMD Radeon RX 640 | Média da turma Office | |
|---|---|---|---|---|---|---|---|
| Power Consumption | -11% | -24% | -9% | -72% | -2% | -6% | |
| Idle Minimum * (Watt) | 3.2 | 3.48 -9% | 4.1 -28% | 5 -56% | 6.6 -106% | 3.25 ? -2% | 4.26 ? -33% |
| Idle Average * (Watt) | 6.8 | 7.2 -6% | 8.3 -22% | 7.9 -16% | 9.9 -46% | 6.5 ? 4% | 7.31 ? -8% |
| Idle Maximum * (Watt) | 9.5 | 10.2 -7% | 11.8 -24% | 11.2 -18% | 14.7 -55% | 8.95 ? 6% | 8.55 ? 10% |
| Load Average * (Watt) | 44 | 59.6 -35% | 61.6 -40% | 34 23% | 82.9 -88% | 51.6 ? -17% | 43.8 ? -0% |
| Load Maximum * (Watt) | 66.4 | 65.1 2% | 69.4 -5% | 50.2 24% | 109.3 -65% | 66.5 ? -0% | 64.5 ? 3% |
| Witcher 3 ultra * (Watt) | 49 | 54.4 | 59.4 |
* ... menor é melhor
| Lenovo ThinkPad E15 20RD0011GE i7-10510U, Radeon RX 640, 45 Wh | Lenovo ThinkPad E590-20NB0012GE i7-8565U, Radeon RX 550X (Laptop), 45 Wh | Lenovo ThinkPad T590-20N4002VGE i7-8565U, GeForce MX250, 57 Wh | Dell Vostro 15-5581 i5-8265U, GeForce MX130, 42 Wh | MSI Modern 15 A10RB i7-10510U, GeForce MX250, 52 Wh | Média da turma Office | |
|---|---|---|---|---|---|---|
| Duração da bateria | -8% | 47% | -21% | -12% | 40% | |
| H.264 (h) | 10.4 | 9 -13% | 12.1 16% | 6.6 -37% | 15.5 ? 49% | |
| WiFi v1.3 (h) | 7.5 | 7.1 -5% | 10.5 40% | 6.8 -9% | 6.5 -13% | 13.2 ? 76% |
| Load (h) | 1.9 | 1.8 -5% | 3.5 84% | 1.6 -16% | 1.7 -11% | 1.808 ? -5% |
| Reader / Idle (h) | 18.9 | 12.5 | 15.4 | 24.5 ? |
Pro
Contra
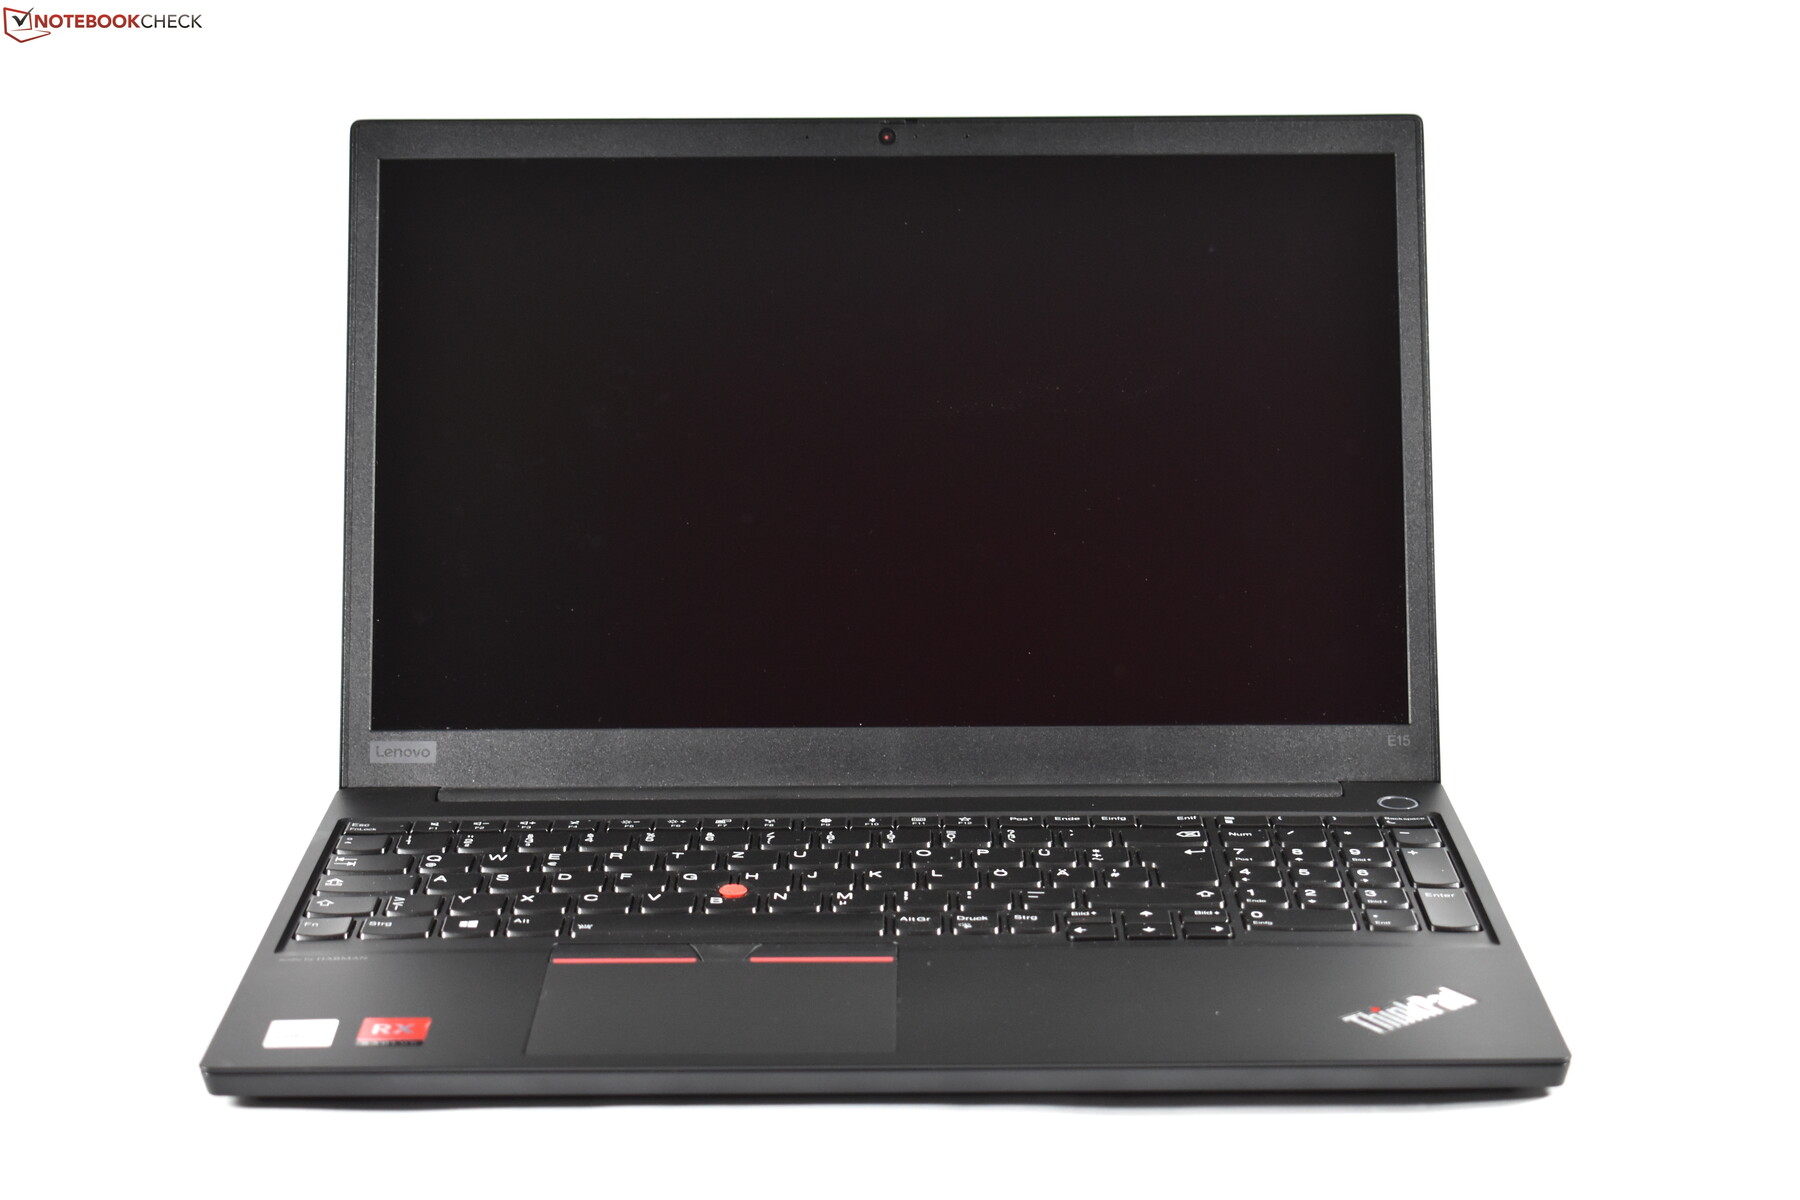
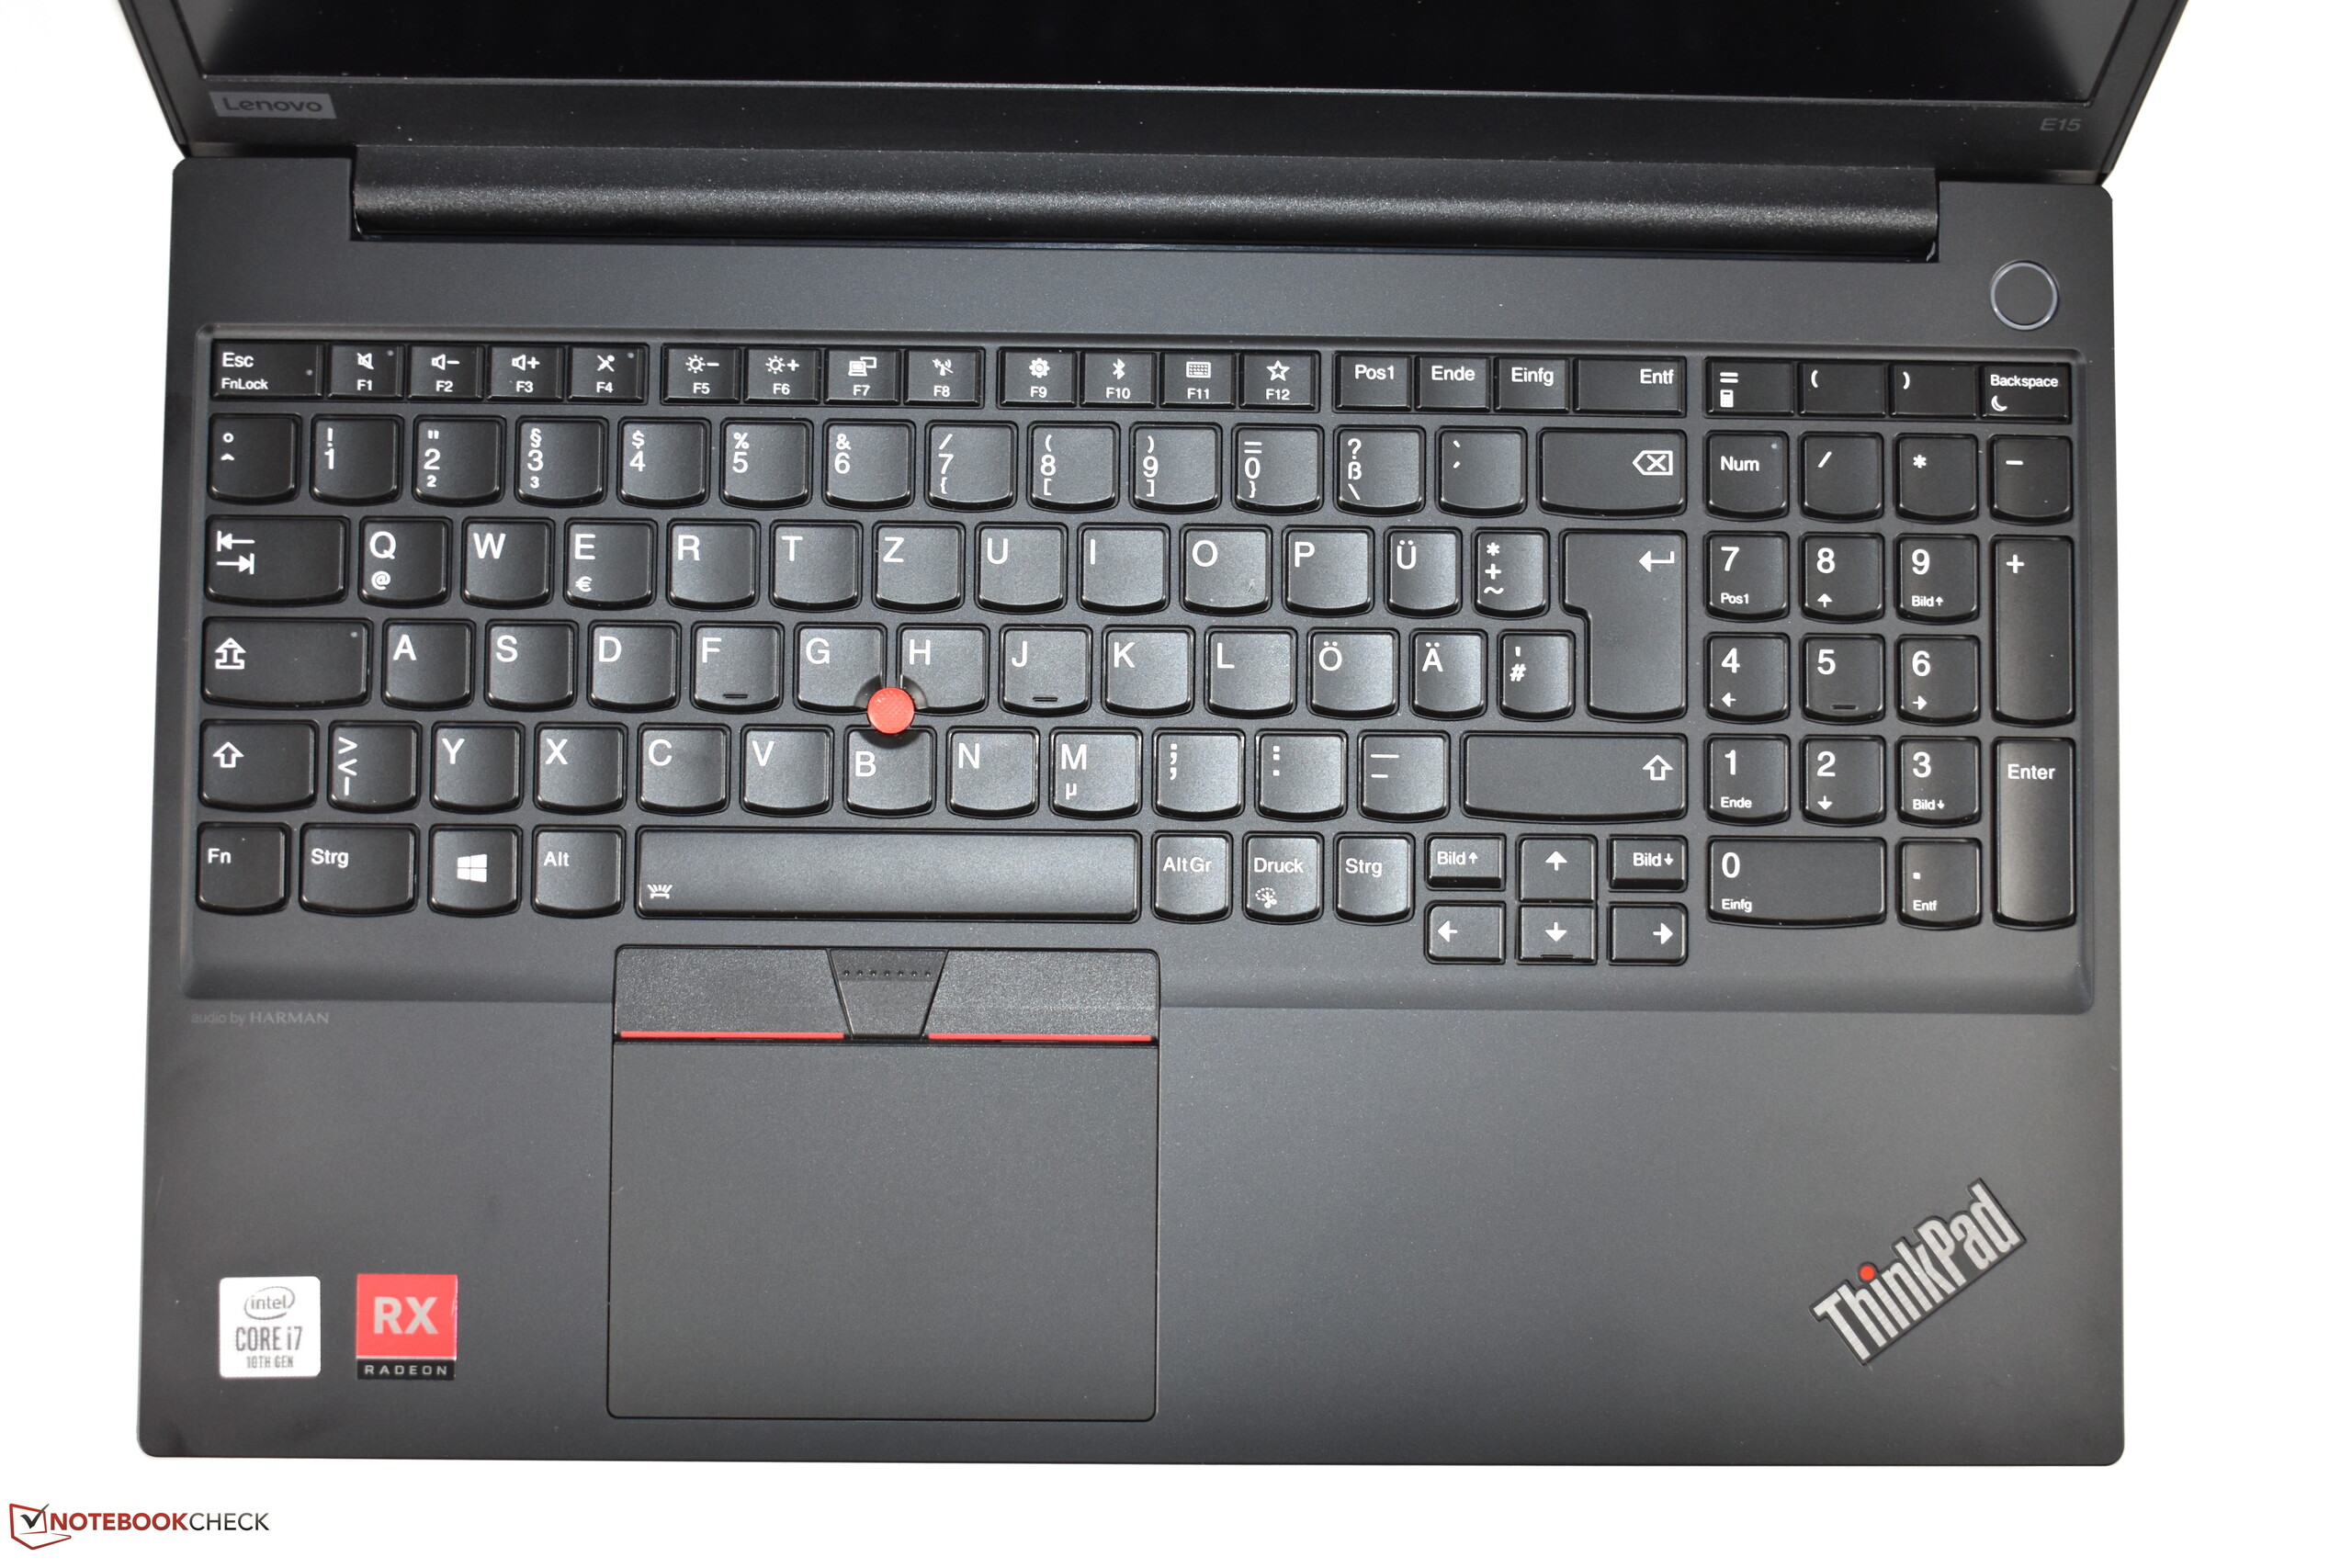
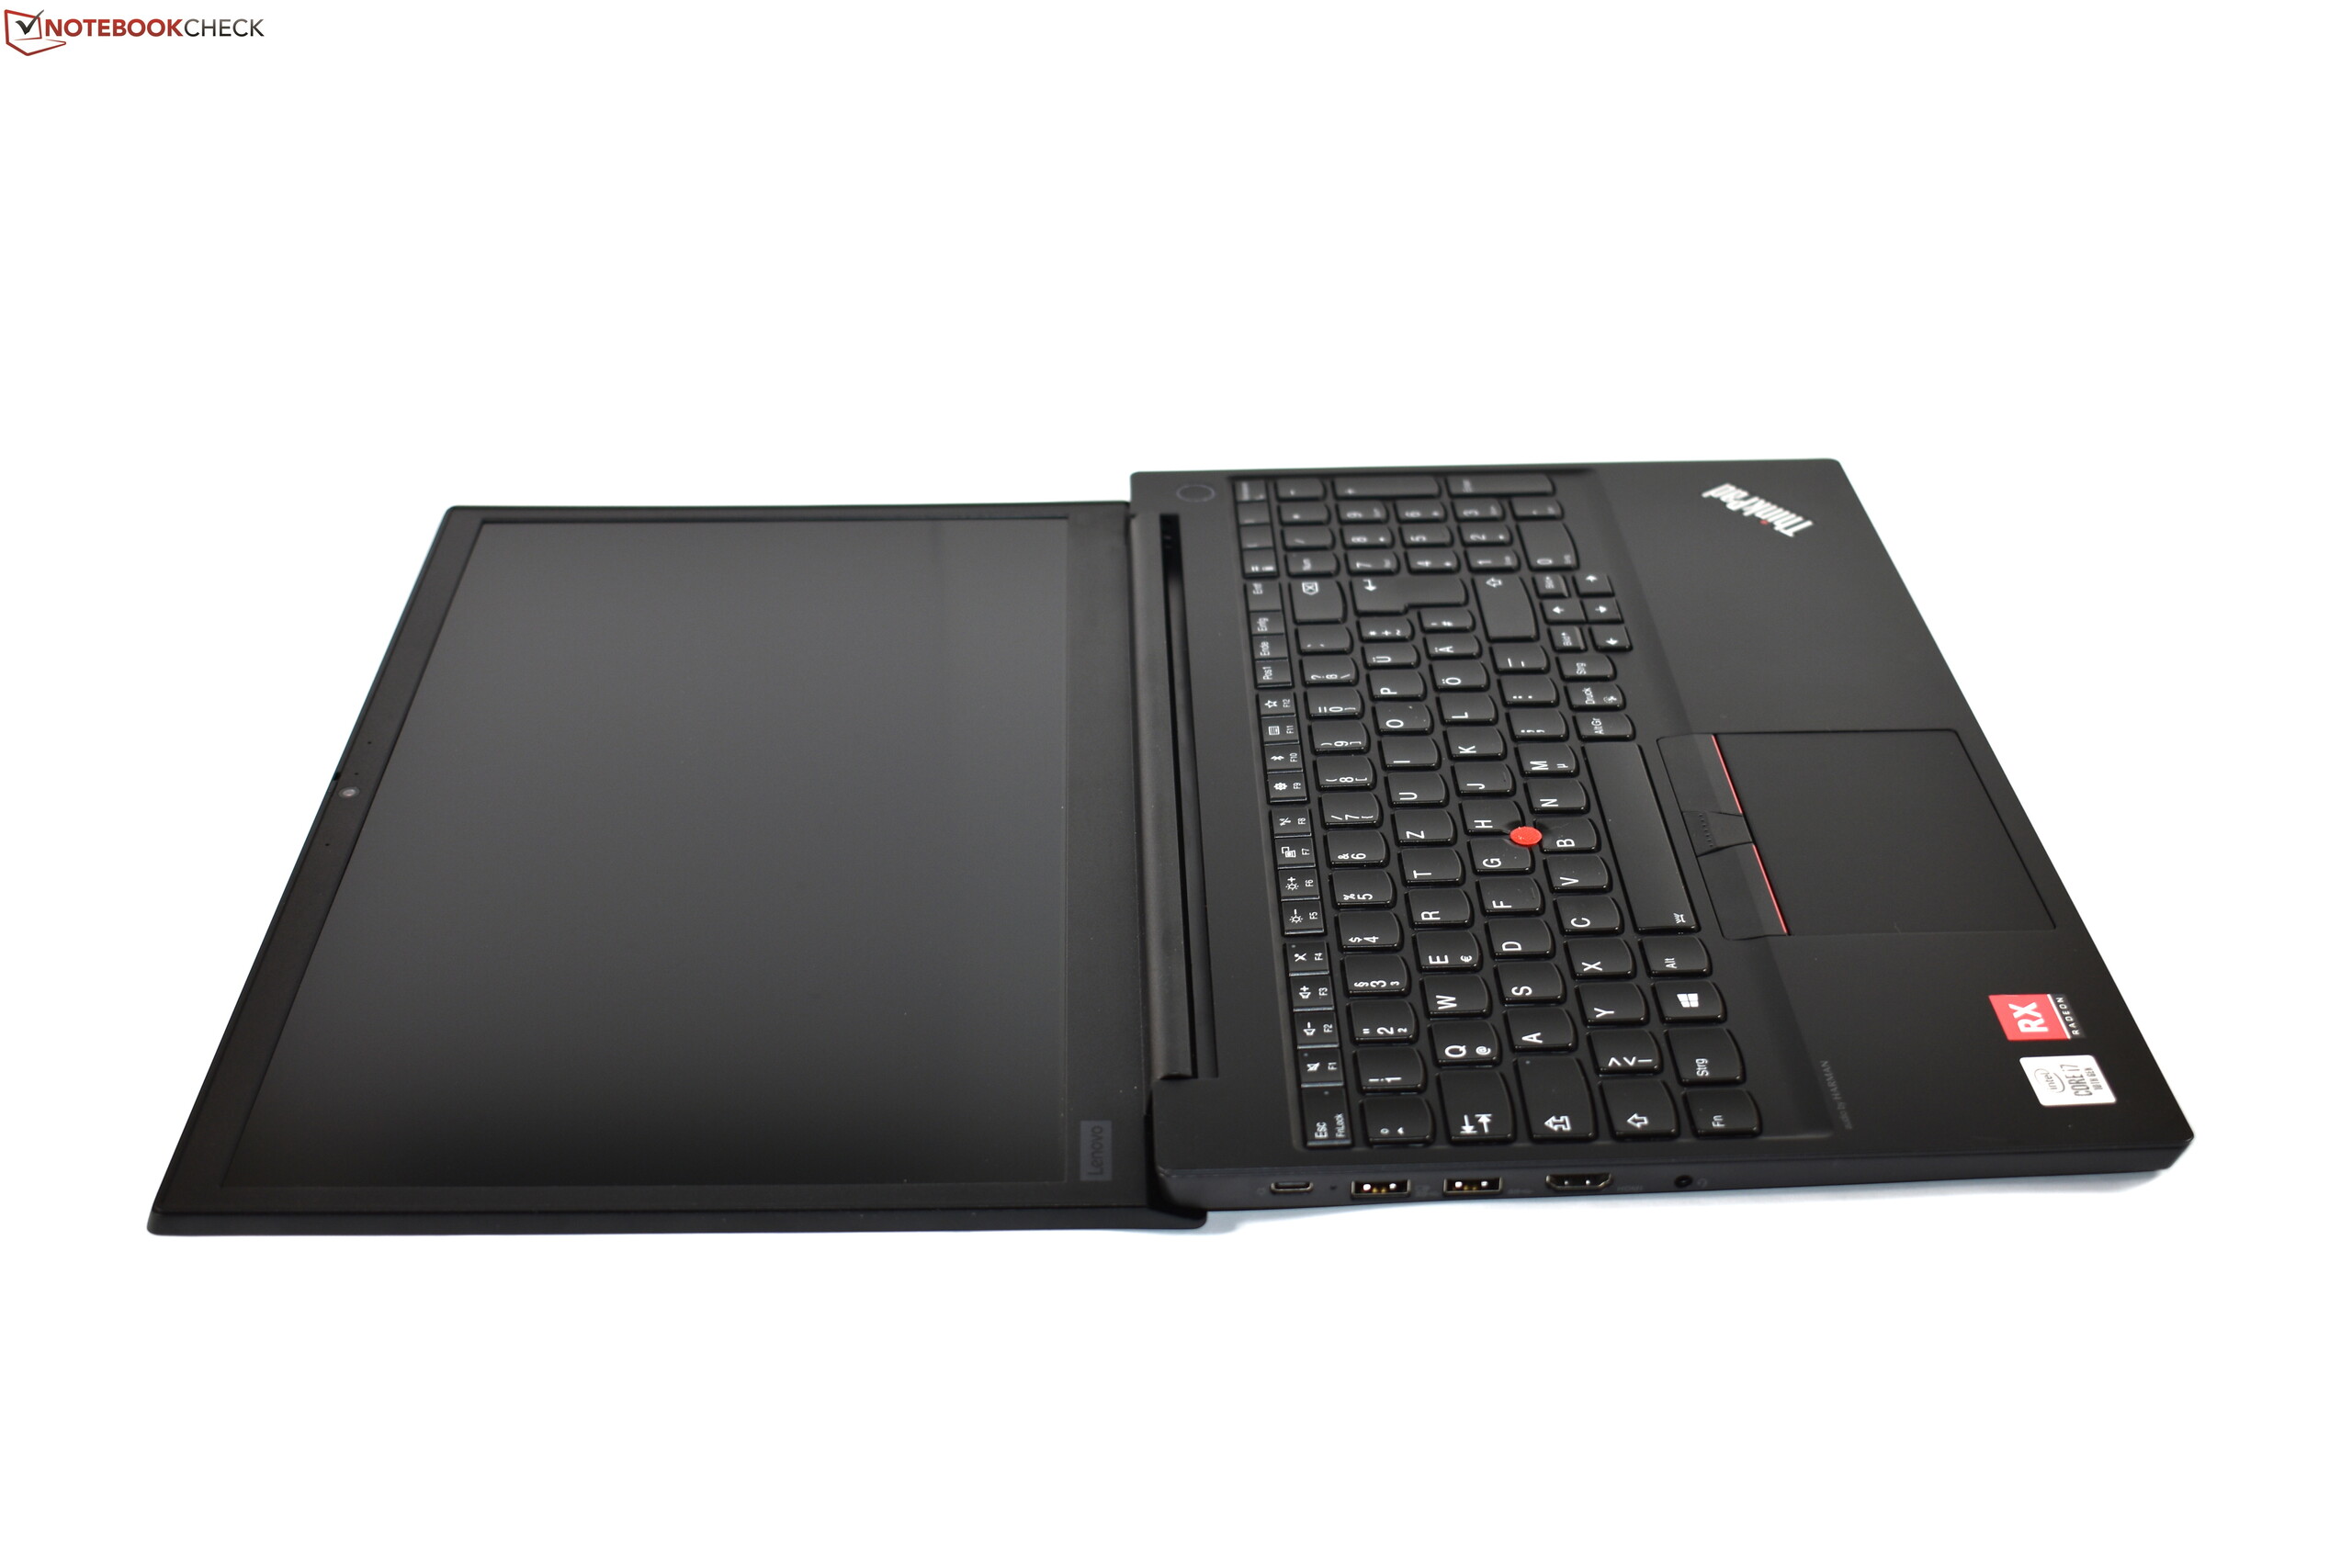
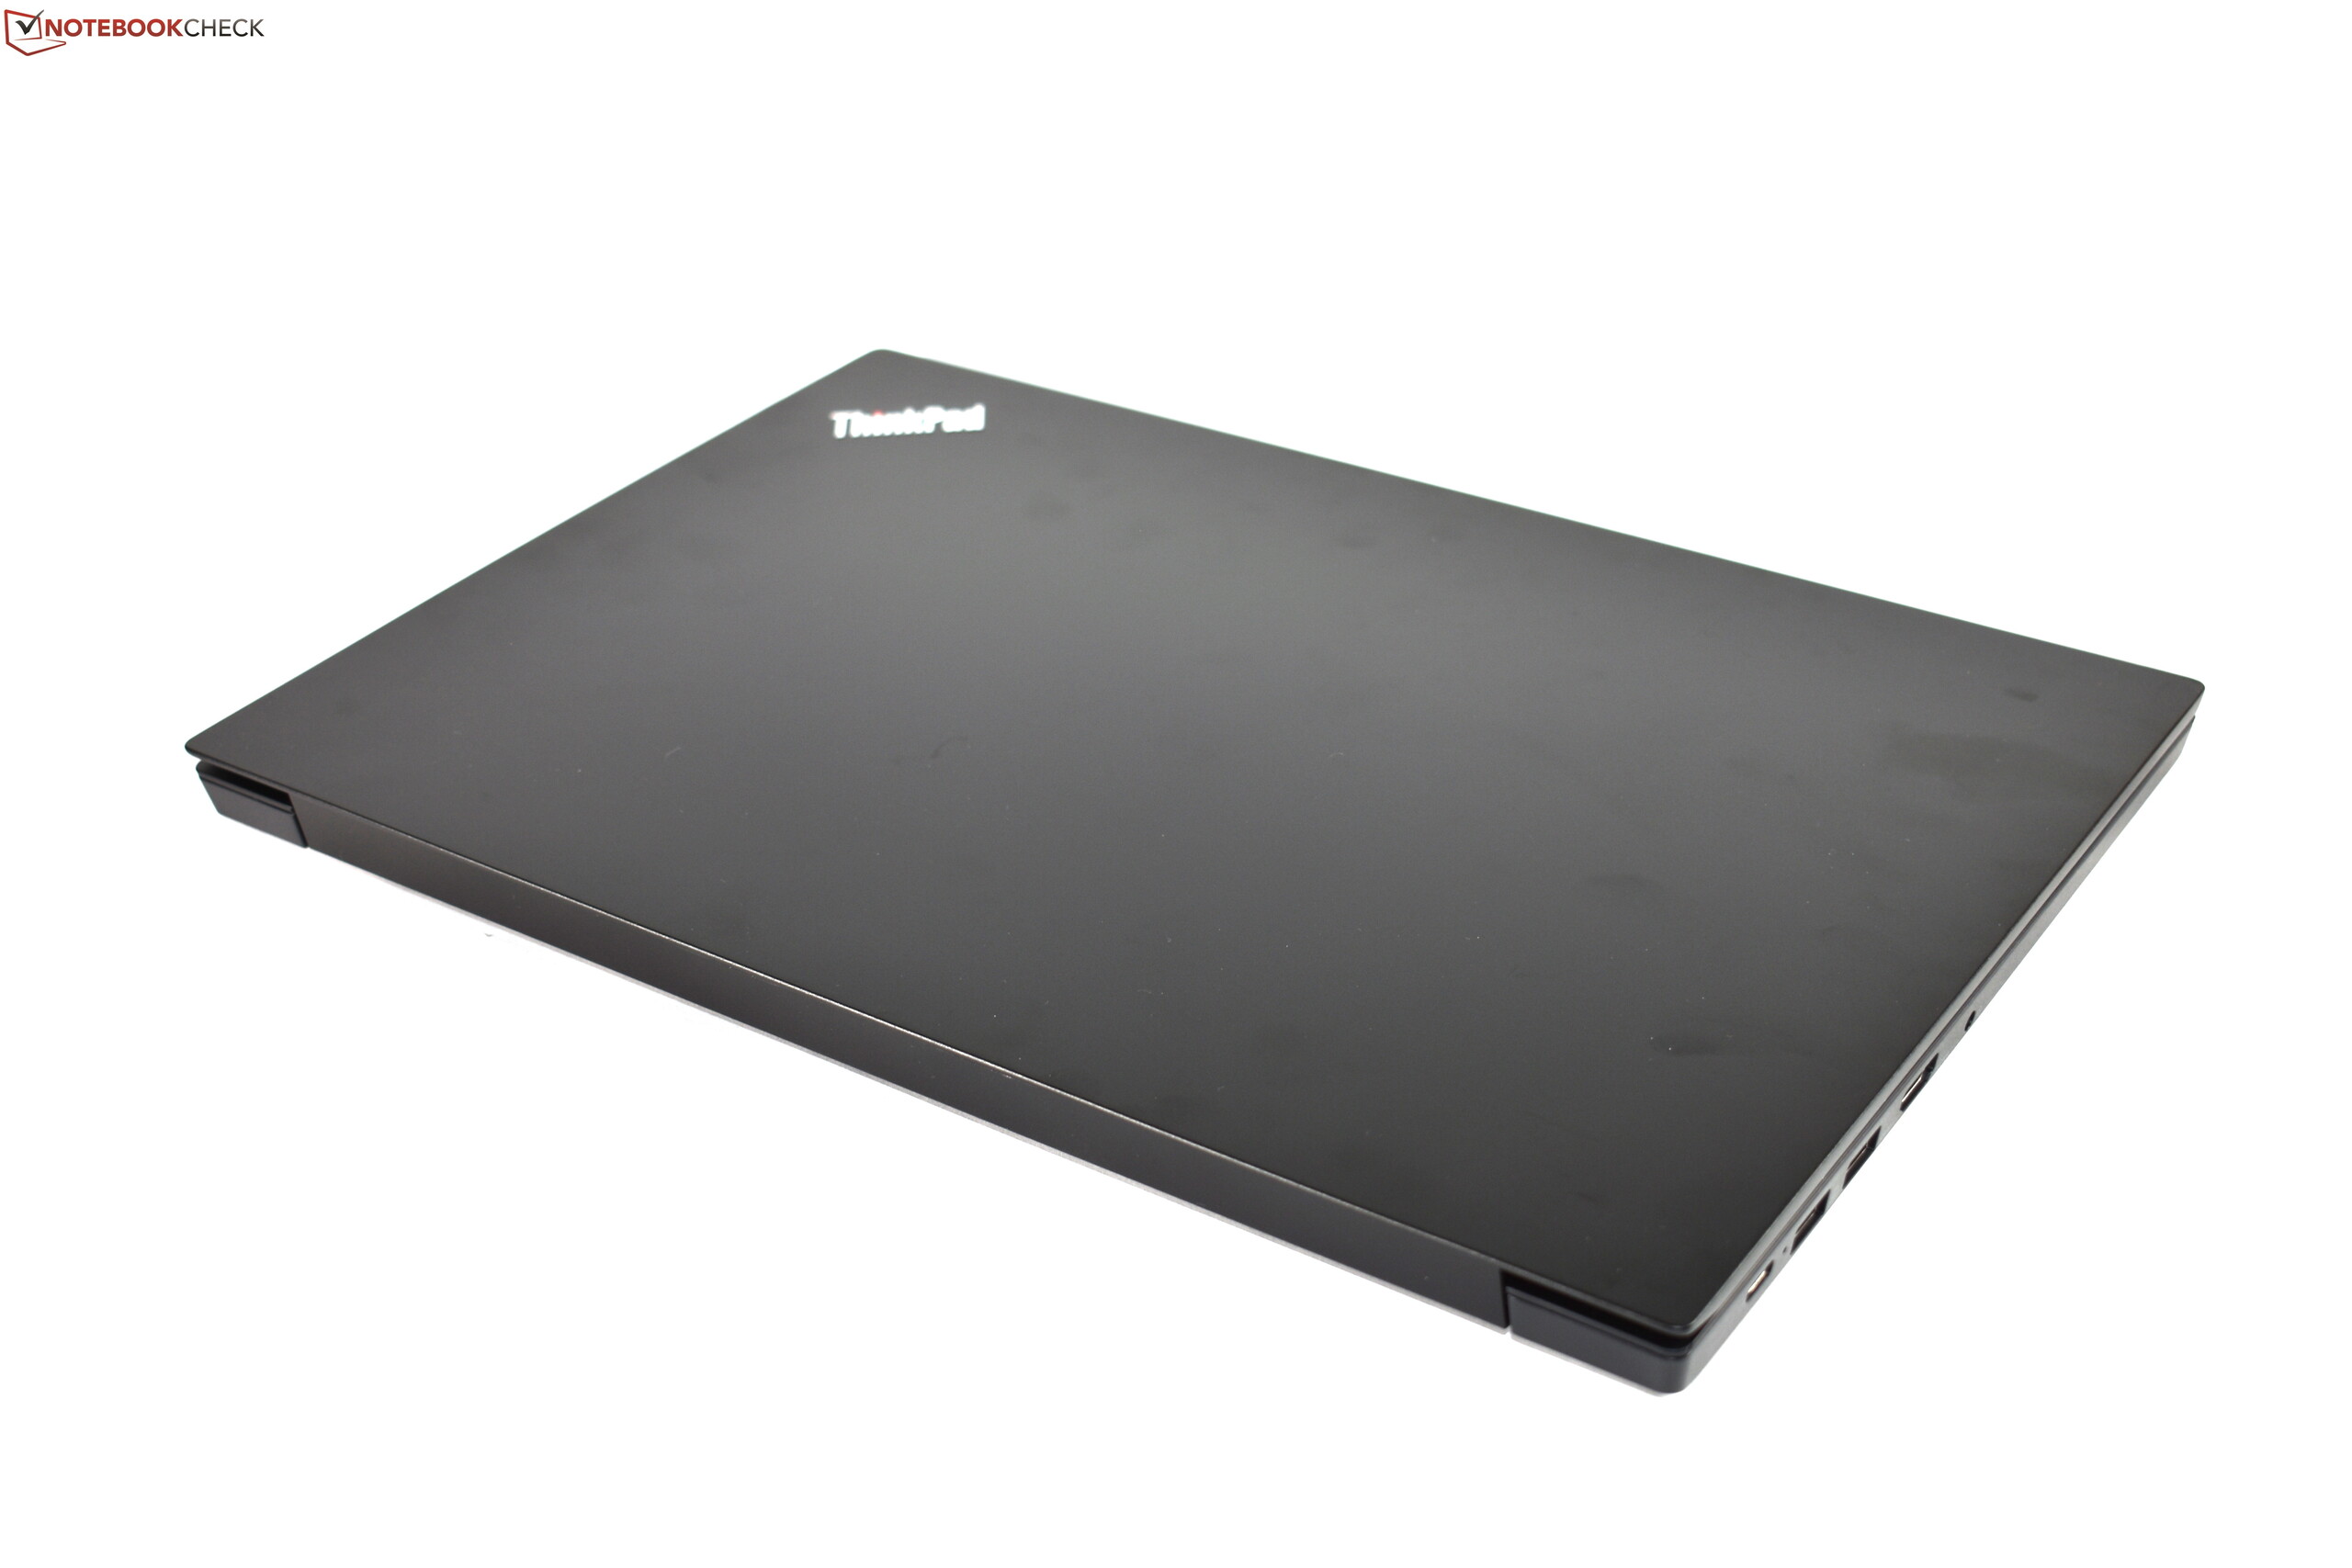
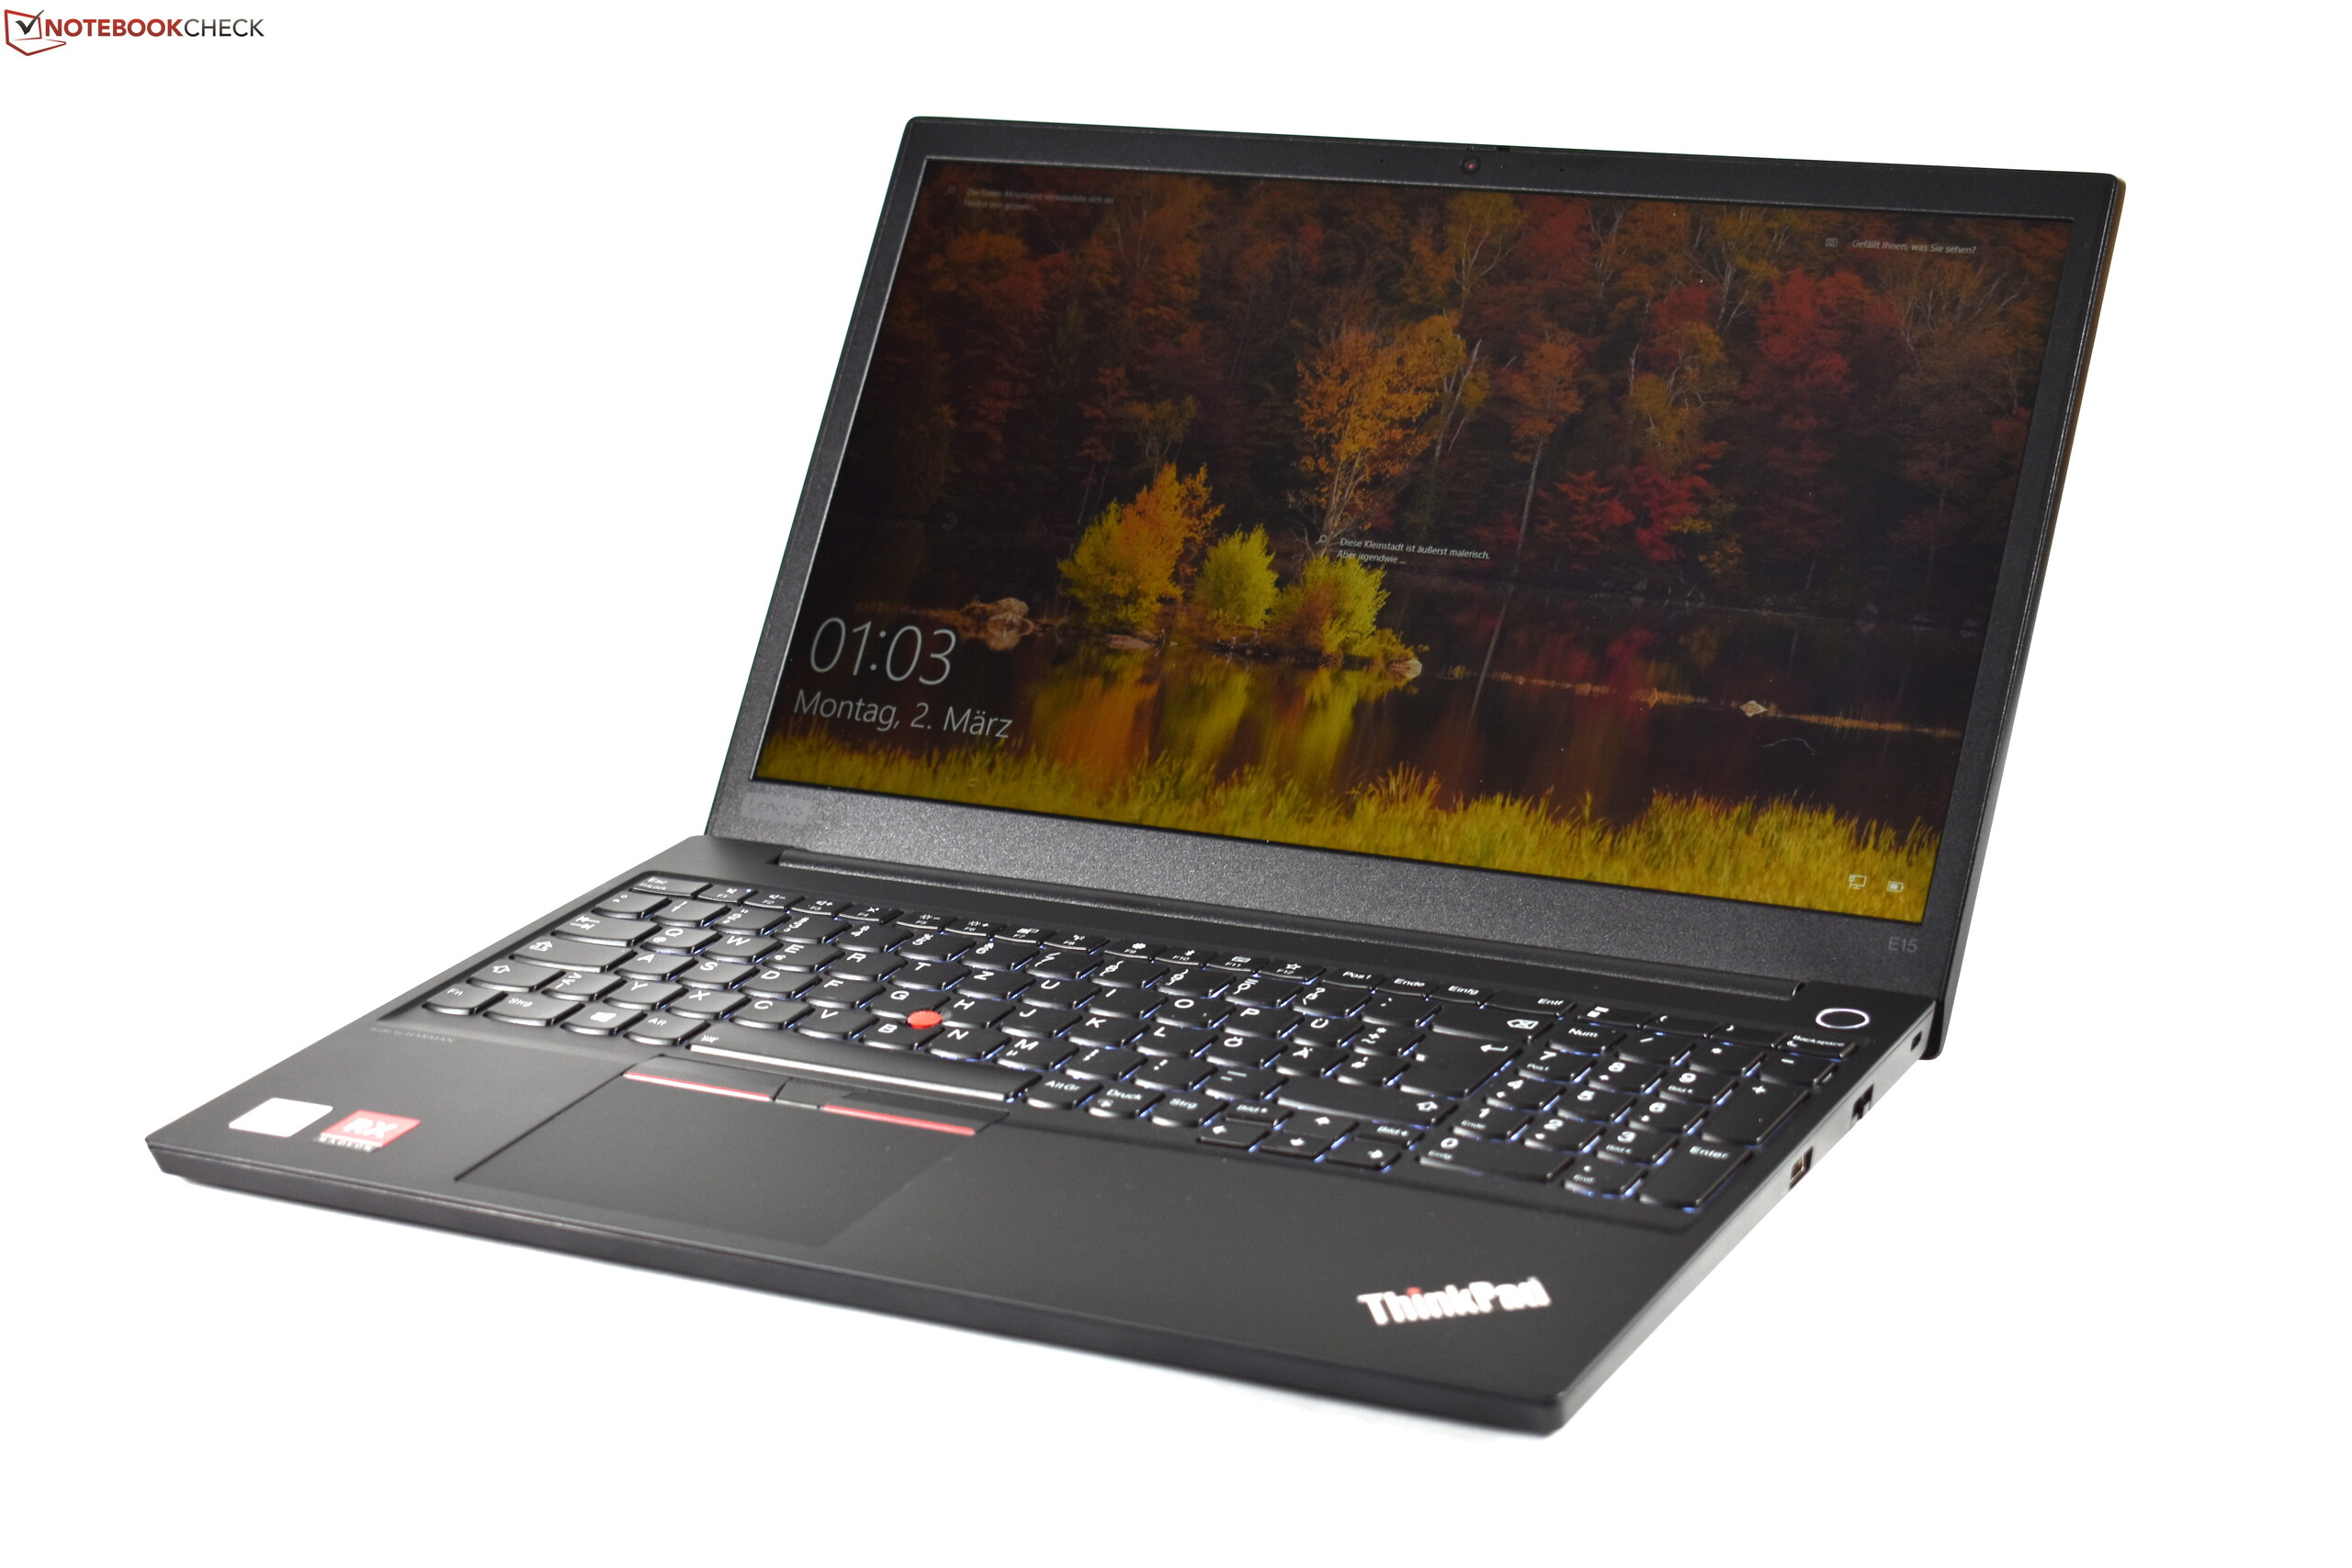
Embora o Lenovo ThinkPad E15 pareça um enorme avanço em comparação com o Lenovo ThinkPad E590 baseado somente no seu nome: O ThinkPad E15 é muito parecido com o seu antecessor. O conceito básico do produto não mudou, mas a Lenovo trabalhou nos detalhes. Ainda está o muito bom teclado ThinkPad, bem como o TrackPoint, um recurso raro nessa faixa de preços. O chassi feito de alumínio e plástico é robusto e a capacidade de atualização é exemplar - pelo menos em termos de armazenamento massivo.
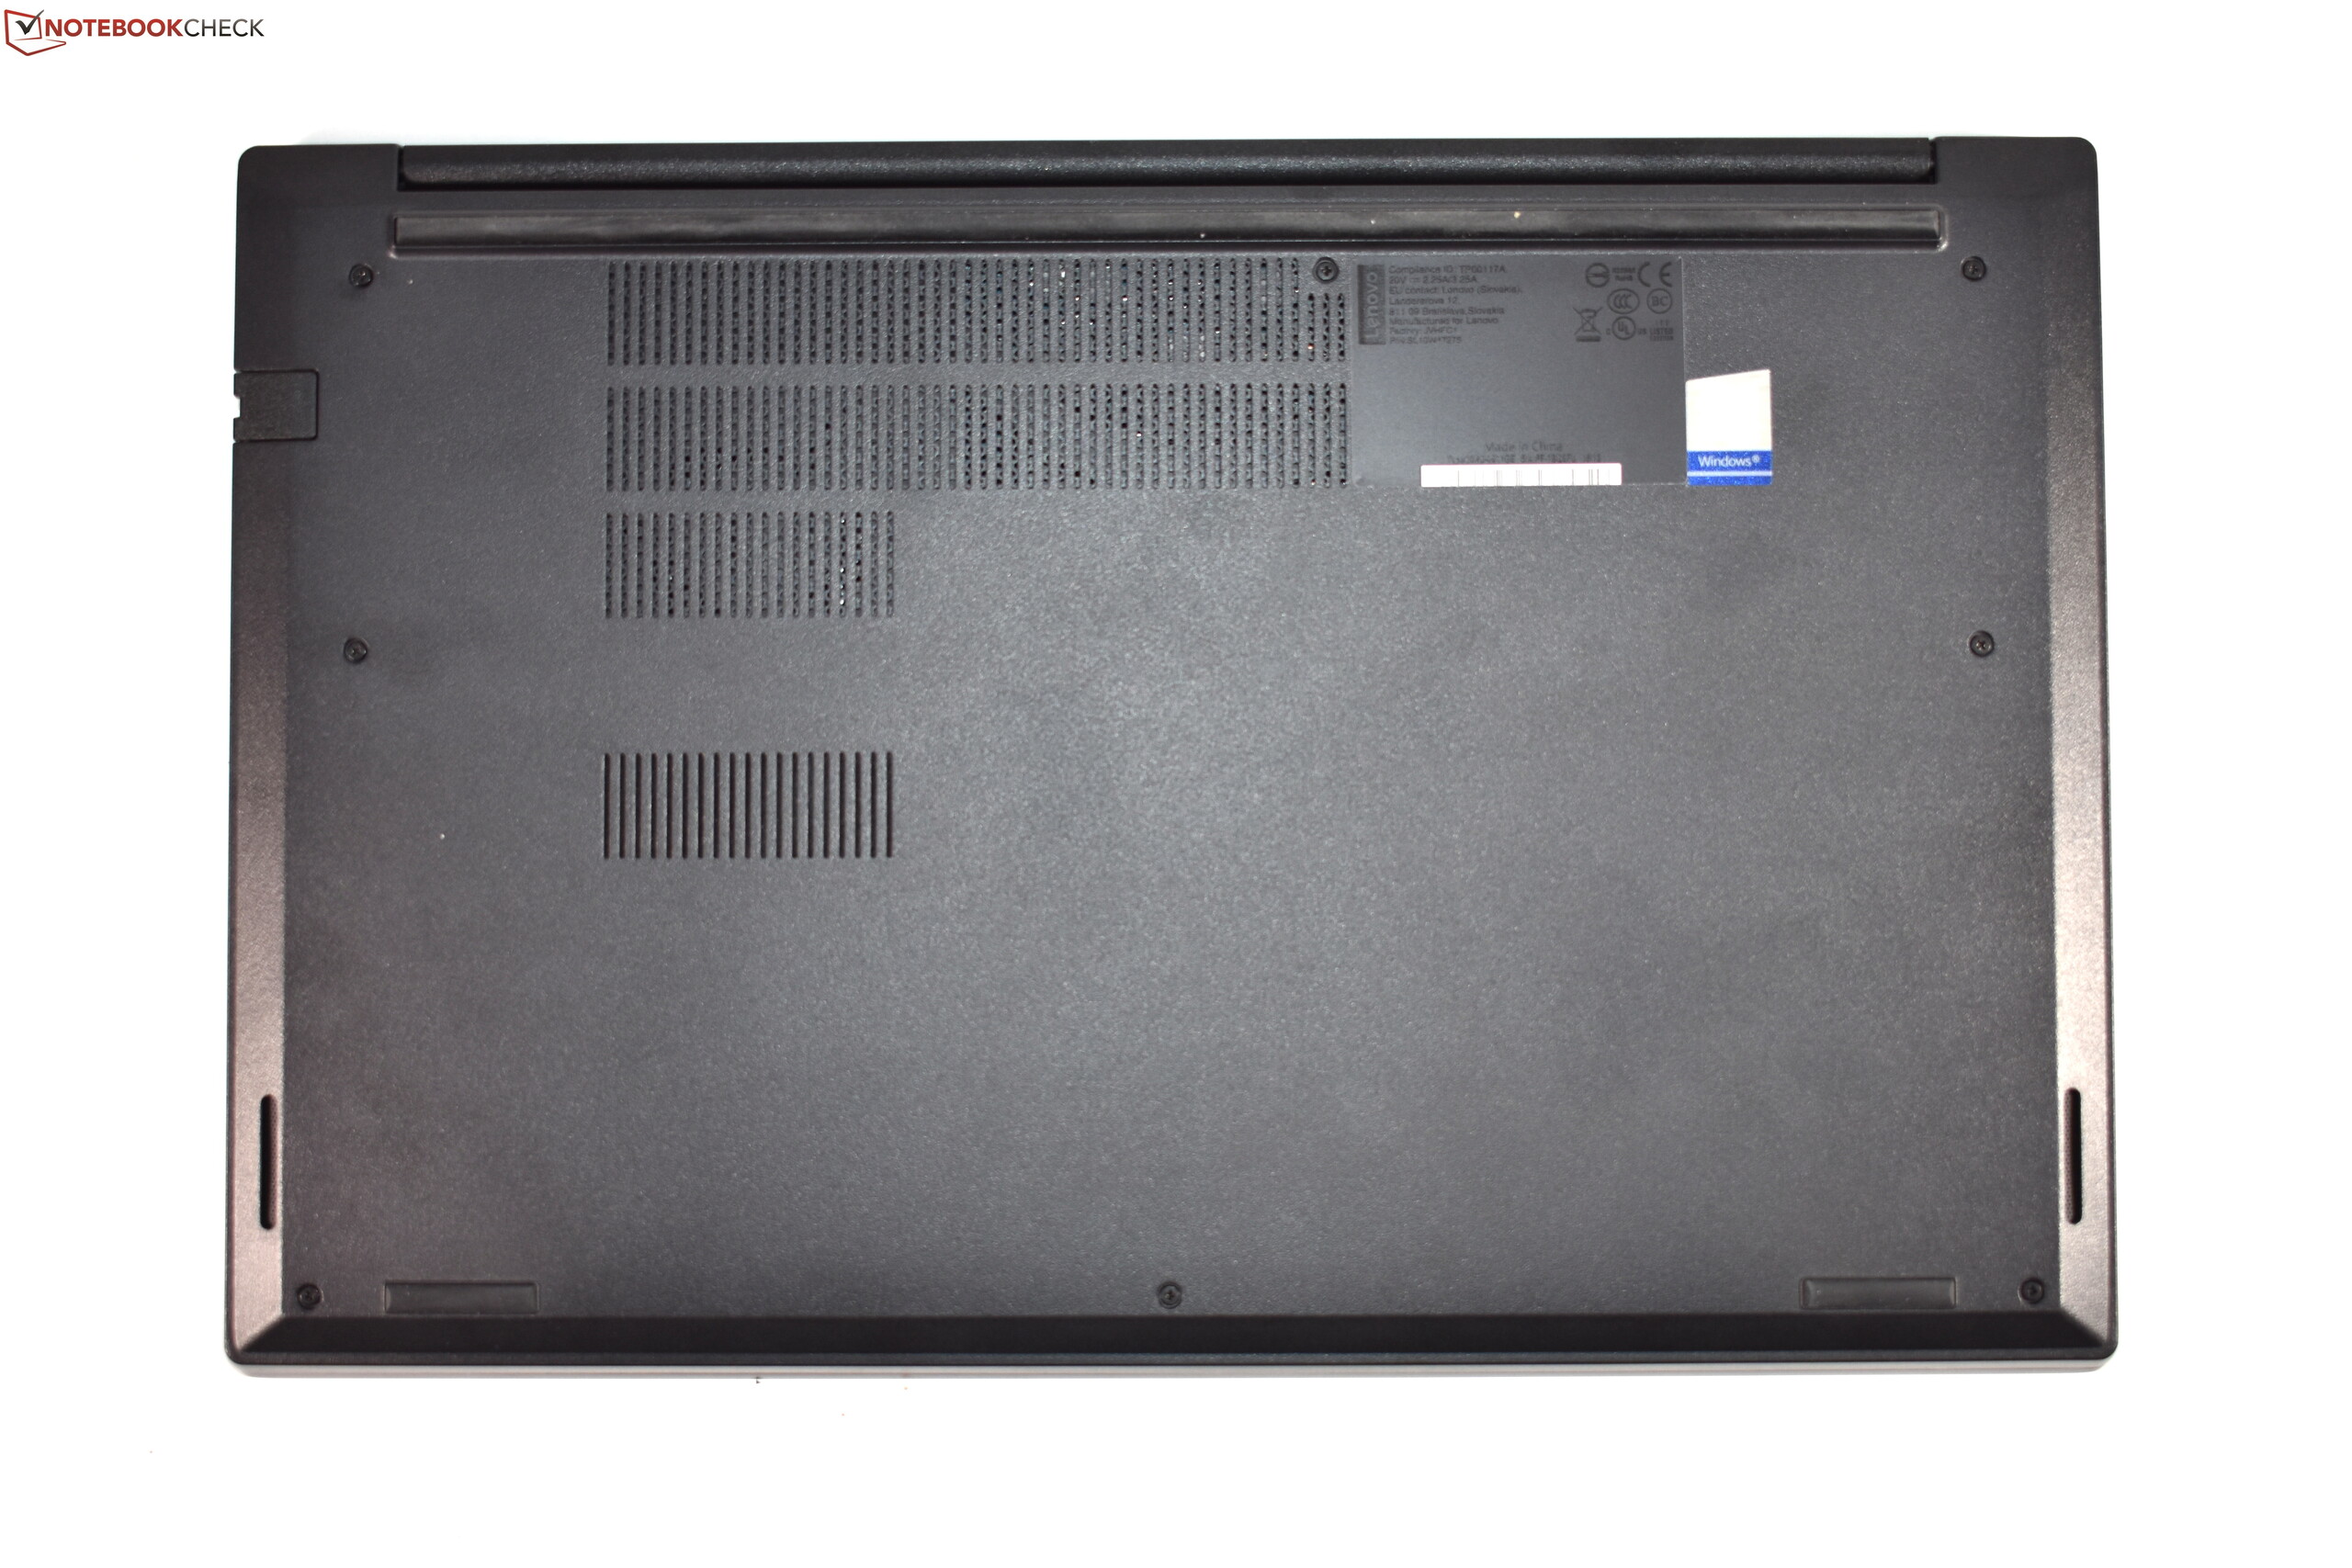
Como o ThinkPad E14 menor, o uso de um chassi mais fino significa que alguns recursos são perdidos. Um deles é o slot microSD. O segundo slot de RAM também faz muita falta. Onde o E15 difere de seu parente menor está no fato de que os recursos ausentes não são o maior problema aqui. Para o ThinkPad E15, é o sistema de refrigeração, que é simplesmente sobrecarregado. No teste de estresse, o ThinkPad precisa afogar muito a CPU e a GPU. A aceleração também pode ocorrer no uso diário e durante os jogos. Além disso, o chassi fica extremamente quente, com mais de 65 °C. É verdade que isso acontece apenas no teste de estresse, mas no teste menos exigente de The Witcher 3, o chassi esquenta quase assim.
Muito quente: Uma GPU dedicada só deve ser incorporada se puder ser resfriada adequadamente sob uso intenso. Infelizmente, esse não é o caso do Lenovo ThinkPad E15.
No geral, não podemos recomendar o Lenovo ThinkPad E15 com a dGPU. O chip da AMD está simplesmente extraviado aqui, se não puder ser resfriado o suficiente. Enquanto isso, a versão iGPU pode valer a pena - como uma versão maior do ThinkPad E14 e um bom portátil para o escritório em casa.
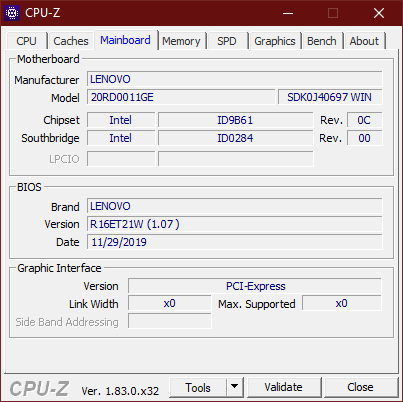
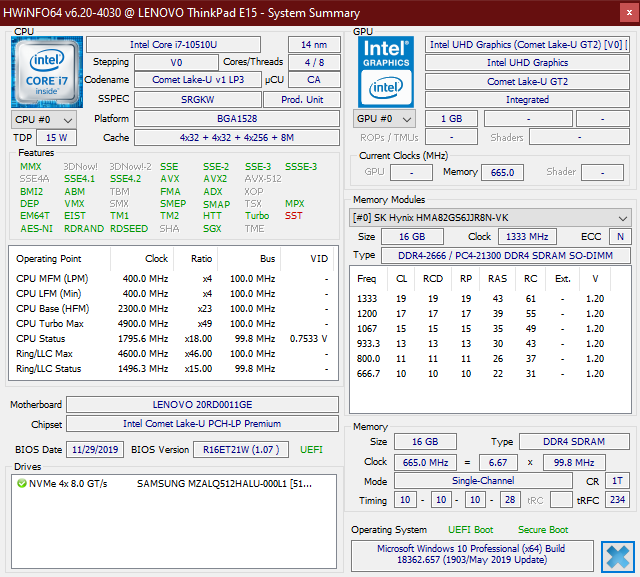
Lenovo ThinkPad E15 20RD0011GE
- 03/17/2020 v7 (old)
Benjamin Herzig
Price comparison
