Breve Análise do Portátil Empresarial Lenovo ThinkPad T590: Grande e Leve, mas com tela ruim

| SD Card Reader | |
| average JPG Copy Test (av. of 3 runs) | |
| Dell Latitude 5590 (Toshiba Exceria Pro SDXC 64 GB UHS-II) | |
| Lenovo ThinkPad T580-20LAS01H00 (Toshiba Exceria Pro SDXC 64 GB UHS-II) | |
| Lenovo ThinkPad T490-20N3S02L00 (Toshiba Exceria Pro M501) | |
| Lenovo ThinkPad T590-20N4002VGE (Toshiba Exceria Pro M501 UHS-II) | |
| Fujitsu LifeBook U758 (Toshiba Exceria Pro SDXC 64 GB UHS-II) | |
| Lenovo ThinkPad T490s-20NYS02A00 (Toshiba Exceria Pro M501) | |
| Média da turma Office (19.8 - 198.5, n=22, últimos 2 anos) | |
| maximum AS SSD Seq Read Test (1GB) | |
| Dell Latitude 5590 (Toshiba Exceria Pro SDXC 64 GB UHS-II) | |
| Lenovo ThinkPad T490s-20NYS02A00 (Toshiba Exceria Pro M501) | |
| Lenovo ThinkPad T580-20LAS01H00 (Toshiba Exceria Pro SDXC 64 GB UHS-II) | |
| Fujitsu LifeBook U758 (Toshiba Exceria Pro SDXC 64 GB UHS-II) | |
| Lenovo ThinkPad T490-20N3S02L00 (Toshiba Exceria Pro M501) | |
| Lenovo ThinkPad T590-20N4002VGE (Toshiba Exceria Pro M501 UHS-II) | |
| Média da turma Office (27.4 - 249, n=21, últimos 2 anos) | |
| Networking | |
| iperf3 transmit AX12 | |
| Lenovo ThinkPad T490-20N3S02L00 | |
| HP EliteBook 850 G5 3JX58EA | |
| Lenovo ThinkPad T490s-20NYS02A00 | |
| Lenovo ThinkPad T590-20N4002VGE | |
| Fujitsu LifeBook U758 | |
| Dell Latitude 5590 | |
| Lenovo ThinkPad T580-20LAS01H00 | |
| iperf3 receive AX12 | |
| Lenovo ThinkPad T490-20N3S02L00 | |
| Lenovo ThinkPad T590-20N4002VGE | |
| Lenovo ThinkPad T490s-20NYS02A00 | |
| Fujitsu LifeBook U758 | |
| Lenovo ThinkPad T580-20LAS01H00 | |
| HP EliteBook 850 G5 3JX58EA | |
| Dell Latitude 5590 | |
| |||||||||||||||||||||||||
iluminação: 88 %
iluminação com acumulador: 277 cd/m²
Contraste: 1200:1 (Preto: 0.23 cd/m²)
ΔE ColorChecker Calman: 5.6 | ∀{0.5-29.43 Ø4.71}
calibrated: 4.7
ΔE Greyscale Calman: 3 | ∀{0.09-98 Ø4.96}
58.1% sRGB (Argyll 1.6.3 3D)
36.9% AdobeRGB 1998 (Argyll 1.6.3 3D)
40.11% AdobeRGB 1998 (Argyll 3D)
58.3% sRGB (Argyll 3D)
38.79% Display P3 (Argyll 3D)
Gamma: 2.18
CCT: 7075 K
| Lenovo ThinkPad T590-20N4002VGE LP156WFC-SPD1, , 1920x1080, 15.6" | Lenovo ThinkPad T580-20L9001AUS B156HAK02.0, , 1920x1080, 15.6" | HP EliteBook 850 G5 3JX58EA AUO24ED, , 1920x1080, 15.6" | Dell Latitude 5590 NV15N42, , 1920x1080, 15.6" | Fujitsu LifeBook U758 LG, LP156UD1-SPB1, , 3840x2160, 15.6" | Lenovo ThinkPad T490-20N3S02L00 NE140FHM-N61, , 1920x1080, 14" | Lenovo ThinkPad T490s-20NYS02A00 B140HAN05.7, , 1920x1080, 14" | |
|---|---|---|---|---|---|---|---|
| Display | -5% | 59% | 6% | 66% | 68% | 70% | |
| Display P3 Coverage (%) | 38.79 | 36.94 -5% | 63.4 63% | 41.56 7% | 65.4 69% | 69.3 79% | 67.1 73% |
| sRGB Coverage (%) | 58.3 | 55.3 -5% | 88.8 52% | 61.3 5% | 94.2 62% | 92.2 58% | 97.6 67% |
| AdobeRGB 1998 Coverage (%) | 40.11 | 38.16 -5% | 64.4 61% | 42.93 7% | 66.9 67% | 67.4 68% | 68.5 71% |
| Response Times | 5% | -3% | -45% | -5% | -84% | -55% | |
| Response Time Grey 50% / Grey 80% * (ms) | 37.2 ? | 33.2 ? 11% | 42 ? -13% | 53.2 ? -43% | 38.4 ? -3% | 74 ? -99% | 61.6 ? -66% |
| Response Time Black / White * (ms) | 27.2 ? | 27.6 ? -1% | 25 ? 8% | 39.6 ? -46% | 29.2 ? -7% | 45.6 ? -68% | 38.8 ? -43% |
| PWM Frequency (Hz) | 1000 ? | 2451 ? | |||||
| Screen | -5% | 11% | -12% | 26% | 26% | 38% | |
| Brightness middle (cd/m²) | 276 | 254.5 -8% | 402 46% | 243 -12% | 312 13% | 418 51% | 391 42% |
| Brightness (cd/m²) | 262 | 238 -9% | 383 46% | 234 -11% | 304 16% | 400 53% | 389 48% |
| Brightness Distribution (%) | 88 | 87 -1% | 88 0% | 83 -6% | 93 6% | 88 0% | 87 -1% |
| Black Level * (cd/m²) | 0.23 | 0.27 -17% | 0.41 -78% | 0.19 17% | 0.24 -4% | 0.24 -4% | 0.23 -0% |
| Contrast (:1) | 1200 | 943 -21% | 980 -18% | 1279 7% | 1300 8% | 1742 45% | 1700 42% |
| Colorchecker dE 2000 * | 5.6 | 4.58 18% | 5.25 6% | 6.6 -18% | 3.4 39% | 4.7 16% | 3.4 39% |
| Colorchecker dE 2000 max. * | 16.4 | 17.99 -10% | 8.65 47% | 22.3 -36% | 5.6 66% | 8.7 47% | 4.7 71% |
| Colorchecker dE 2000 calibrated * | 4.7 | 4.34 8% | 5.19 -10% | 5 -6% | 2.7 43% | 2.1 55% | 1.1 77% |
| Greyscale dE 2000 * | 3 | 3.3 -10% | 4 -33% | 5.2 -73% | 4 -33% | 5.9 -97% | 4 -33% |
| Gamma | 2.18 101% | 2.403 92% | 2.68 82% | 2.24 98% | 2.25 98% | 2.06 107% | 2.49 88% |
| CCT | 7075 92% | 6355 102% | 6756 96% | 6990 93% | 6977 93% | 7350 88% | 6809 95% |
| Color Space (Percent of AdobeRGB 1998) (%) | 36.9 | 35 -5% | 58 57% | 39.2 6% | 60.9 65% | 59.9 62% | 62.4 69% |
| Color Space (Percent of sRGB) (%) | 58.1 | 55 -5% | 89 53% | 60.8 5% | 94.1 62% | 92.1 59% | 97.4 68% |
| Média Total (Programa/Configurações) | -2% /
-4% | 22% /
18% | -17% /
-12% | 29% /
29% | 3% /
20% | 18% /
33% |
* ... menor é melhor
Exibir tempos de resposta
| ↔ Tempo de resposta preto para branco | ||
|---|---|---|
| 27.2 ms ... ascensão ↗ e queda ↘ combinadas | ↗ 17.2 ms ascensão | 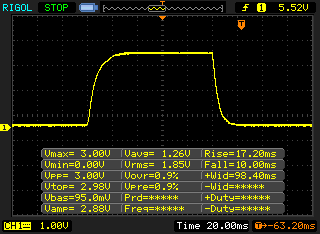 |
| ↘ 10 ms queda | ||
| A tela mostra taxas de resposta relativamente lentas em nossos testes e pode ser muito lenta para os jogadores. Em comparação, todos os dispositivos testados variam de 0.1 (mínimo) a 240 (máximo) ms. » 69 % de todos os dispositivos são melhores. Isso significa que o tempo de resposta medido é pior que a média de todos os dispositivos testados (19.8 ms). | ||
| ↔ Tempo de resposta 50% cinza a 80% cinza | ||
| 37.2 ms ... ascensão ↗ e queda ↘ combinadas | ↗ 19.2 ms ascensão | 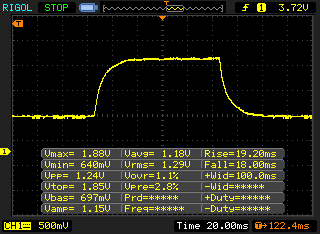 |
| ↘ 18 ms queda | ||
| A tela mostra taxas de resposta lentas em nossos testes e será insatisfatória para os jogadores. Em comparação, todos os dispositivos testados variam de 0.165 (mínimo) a 636 (máximo) ms. » 54 % de todos os dispositivos são melhores. Isso significa que o tempo de resposta medido é pior que a média de todos os dispositivos testados (31 ms). | ||
Cintilação da tela / PWM (modulação por largura de pulso)
| Tela tremeluzindo / PWM não detectado | 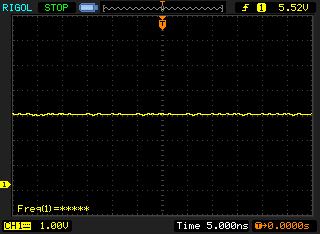 | ||
[pwm_comparison] Em comparação: 52 % de todos os dispositivos testados não usam PWM para escurecer a tela. Se PWM foi detectado, uma média de 7747 (mínimo: 5 - máximo: 343500) Hz foi medida. | |||
| PCMark 8 Home Score Accelerated v2 | 3885 pontos | |
| PCMark 8 Work Score Accelerated v2 | 5225 pontos | |
| PCMark 10 Score | 4547 pontos | |
Ajuda | ||
| Lenovo ThinkPad T590-20N4002VGE Toshiba XG6 KXG60ZNV512G | Lenovo ThinkPad T580-20LAS01H00 Samsung SSD PM981 MZVLB512HAJQ | HP EliteBook 850 G5 3JX58EA Toshiba XG5 KXG50ZNV256G | Dell Latitude 5590 SK hynix SC311 M.2 | Fujitsu LifeBook U758 Toshiba KXG5AZNV1T02 | Lenovo ThinkPad T490-20N3S02L00 Toshiba XG5 KXG50ZNV512G | Lenovo ThinkPad T490s-20NYS02A00 Intel SSD Pro 7600p SSDPEKKF512G8L | Média Toshiba XG6 KXG60ZNV512G | |
|---|---|---|---|---|---|---|---|---|
| CrystalDiskMark 5.2 / 6 | -31% | -33% | -55% | -11% | -7% | -5% | -6% | |
| Write 4K (MB/s) | 126.2 | 131.4 4% | 95.9 -24% | 76.7 -39% | 115.3 -9% | 126.6 0% | 122 -3% | 112.8 ? -11% |
| Read 4K (MB/s) | 48.93 | 29.47 -40% | 30.91 -37% | 28.41 -42% | 28.7 -41% | 43.61 -11% | 45.56 -7% | 42.7 ? -13% |
| Write Seq (MB/s) | 1345 | 878 -35% | 312.5 -77% | 436.7 -68% | 955 -29% | 1342 0% | 1497 11% | 1489 ? 11% |
| Read Seq (MB/s) | 1373 | 883 -36% | 1966 43% | 508 -63% | 1951 42% | 1251 -9% | 2385 74% | 1771 ? 29% |
| Write 4K Q32T1 (MB/s) | 383.8 | 256 -33% | 308.8 -20% | 288.1 -25% | 543 41% | 297.7 -22% | 240.9 -37% | 345 ? -10% |
| Read 4K Q32T1 (MB/s) | 434.8 | 337.7 -22% | 248.6 -43% | 271.9 -37% | 346.6 -20% | 376.4 -13% | 338 -22% | 359 ? -17% |
| Write Seq Q32T1 (MB/s) | 2966 | 1723 -42% | 292.2 -90% | 503 -83% | 959 -68% | 2969 0% | 1528 -48% | 2257 ? -24% |
| Read Seq Q32T1 (MB/s) | 3230 | 1778 -45% | 2718 -16% | 549 -83% | 3094 -4% | 3228 0% | 2915 -10% | 2926 ? -9% |

| 3DMark 11 Performance | 4449 pontos | |
| 3DMark Cloud Gate Standard Score | 8009 pontos | |
| 3DMark Fire Strike Score | 3194 pontos | |
Ajuda | ||
| The Witcher 3 - 1366x768 Medium Graphics & Postprocessing | |
| Lenovo ThinkPad X1 Extreme-20MF000RGE | |
| Média da turma Office (44.7 - 90.4, n=3, últimos 2 anos) | |
| Lenovo ThinkPad T590-20N4002VGE | |
| Média NVIDIA GeForce MX250 (30 - 40, n=27) | |
| Lenovo ThinkPad T580-20LAS01H00 | |
| baixo | média | alto | ultra | |
|---|---|---|---|---|
| BioShock Infinite (2013) | 208 | 112 | 97 | 38 |
| The Witcher 3 (2015) | 49.9 | 35.8 | 21 | 12.6 |
| Dota 2 Reborn (2015) | 71 | 21.8 | 8.6 | 7.8 |
| Civilization 6 (2016) | 123.3 | 62.2 | 22.7 | 20.3 |
| X-Plane 11.11 (2018) | 18.8 | 9.8 | 9.8 |
Barulho
| Ocioso |
| 29.3 / 29.3 / 31.8 dB |
| Carga |
| 33.5 / 35.8 dB |
 | ||
30 dB silencioso 40 dB(A) audível 50 dB(A) ruidosamente alto |
||
min: | ||
(±) A temperatura máxima no lado superior é 44.7 °C / 112 F, em comparação com a média de 34.3 °C / 94 F , variando de 21.2 a 62.5 °C para a classe Office.
(-) A parte inferior aquece até um máximo de 56.3 °C / 133 F, em comparação com a média de 36.8 °C / 98 F
(+) Em uso inativo, a temperatura média para o lado superior é 22.6 °C / 73 F, em comparação com a média do dispositivo de 29.5 °C / ### class_avg_f### F.
(±) Jogando The Witcher 3, a temperatura média para o lado superior é 36 °C / 97 F, em comparação com a média do dispositivo de 29.5 °C / ## #class_avg_f### F.
(+) Os apoios para as mãos e o touchpad são mais frios que a temperatura da pele, com um máximo de 30.5 °C / 86.9 F e, portanto, são frios ao toque.
(-) A temperatura média da área do apoio para as mãos de dispositivos semelhantes foi 27.5 °C / 81.5 F (-3 °C / -5.4 F).
Lenovo ThinkPad T590-20N4002VGE análise de áudio
(-) | alto-falantes não muito altos (###valor### dB)
Graves 100 - 315Hz
(-) | quase nenhum baixo - em média 16% menor que a mediana
(±) | a linearidade dos graves é média (7.9% delta para a frequência anterior)
Médios 400 - 2.000 Hz
(+) | médios equilibrados - apenas 4.3% longe da mediana
(±) | a linearidade dos médios é média (8.7% delta para frequência anterior)
Altos 2 - 16 kHz
(+) | agudos equilibrados - apenas 4.4% longe da mediana
(+) | os máximos são lineares (6.5% delta da frequência anterior)
Geral 100 - 16.000 Hz
(±) | a linearidade do som geral é média (25.5% diferença em relação à mediana)
Comparado com a mesma classe
» 78% de todos os dispositivos testados nesta classe foram melhores, 6% semelhantes, 16% piores
» O melhor teve um delta de 7%, a média foi 21%, o pior foi 53%
Comparado com todos os dispositivos testados
» 78% de todos os dispositivos testados foram melhores, 4% semelhantes, 17% piores
» O melhor teve um delta de 4%, a média foi 23%, o pior foi 134%
HP EliteBook 850 G5 3JX58EA análise de áudio
(±) | o volume do alto-falante é médio, mas bom (###valor### dB)
Graves 100 - 315Hz
(-) | quase nenhum baixo - em média 28.1% menor que a mediana
(±) | a linearidade dos graves é média (11.4% delta para a frequência anterior)
Médios 400 - 2.000 Hz
(+) | médios equilibrados - apenas 2.1% longe da mediana
(±) | a linearidade dos médios é média (7.6% delta para frequência anterior)
Altos 2 - 16 kHz
(±) | máximos mais altos - em média 5.5% maior que a mediana
(+) | os máximos são lineares (2.4% delta da frequência anterior)
Geral 100 - 16.000 Hz
(±) | a linearidade do som geral é média (20.4% diferença em relação à mediana)
Comparado com a mesma classe
» 45% de todos os dispositivos testados nesta classe foram melhores, 10% semelhantes, 45% piores
» O melhor teve um delta de 7%, a média foi 21%, o pior foi 53%
Comparado com todos os dispositivos testados
» 54% de todos os dispositivos testados foram melhores, 8% semelhantes, 38% piores
» O melhor teve um delta de 4%, a média foi 23%, o pior foi 134%
Lenovo ThinkPad T580-20L9001AUS análise de áudio
(±) | o volume do alto-falante é médio, mas bom (###valor### dB)
Graves 100 - 315Hz
(±) | graves reduzidos - em média 7.5% menor que a mediana
(±) | a linearidade dos graves é média (7.8% delta para a frequência anterior)
Médios 400 - 2.000 Hz
(+) | médios equilibrados - apenas 3.6% longe da mediana
(±) | a linearidade dos médios é média (7% delta para frequência anterior)
Altos 2 - 16 kHz
(+) | agudos equilibrados - apenas 2.3% longe da mediana
(±) | a linearidade dos máximos é média (8.3% delta para frequência anterior)
Geral 100 - 16.000 Hz
(+) | o som geral é linear (12.7% diferença em relação à mediana)
Comparado com a mesma classe
» 6% de todos os dispositivos testados nesta classe foram melhores, 2% semelhantes, 93% piores
» O melhor teve um delta de 7%, a média foi 21%, o pior foi 53%
Comparado com todos os dispositivos testados
» 12% de todos os dispositivos testados foram melhores, 3% semelhantes, 86% piores
» O melhor teve um delta de 4%, a média foi 23%, o pior foi 134%
| desligado | |
| Ocioso | |
| Carga |
|
Key:
min: | |
| Lenovo ThinkPad T590-20N4002VGE i7-8565U, GeForce MX250, Toshiba XG6 KXG60ZNV512G, aSi IPS LED, 1920x1080, 15.6" | Lenovo ThinkPad T580-20LAS01H00 i5-8550U, GeForce MX150, Samsung SSD PM981 MZVLB512HAJQ, IPS LED, 3840x2160, 15.6" | HP EliteBook 850 G5 3JX58EA i5-8250U, UHD Graphics 620, Toshiba XG5 KXG50ZNV256G, IPS LED, 1920x1080, 15.6" | Dell Latitude 5590 i5-8250U, UHD Graphics 620, SK hynix SC311 M.2, IPS, 1920x1080, 15.6" | Fujitsu LifeBook U758 i7-8650U, UHD Graphics 620, Toshiba KXG5AZNV1T02, IPS, 3840x2160, 15.6" | Lenovo ThinkPad T490-20N3S02L00 i7-8565U, GeForce MX250, Toshiba XG5 KXG50ZNV512G, IGZO IPS LED, 1920x1080, 14" | Lenovo ThinkPad T490s-20NYS02A00 i5-8265U, UHD Graphics 620, Intel SSD Pro 7600p SSDPEKKF512G8L, IPS, 1920x1080, 14" | Média NVIDIA GeForce MX250 | Média da turma Office | |
|---|---|---|---|---|---|---|---|---|---|
| Power Consumption | -7% | 27% | 20% | -1% | 20% | 29% | 5% | 14% | |
| Idle Minimum * (Watt) | 4.1 | 5.3 -29% | 2.7 34% | 3.6 12% | 5.6 -37% | 2.16 47% | 2.62 36% | 4.1 ? -0% | 4.3 ? -5% |
| Idle Average * (Watt) | 8.3 | 10.2 -23% | 8.1 2% | 6.5 22% | 11.5 -39% | 5.04 39% | 5.16 38% | 7.91 ? 5% | 7.35 ? 11% |
| Idle Maximum * (Watt) | 11.8 | 13.6 -15% | 10.1 14% | 7.2 39% | 12.5 -6% | 8.64 27% | 8.7 26% | 10.4 ? 12% | 8.6 ? 27% |
| Load Average * (Watt) | 61.6 | 58.3 5% | 39 37% | 46.2 25% | 34.2 44% | 63.2 -3% | 40 35% | 58.6 ? 5% | 43.9 ? 29% |
| Witcher 3 ultra * (Watt) | 54.4 | 47.8 12% | 50 8% | ||||||
| Load Maximum * (Watt) | 69.4 | 65.3 6% | 37.2 46% | 68.8 1% | 47.9 31% | 67.5 3% | 64 8% | 68.9 ? 1% | 64.5 ? 7% |
* ... menor é melhor
| Lenovo ThinkPad T590-20N4002VGE i7-8565U, GeForce MX250, 57 Wh | Lenovo ThinkPad T580-20LAS01H00 i5-8550U, GeForce MX150, 105 Wh | HP EliteBook 850 G5 3JX58EA i5-8250U, UHD Graphics 620, 56 Wh | Dell Latitude 5590 i5-8250U, UHD Graphics 620, 51 Wh | Fujitsu LifeBook U758 i7-8650U, UHD Graphics 620, 50 Wh | Lenovo ThinkPad T490-20N3S02L00 i7-8565U, GeForce MX250, 50 Wh | Lenovo ThinkPad T490s-20NYS02A00 i5-8265U, UHD Graphics 620, 57 Wh | Média da turma Office | |
|---|---|---|---|---|---|---|---|---|
| Duração da bateria | -22% | -8% | -45% | -55% | -35% | -13% | 1% | |
| H.264 (h) | 12.1 | 9.4 -22% | 10.5 -13% | 6.7 -45% | 5.9 -51% | 8.7 -28% | 13.9 15% | 15.5 ? 28% |
| WiFi v1.3 (h) | 10.5 | 8.7 -17% | 9.3 -11% | 7.4 -30% | 4.6 -56% | 9.1 -13% | 10.1 -4% | 13 ? 24% |
| Load (h) | 3.5 | 2.6 -26% | 3.5 0% | 1.4 -60% | 1.5 -57% | 1.3 -63% | 1.7 -51% | 1.808 ? -48% |
| Reader / Idle (h) | 19.7 | 17.8 | 17.4 | 9.7 | 24.5 ? |
Pro
Contra
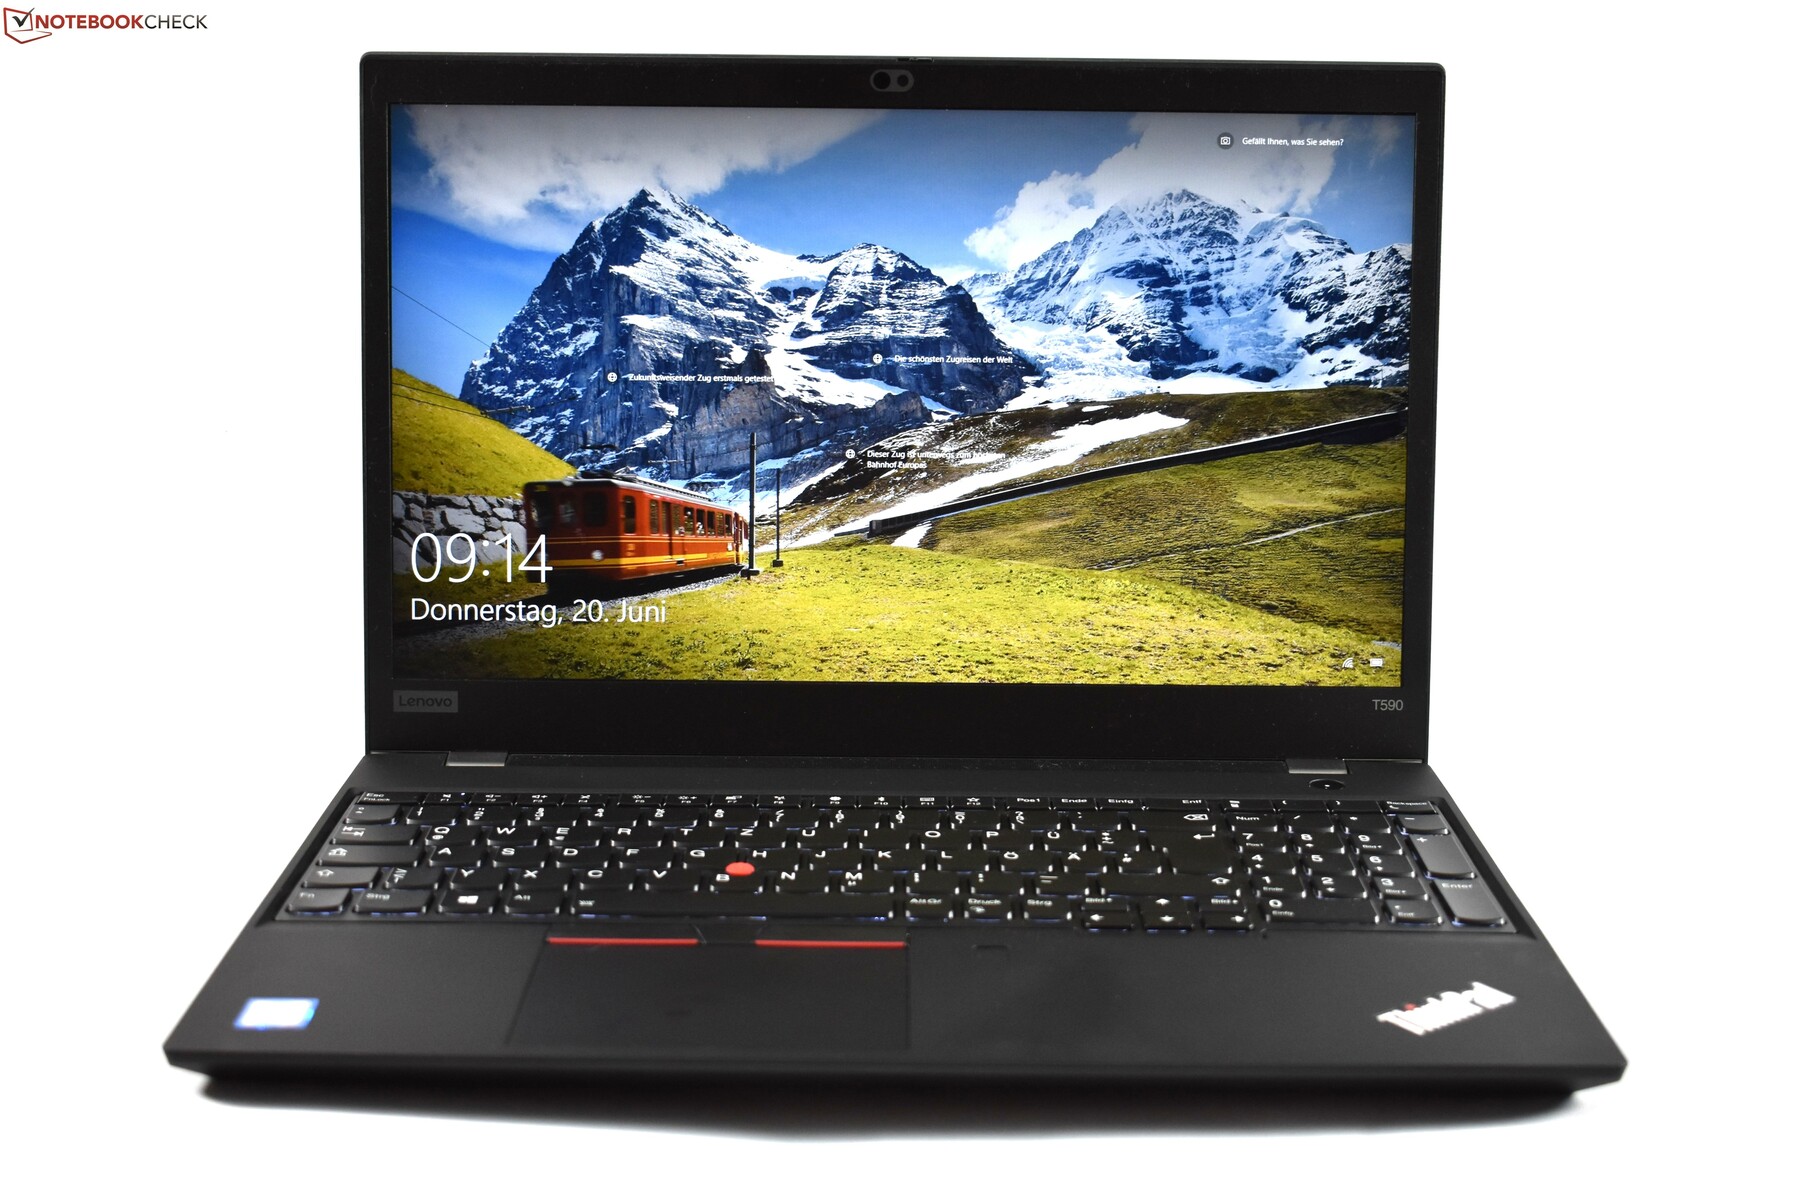
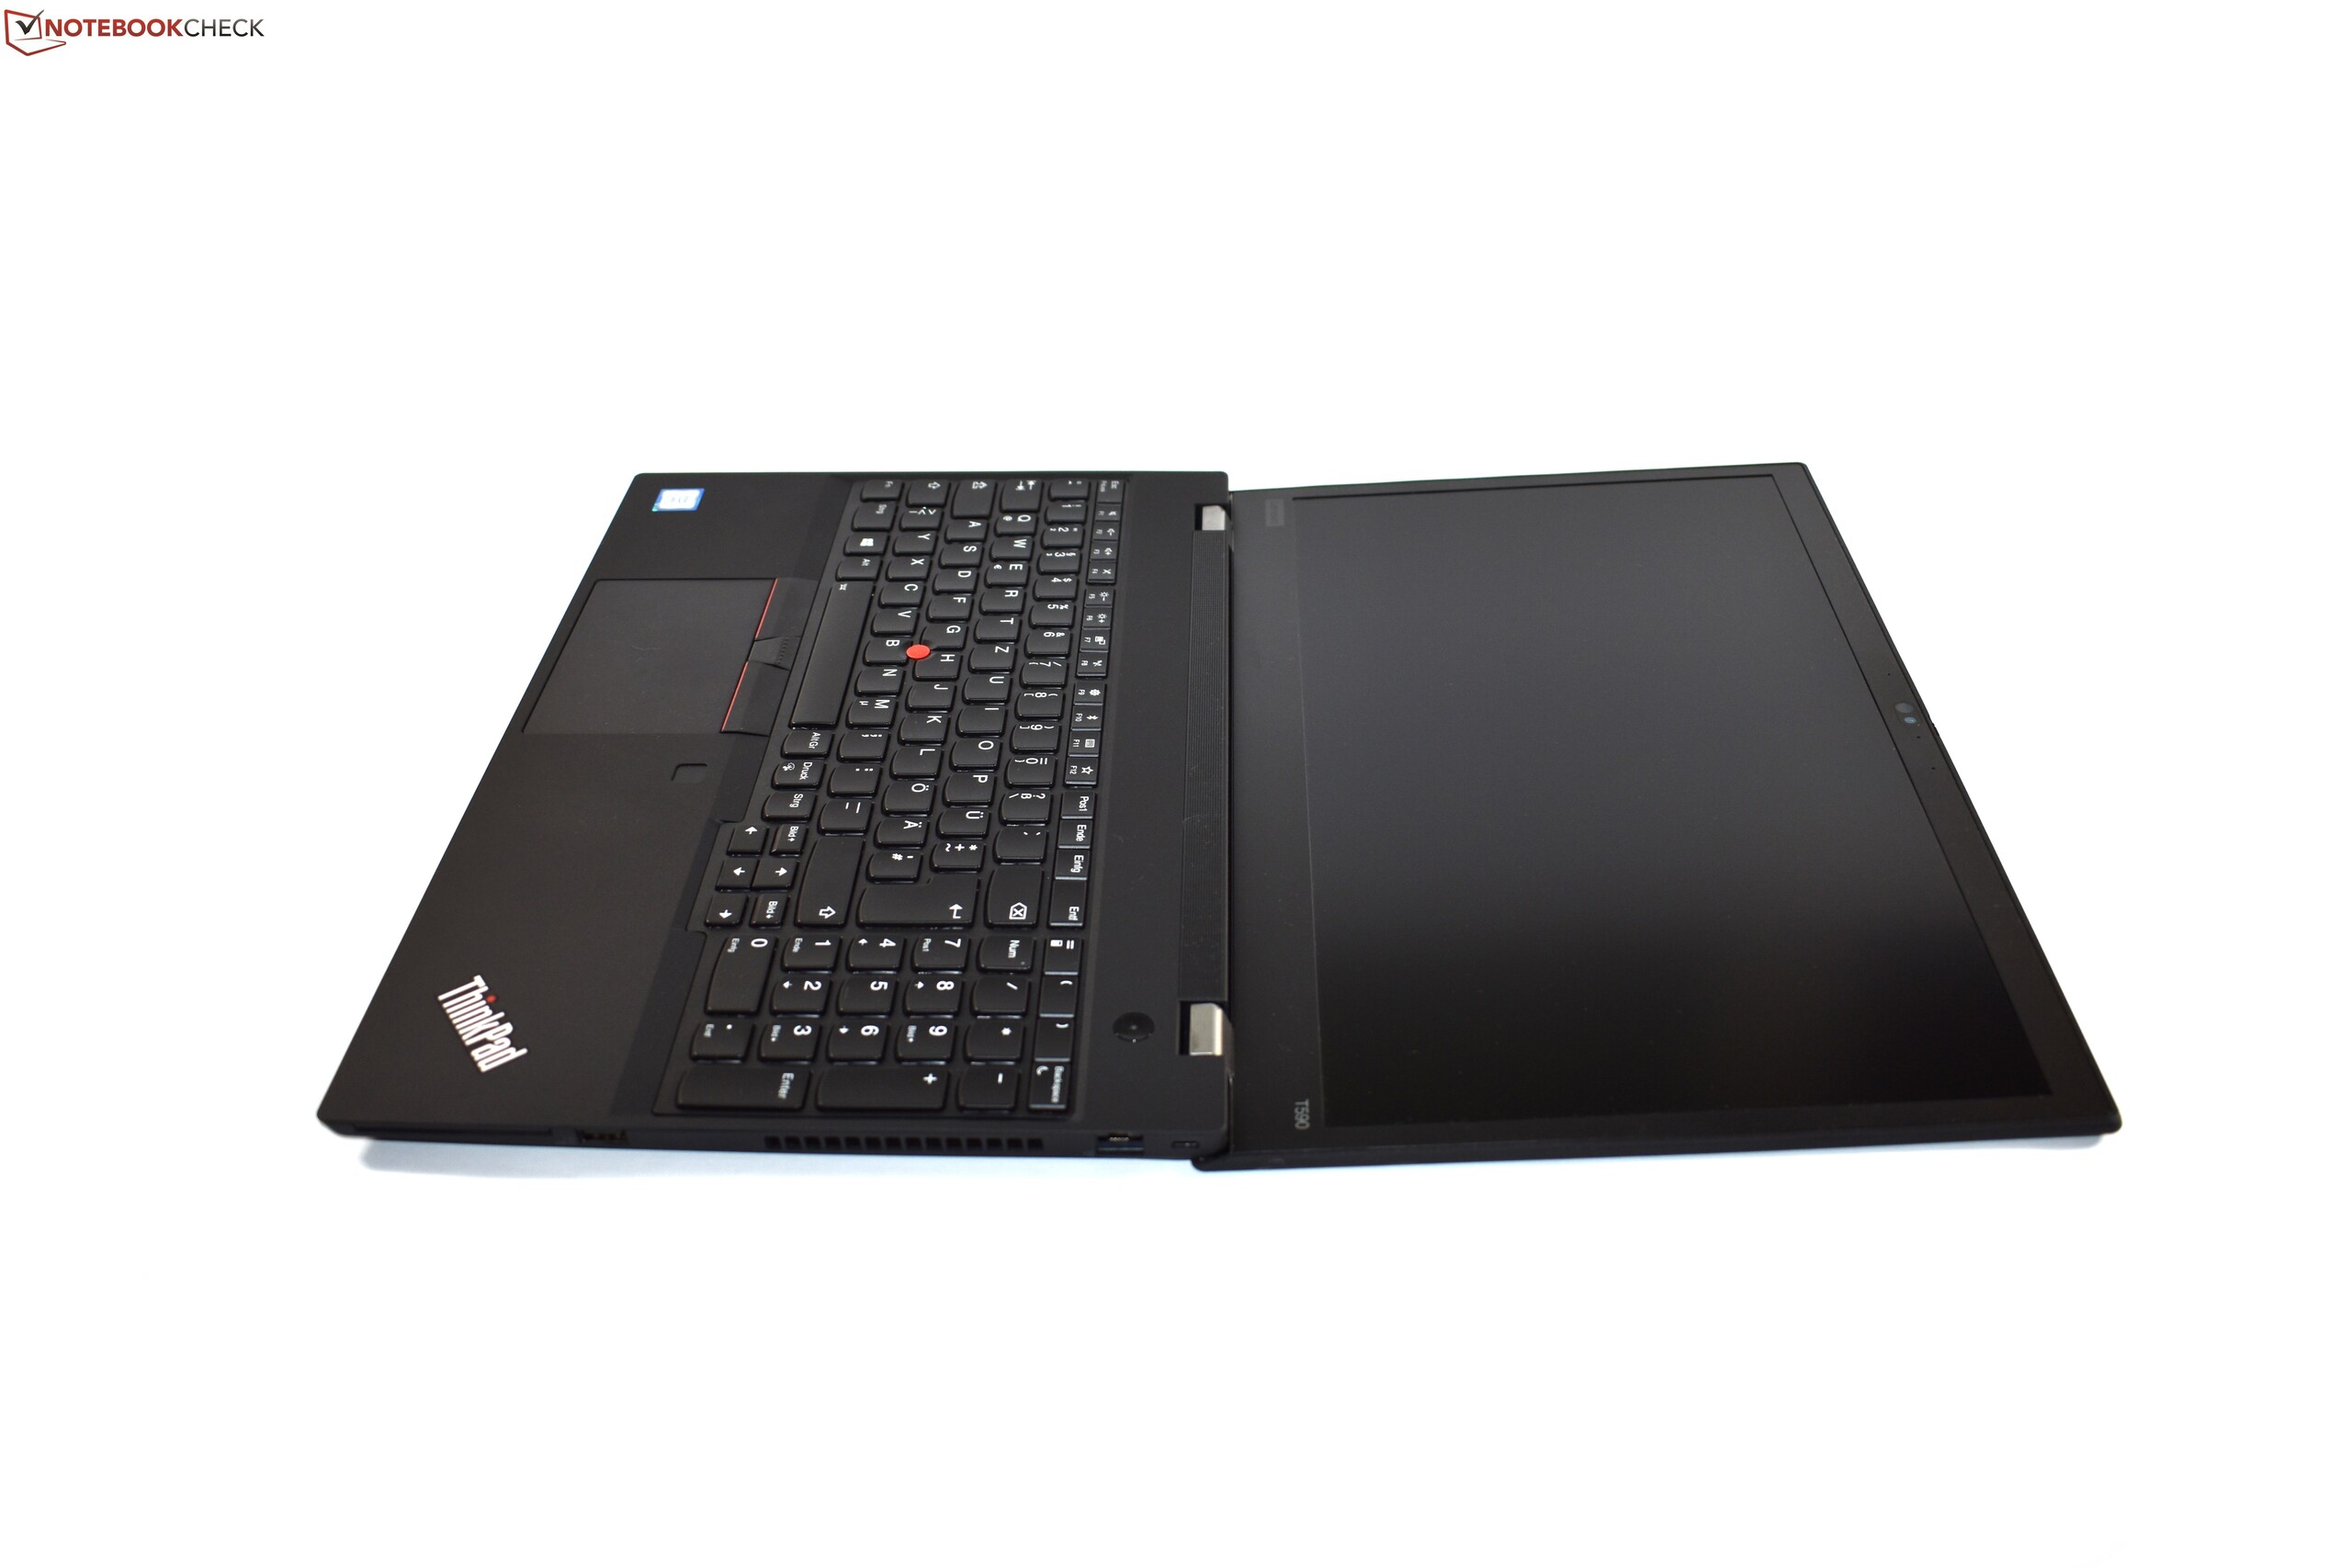
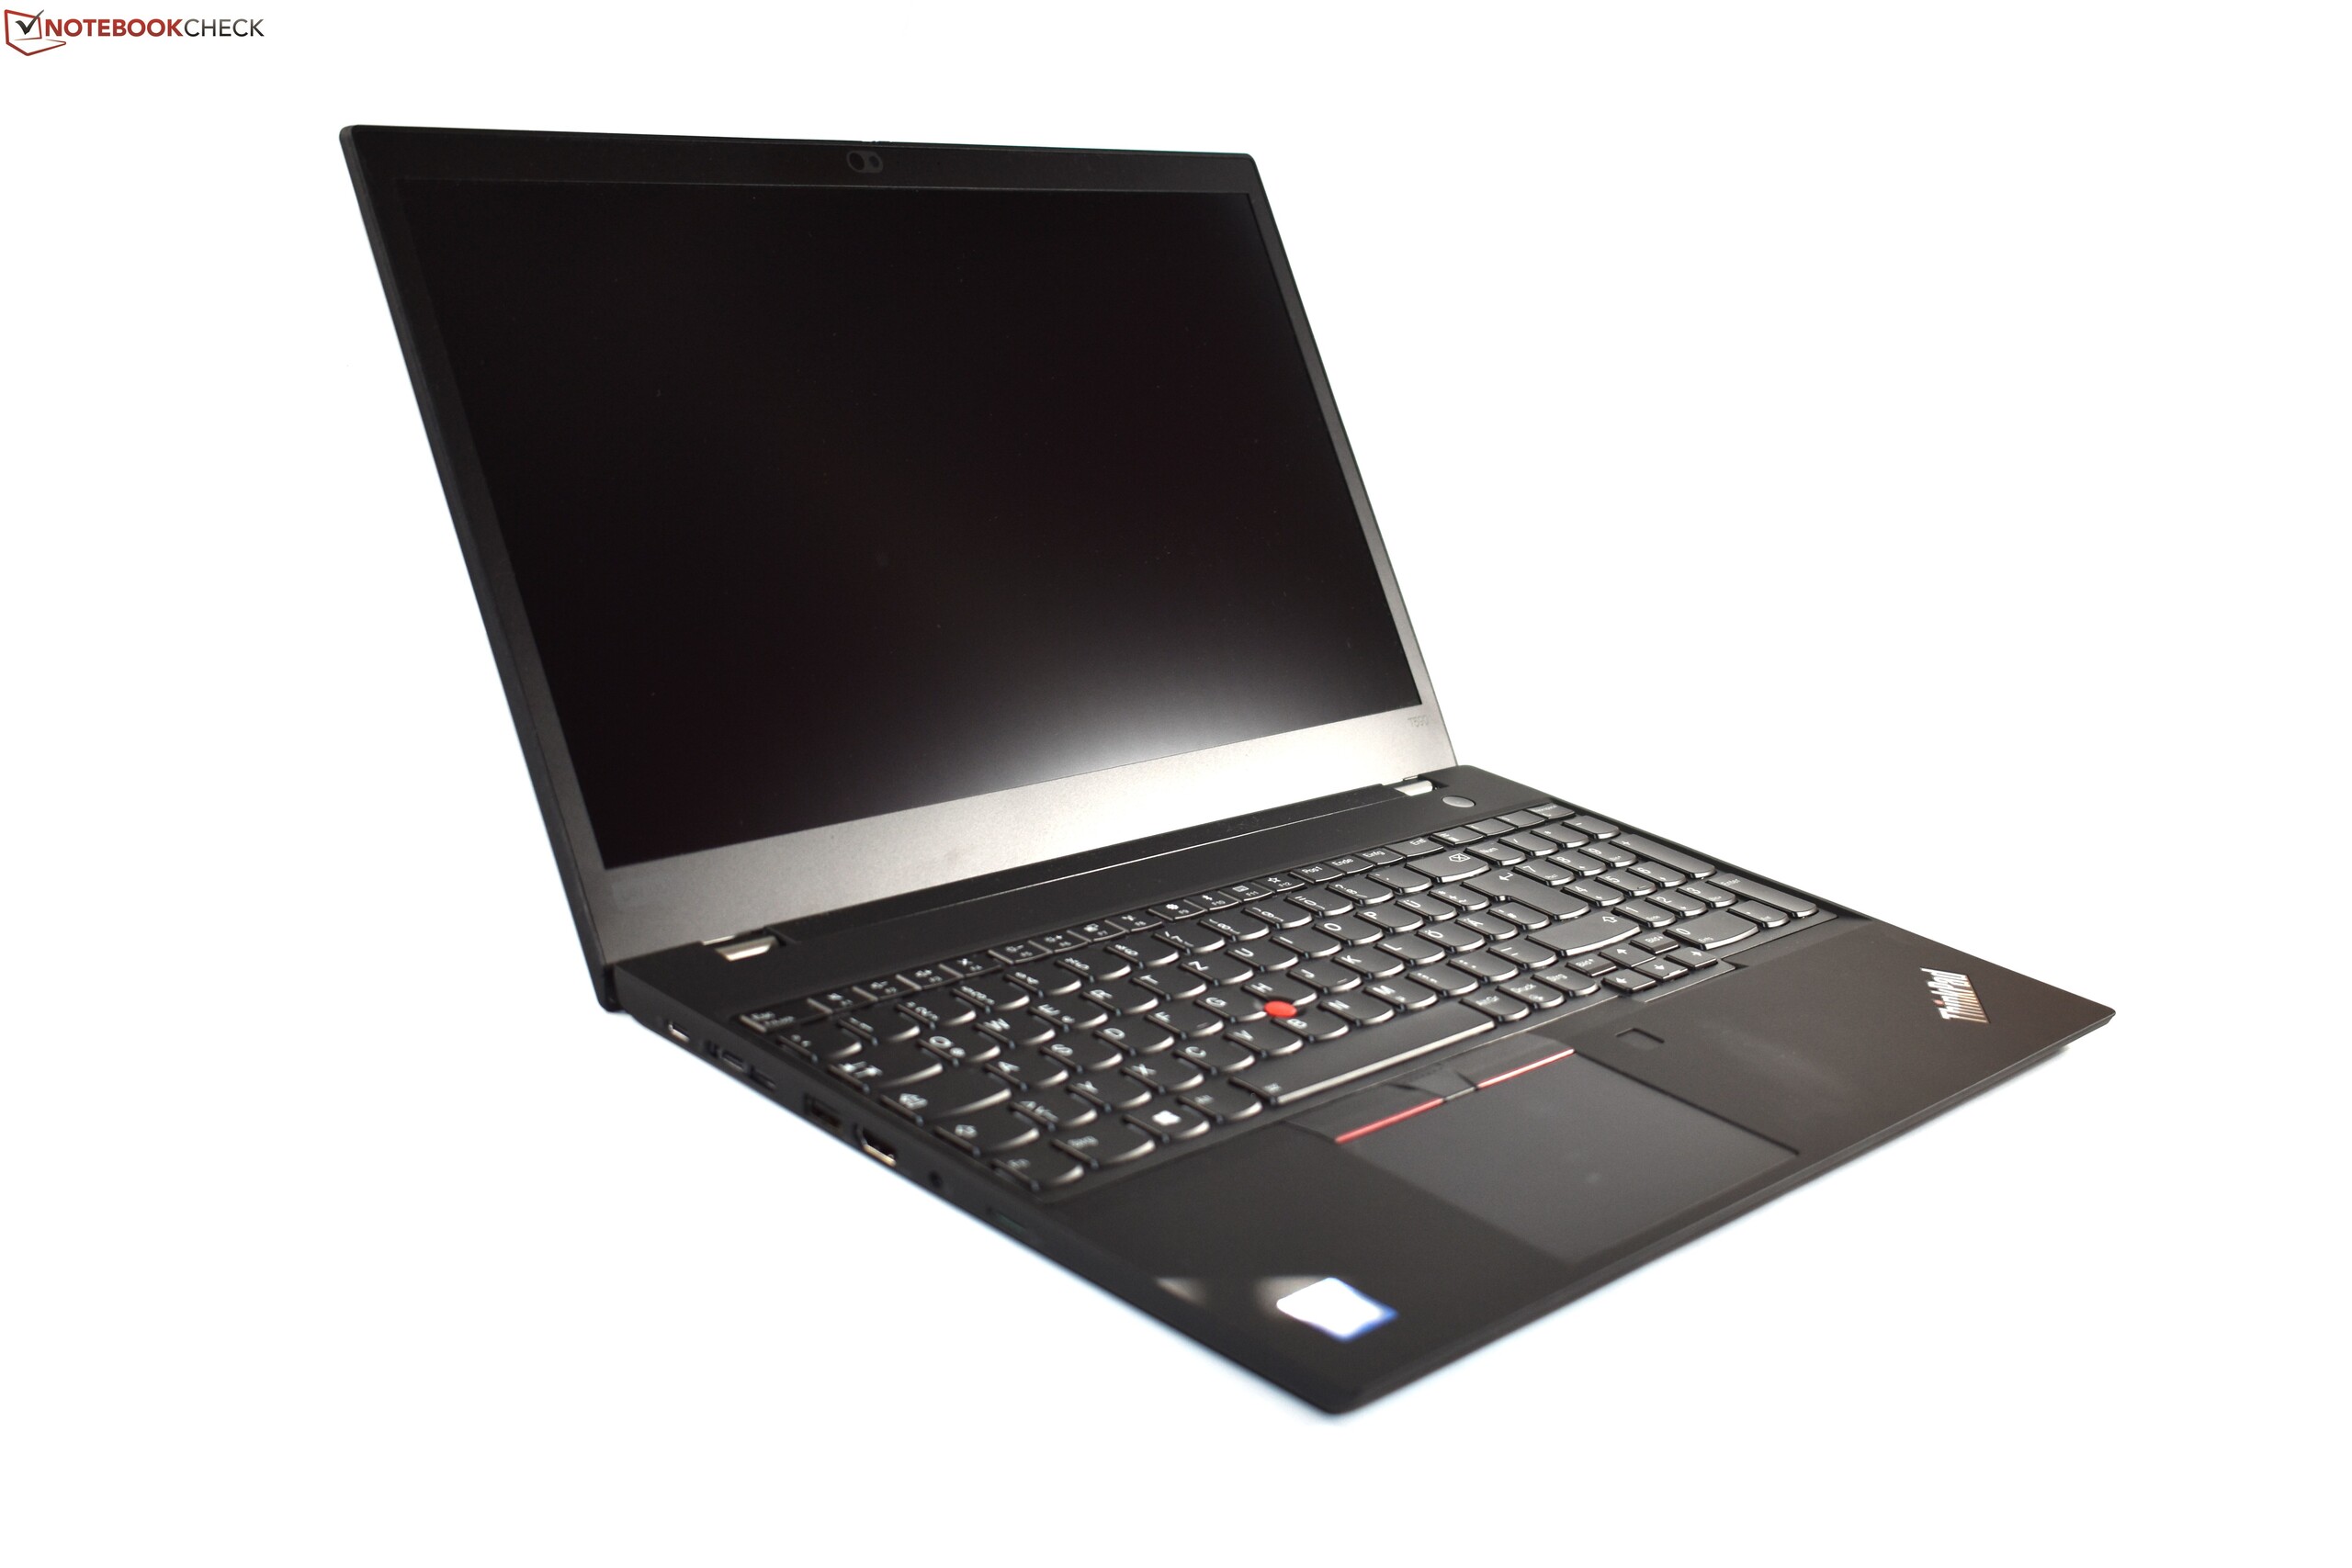
O Lenovo ThinkPad T590 é o ThinkPad mais leve e compacto de 15,6 polegadas da série T. No passado, as pessoas eram forçadas a escolher os modelos menores de 14 polegadas se não quisessem usar um portátil extremamente grosso e pesado. Este não é mais o caso. Mesmo assim, o menor Lenovo ThinkPad T490 provavelmente ainda é a melhor opção para a maioria dos usuários.
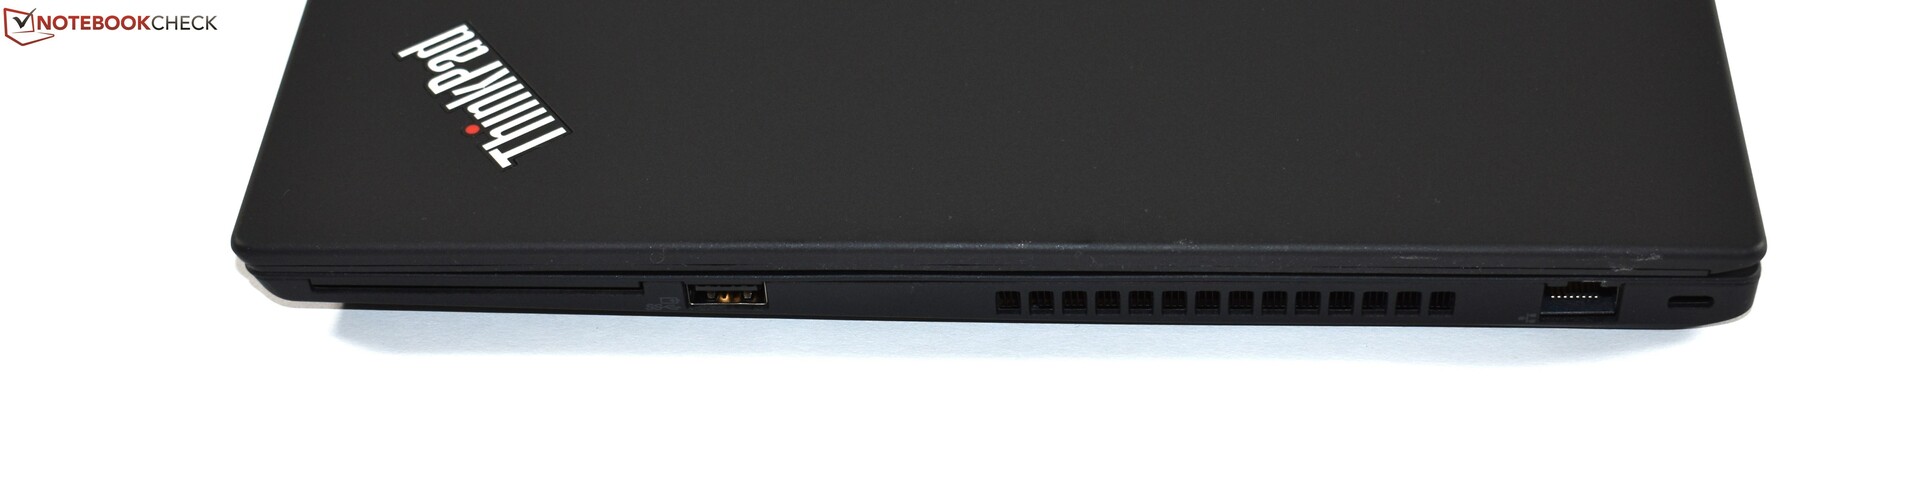
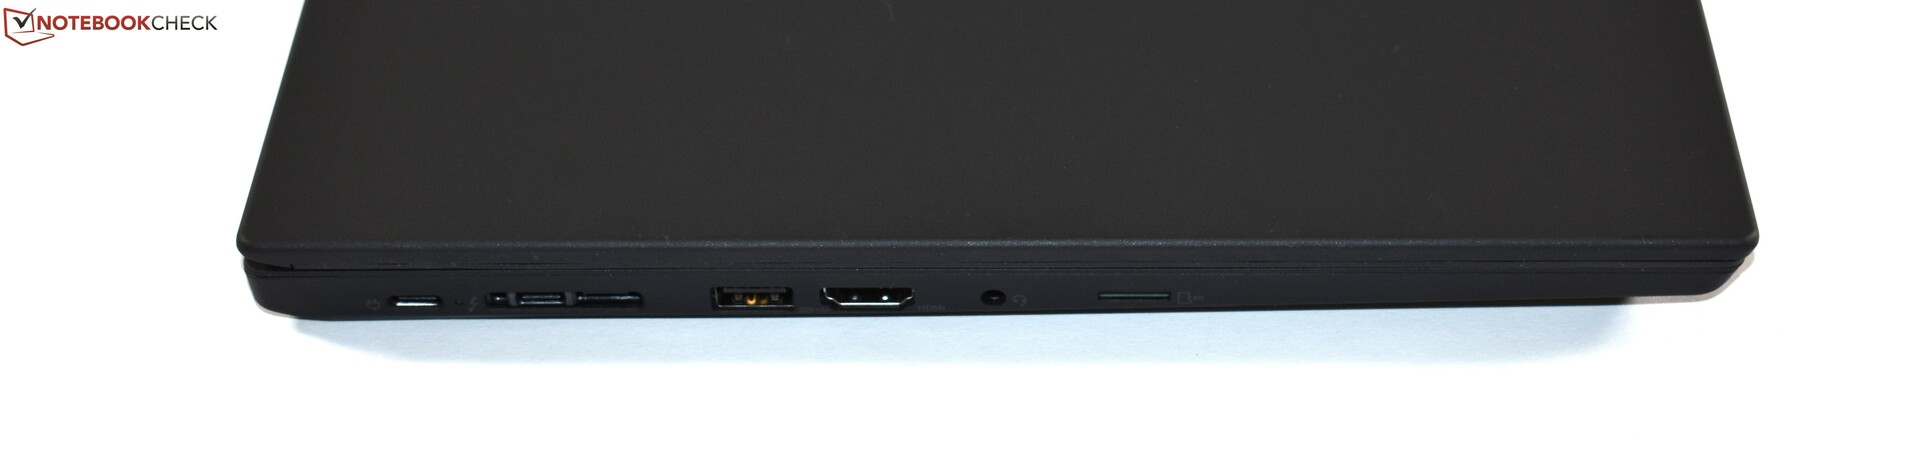
Um fator importante para isso é que o T490 e o T590 são extremamente semelhantes em muitos aspectos. A Lenovo usa o mesmo design de placa-mãe para ambos e os materiais e a construção dos dois são idênticos. O Lenovo ThinkPad T590 tem um chassi robusto com muitas opções de conectividade e segurança, mas o ThinkPad T490também oferece esses recursos. O mesmo vale para os muito confortáveis dispositivos de entrada com o ótimo teclado, embora o T590 tenha uma vantagem nessa área para alguns usuários, graças ao seu teclado numérico. Além disso, a duração da bateria do ThinkPad T590 é melhor do que a do T490, pelo menos quando se trata da versão FHD, já que ela tem uma bateria maior de 57 Wh. O ThinkPad T590 oferece um desempenho de CPU acima da média e o ventilador do portátil ThinkPad permanece praticamente silencioso, embora esse também seja o caso do T490.
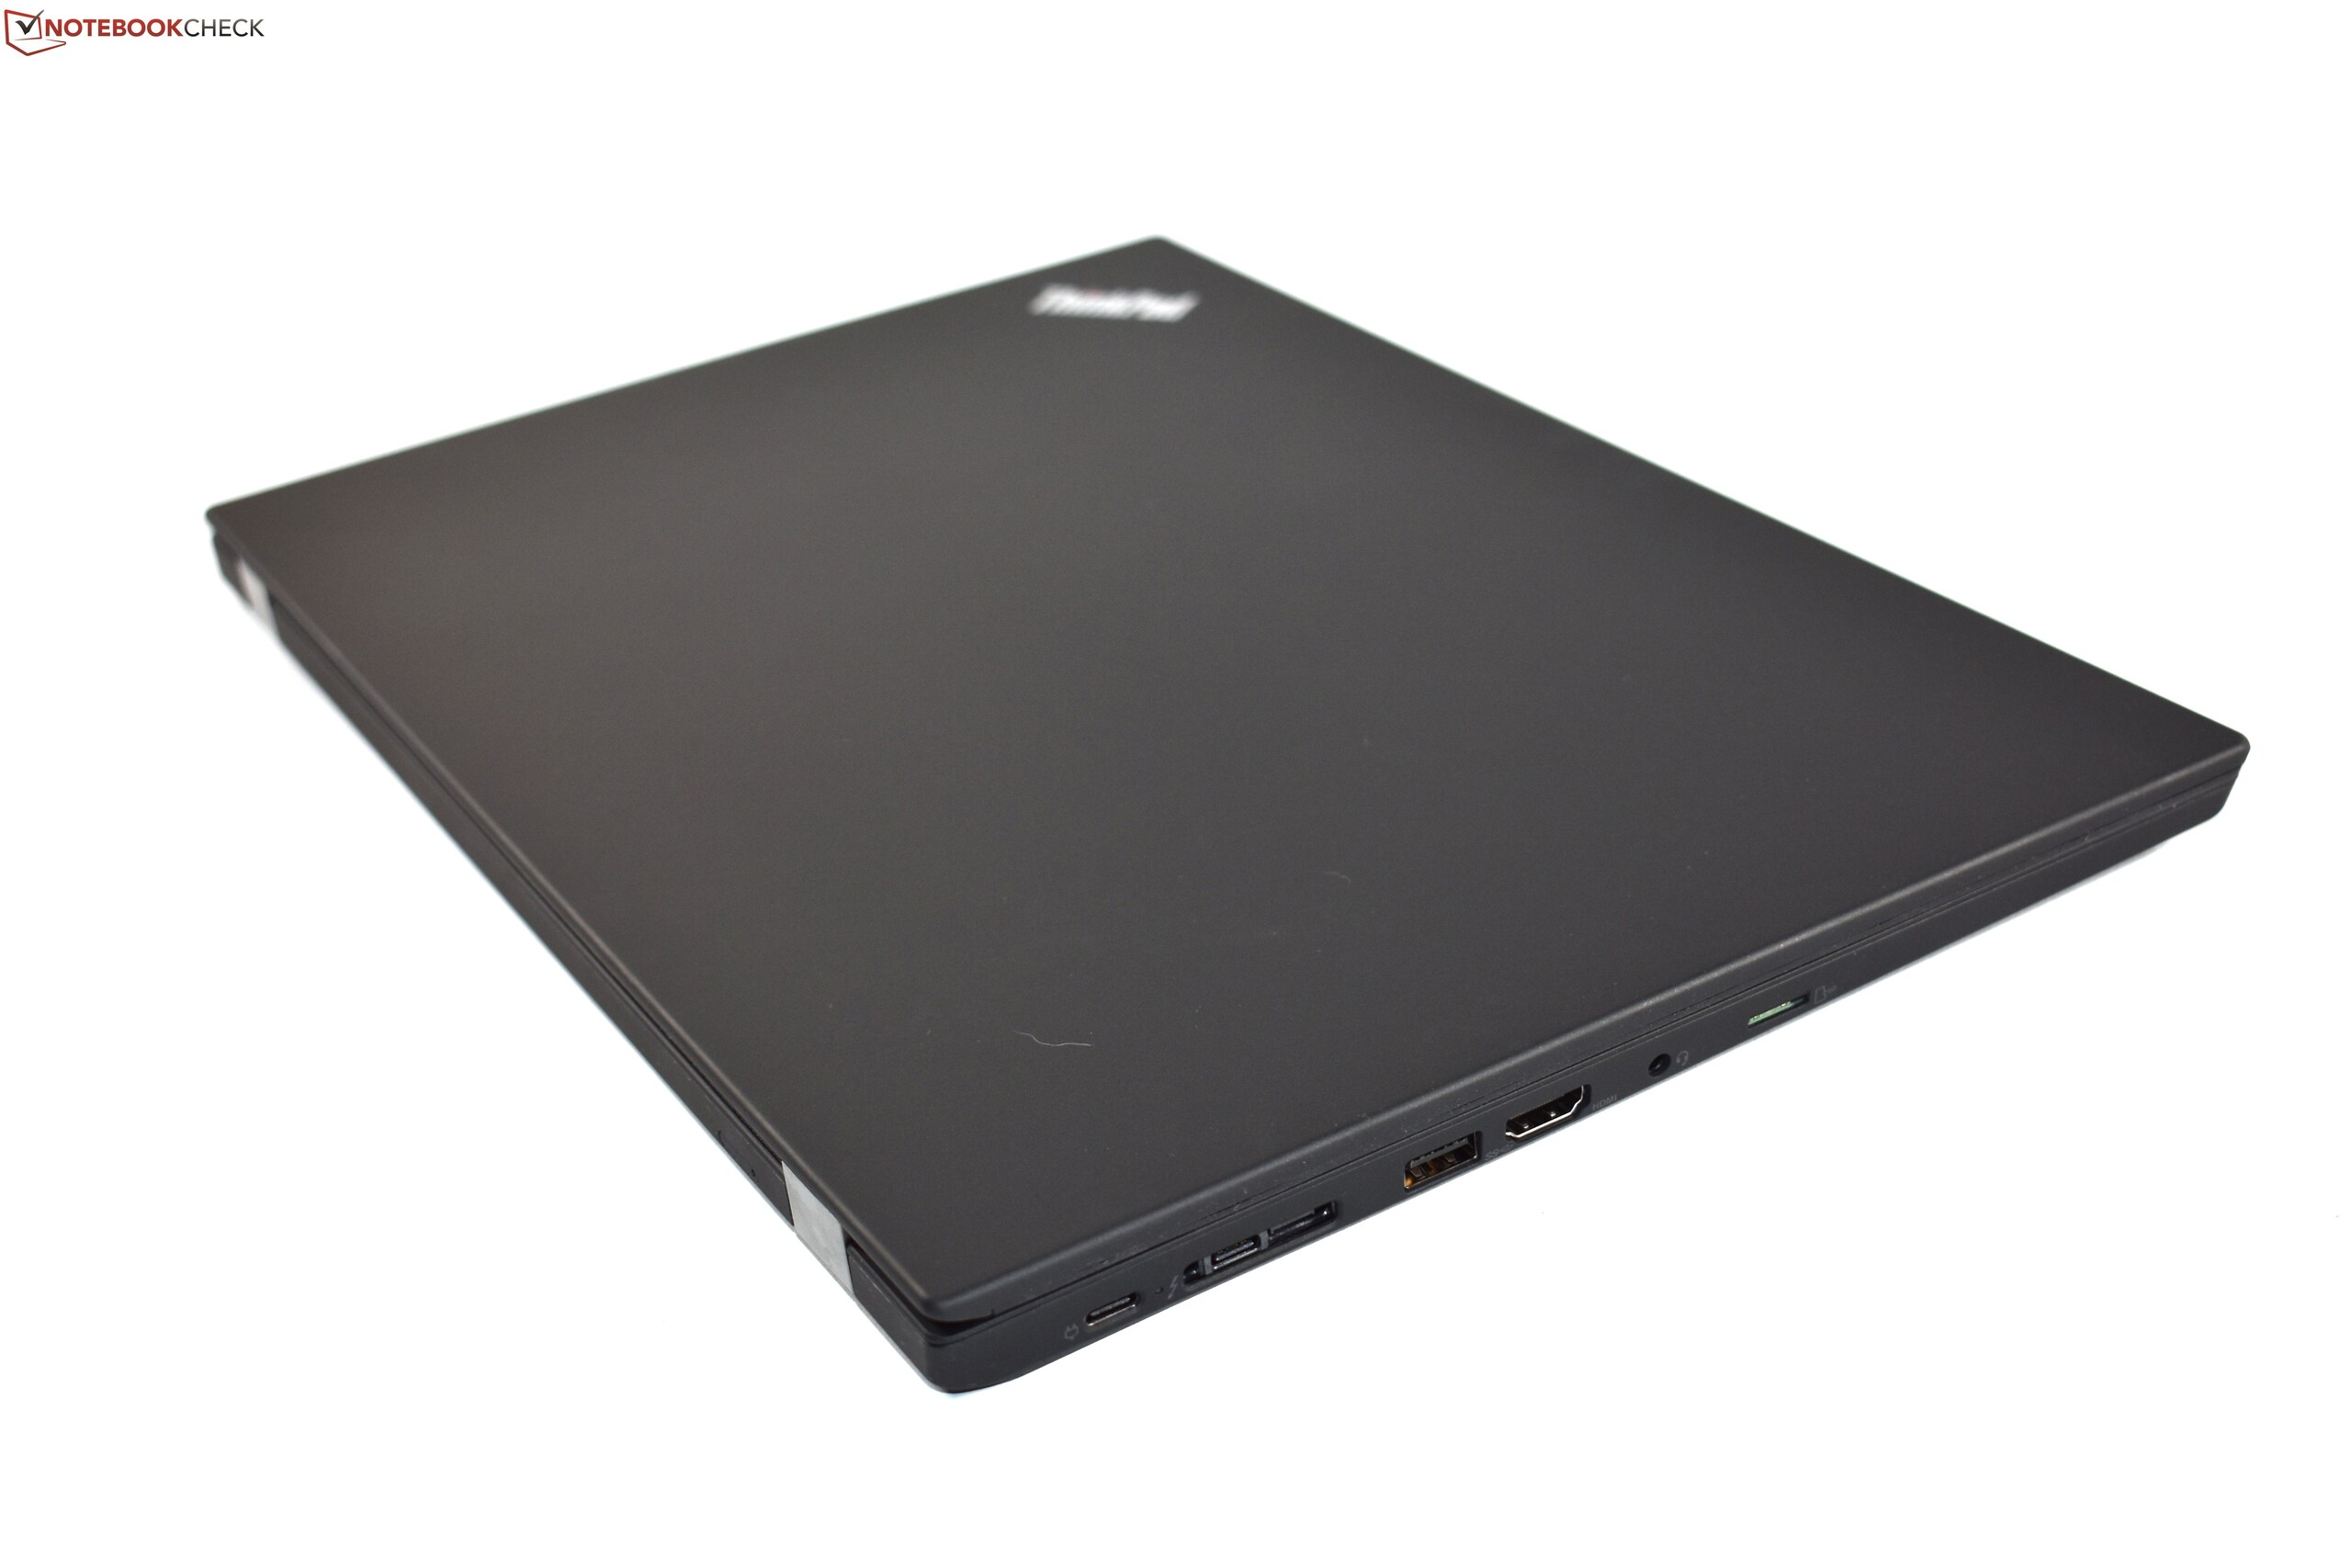
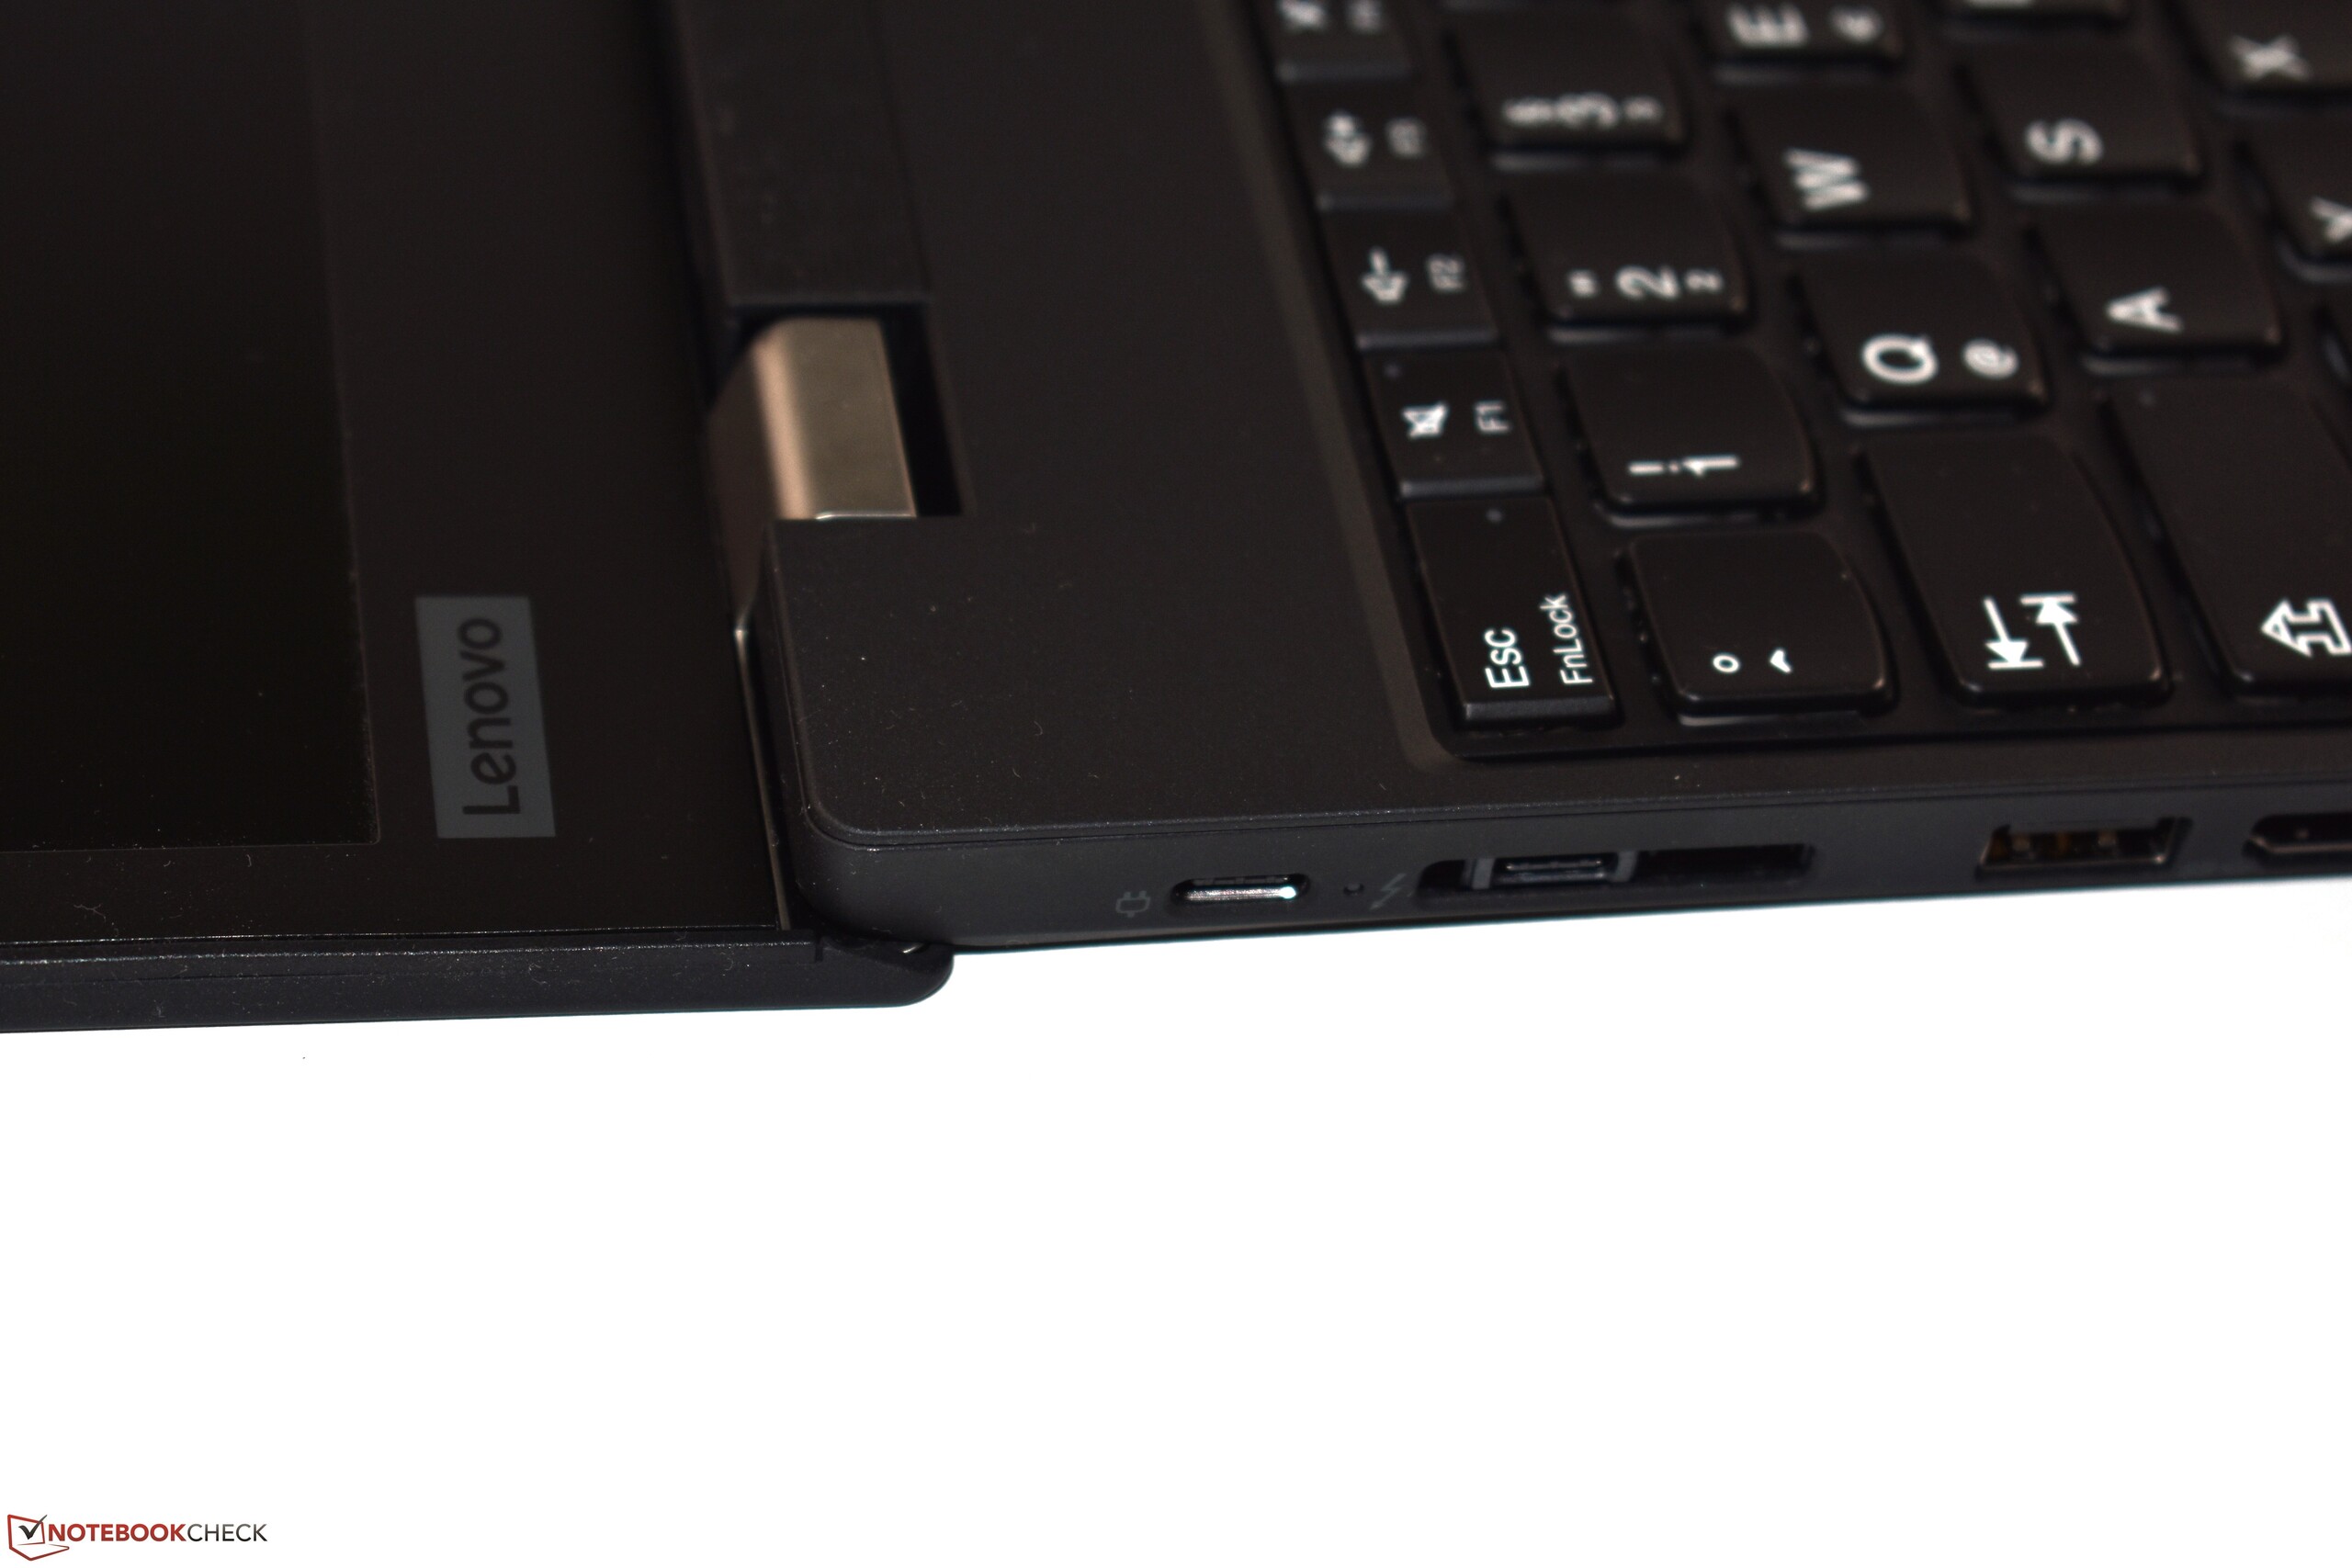
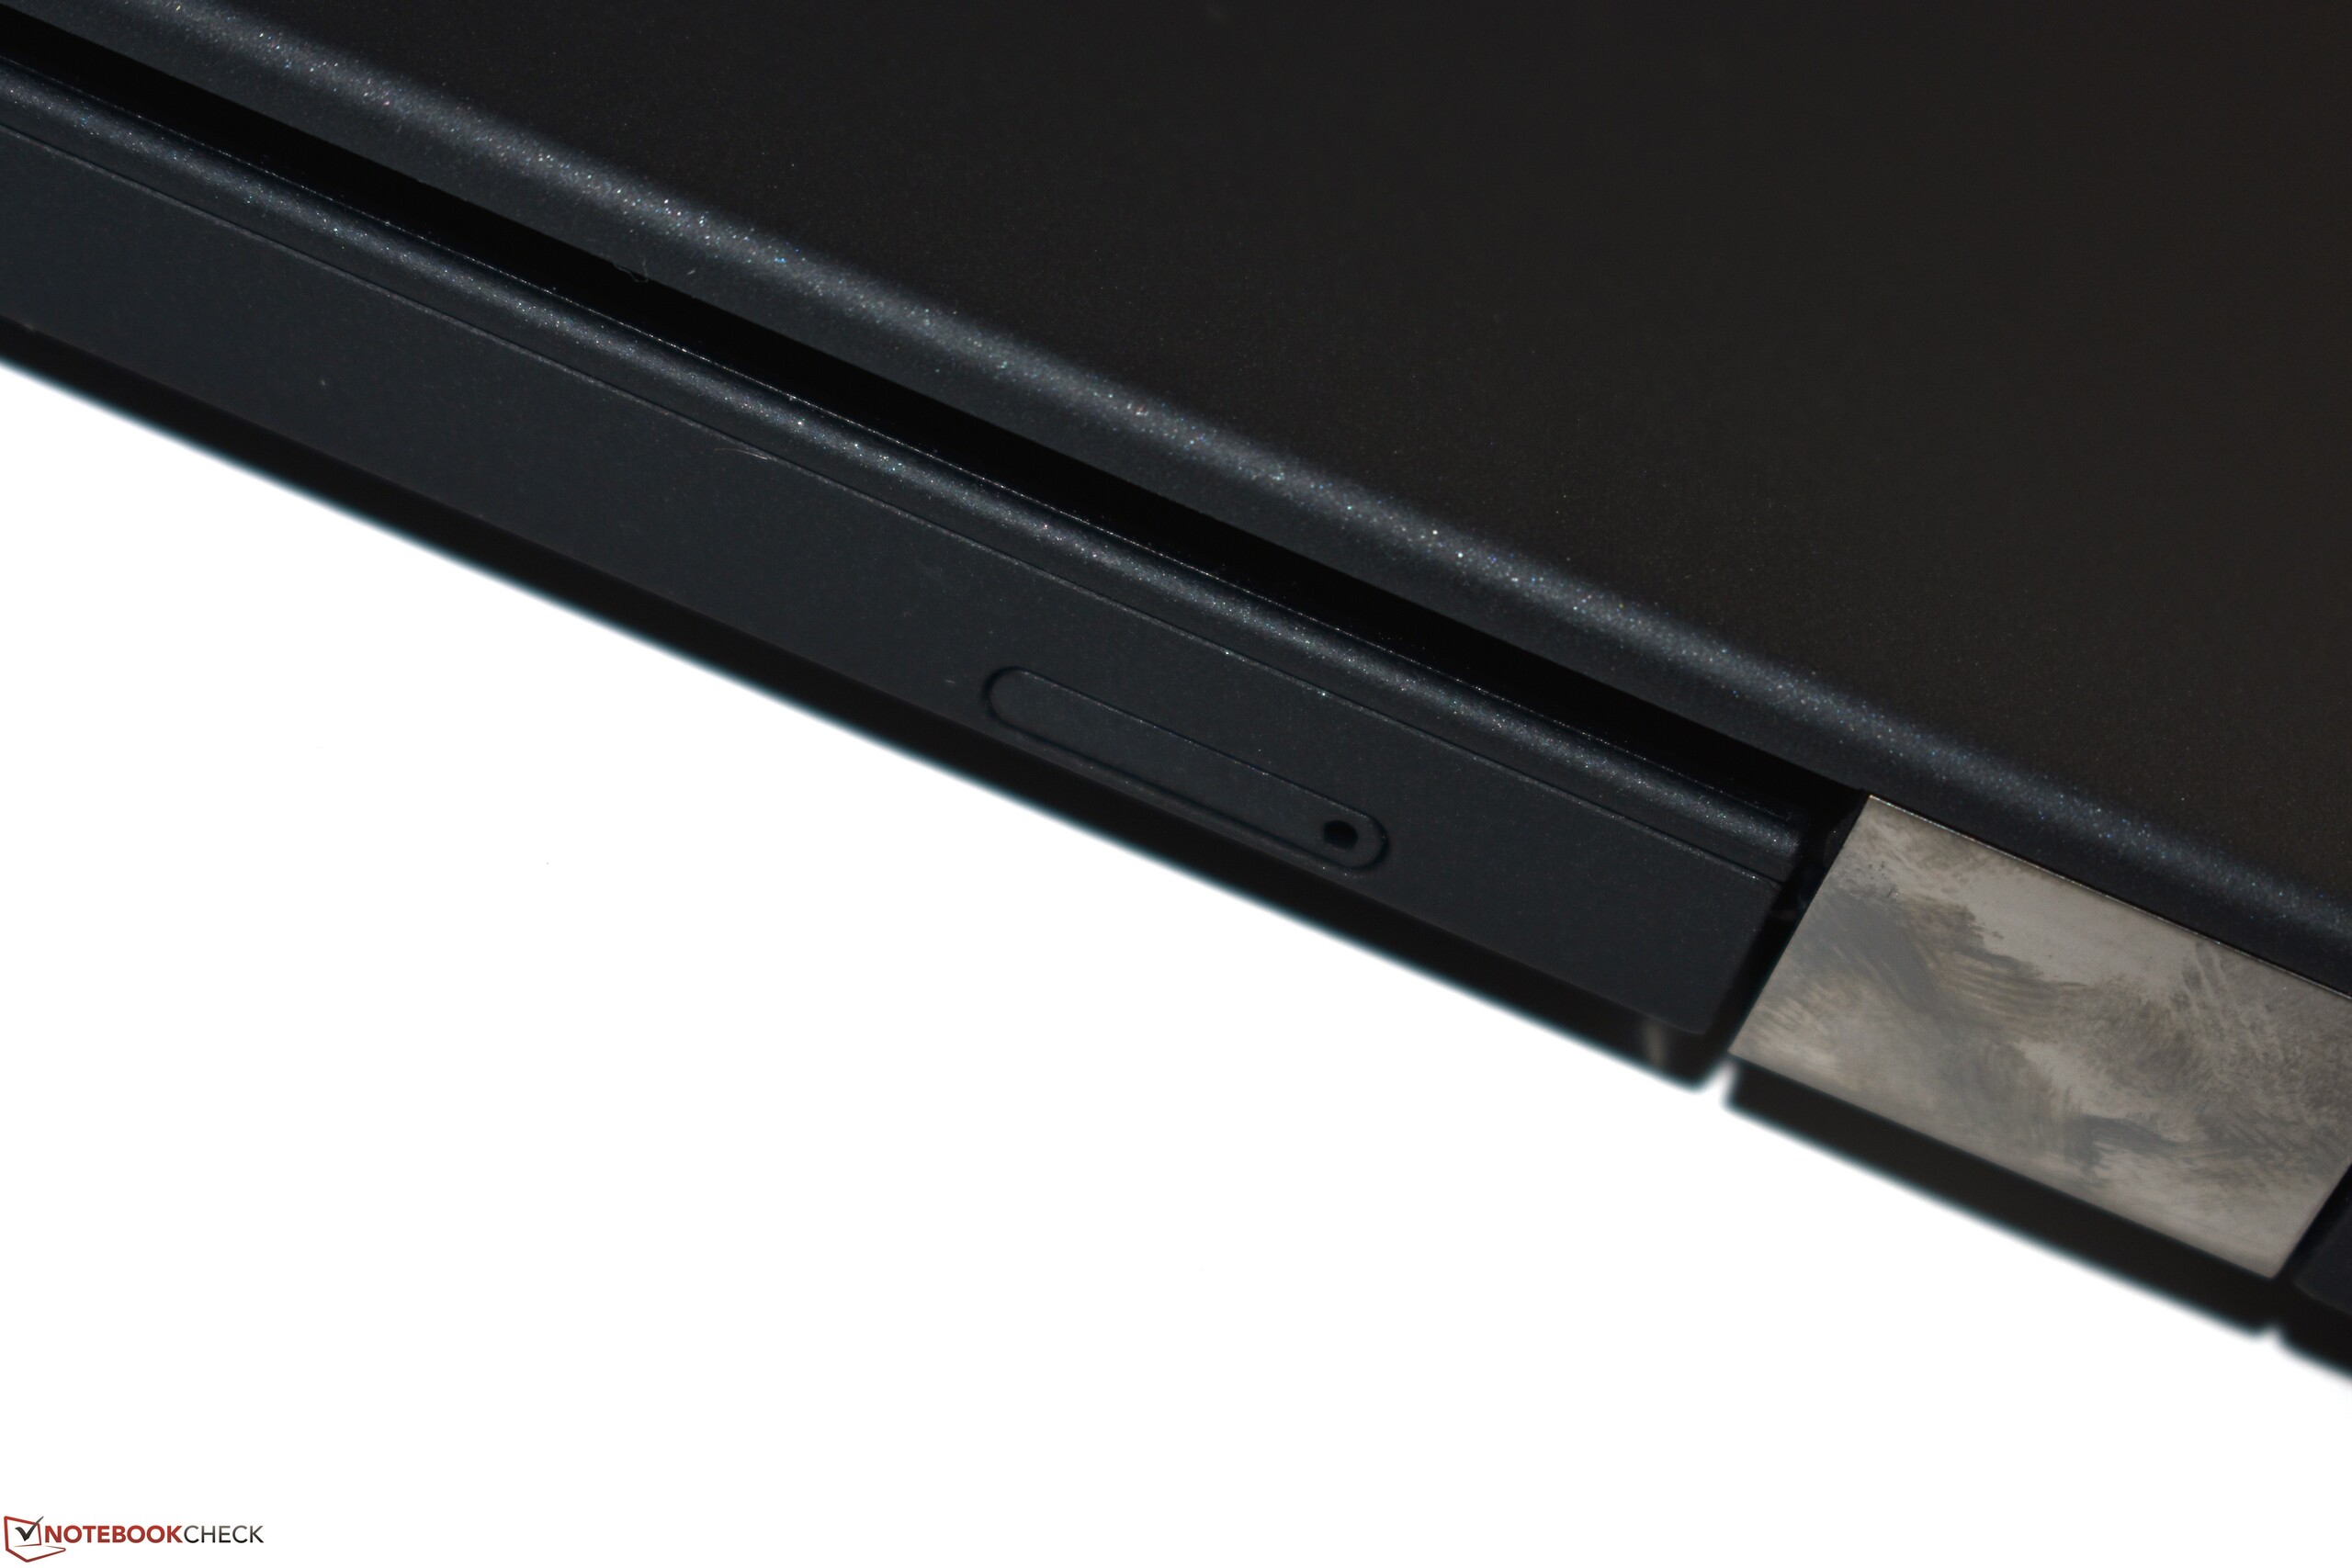
A tela maior pode ser vista como um argumento para o ThinkPad T590. No entanto, a qualidade do painel LCD é horrível em comparação com o T490 e sua tela FHD de baixa potência. A gama de cores e o brilho da tela são muito piores. Opcionalmente, a Lenovo oferece um interessante painel 4K UHD, mas a esmagadora maioria das unidades T590 provavelmente estará equipada com o painel FHD. Outros pontos fracos, como o chassi de difícil abertura, o microSD em vez de um leitor de cartões SD de tamanho completo, as altas temperaturas do chassi e a porta Thunderbolt 3, que é conectada apenas com duas pistas PCIe, são as mesmas que estavam no ThinkPad T490. O mesmo vale para o recurso PowerBridge descontinuado.
Se apenas a tela fosse melhor: O ThinkPad T590 é um bom portátil, mas o LCD nos decepciona.
Considerando tudo, ainda podemos recomendar o ThinkPad T590 como um portátil de 15,6 polegadas comparativamente móvel com ótimo desempenho para tarefas de produtividade. Mesmo assim, achamos que o ThinkPad T490 é a melhor opção, especialmente se o teclado numérico não for necessário. Comparado com outros dispositivos de 15,6 polegadas da mesma classe, como o HP EliteBook 850 G5, o ThinkPad tem melhores dispositivos de entrada e um maior desempenho da CPU, mas uma tela pior - a menos que um modelo com a tela 4K UHD seja escolhido.
Lenovo ThinkPad T590-20N4002VGE
- 09/26/2019 v7 (old)
Benjamin Herzig
Price comparison
