Breve Análise do Portátil Lenovo ThinkPad E495: Dispositivo de escritório barato com muita energia, mas sem iluminação do teclado

| SD Card Reader | |
| average JPG Copy Test (av. of 3 runs) | |
| Lenovo ThinkPad E495-20NE000JGE (Toshiba Exceria Pro M501) | |
| Lenovo ThinkPad T495-20NKS01Y00 (Toshiba Exceria Pro M501 64 GB UHS-II) | |
| Lenovo ThinkPad E490-20N90004GE (Toshiba Exceria Pro M501) | |
| Lenovo ThinkPad E485-20KU000NGE (Toshiba Exceria Pro M501) | |
| Média da turma Office (19.8 - 198.5, n=21, últimos 2 anos) | |
| maximum AS SSD Seq Read Test (1GB) | |
| Lenovo ThinkPad T495-20NKS01Y00 (Toshiba Exceria Pro M501 64 GB UHS-II) | |
| Lenovo ThinkPad E495-20NE000JGE (Toshiba Exceria Pro M501) | |
| Lenovo ThinkPad E490-20N90004GE (Toshiba Exceria Pro M501) | |
| Lenovo ThinkPad E485-20KU000NGE (Toshiba Exceria Pro M501) | |
| Média da turma Office (27.4 - 249, n=20, últimos 2 anos) | |
| Networking | |
| iperf3 transmit AX12 | |
| Lenovo ThinkPad E490-20N90004GE | |
| Lenovo ThinkPad T495-20NKS01Y00 | |
| Lenovo ThinkPad E495-20NE000JGE | |
| Lenovo ThinkPad E485-20KU000NGE | |
| iperf3 receive AX12 | |
| Lenovo ThinkPad E495-20NE000JGE | |
| Lenovo ThinkPad E490-20N90004GE | |
| Lenovo ThinkPad T495-20NKS01Y00 | |
| Lenovo ThinkPad E485-20KU000NGE | |
| |||||||||||||||||||||||||
iluminação: 75 %
iluminação com acumulador: 244 cd/m²
Contraste: 1418:1 (Preto: 0.17 cd/m²)
ΔE ColorChecker Calman: 4.7 | ∀{0.5-29.43 Ø4.72}
calibrated: 4.2
ΔE Greyscale Calman: 2.6 | ∀{0.09-98 Ø4.97}
63.3% sRGB (Argyll 1.6.3 3D)
40.3% AdobeRGB 1998 (Argyll 1.6.3 3D)
43.8% AdobeRGB 1998 (Argyll 3D)
63.5% sRGB (Argyll 3D)
42.37% Display P3 (Argyll 3D)
Gamma: 2.12
CCT: 6507 K
| Lenovo ThinkPad E495-20NE000JGE N140HCA-EAC, , 1920x1080, 14" | Lenovo ThinkPad T495-20NKS01Y00 N140HCG-GQ2, , 1920x1080, 14" | Lenovo ThinkPad E490-20N90004GE B140HAN04.2, , 1920x1080, 14" | Lenovo ThinkPad E490-20N8000RGE Lenovo NV140FHM-N49, , 1920x1080, 14" | Lenovo ThinkPad E485-20KU000NGE B140HAN04.2, , 1920x1080, 14" | |
|---|---|---|---|---|---|
| Display | 57% | -8% | -7% | -8% | |
| Display P3 Coverage (%) | 42.37 | 67 58% | 38.98 -8% | 39.85 -6% | 39.21 -7% 38.48 -9% |
| sRGB Coverage (%) | 63.5 | 98.5 55% | 58.6 -8% | 58.6 -8% | 58.8 -7% 57.9 -9% |
| AdobeRGB 1998 Coverage (%) | 43.8 | 69.2 58% | 40.27 -8% | 41.18 -6% | 40.52 -7% 39.76 -9% |
| Response Times | 36% | -3% | -22% | -10% | |
| Response Time Grey 50% / Grey 80% * (ms) | 40.8 ? | 32.4 ? 21% | 44 ? -8% | 48.4 ? -19% | 44.8 ? -10% |
| Response Time Black / White * (ms) | 30.8 ? | 15.2 ? 51% | 30 ? 3% | 38.4 ? -25% | 33.6 ? -9% |
| PWM Frequency (Hz) | 25000 ? | 26040 ? | 1250 ? | ||
| Screen | 35% | -0% | 0% | -1% | |
| Brightness middle (cd/m²) | 241 | 420 74% | 278 15% | 305 27% | 289 20% |
| Brightness (cd/m²) | 230 | 391 70% | 257 12% | 295 28% | 271 18% |
| Brightness Distribution (%) | 75 | 88 17% | 85 13% | 90 20% | 87 16% |
| Black Level * (cd/m²) | 0.17 | 0.29 -71% | 0.19 -12% | 0.23 -35% | 0.19 -12% |
| Contrast (:1) | 1418 | 1448 2% | 1463 3% | 1326 -6% | 1521 7% |
| Colorchecker dE 2000 * | 4.7 | 2.1 55% | 5.1 -9% | 5.3 -13% | 5.6 -19% |
| Colorchecker dE 2000 max. * | 19.7 | 5.5 72% | 19.3 2% | 18.9 4% | 20.8 -6% |
| Colorchecker dE 2000 calibrated * | 4.2 | 0.7 83% | 4.5 -7% | 5 -19% | 4.7 -12% |
| Greyscale dE 2000 * | 2.6 | 3.4 -31% | 2.7 -4% | 2.3 12% | 2.7 -4% |
| Gamma | 2.12 104% | 2.22 99% | 2.21 100% | 2.09 105% | 1.96 112% |
| CCT | 6507 100% | 7168 91% | 6685 97% | 6246 104% | 6506 100% |
| Color Space (Percent of AdobeRGB 1998) (%) | 40.3 | 63.5 58% | 37.1 -8% | 37.7 -6% | 37.2 -8% |
| Color Space (Percent of sRGB) (%) | 63.3 | 98.6 56% | 58.4 -8% | 58.2 -8% | 58.5 -8% |
| Média Total (Programa/Configurações) | 43% /
39% | -4% /
-2% | -10% /
-4% | -6% /
-4% |
* ... menor é melhor
Exibir tempos de resposta
| ↔ Tempo de resposta preto para branco | ||
|---|---|---|
| 30.8 ms ... ascensão ↗ e queda ↘ combinadas | ↗ 17.6 ms ascensão | 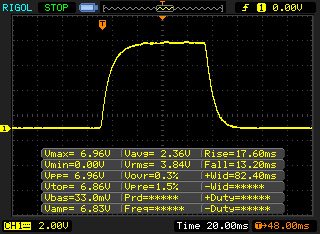 |
| ↘ 13.2 ms queda | ||
| A tela mostra taxas de resposta lentas em nossos testes e será insatisfatória para os jogadores. Em comparação, todos os dispositivos testados variam de 0.1 (mínimo) a 240 (máximo) ms. » 83 % de todos os dispositivos são melhores. Isso significa que o tempo de resposta medido é pior que a média de todos os dispositivos testados (19.8 ms). | ||
| ↔ Tempo de resposta 50% cinza a 80% cinza | ||
| 40.8 ms ... ascensão ↗ e queda ↘ combinadas | ↗ 22 ms ascensão | 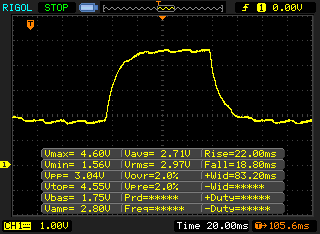 |
| ↘ 18.8 ms queda | ||
| A tela mostra taxas de resposta lentas em nossos testes e será insatisfatória para os jogadores. Em comparação, todos os dispositivos testados variam de 0.165 (mínimo) a 636 (máximo) ms. » 64 % de todos os dispositivos são melhores. Isso significa que o tempo de resposta medido é pior que a média de todos os dispositivos testados (31 ms). | ||
Cintilação da tela / PWM (modulação por largura de pulso)
| Tela tremeluzindo/PWM detectado | 25000 Hz | ≤ 40 % configuração de brilho | 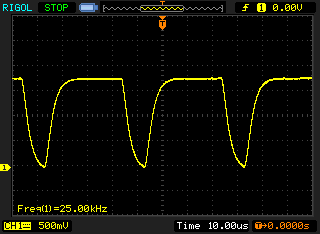 |
A luz de fundo da tela pisca em 25000 Hz (pior caso, por exemplo, utilizando PWM) Cintilação detectada em uma configuração de brilho de 40 % e abaixo. Não deve haver cintilação ou PWM acima desta configuração de brilho. A frequência de 25000 Hz é bastante alta, então a maioria dos usuários sensíveis ao PWM não deve notar nenhuma oscilação. [pwm_comparison] Em comparação: 52 % de todos os dispositivos testados não usam PWM para escurecer a tela. Se PWM foi detectado, uma média de 7753 (mínimo: 5 - máximo: 343500) Hz foi medida. | |||
| PCMark 10 Score | 3485 pontos | |
Ajuda | ||

| 3DMark 11 - 1280x720 Performance GPU | |
| Média da turma Office (2551 - 18313, n=69, últimos 2 anos) | |
| Lenovo ThinkPad E490-20N90004GE | |
| Lenovo ThinkPad T495-20NKS01Y00 | |
| Média AMD Radeon RX Vega 8 (Ryzen 2000/3000) (1668 - 4317, n=44) | |
| Lenovo ThinkPad E495-20NE000JGE | |
| Lenovo ThinkPad E485-20KU000NGE | |
| Lenovo ThinkPad E490-20N8000RGE | |
| 3DMark - 1920x1080 Fire Strike Graphics | |
| Média da turma Office (736 - 21871, n=72, últimos 2 anos) | |
| Lenovo ThinkPad E490-20N90004GE | |
| Lenovo ThinkPad T495-20NKS01Y00 | |
| Média AMD Radeon RX Vega 8 (Ryzen 2000/3000) (1095 - 2901, n=41) | |
| Lenovo ThinkPad E495-20NE000JGE | |
| Lenovo ThinkPad E485-20KU000NGE | |
| Lenovo ThinkPad E490-20N8000RGE | |
| 3DMark 11 Performance | 3013 pontos | |
| 3DMark Fire Strike Score | 1639 pontos | |
Ajuda | ||
| The Witcher 3 | |
| 1024x768 The Witcher 3 low | |
| Média da turma Office (32.2 - 61.2, n=2, últimos 2 anos) | |
| Média AMD Radeon RX Vega 8 (Ryzen 2000/3000) (22 - 50.7, n=18) | |
| 1366x768 The Witcher 3 medium | |
| Média da turma Office (44.7 - 50.4, n=2, últimos 2 anos) | |
| Média AMD Radeon RX Vega 8 (Ryzen 2000/3000) (16.3 - 33.8, n=10) | |
| 1920x1080 The Witcher 3 high | |
| Média da turma Office (23.7 - 33.4, n=2, últimos 2 anos) | |
| Média AMD Radeon RX Vega 8 (Ryzen 2000/3000) (6.7 - 18.3, n=14) | |
| 1920x1080 The Witcher 3 ultra | |
| Média da turma Office (14.8 - 15.3, n=2, últimos 2 anos) | |
| Média AMD Radeon RX Vega 8 (Ryzen 2000/3000) (4.44 - 10.1, n=7) | |
| baixo | média | alto | ultra | |
|---|---|---|---|---|
| BioShock Infinite (2013) | 81.9 | 14.3 | ||
| Dota 2 Reborn (2015) | 64 | 54.5 | 28.3 | 27.2 |
| X-Plane 11.11 (2018) | 23.8 | 17.3 | 15.2 |
Barulho
| Ocioso |
| 29.3 / 29.3 / 29.3 dB |
| Carga |
| 32.8 / 34.5 dB |
 | ||
30 dB silencioso 40 dB(A) audível 50 dB(A) ruidosamente alto |
||
min: | ||
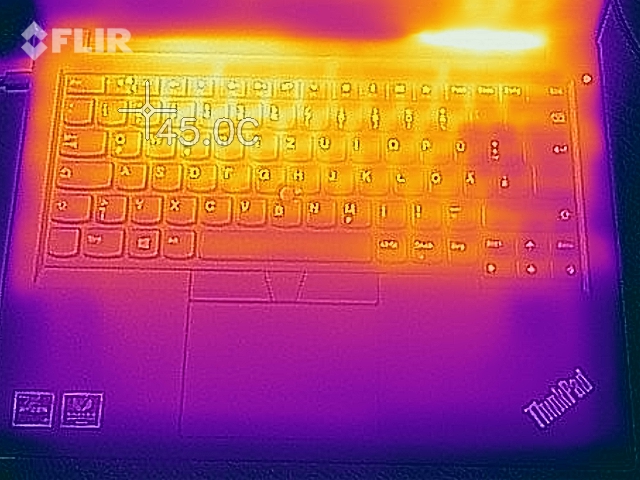
(±) A temperatura máxima no lado superior é 44.4 °C / 112 F, em comparação com a média de 34.3 °C / 94 F , variando de 21.2 a 62.5 °C para a classe Office.
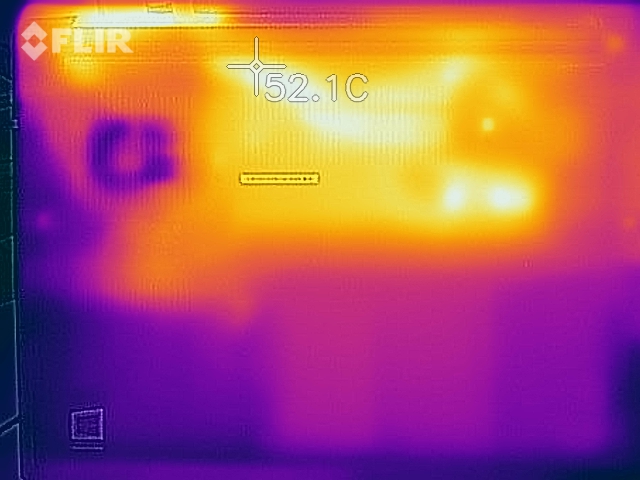
(-) A parte inferior aquece até um máximo de 48.9 °C / 120 F, em comparação com a média de 36.8 °C / 98 F
(+) Em uso inativo, a temperatura média para o lado superior é 24.3 °C / 76 F, em comparação com a média do dispositivo de 29.5 °C / ### class_avg_f### F.
(+) Os apoios para as mãos e o touchpad são mais frios que a temperatura da pele, com um máximo de 29.4 °C / 84.9 F e, portanto, são frios ao toque.
(±) A temperatura média da área do apoio para as mãos de dispositivos semelhantes foi 27.5 °C / 81.5 F (-1.9 °C / -3.4 F).
Lenovo ThinkPad E495-20NE000JGE análise de áudio
(-) | alto-falantes não muito altos (###valor### dB)
Graves 100 - 315Hz
(-) | quase nenhum baixo - em média 15.9% menor que a mediana
(±) | a linearidade dos graves é média (11.7% delta para a frequência anterior)
Médios 400 - 2.000 Hz
(+) | médios equilibrados - apenas 3.6% longe da mediana
(±) | a linearidade dos médios é média (7.3% delta para frequência anterior)
Altos 2 - 16 kHz
(+) | agudos equilibrados - apenas 1.9% longe da mediana
(±) | a linearidade dos máximos é média (7.1% delta para frequência anterior)
Geral 100 - 16.000 Hz
(±) | a linearidade do som geral é média (20.3% diferença em relação à mediana)
Comparado com a mesma classe
» 44% de todos os dispositivos testados nesta classe foram melhores, 10% semelhantes, 46% piores
» O melhor teve um delta de 7%, a média foi 21%, o pior foi 53%
Comparado com todos os dispositivos testados
» 53% de todos os dispositivos testados foram melhores, 8% semelhantes, 39% piores
» O melhor teve um delta de 4%, a média foi 23%, o pior foi 134%
| desligado | |
| Ocioso | |
| Carga |
|
Key:
min: | |
| Lenovo ThinkPad E495-20NE000JGE R5 3500U, Vega 8, SK hynix BC501 HFM256GDHTNG, IPS, 1920x1080, 14" | Lenovo ThinkPad T495-20NKS01Y00 R5 PRO 3500U, Vega 8, Samsung SSD PM981 MZVLB512HAJQ, IPS, 1920x1080, 14" | Lenovo ThinkPad E490-20N90004GE i7-8565U, Radeon RX 550X (Laptop), Toshiba KBG30ZMT512G, IPS, 1920x1080, 14" | Lenovo ThinkPad E490-20N8000RGE i5-8265U, UHD Graphics 620, SK hynix BC501 HFM256GDHTNG, IPS, 1920x1080, 14" | Lenovo ThinkPad E485-20KU000NGE R5 2500U, Vega 8, Samsung PM961 MZVLW256HEHP, IPS, 1920x1080, 14" | Média AMD Radeon RX Vega 8 (Ryzen 2000/3000) | Média da turma Office | |
|---|---|---|---|---|---|---|---|
| Power Consumption | -25% | -67% | 10% | -33% | -33% | -27% | |
| Idle Minimum * (Watt) | 4.1 | 5.1 -24% | 6.8 -66% | 2.76 33% | 6.2 -51% | 5.68 ? -39% | 4.3 ? -5% |
| Idle Average * (Watt) | 5.86 | 7.7 -31% | 9.4 -60% | 5.96 -2% | 8.6 -47% | 8.75 ? -49% | 7.33 ? -25% |
| Idle Maximum * (Watt) | 6.36 | 10.7 -68% | 12.4 -95% | 6.57 -3% | 9.7 -53% | 10.1 ? -59% | 8.59 ? -35% |
| Load Average * (Watt) | 30.4 | 35.8 -18% | 57.2 -88% | 28.2 7% | 37.4 -23% | 37.8 ? -24% | 43.6 ? -43% |
| Load Maximum * (Watt) | 50 | 43.2 14% | 63.1 -26% | 43.6 13% | 44.8 10% | 46.2 ? 8% | 64.2 ? -28% |
* ... menor é melhor
| Lenovo ThinkPad E495-20NE000JGE R5 3500U, Vega 8, 45 Wh | Lenovo ThinkPad T495-20NKS01Y00 R5 PRO 3500U, Vega 8, 50 Wh | Lenovo ThinkPad E490-20N90004GE i7-8565U, Radeon RX 550X (Laptop), 45 Wh | Lenovo ThinkPad E490-20N8000RGE i5-8265U, UHD Graphics 620, 45 Wh | Lenovo ThinkPad E485-20KU000NGE R5 2500U, Vega 8, 45 Wh | Média da turma Office | |
|---|---|---|---|---|---|---|
| Duração da bateria | 30% | -6% | 22% | -32% | 74% | |
| H.264 (h) | 7.9 | 11.8 49% | 8.2 4% | 11.5 46% | 5.7 -28% | 15.1 ? 91% |
| WiFi v1.3 (h) | 8.3 | 9.1 10% | 7 -16% | 8.1 -2% | 5.4 -35% | 13 ? 57% |
Pro
Contra
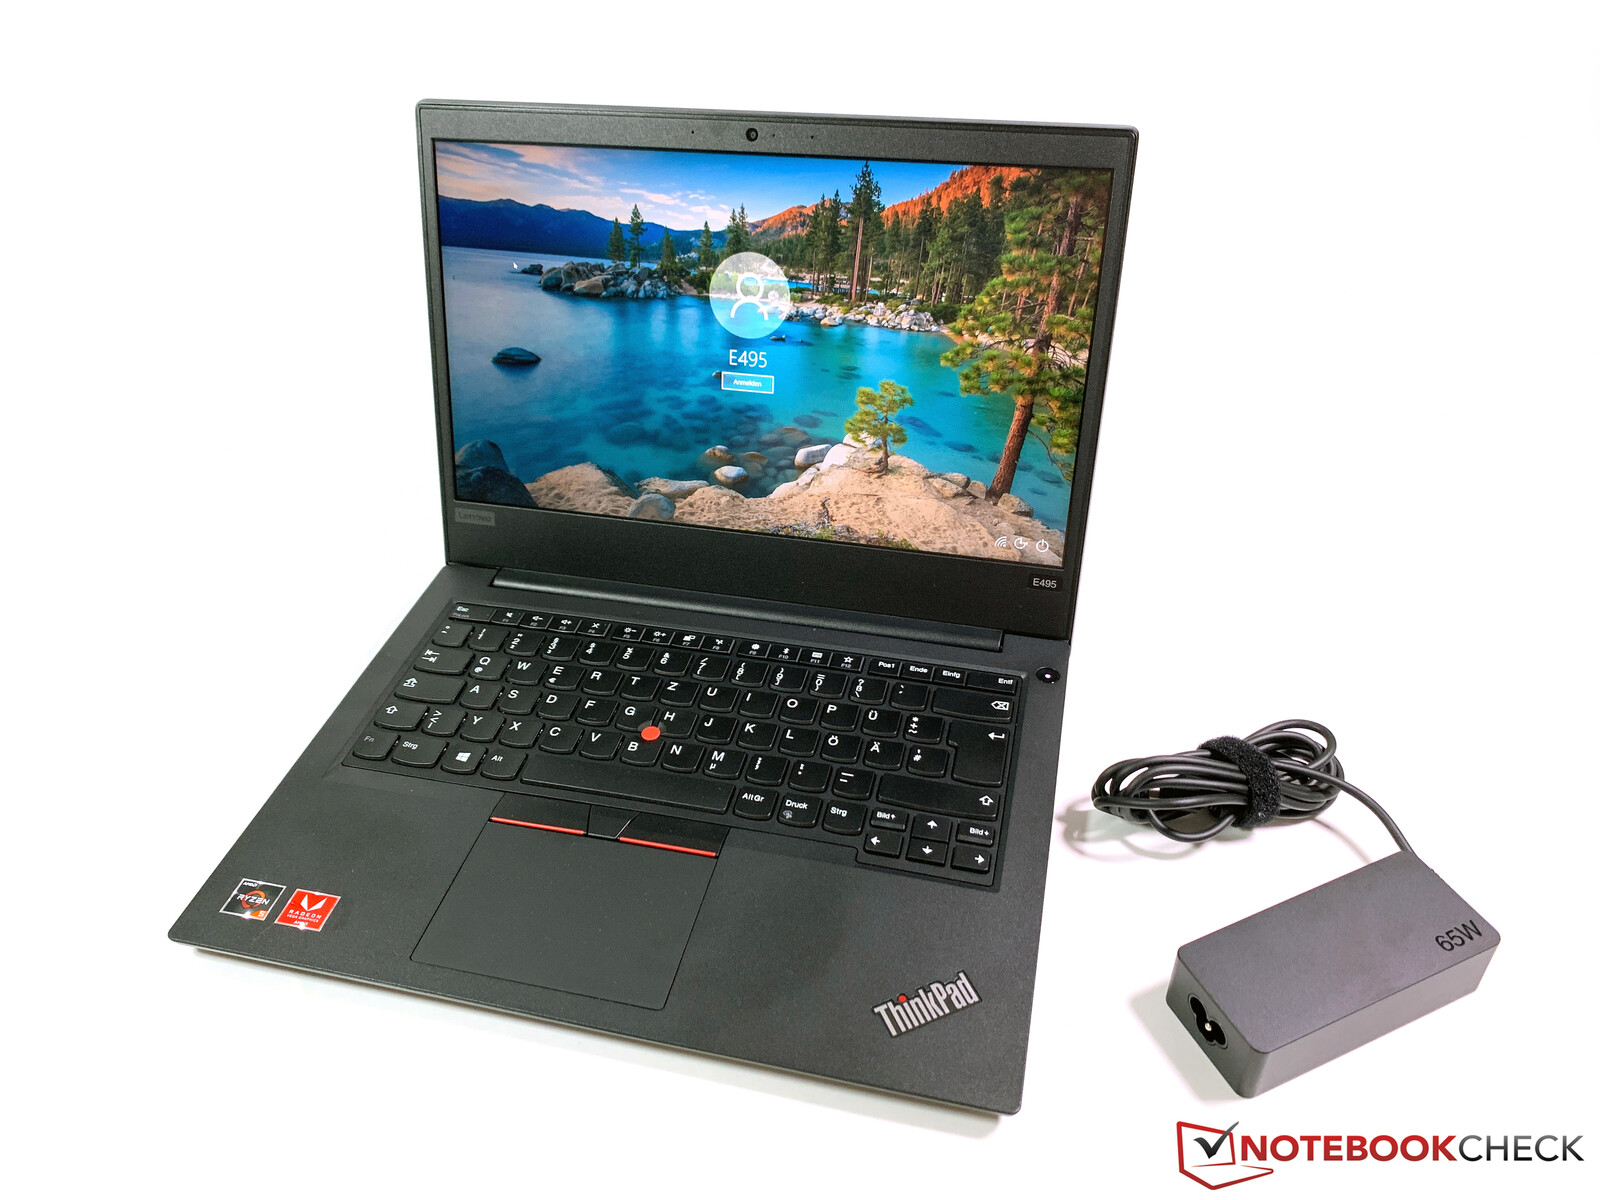

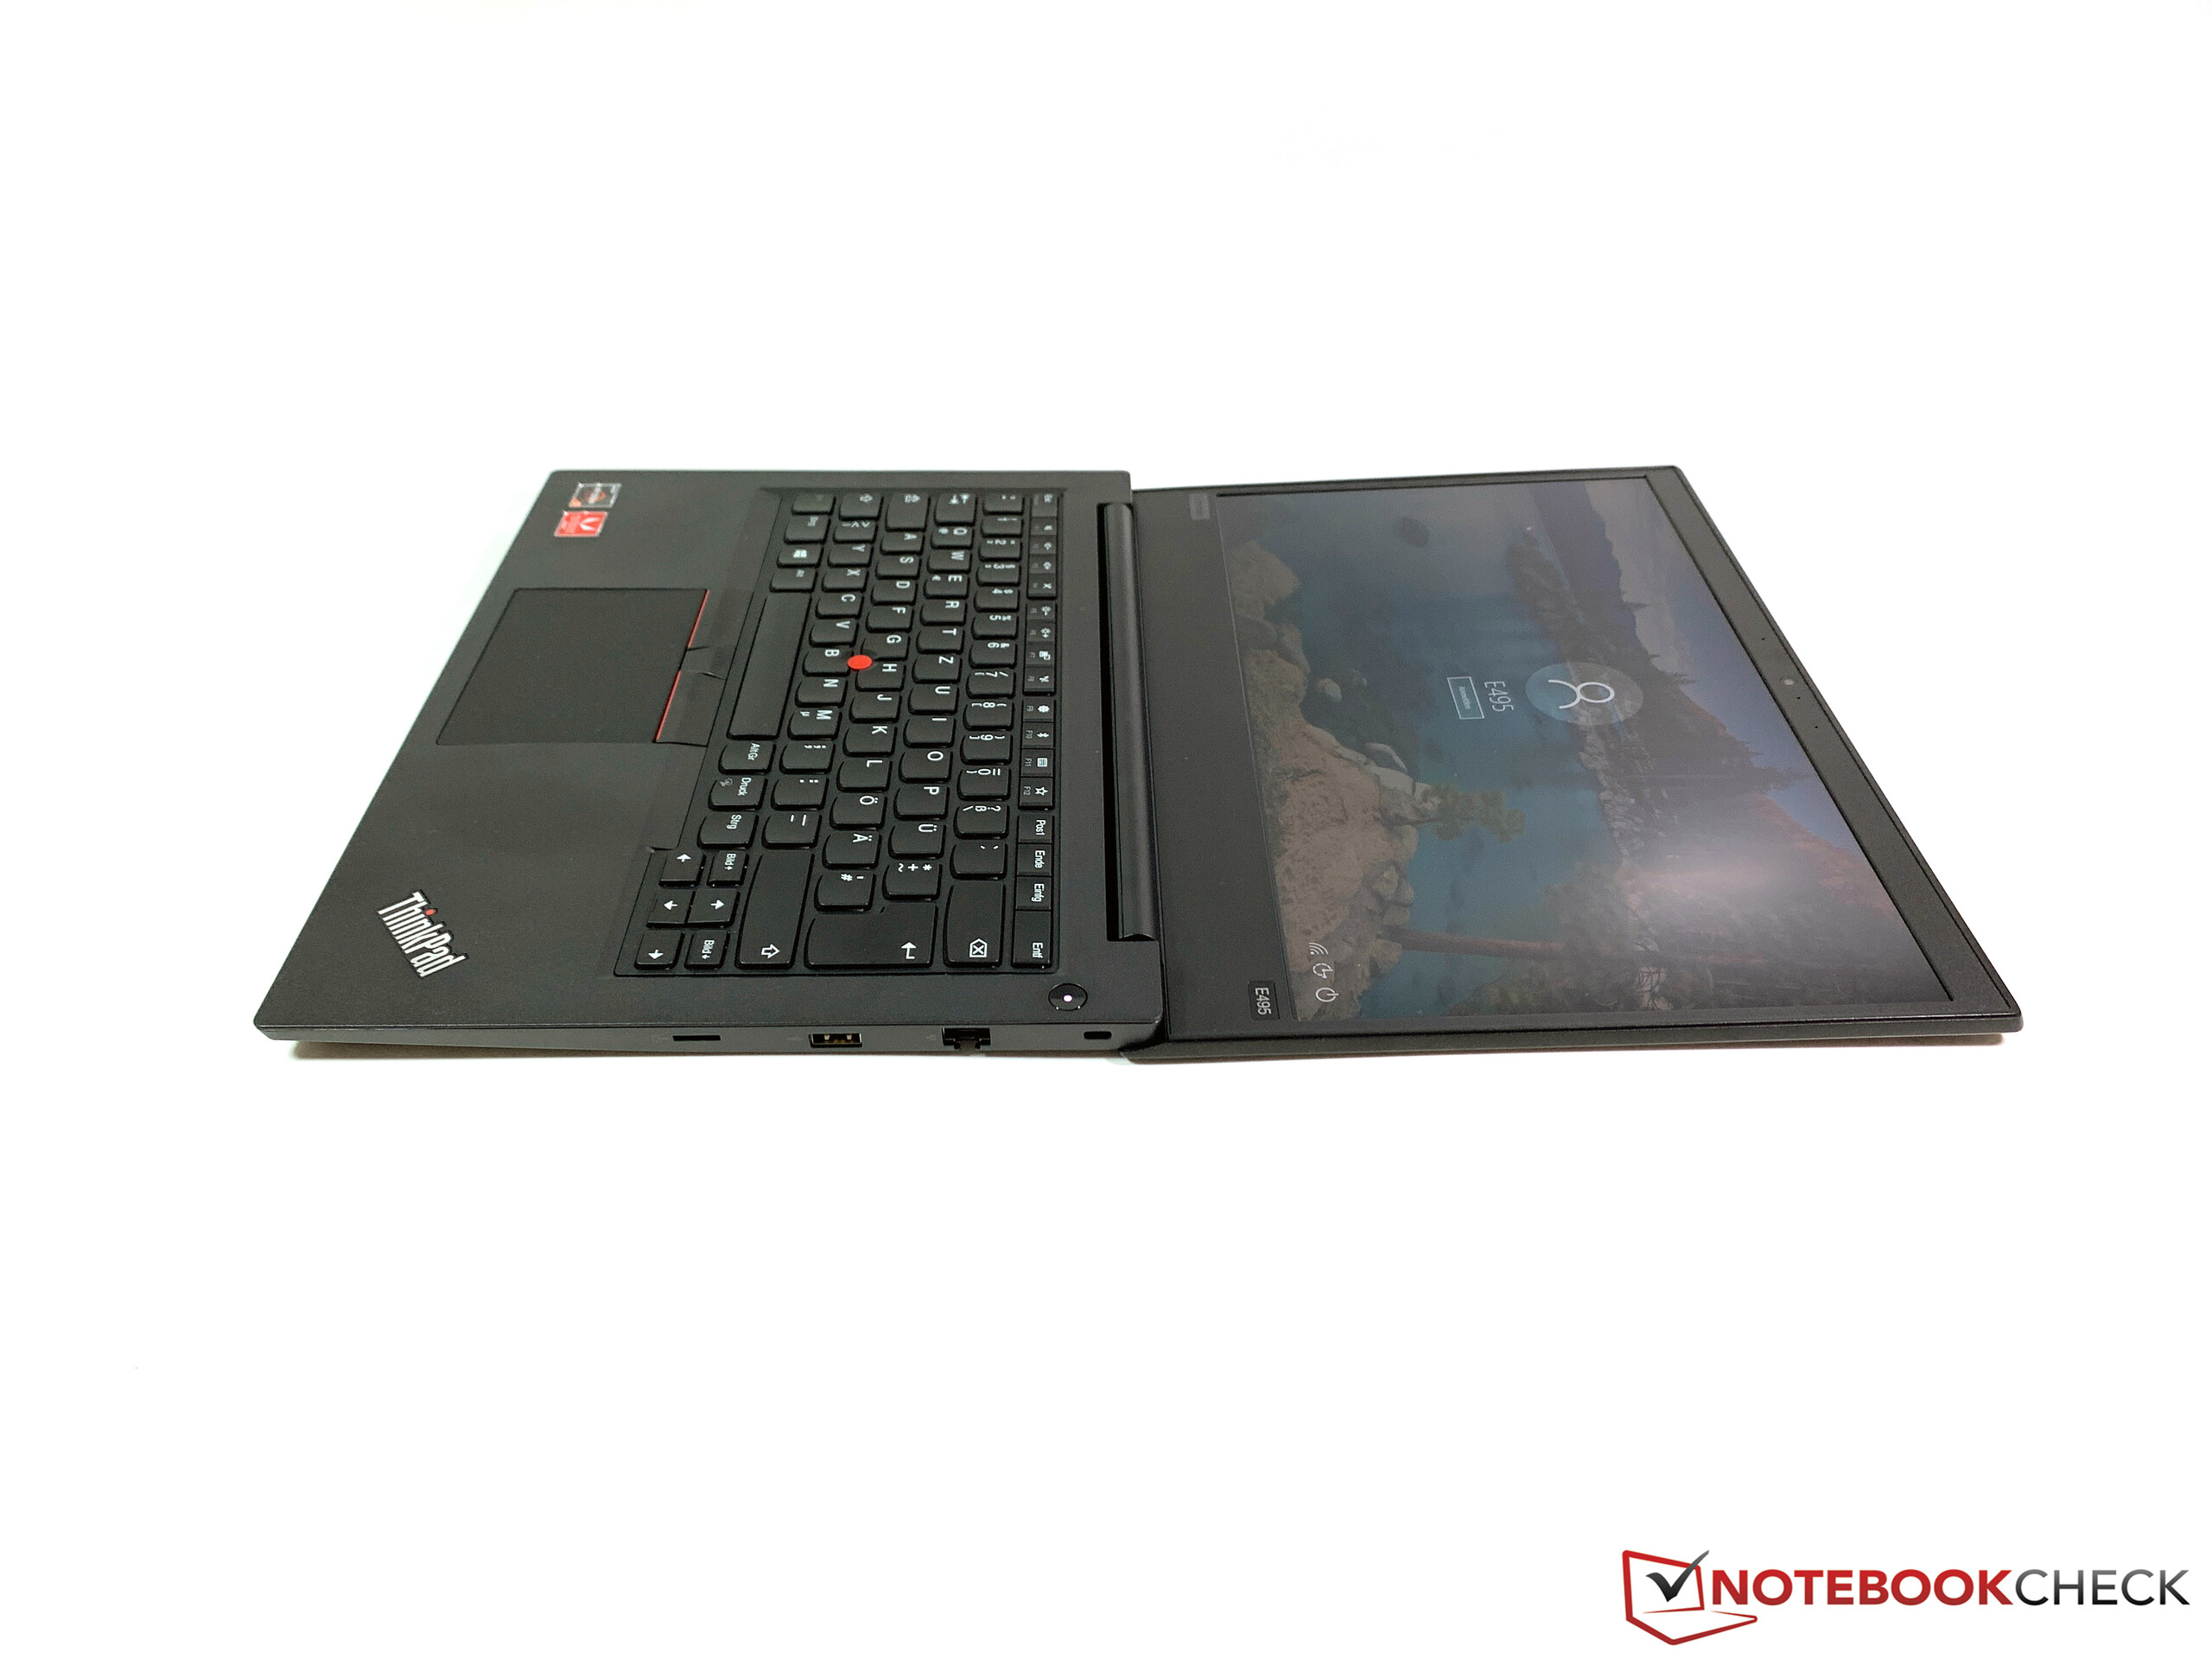
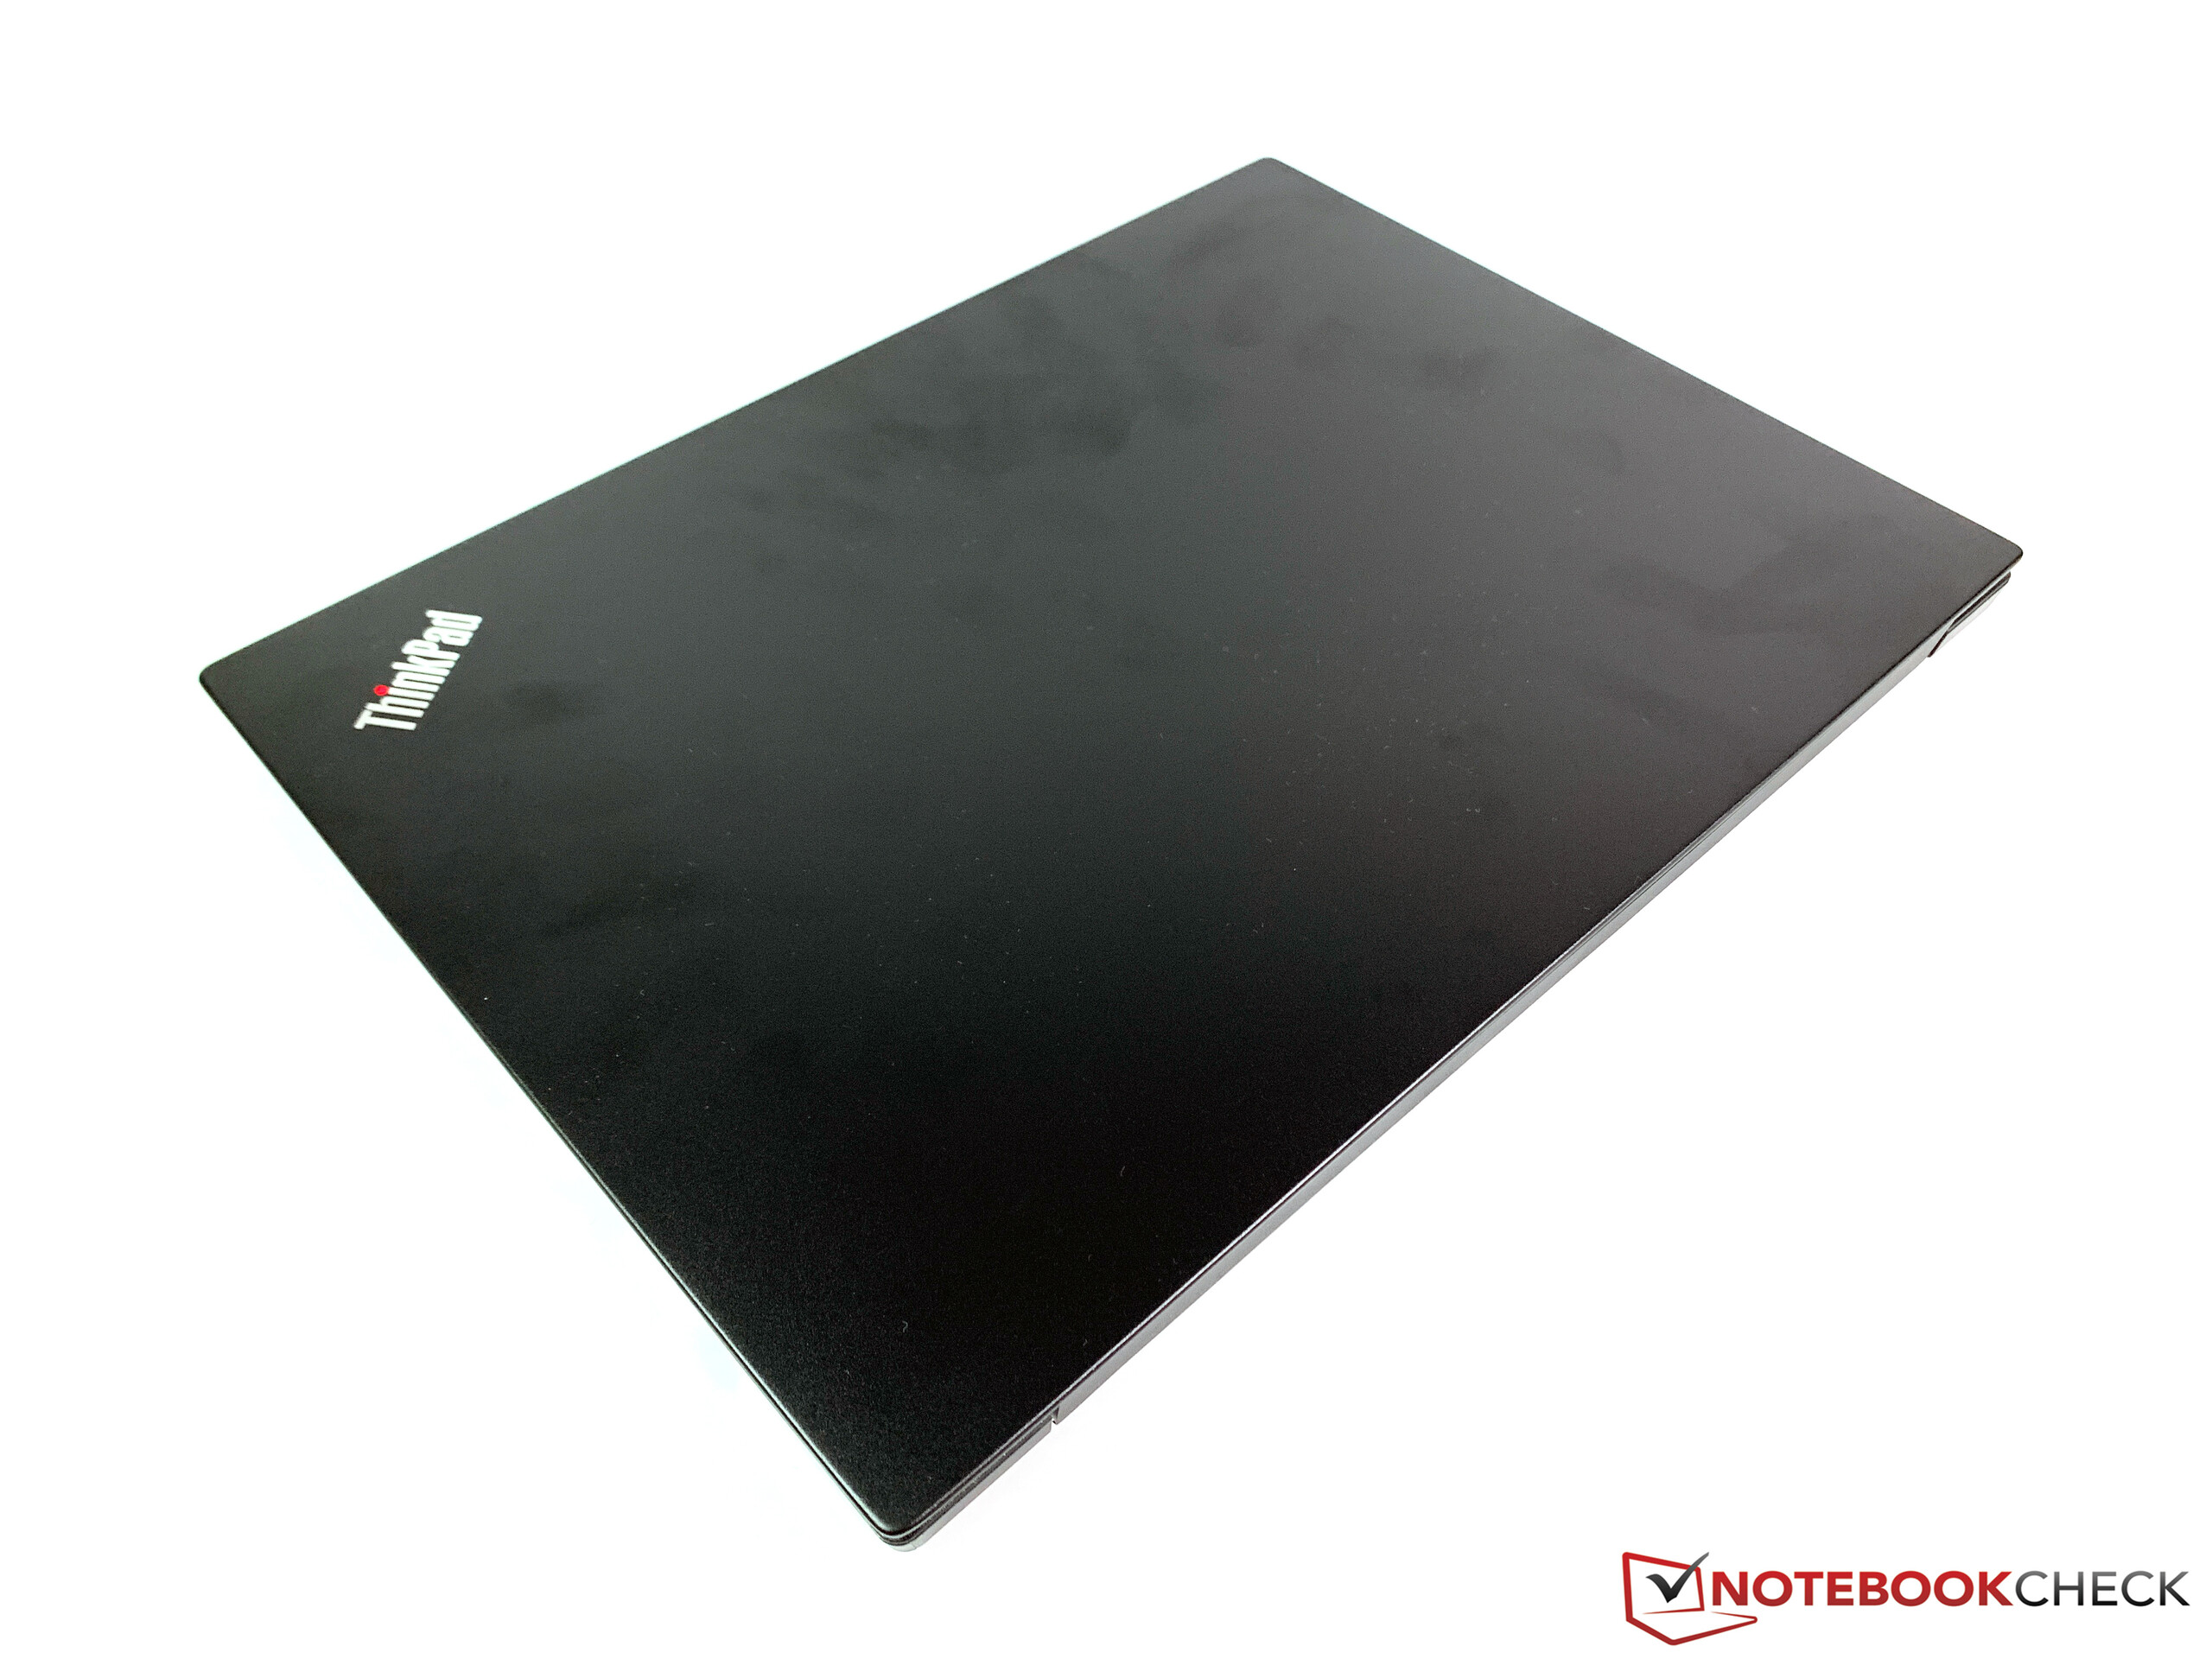
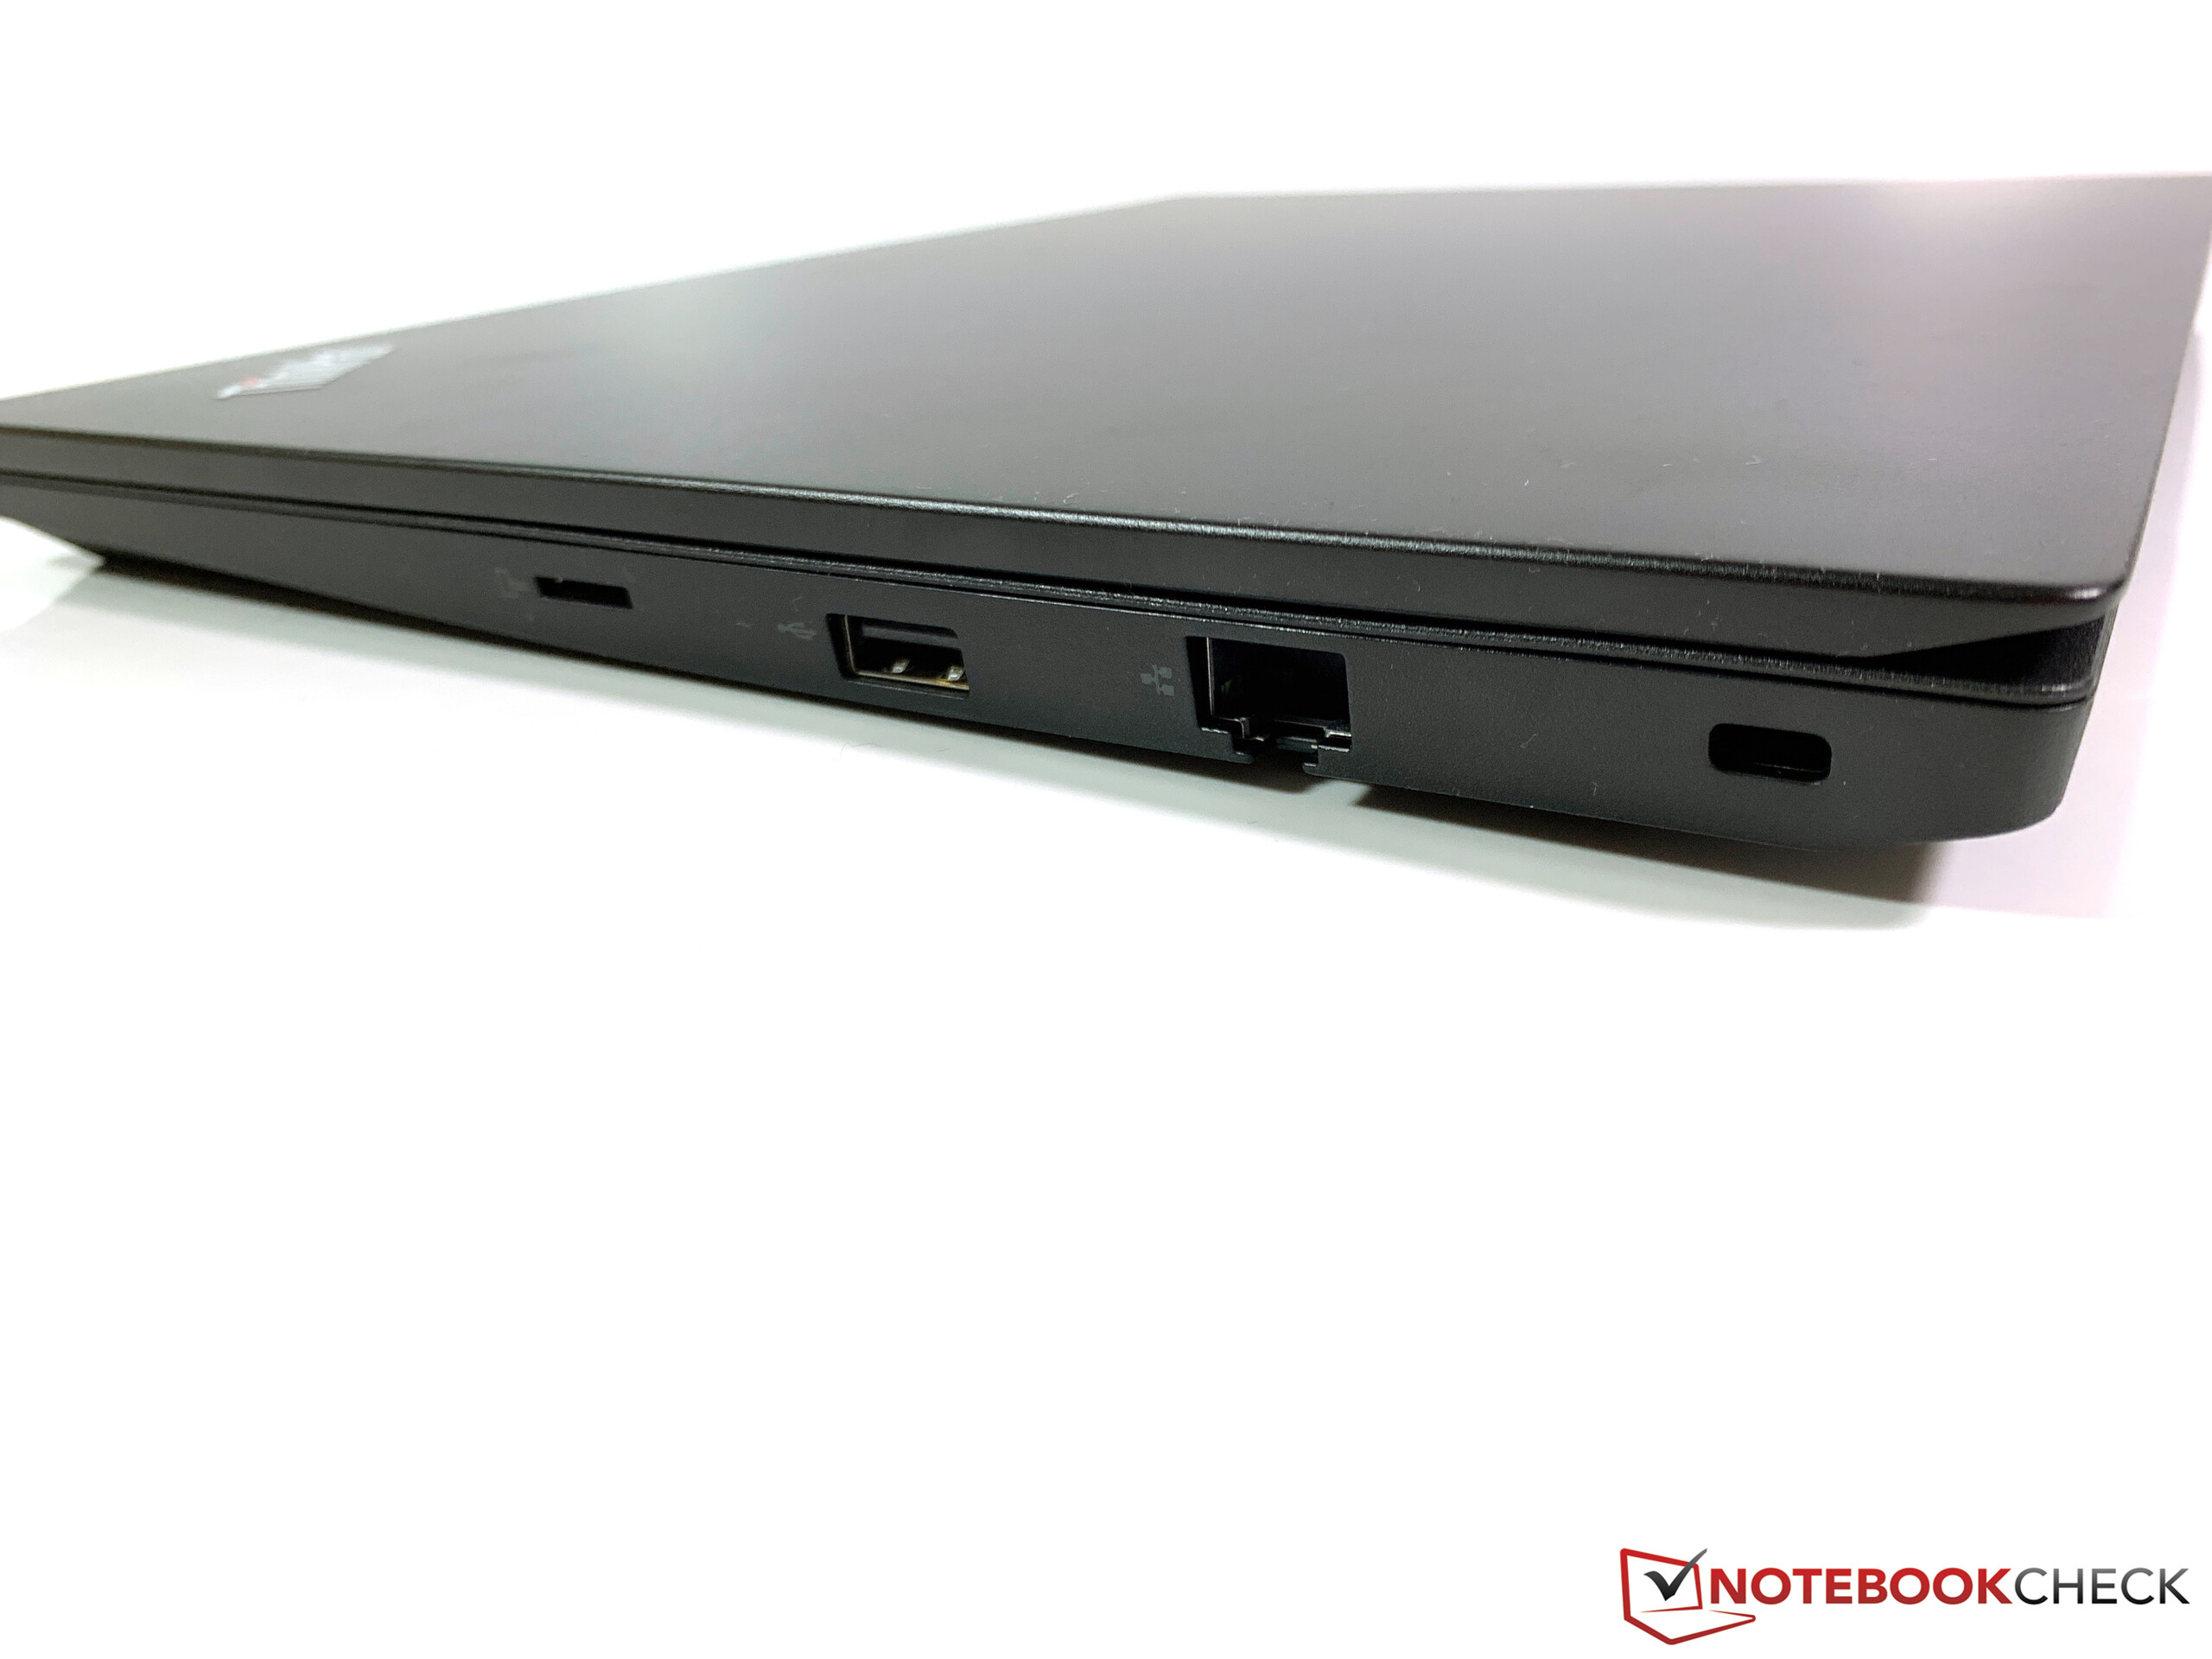
O Lenovo ThinkPad E495 é um portátil de escritório sólido por pouco dinheiro. Por menos de 700 Euros (~US$ 770), você recebe uma carcaça estável, ótimos dispositivos de entrada, muita energia e uma bateria decente. A comparação com o modelo Intel também mostra que a Lenovo limita um pouco artificialmente o E495. O plástico na superfície da unidade base parece muito mais barato com seu revestimento áspero e não entendemos por que não há iluminação no teclado ou um leitor de digitais nem mesmo a um custo extra.
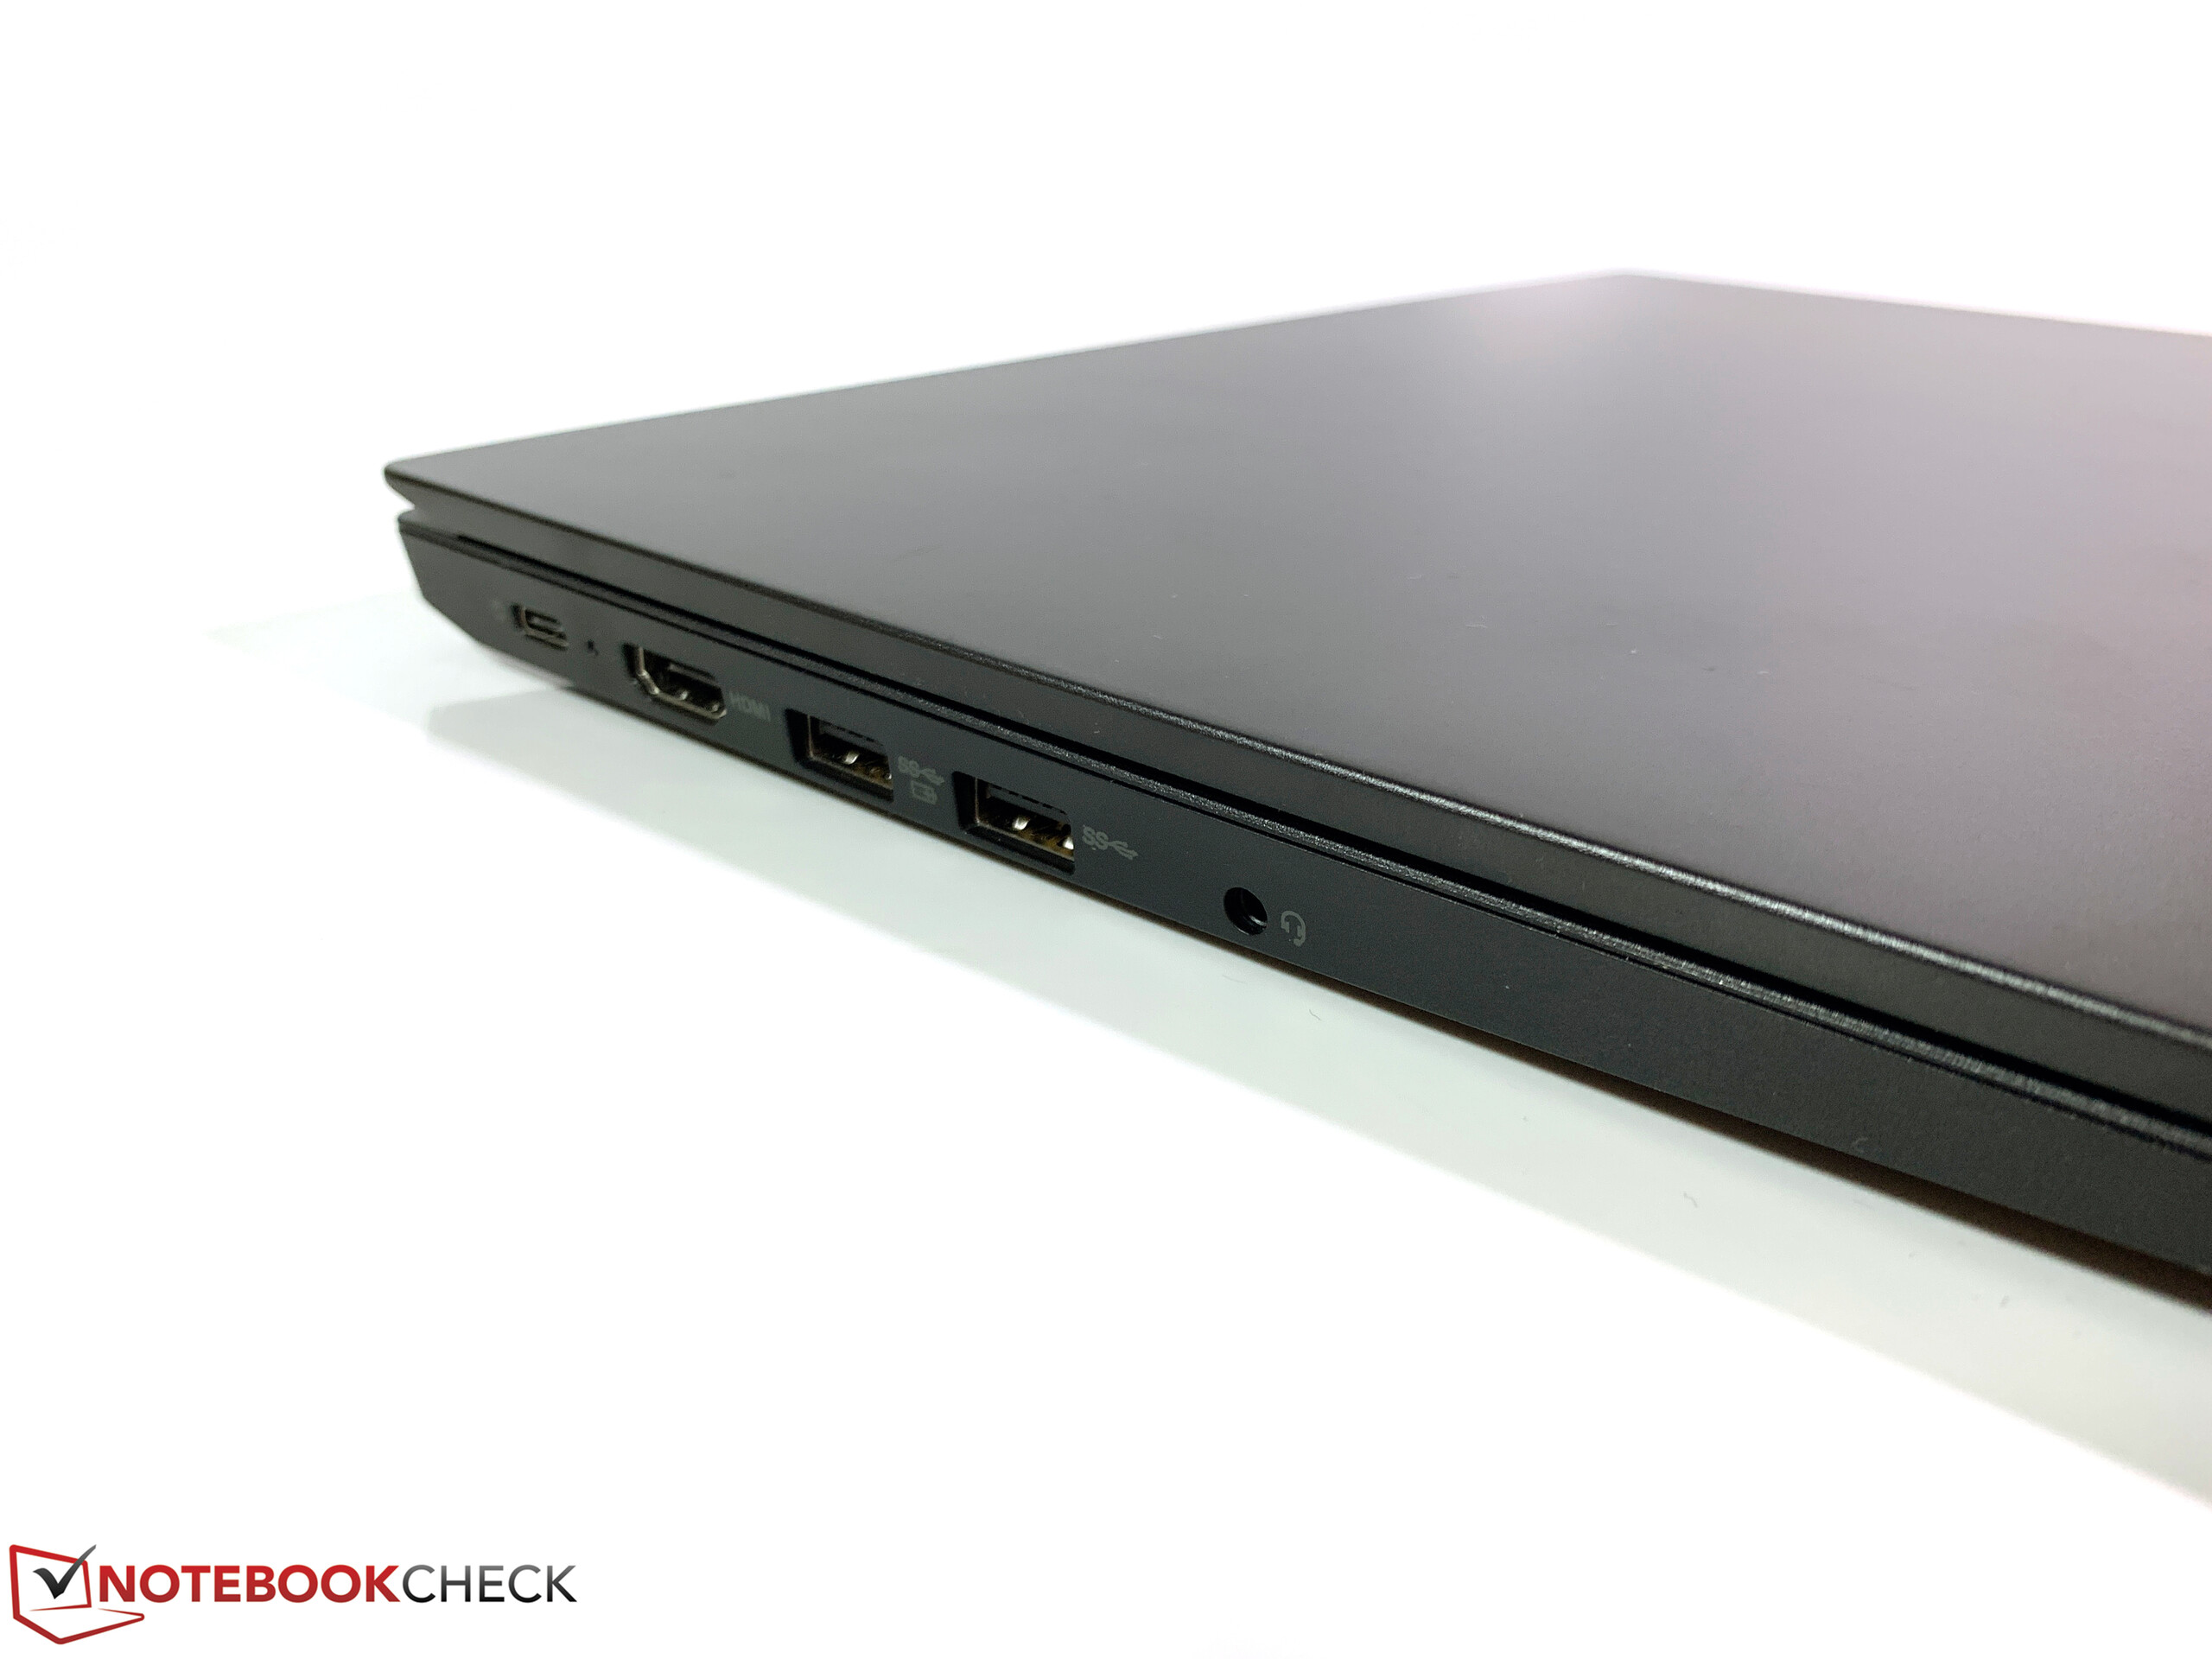
O desempenho do SoC Ryzen é muito bom e a CPU e a GPU obtêm uma pontuação melhor que a do Intel Core i5. No entanto, a Radeon RX 550X (opcional) dedicada no ThinkPad E490 oferece visivelmente mais potência gráfica e, portanto, é recomendada se você também quiser usar o ThinkPad para jogos. Nem o E490 nem o E495 oferecem Thunderbolt 3, portanto, a conexão de uma eGPU não é possível. Para explorar todo o potencial do SoC AMD, você também precisa de outro módulo de RAM.
Bom valor pelo dinheiro: O ThinkPad E495 oferece mais energia do que o modelo Intel um pouco mais caro e não possui mais desvantagens em termos de duração da bateria. No entanto, deve-se aceitar a falta de recursos (especialmente a iluminação do teclado) e o plástico mais barato.
Atenção: Desde a análise do ThinkPad E490, atualizamos nosso sistema de pontuação para a versão 7 (veja Aqui). Isso reduz a classificação do E490 de 89% para 86%. O ThinkPad E485 atinge 84%. A discrepância, conforme listamos neste artigo, resulta das diferenças no equipamento e do material da carcaça.
Lenovo ThinkPad E495-20NE000JGE
- 09/16/2019 v7 (old)
Andreas Osthoff