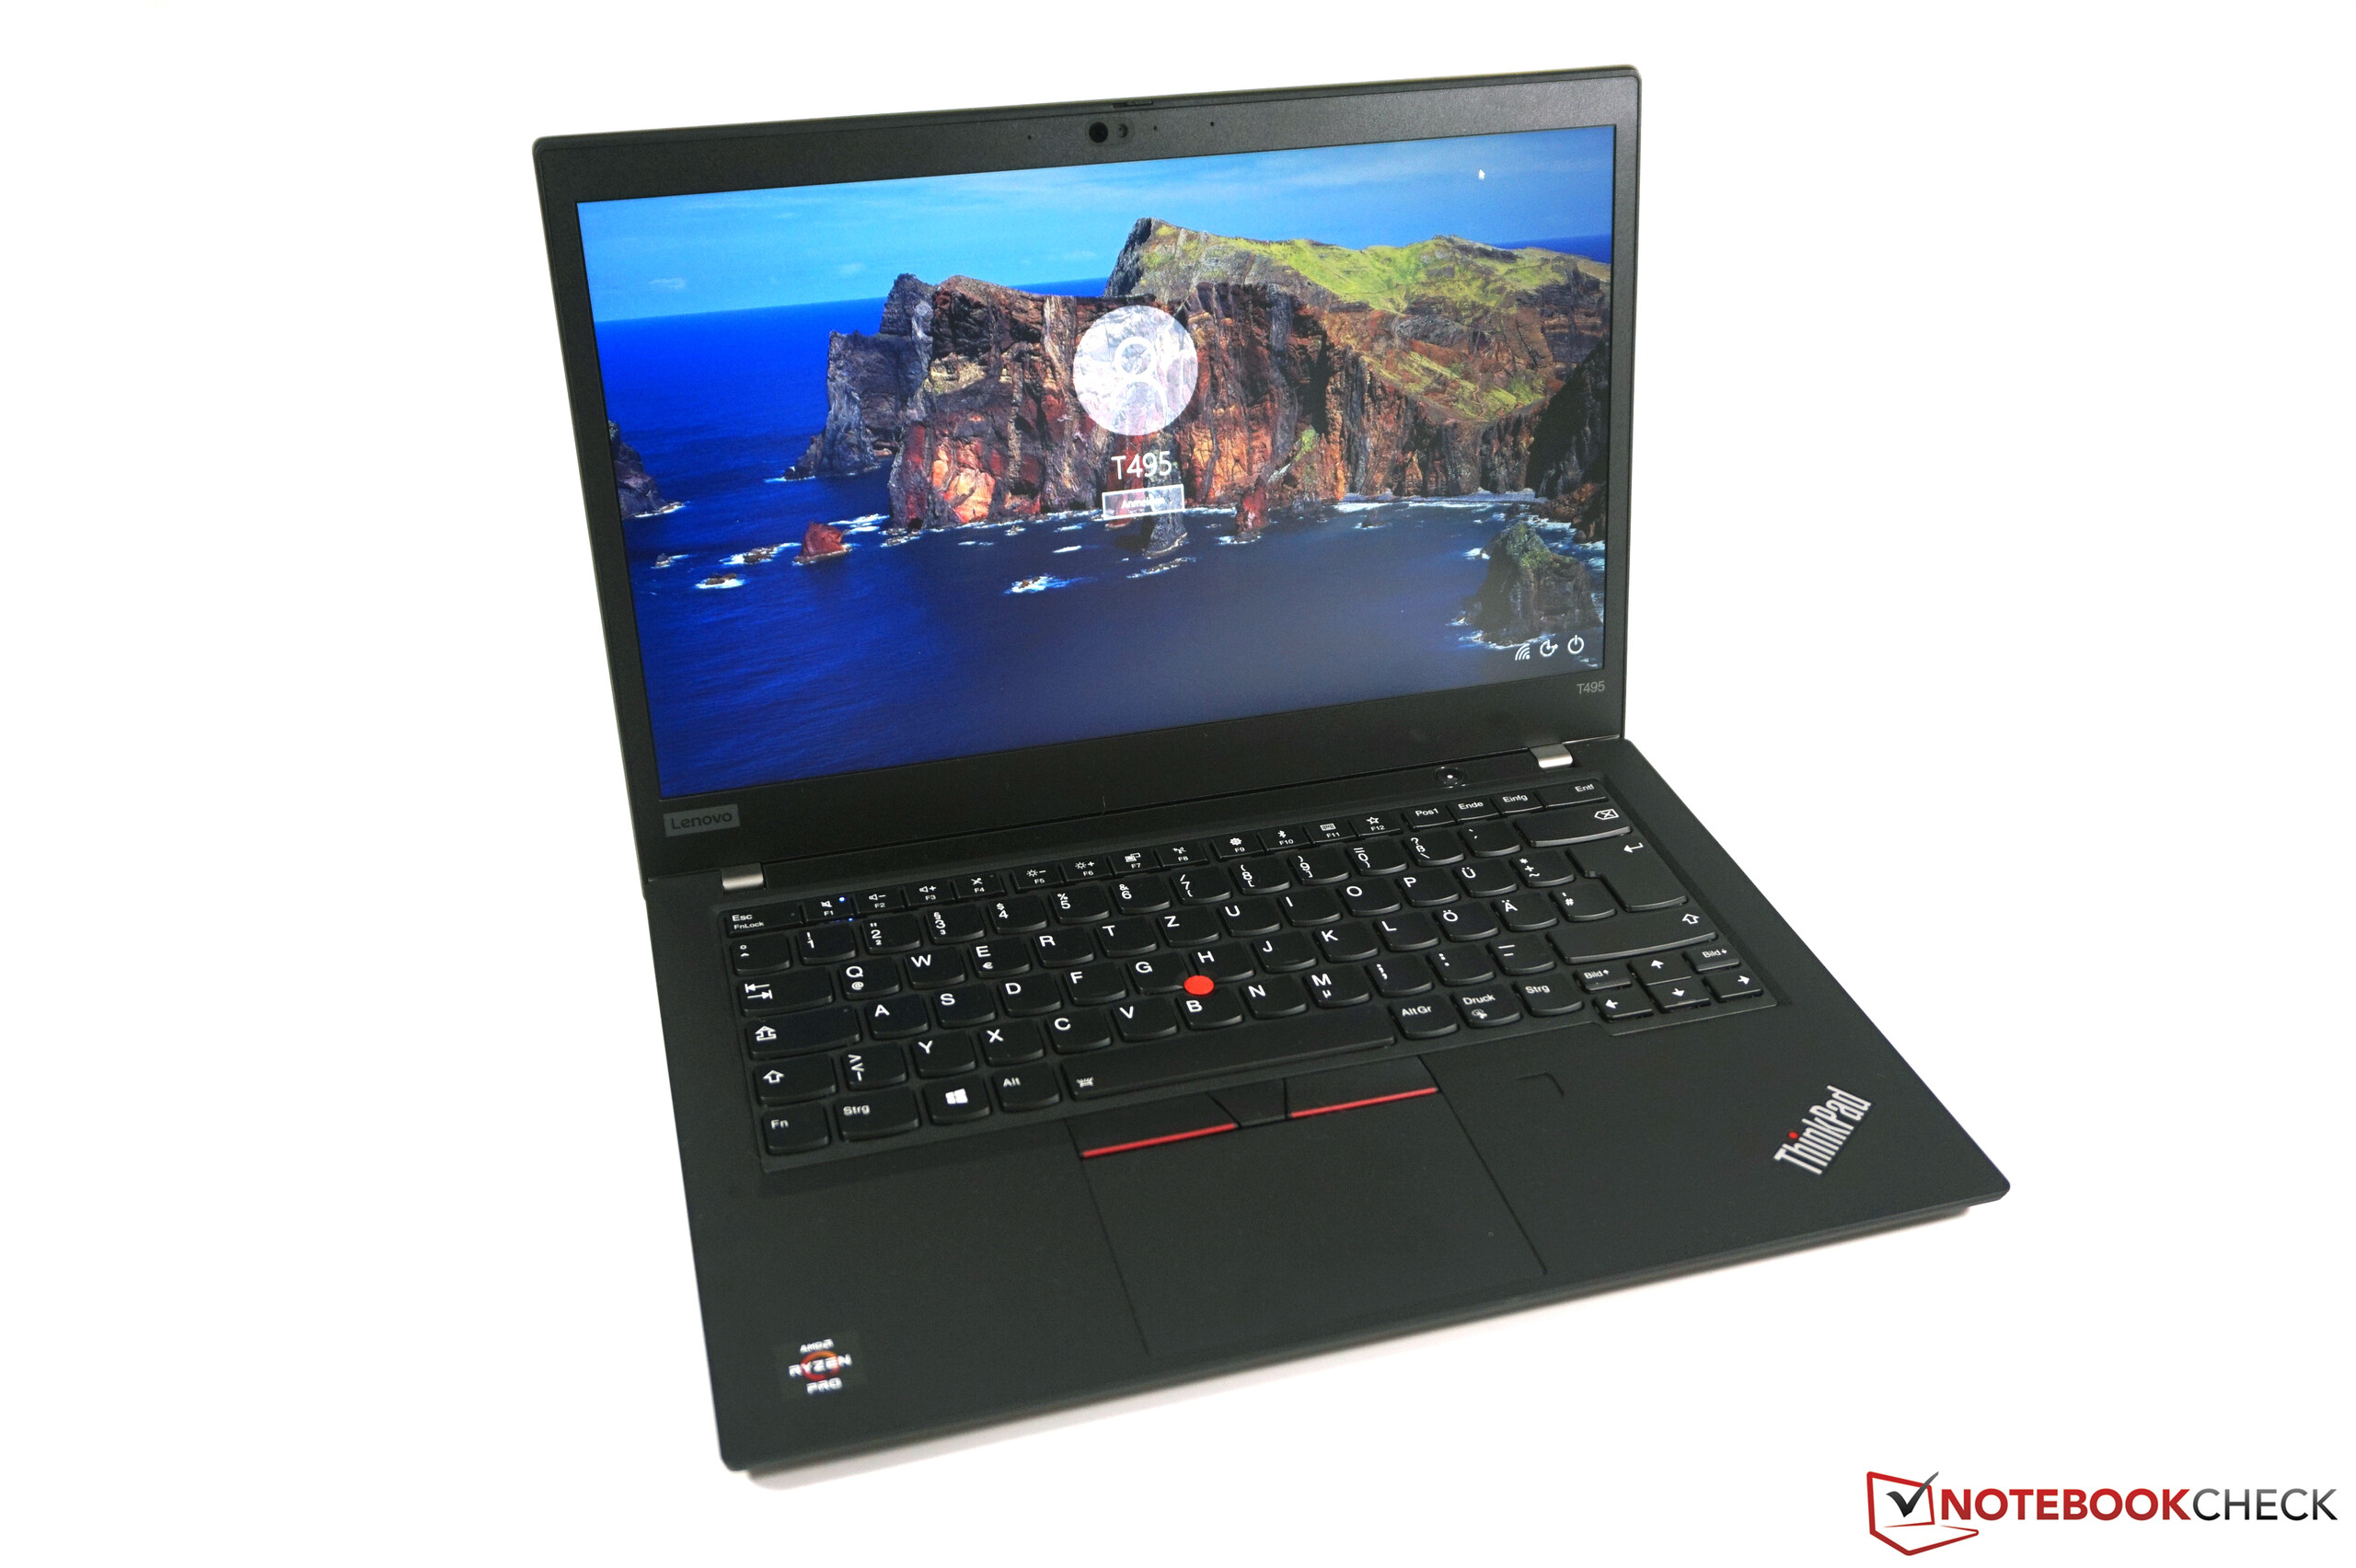
Breve Análise do Lenovo ThinkPad T495: portátil empresarial com processador AMD, longa duração da bateria, e boa tela
| SD Card Reader | |
| average JPG Copy Test (av. of 3 runs) | |
| Dell Latitude 7490 (Toshiba Exceria Pro M501 UHS-II) | |
| Lenovo ThinkPad T495-20NKS01Y00 (Toshiba Exceria Pro M501 64 GB UHS-II) | |
| Lenovo ThinkPad T490-20N3S02L00 (Toshiba Exceria Pro M501) | |
| Lenovo ThinkPad T490s-20NYS02A00 (Toshiba Exceria Pro M501) | |
| Média da turma Office (22.4 - 198.5, n=22, últimos 2 anos) | |
| maximum AS SSD Seq Read Test (1GB) | |
| Dell Latitude 7490 (Toshiba Exceria Pro M501 UHS-II) | |
| Lenovo ThinkPad T495-20NKS01Y00 (Toshiba Exceria Pro M501 64 GB UHS-II) | |
| Lenovo ThinkPad T490s-20NYS02A00 (Toshiba Exceria Pro M501) | |
| Lenovo ThinkPad T490-20N3S02L00 (Toshiba Exceria Pro M501) | |
| Média da turma Office (27.4 - 249, n=20, últimos 2 anos) | |
| |||||||||||||||||||||||||
iluminação: 88 %
iluminação com acumulador: 423 cd/m²
Contraste: 1448:1 (Preto: 0.29 cd/m²)
ΔE ColorChecker Calman: 2.1 | ∀{0.5-29.43 Ø4.73}
calibrated: 0.7
ΔE Greyscale Calman: 3.4 | ∀{0.09-98 Ø4.97}
98.6% sRGB (Argyll 1.6.3 3D)
63.5% AdobeRGB 1998 (Argyll 1.6.3 3D)
69.2% AdobeRGB 1998 (Argyll 3D)
98.5% sRGB (Argyll 3D)
67% Display P3 (Argyll 3D)
Gamma: 2.22
CCT: 7168 K
| Lenovo ThinkPad T495-20NKS01Y00 N140HCG-GQ2, , 1920x1080, 14" | Lenovo ThinkPad T490-20N3S02L00 NE140FHM-N61, , 1920x1080, 14" | Lenovo ThinkPad T490s-20NYS02A00 B140HAN05.7, , 1920x1080, 14" | Lenovo ThinkPad X1 Carbon 2019-20QES01L00 LP140WF9_SPF1, , 1920x1080, 14" | |
|---|---|---|---|---|
| Display | -2% | -1% | -4% | |
| Display P3 Coverage (%) | 67 | 69.3 3% | 67.1 0% | 64.5 -4% |
| sRGB Coverage (%) | 98.5 | 92.2 -6% | 97.6 -1% | 95.8 -3% |
| AdobeRGB 1998 Coverage (%) | 69.2 | 67.4 -3% | 68.5 -1% | 65.7 -5% |
| Response Times | -164% | -123% | -60% | |
| Response Time Grey 50% / Grey 80% * (ms) | 32.4 ? | 74 ? -128% | 61.6 ? -90% | 44.8 ? -38% |
| Response Time Black / White * (ms) | 15.2 ? | 45.6 ? -200% | 38.8 ? -155% | 27.6 ? -82% |
| PWM Frequency (Hz) | 26040 ? | 2451 ? | ||
| Screen | -39% | -9% | -26% | |
| Brightness middle (cd/m²) | 420 | 418 0% | 391 -7% | 381 -9% |
| Brightness (cd/m²) | 391 | 400 2% | 389 -1% | 375 -4% |
| Brightness Distribution (%) | 88 | 88 0% | 87 -1% | 94 7% |
| Black Level * (cd/m²) | 0.29 | 0.24 17% | 0.23 21% | 0.24 17% |
| Contrast (:1) | 1448 | 1742 20% | 1700 17% | 1588 10% |
| Colorchecker dE 2000 * | 2.1 | 4.7 -124% | 3.4 -62% | 4.6 -119% |
| Colorchecker dE 2000 max. * | 5.5 | 8.7 -58% | 4.7 15% | 8.5 -55% |
| Colorchecker dE 2000 calibrated * | 0.7 | 2.1 -200% | 1.1 -57% | 1.2 -71% |
| Greyscale dE 2000 * | 3.4 | 5.9 -74% | 4 -18% | 5.1 -50% |
| Gamma | 2.22 99% | 2.06 107% | 2.49 88% | 2.52 87% |
| CCT | 7168 91% | 7350 88% | 6809 95% | 7052 92% |
| Color Space (Percent of AdobeRGB 1998) (%) | 63.5 | 59.9 -6% | 62.4 -2% | 60.7 -4% |
| Color Space (Percent of sRGB) (%) | 98.6 | 92.1 -7% | 97.4 -1% | 95.7 -3% |
| Média Total (Programa/Configurações) | -68% /
-48% | -44% /
-21% | -30% /
-26% |
* ... menor é melhor
Exibir tempos de resposta
| ↔ Tempo de resposta preto para branco | ||
|---|---|---|
| 15.2 ms ... ascensão ↗ e queda ↘ combinadas | ↗ 6.8 ms ascensão | 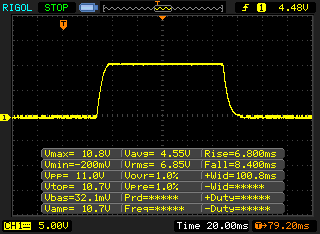 |
| ↘ 8.4 ms queda | ||
| A tela mostra boas taxas de resposta em nossos testes, mas pode ser muito lenta para jogadores competitivos. Em comparação, todos os dispositivos testados variam de 0.1 (mínimo) a 240 (máximo) ms. » 36 % de todos os dispositivos são melhores. Isso significa que o tempo de resposta medido é melhor que a média de todos os dispositivos testados (19.9 ms). | ||
| ↔ Tempo de resposta 50% cinza a 80% cinza | ||
| 32.4 ms ... ascensão ↗ e queda ↘ combinadas | ↗ 16.4 ms ascensão | 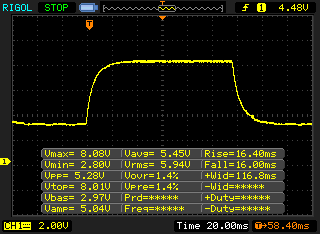 |
| ↘ 16 ms queda | ||
| A tela mostra taxas de resposta lentas em nossos testes e será insatisfatória para os jogadores. Em comparação, todos os dispositivos testados variam de 0.165 (mínimo) a 636 (máximo) ms. » 44 % de todos os dispositivos são melhores. Isso significa que o tempo de resposta medido é semelhante à média de todos os dispositivos testados (31.1 ms). | ||
Cintilação da tela / PWM (modulação por largura de pulso)
| Tela tremeluzindo/PWM detectado | 26040 Hz | ≤ 50 % configuração de brilho | 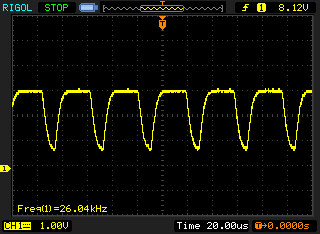 |
A luz de fundo da tela pisca em 26040 Hz (pior caso, por exemplo, utilizando PWM) Cintilação detectada em uma configuração de brilho de 50 % e abaixo. Não deve haver cintilação ou PWM acima desta configuração de brilho. A frequência de 26040 Hz é bastante alta, então a maioria dos usuários sensíveis ao PWM não deve notar nenhuma oscilação. [pwm_comparison] Em comparação: 52 % de todos os dispositivos testados não usam PWM para escurecer a tela. Se PWM foi detectado, uma média de 7798 (mínimo: 5 - máximo: 343500) Hz foi medida. | |||
| PCMark 8 Home Score Accelerated v2 | 4072 pontos | |
| PCMark 8 Creative Score Accelerated v2 | 4947 pontos | |
| PCMark 8 Work Score Accelerated v2 | 4880 pontos | |
| PCMark 10 Score | 3818 pontos | |
Ajuda | ||
| Lenovo ThinkPad T495-20NKS01Y00 Samsung SSD PM981 MZVLB512HAJQ | Lenovo ThinkPad T490-20N3S02L00 Toshiba XG5 KXG50ZNV512G | Lenovo ThinkPad A485-20MU000CGE Samsung SSD PM981 MZVLB256HAHQ | Dell Latitude 7490 Toshiba KSG60ZMV256G | HP EliteBook 745 G5 3UN74EA Toshiba XG5 KXG50ZNV256G | |
|---|---|---|---|---|---|
| CrystalDiskMark 5.2 / 6 | -12% | -33% | -61% | -34% | |
| Write 4K (MB/s) | 137.7 | 126.6 -8% | 114.8 -17% | 79.4 -42% | 119.5 -13% |
| Read 4K (MB/s) | 44.11 | 43.61 -1% | 41.33 -6% | 27.37 -38% | 31.9 -28% |
| Write Seq (MB/s) | 2714 | 1342 -51% | 1271 -53% | 343.9 -87% | 351.1 -87% |
| Read Seq (MB/s) | 2665 | 1251 -53% | 1171 -56% | 472.7 -82% | 1665 -38% |
| Write 4K Q32T1 (MB/s) | 251.2 | 297.7 19% | 218.4 -13% | 206 -18% | 268.4 7% |
| Read 4K Q32T1 (MB/s) | 336.6 | 376.4 12% | 308.5 -8% | 188.3 -44% | 333.1 -1% |
| Write Seq Q32T1 (MB/s) | 2994 | 2969 -1% | 1460 -51% | 343.3 -89% | 351.8 -88% |
| Read Seq Q32T1 (MB/s) | 3547 | 3228 -9% | 1529 -57% | 533 -85% | 2705 -24% |
| Write 4K Q8T8 (MB/s) | 1246 | 1208 | 356 | ||
| Read 4K Q8T8 (MB/s) | 1397 | 983 | 453.2 | ||
| AS SSD | 5% | -51% | -74% | -79% | |
| Seq Read (MB/s) | 2661 | 2571 -3% | 1224 -54% | 486.2 -82% | 1682 -37% |
| Seq Write (MB/s) | 2330 | 2294 -2% | 1118 -52% | 294.9 -87% | 189 -92% |
| 4K Read (MB/s) | 48.28 | 52.8 9% | 42.46 -12% | 26.66 -45% | 26.77 -45% |
| 4K Write (MB/s) | 94.7 | 154.1 63% | 77.4 -18% | 79.2 -16% | 85.3 -10% |
| 4K-64 Read (MB/s) | 1475 | 1464 -1% | 559 -62% | 316.1 -79% | 420.5 -71% |
| 4K-64 Write (MB/s) | 1494 | 1350 -10% | 378.1 -75% | 248.1 -83% | 321.5 -78% |
| Access Time Read * (ms) | 0.046 | 0.061 -33% | 0.081 -76% | 0.112 -143% | 0.172 -274% |
| Access Time Write * (ms) | 0.041 | 0.026 37% | 0.049 -20% | 0.056 -37% | 0.061 -49% |
| Score Read (Points) | 1790 | 1773 -1% | 724 -60% | 391 -78% | 615 -66% |
| Score Write (Points) | 1822 | 1733 -5% | 567 -69% | 357 -80% | 426 -77% |
| Score Total (Points) | 4514 | 4406 -2% | 1669 -63% | 947 -79% | 1288 -71% |
| Copy ISO MB/s (MB/s) | 1963 | 812 | 282.5 | ||
| Copy Program MB/s (MB/s) | 440.5 | 209.4 | 212.2 | ||
| Copy Game MB/s (MB/s) | 1173 | 356.1 | 302.9 | ||
| Média Total (Programa/Configurações) | -4% /
-2% | -42% /
-43% | -68% /
-68% | -57% /
-60% |
* ... menor é melhor

| 3DMark 11 Performance | 3670 pontos | |
| 3DMark Ice Storm Standard Score | 76723 pontos | |
| 3DMark Cloud Gate Standard Score | 12398 pontos | |
| 3DMark Fire Strike Score | 2141 pontos | |
| 3DMark Time Spy Score | 779 pontos | |
Ajuda | ||
| BioShock Infinite | |
| 1920x1080 Ultra Preset, DX11 (DDOF) | |
| Lenovo ThinkPad T490-20N3S02L00 | |
| Lenovo ThinkPad T495-20NKS01Y00 | |
| 1366x768 High Preset | |
| Lenovo ThinkPad T490-20N3S02L00 | |
| Lenovo ThinkPad T495-20NKS01Y00 | |
| Lenovo ThinkPad T490-20N2004EGE | |
| 1366x768 Medium Preset | |
| Lenovo ThinkPad T490-20N3S02L00 | |
| Lenovo ThinkPad T495-20NKS01Y00 | |
| Lenovo ThinkPad T490-20N2004EGE | |
| 1280x720 Very Low Preset | |
| Lenovo ThinkPad T490-20N3S02L00 | |
| Lenovo ThinkPad T495-20NKS01Y00 | |
| Lenovo ThinkPad T490-20N2004EGE | |
| baixo | média | alto | ultra | |
|---|---|---|---|---|
| BioShock Infinite (2013) | 107.1 | 70.8 | 59.3 | 19.7 |
| Dota 2 Reborn (2015) | 69 | 64 | 38 | 35.2 |
| X-Plane 11.11 (2018) | 26.8 | 19.9 | 18.6 |
Barulho
| Ocioso |
| 28.4 / 28.4 / 29.4 dB |
| Carga |
| 29.9 / 31.4 dB |
 | ||
30 dB silencioso 40 dB(A) audível 50 dB(A) ruidosamente alto |
||
min: | ||
(±) A temperatura máxima no lado superior é 43.9 °C / 111 F, em comparação com a média de 34.3 °C / 94 F , variando de 21.2 a 62.5 °C para a classe Office.
(-) A parte inferior aquece até um máximo de 49.6 °C / 121 F, em comparação com a média de 36.8 °C / 98 F
(+) Em uso inativo, a temperatura média para o lado superior é 25.9 °C / 79 F, em comparação com a média do dispositivo de 29.5 °C / ### class_avg_f### F.
(+) Os apoios para as mãos e o touchpad estão atingindo a temperatura máxima da pele (32 °C / 89.6 F) e, portanto, não estão quentes.
(-) A temperatura média da área do apoio para as mãos de dispositivos semelhantes foi 27.5 °C / 81.5 F (-4.5 °C / -8.1 F).
| desligado | |
| Ocioso | |
| Carga |
|
Key:
min: | |
| Lenovo ThinkPad T495-20NKS01Y00 R5 PRO 3500U, Vega 8, Samsung SSD PM981 MZVLB512HAJQ, IPS, 1920x1080, 14" | Lenovo ThinkPad T490-20N3S02L00 i7-8565U, GeForce MX250, Toshiba XG5 KXG50ZNV512G, IGZO IPS LED, 1920x1080, 14" | Lenovo ThinkPad T490-20N2004EGE i5-8265U, UHD Graphics 620, Toshiba KXG5AZNV256G, IGZO IPS LED, 1920x1080, 14" | Lenovo ThinkPad A485-20MU000CGE R5 PRO 2500U, Vega 8, Samsung SSD PM981 MZVLB256HAHQ, IPS LED, 1920x1080, 14" | Dell Latitude 7490 i5-8350U, UHD Graphics 620, Toshiba KSG60ZMV256G, IPS, 1920x1080, 14" | HP EliteBook 745 G5 3UN74EA R7 2700U, Vega 10, Toshiba XG5 KXG50ZNV256G, IPS LED, 1920x1080, 14" | Média AMD Radeon RX Vega 8 (Ryzen 2000/3000) | Média da turma Office | |
|---|---|---|---|---|---|---|---|---|
| Power Consumption | -4% | 19% | -10% | 30% | 2% | -6% | -6% | |
| Idle Minimum * (Watt) | 5.1 | 2.16 58% | 2.34 54% | 5.3 -4% | 2 61% | 4.9 4% | 5.68 ? -11% | 4.4 ? 14% |
| Idle Average * (Watt) | 7.7 | 5.04 35% | 5.22 32% | 8.3 -8% | 4.7 39% | 8.1 -5% | 8.75 ? -14% | 7.32 ? 5% |
| Idle Maximum * (Watt) | 10.7 | 8.64 19% | 8.82 18% | 11.4 -7% | 5.7 47% | 10.6 1% | 10.1 ? 6% | 8.56 ? 20% |
| Load Average * (Watt) | 35.8 | 63.2 -77% | 35.8 -0% | 42 -17% | 38.4 -7% | 32.2 10% | 37.8 ? -6% | 42.5 ? -19% |
| Load Maximum * (Watt) | 43.2 | 67.5 -56% | 47.3 -9% | 48.8 -13% | 38.9 10% | 42.3 2% | 46.2 ? -7% | 64.1 ? -48% |
| Witcher 3 ultra * (Watt) | 50 |
* ... menor é melhor
| Lenovo ThinkPad T495-20NKS01Y00 R5 PRO 3500U, Vega 8, 50 Wh | Lenovo ThinkPad T490-20N3S02L00 i7-8565U, GeForce MX250, 50 Wh | Lenovo ThinkPad T490-20N2004EGE i5-8265U, UHD Graphics 620, 50 Wh | Lenovo ThinkPad A485-20MU000CGE R5 PRO 2500U, Vega 8, 48 Wh | Dell Latitude 7490 i5-8350U, UHD Graphics 620, 60 Wh | HP EliteBook 745 G5 3UN74EA R7 2700U, Vega 10, 50 Wh | Média da turma Office | |
|---|---|---|---|---|---|---|---|
| Duração da bateria | -17% | 20% | -41% | 0% | -24% | 25% | |
| H.264 (h) | 11.8 | 8.7 -26% | 11.3 -4% | 6.1 -48% | 7.1 -40% | 15 ? 27% | |
| WiFi v1.3 (h) | 9.1 | 9.1 0% | 9.5 4% | 5.5 -40% | 9.1 0% | 6.6 -27% | 12.9 ? 42% |
| Load (h) | 1.7 | 1.3 -24% | 2.7 59% | 1.1 -35% | 1.6 -6% | 1.807 ? 6% |
Pro
Contra
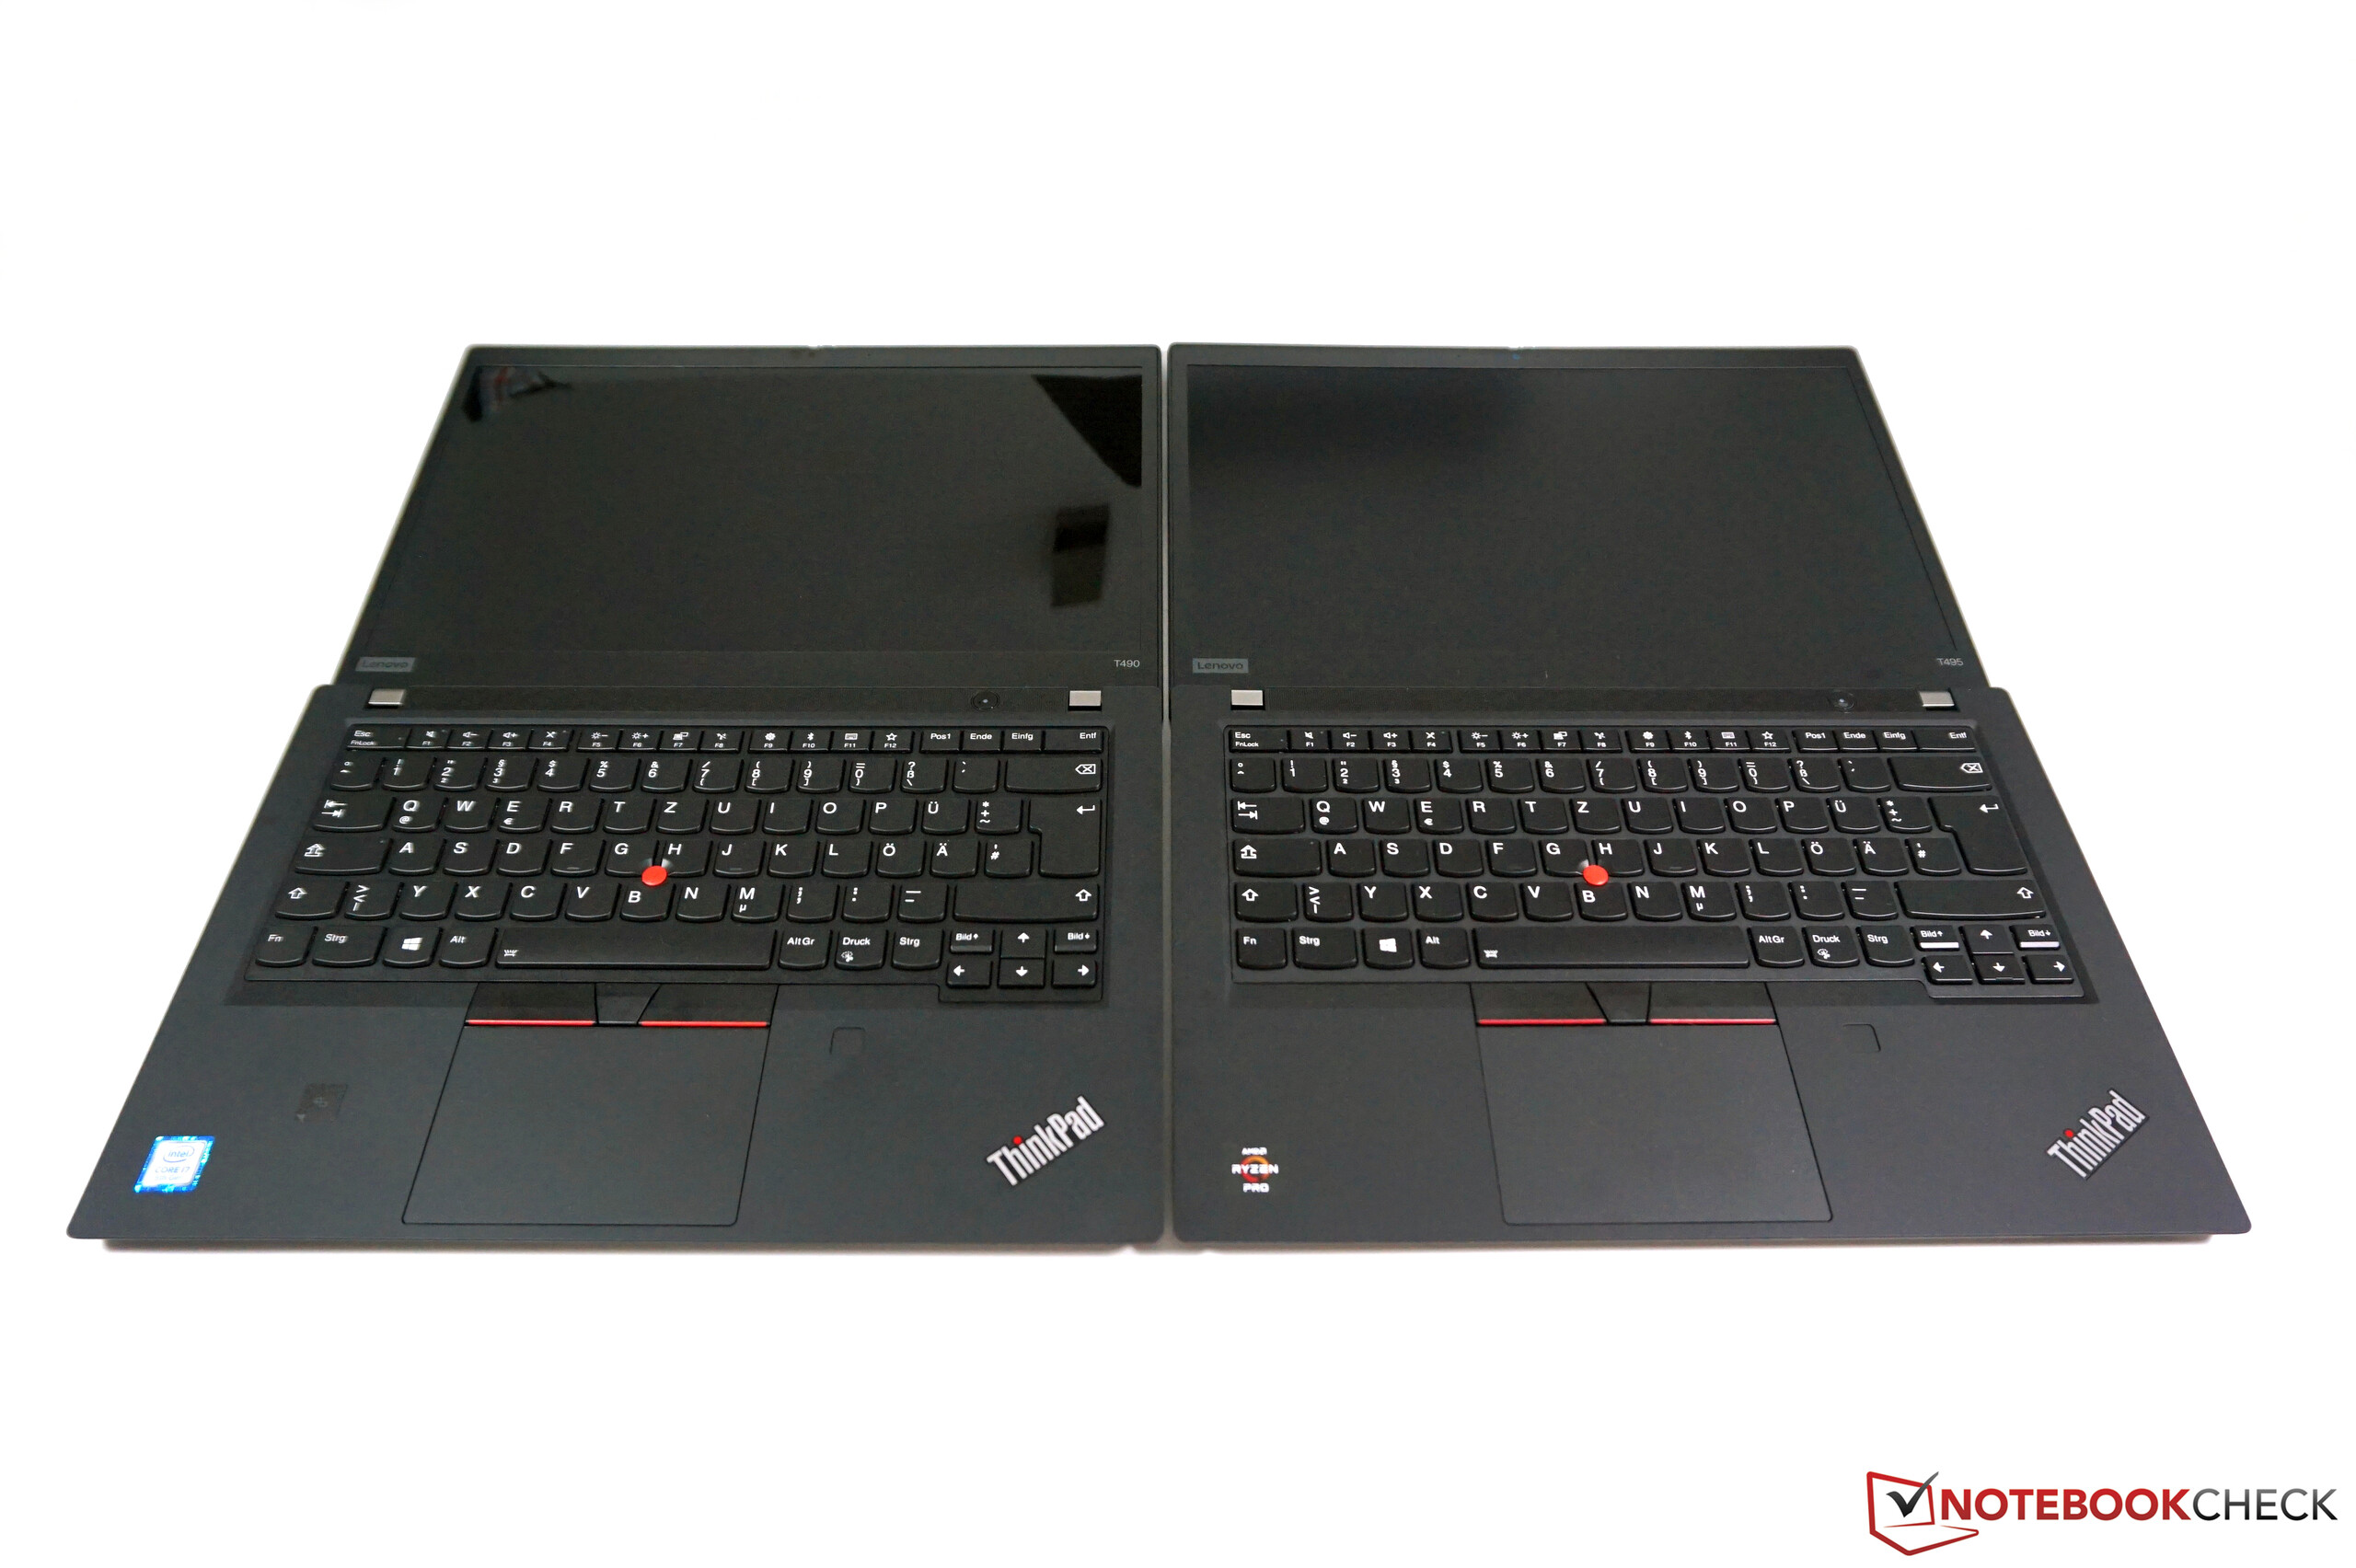
O ThinkPad T495 é o primeiro portátil empresarial equipado com AMD da Lenovo. Ao contrário da série A, ela não vem com um conjunto enorme de compromissos quando comparada aos seus irmãos Intel. A carcaça e a tela são idênticas, exceto pela falta da opção WQHD HDR, e a duração da bateria também está finalmente no mesmo nível.
A única desvantagem real é a falta do Thunderbolt 3 e um desempenho geral da CPU ligeiramente reduzido. Infelizmente, este último parece ser uma restrição artificial imposta pelo fabricante, especialmente considerando que o T490 equipado com Intel pode consumir mais energia. No entanto, o quad-core do T495 permanece poderoso e rápido o suficiente, especialmente para um portátil de escritório.
Excelente tela, bateria de longa duração e bom desempenho. Dado o seu preço mais baixo, o ThinkPad T495 é uma ótima alternativa ao ThinkPad T490 equipado com Intel. A única desvantagem real é a porta Thunderbolt 3 ausente. Se isso é importante para você ou não, depende de como você pretende usá-lo, mas definitivamente não é obrigatório para um portátil de escritório.
Também gostamos muito da tela FHD LowPower. Com seu painel brilhante de alto contraste e sua alta precisão de cores, de fábrica, é muito adequado para edição de fotos no espaço de cores sRGB. Também consideramos o FHD uma resolução suficientemente alta para um painel de 14 polegadas e ajuda a minimizar os problemas de dimensionamento.
No geral, temos que admitir que o ThinkPad T495 é o melhor T490, especialmente considerando seu preço mais baixo.
Observe que recentemente atualizamos nosso sistema de pontuação, Veja mais detalhes aqui. Com o novo sistema de pontuação V7, o ThinkPad T495 obteve 89%. Com o antigo sistema de pontuação V6, ele teria marcado 90%.
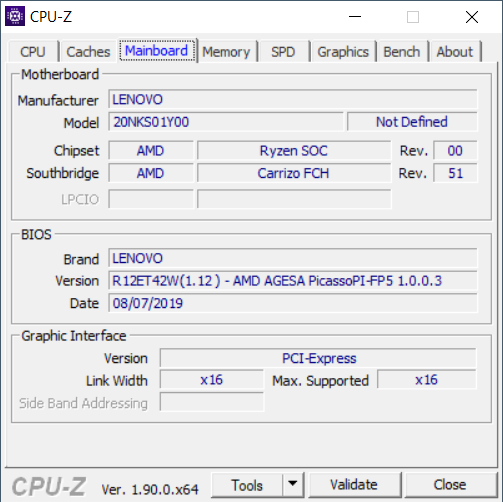
Lenovo ThinkPad T495-20NKS01Y00
- 09/12/2019 v7 (old)
Andreas Osthoff
Price comparison
