Breve Análise do Portátil Lenovo ThinkPad E580 (i5-8250U, UHD 620, SSD)

| SD Card Reader | |
| average JPG Copy Test (av. of 3 runs) | |
| Schenker Slim 15 L17 (Toshiba Exceria Pro SDXC 64 GB UHS-II) | |
| HP ProBook 450 G5-2UB53EA (Toshiba Exceria Pro SDXC 64 GB UHS-II) | |
| Lenovo ThinkPad E580-20KSCTO1WW (Toshiba Exceria Pro M501) | |
| Lenovo ThinkPad E580-20KS001RGE (Toshiba Exceria Pro SDXC 64 GB UHS-II) | |
| Média da turma Office (19.8 - 198.5, n=22, últimos 2 anos) | |
| Acer TravelMate P2510-M-51ZQ (Toshiba Exceria Pro SDXC 64 GB UHS-II) | |
| Dell Vostro 15 3568 (Toshiba Exceria Pro SDXC 64 GB UHS-II) | |
| maximum AS SSD Seq Read Test (1GB) | |
| HP ProBook 450 G5-2UB53EA (Toshiba Exceria Pro SDXC 64 GB UHS-II) | |
| Lenovo ThinkPad E580-20KSCTO1WW (Toshiba Exceria Pro M501) | |
| Schenker Slim 15 L17 (Toshiba Exceria Pro SDXC 64 GB UHS-II) | |
| Lenovo ThinkPad E580-20KS001RGE (Toshiba Exceria Pro SDXC 64 GB UHS-II) | |
| Média da turma Office (27.4 - 249, n=21, últimos 2 anos) | |
| Acer TravelMate P2510-M-51ZQ (Toshiba Exceria Pro SDXC 64 GB UHS-II) | |
| Dell Vostro 15 3568 (Toshiba Exceria Pro SDXC 64 GB UHS-II) | |
| Networking | |
| iperf3 transmit AX12 | |
| Acer TravelMate P2510-M-51ZQ | |
| Lenovo ThinkPad E570-20H6S02M00 | |
| Schenker Slim 15 L17 | |
| HP ProBook 450 G5-2UB53EA | |
| Lenovo ThinkPad E580-20KS001RGE | |
| Dell Vostro 15 3568 | |
| Lenovo ThinkPad E580-20KSCTO1WW | |
| iperf3 receive AX12 | |
| HP ProBook 450 G5-2UB53EA | |
| Schenker Slim 15 L17 | |
| Acer TravelMate P2510-M-51ZQ | |
| Lenovo ThinkPad E570-20H6S02M00 | |
| Dell Vostro 15 3568 | |
| Lenovo ThinkPad E580-20KSCTO1WW | |
| Lenovo ThinkPad E580-20KS001RGE | |
| |||||||||||||||||||||||||
iluminação: 84 %
iluminação com acumulador: 291 cd/m²
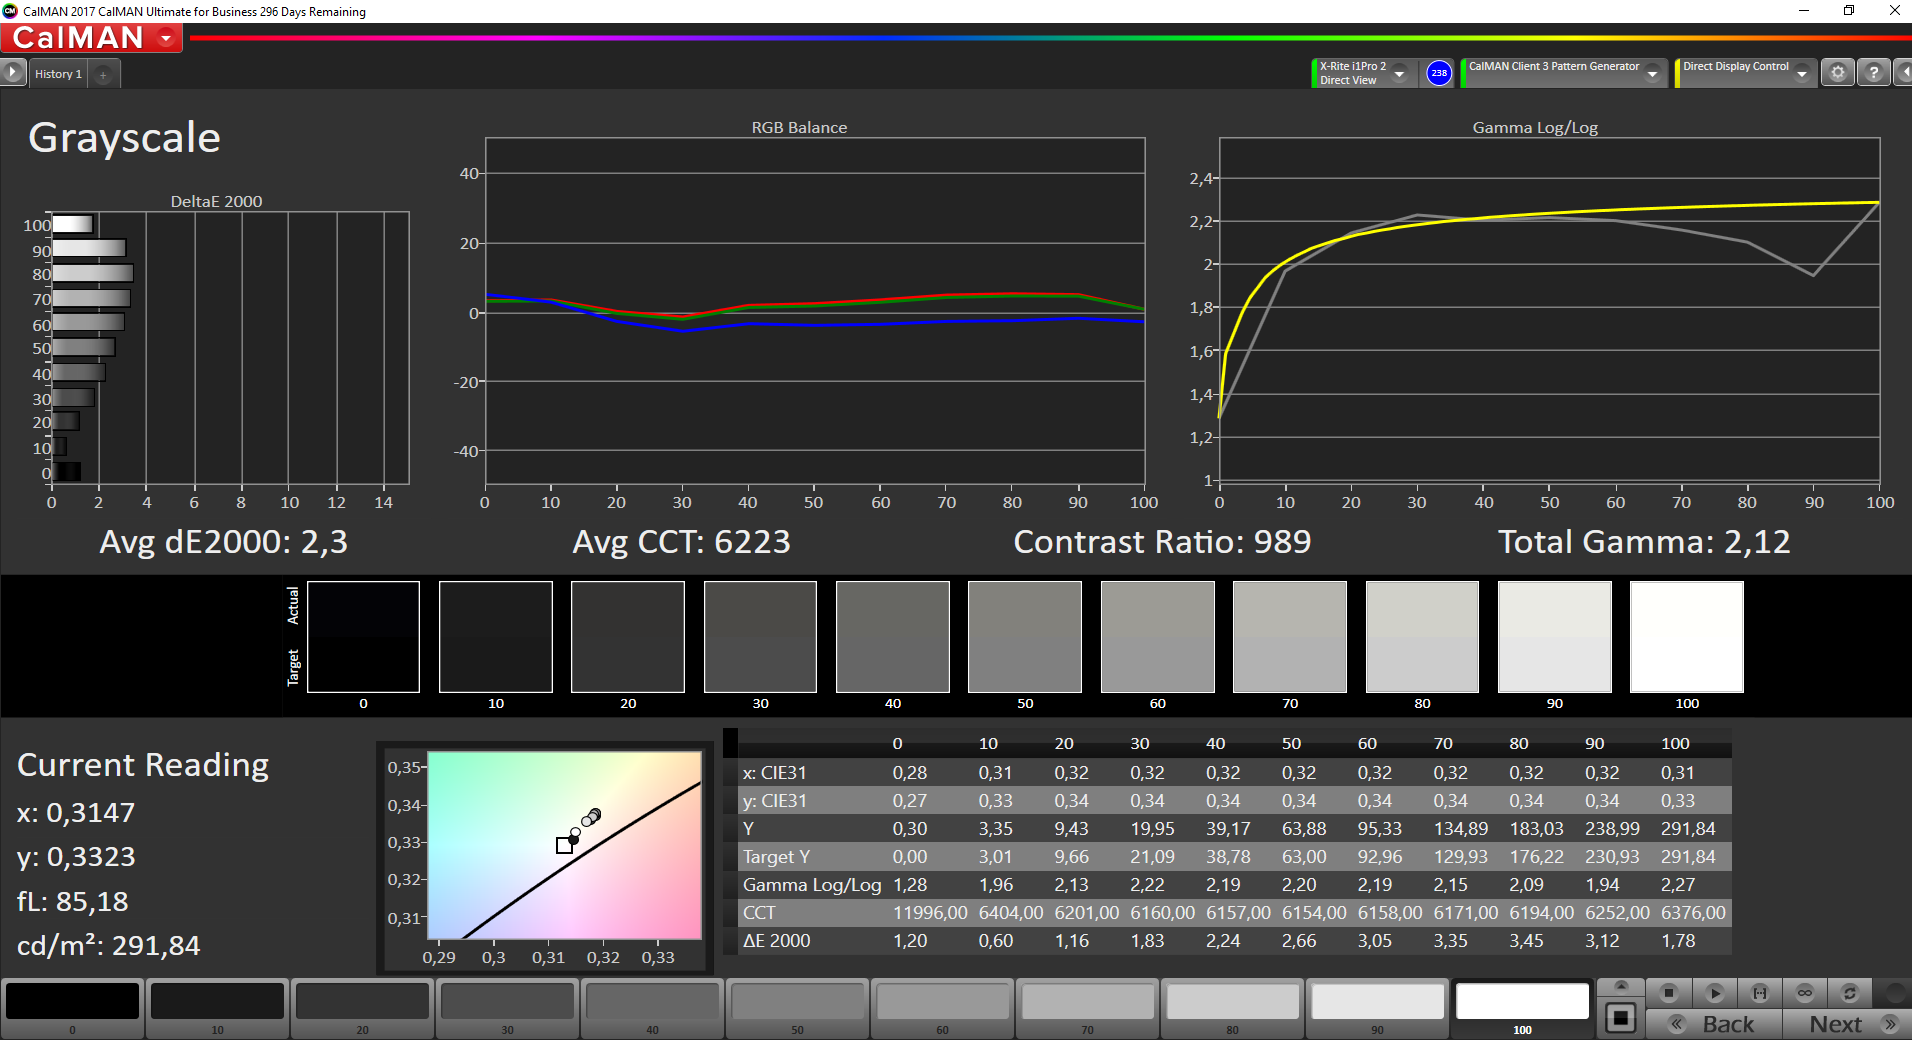
Contraste: 973:1 (Preto: 0.3 cd/m²)
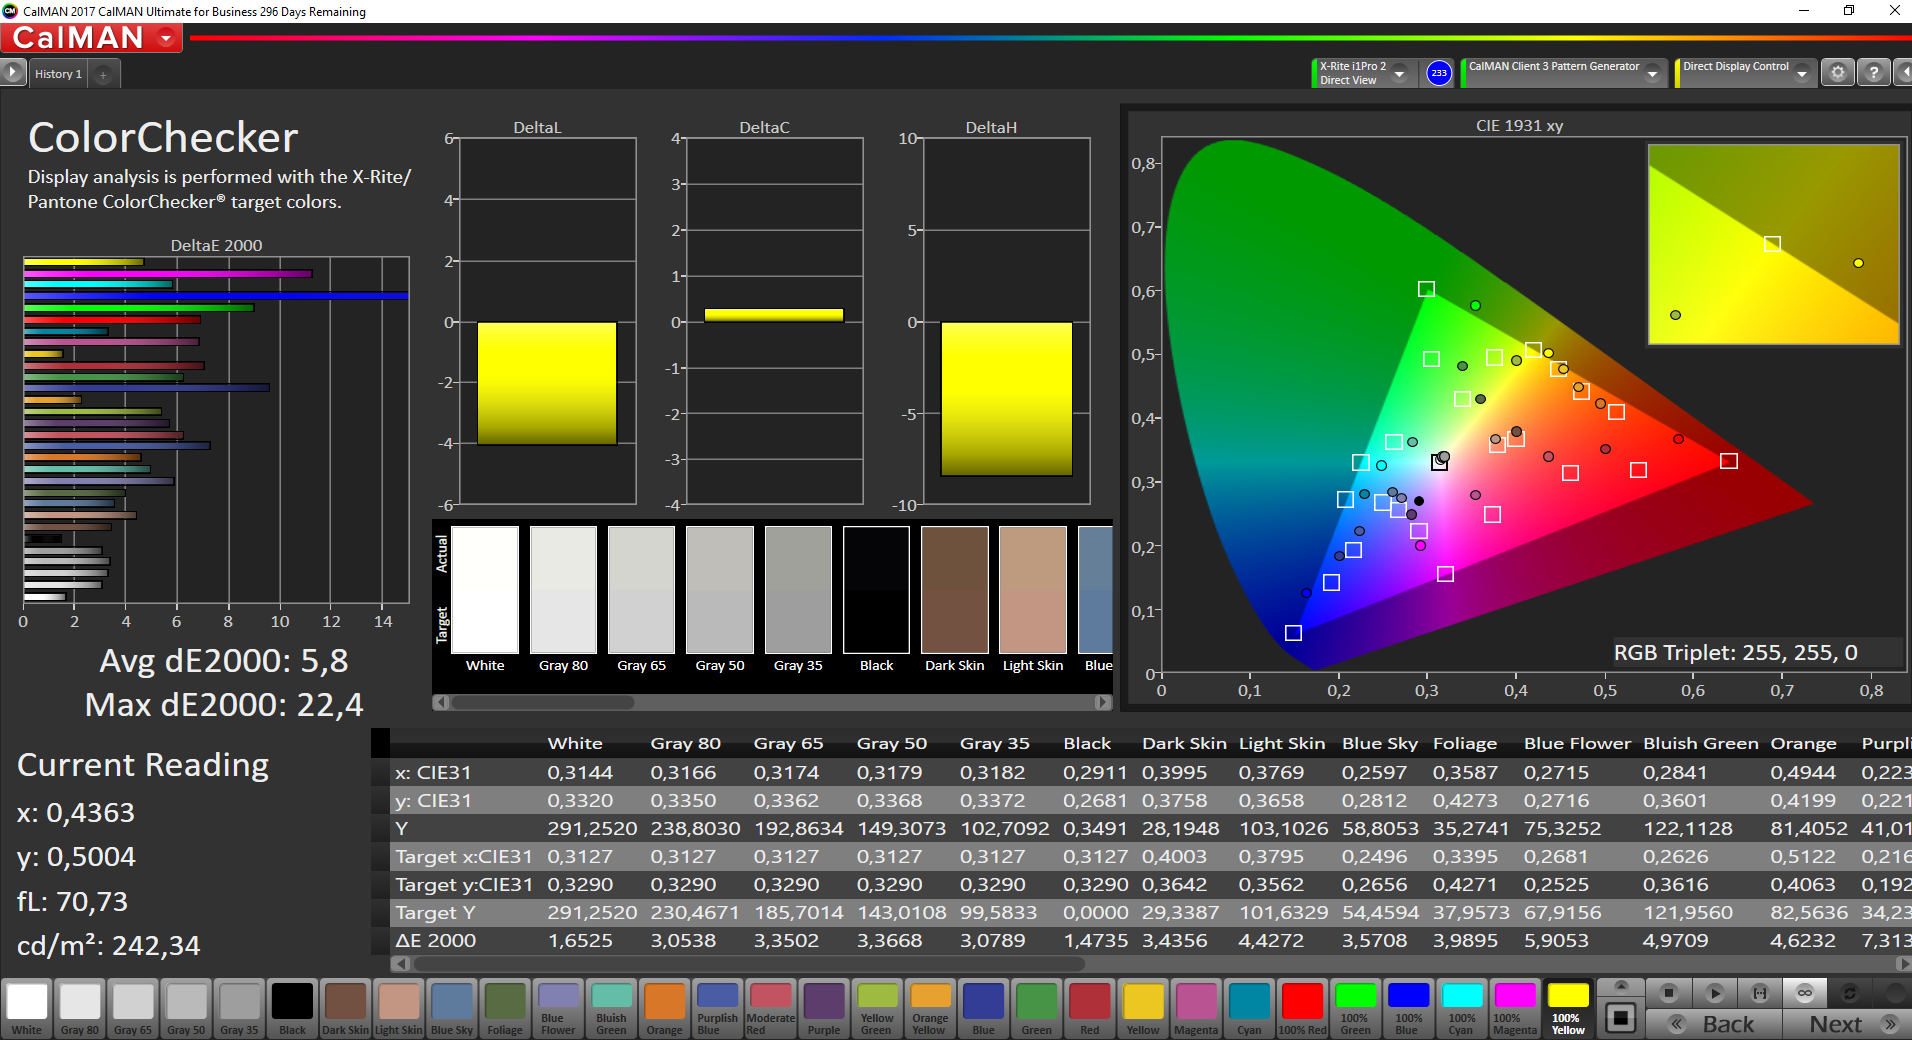
ΔE ColorChecker Calman: 5.8 | ∀{0.5-29.43 Ø4.71}
ΔE Greyscale Calman: 2.3 | ∀{0.09-98 Ø4.96}
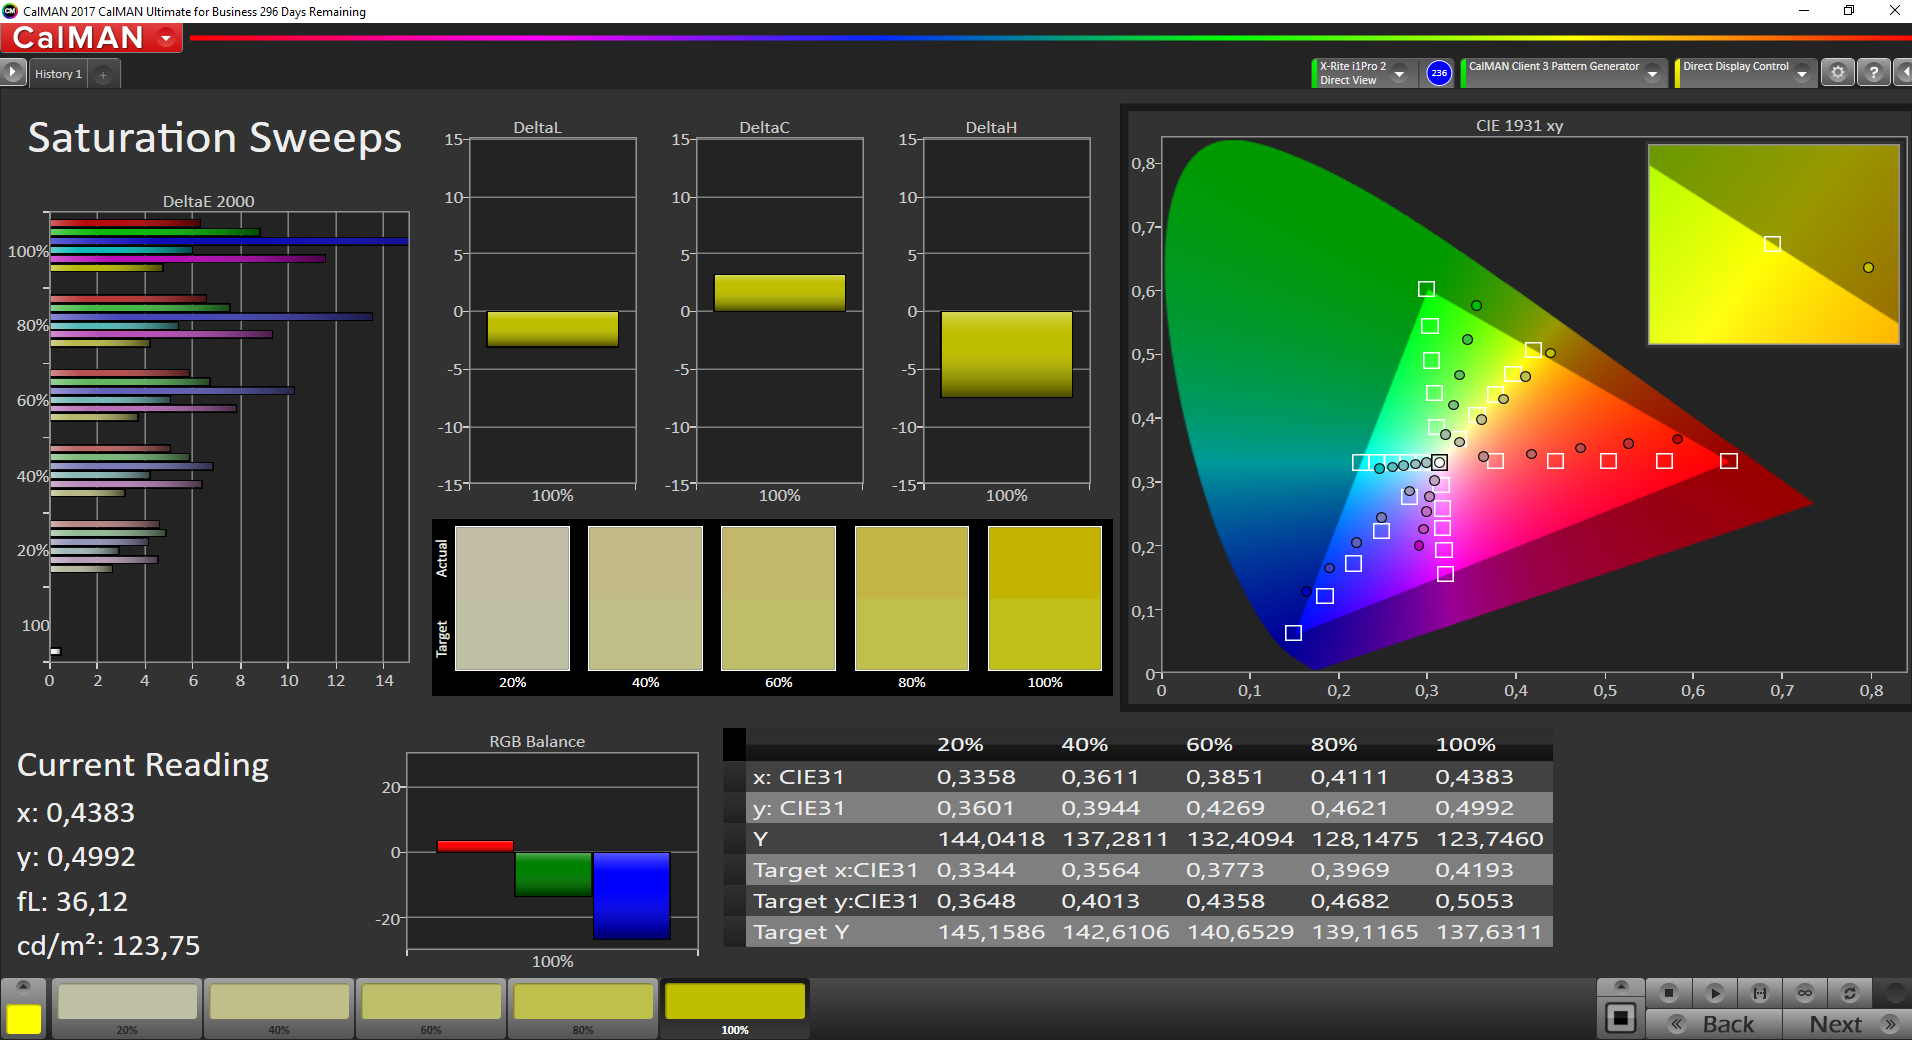
58% sRGB (Argyll 1.6.3 3D)
37.6% AdobeRGB 1998 (Argyll 1.6.3 3D)
41.15% AdobeRGB 1998 (Argyll 3D)
58.5% sRGB (Argyll 3D)
39.83% Display P3 (Argyll 3D)
Gamma: 2.12
CCT: 6223 K
| Lenovo ThinkPad E580-20KSCTO1WW BOE NV156FHM-N49, , 1920x1080, 15.6" | Lenovo ThinkPad E580-20KS001RGE BOE NV156FHM-N49, , 1920x1080, 15.6" | Lenovo ThinkPad E570-20H6S02M00 Lenovo NT156WHM-N42, , 1366x768, 15.6" | HP ProBook 450 G5-2UB53EA AUO41ED, , 1920x1080, 15.6" | Acer TravelMate P2510-M-51ZQ Chi Mei CMN15D3 / N156HCE-EAA, , 1920x1080, 15.6" | Schenker Slim 15 L17 LG LP156WF6, , 1920x1080, 15.6" | Dell Vostro 15 3568 BOE0690 / NT15N41 / Dell C1JFR, , 1920x1080, 15.6" | |
|---|---|---|---|---|---|---|---|
| Display | -0% | -7% | -3% | 7% | 50% | -0% | |
| Display P3 Coverage (%) | 39.83 | 40 0% | 36.79 -8% | 38.04 -4% | 42.44 7% | 63.9 60% | 39.39 -1% |
| sRGB Coverage (%) | 58.5 | 58.2 -1% | 55.4 -5% | 57.3 -2% | 63.2 8% | 82.8 42% | 59.3 1% |
| AdobeRGB 1998 Coverage (%) | 41.15 | 41.32 0% | 38.01 -8% | 39.31 -4% | 43.94 7% | 60.5 47% | 40.69 -1% |
| Response Times | 8% | 35% | -2% | 11% | 20% | 45% | |
| Response Time Grey 50% / Grey 80% * (ms) | 48.4 ? | 48 ? 1% | 46 ? 5% | 52.4 ? -8% | 45 ? 7% | 40 ? 17% | 39 ? 19% |
| Response Time Black / White * (ms) | 37.6 ? | 32 ? 15% | 13 ? 65% | 36 ? 4% | 32 ? 15% | 29.2 ? 22% | 11 ? 71% |
| PWM Frequency (Hz) | 22030 ? | 25000 ? | 200 ? | 25000 ? | 20660 ? | 28410 ? | |
| Screen | 13% | -76% | -18% | -11% | 17% | -74% | |
| Brightness middle (cd/m²) | 292 | 290 -1% | 242 -17% | 252 -14% | 215 -26% | 333 14% | 195 -33% |
| Brightness (cd/m²) | 272 | 267 -2% | 233 -14% | 249 -8% | 198 -27% | 336 24% | 195 -28% |
| Brightness Distribution (%) | 84 | 81 -4% | 73 -13% | 88 5% | 78 -7% | 93 11% | 89 6% |
| Black Level * (cd/m²) | 0.3 | 0.19 37% | 0.59 -97% | 0.22 27% | 0.32 -7% | 0.3 -0% | 0.44 -47% |
| Contrast (:1) | 973 | 1526 57% | 410 -58% | 1145 18% | 672 -31% | 1110 14% | 443 -54% |
| Colorchecker dE 2000 * | 5.8 | 4.9 16% | 10.9 -88% | 6.9 -19% | 5.15 11% | 4.7 19% | 12.23 -111% |
| Colorchecker dE 2000 max. * | 22.4 | 9.52 57% | 20.84 7% | 18.4 18% | 10.89 51% | 9.7 57% | 20.85 7% |
| Greyscale dE 2000 * | 2.3 | 2.92 -27% | 13.07 -468% | 6.9 -200% | 4.25 -85% | 3.5 -52% | 13.39 -482% |
| Gamma | 2.12 104% | 2.31 95% | 2.37 93% | 2.43 91% | 2.61 84% | 2.26 97% | 2.5 88% |
| CCT | 6223 104% | 6091 107% | 13123 50% | 7524 86% | 6603 98% | 6339 103% | 15759 41% |
| Color Space (Percent of AdobeRGB 1998) (%) | 37.6 | 37 -2% | 35 -7% | 36.3 -3% | 40 6% | 54.2 44% | 38 1% |
| Color Space (Percent of sRGB) (%) | 58 | 58 0% | 55 -5% | 57.2 -1% | 63 9% | 82.7 43% | 59 2% |
| Média Total (Programa/Configurações) | 7% /
10% | -16% /
-47% | -8% /
-13% | 2% /
-4% | 29% /
24% | -10% /
-43% |
* ... menor é melhor


Exibir tempos de resposta
| ↔ Tempo de resposta preto para branco | ||
|---|---|---|
| 37.6 ms ... ascensão ↗ e queda ↘ combinadas | ↗ 21.2 ms ascensão | 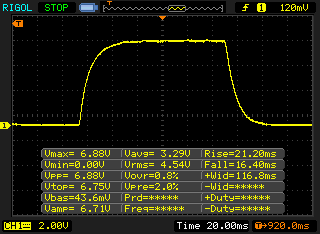 |
| ↘ 16.4 ms queda | ||
| A tela mostra taxas de resposta lentas em nossos testes e será insatisfatória para os jogadores. Em comparação, todos os dispositivos testados variam de 0.1 (mínimo) a 240 (máximo) ms. » 95 % de todos os dispositivos são melhores. Isso significa que o tempo de resposta medido é pior que a média de todos os dispositivos testados (19.8 ms). | ||
| ↔ Tempo de resposta 50% cinza a 80% cinza | ||
| 48.4 ms ... ascensão ↗ e queda ↘ combinadas | ↗ 25.6 ms ascensão | 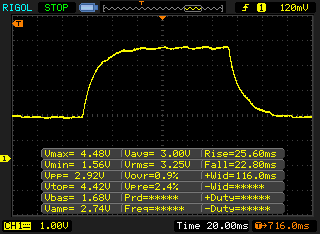 |
| ↘ 22.8 ms queda | ||
| A tela mostra taxas de resposta lentas em nossos testes e será insatisfatória para os jogadores. Em comparação, todos os dispositivos testados variam de 0.165 (mínimo) a 636 (máximo) ms. » 84 % de todos os dispositivos são melhores. Isso significa que o tempo de resposta medido é pior que a média de todos os dispositivos testados (31 ms). | ||
Cintilação da tela / PWM (modulação por largura de pulso)
| Tela tremeluzindo/PWM detectado | 22030 Hz | ≤ 99 % configuração de brilho | 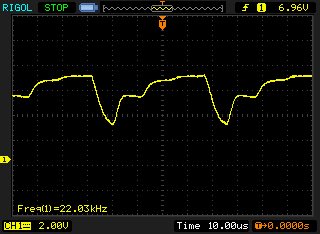 |
A luz de fundo da tela pisca em 22030 Hz (pior caso, por exemplo, utilizando PWM) Cintilação detectada em uma configuração de brilho de 99 % e abaixo. Não deve haver cintilação ou PWM acima desta configuração de brilho. A frequência de 22030 Hz é bastante alta, então a maioria dos usuários sensíveis ao PWM não deve notar nenhuma oscilação. [pwm_comparison] Em comparação: 52 % de todos os dispositivos testados não usam PWM para escurecer a tela. Se PWM foi detectado, uma média de 7754 (mínimo: 5 - máximo: 343500) Hz foi medida. | |||
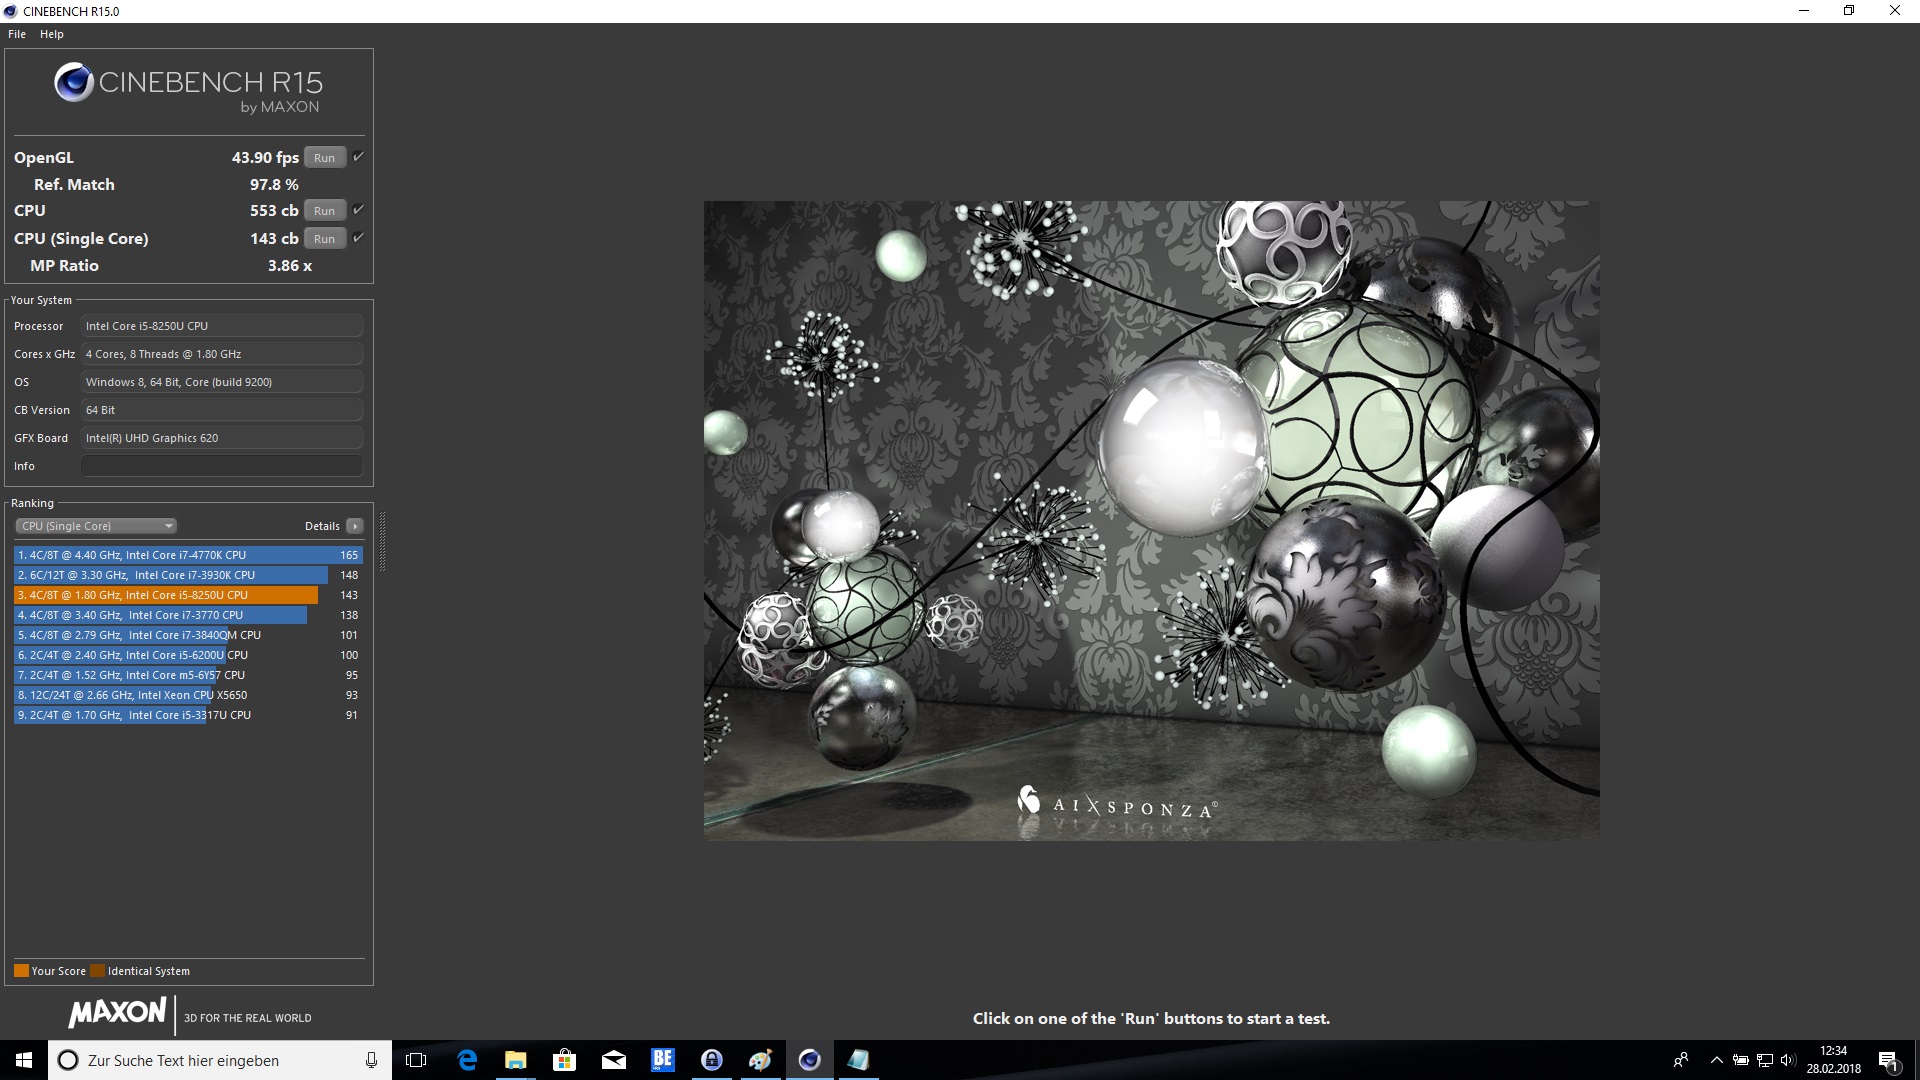
| Cinebench R11.5 | |
| CPU Single 64Bit | |
| Média da turma Office (2 - 3.6, n=14, últimos 2 anos) | |
| Schenker Slim 15 L17 | |
| Lenovo ThinkPad E580-20KSCTO1WW | |
| Média Intel Core i5-8250U (0.91 - 1.79, n=35) | |
| Lenovo ThinkPad E570-20H6S02M00 | |
| CPU Multi 64Bit | |
| Média da turma Office (9.76 - 31.5, n=14, últimos 2 anos) | |
| Média Intel Core i5-8250U (3.15 - 7.76, n=35) | |
| Lenovo ThinkPad E580-20KSCTO1WW | |
| Schenker Slim 15 L17 | |
| Lenovo ThinkPad E570-20H6S02M00 | |
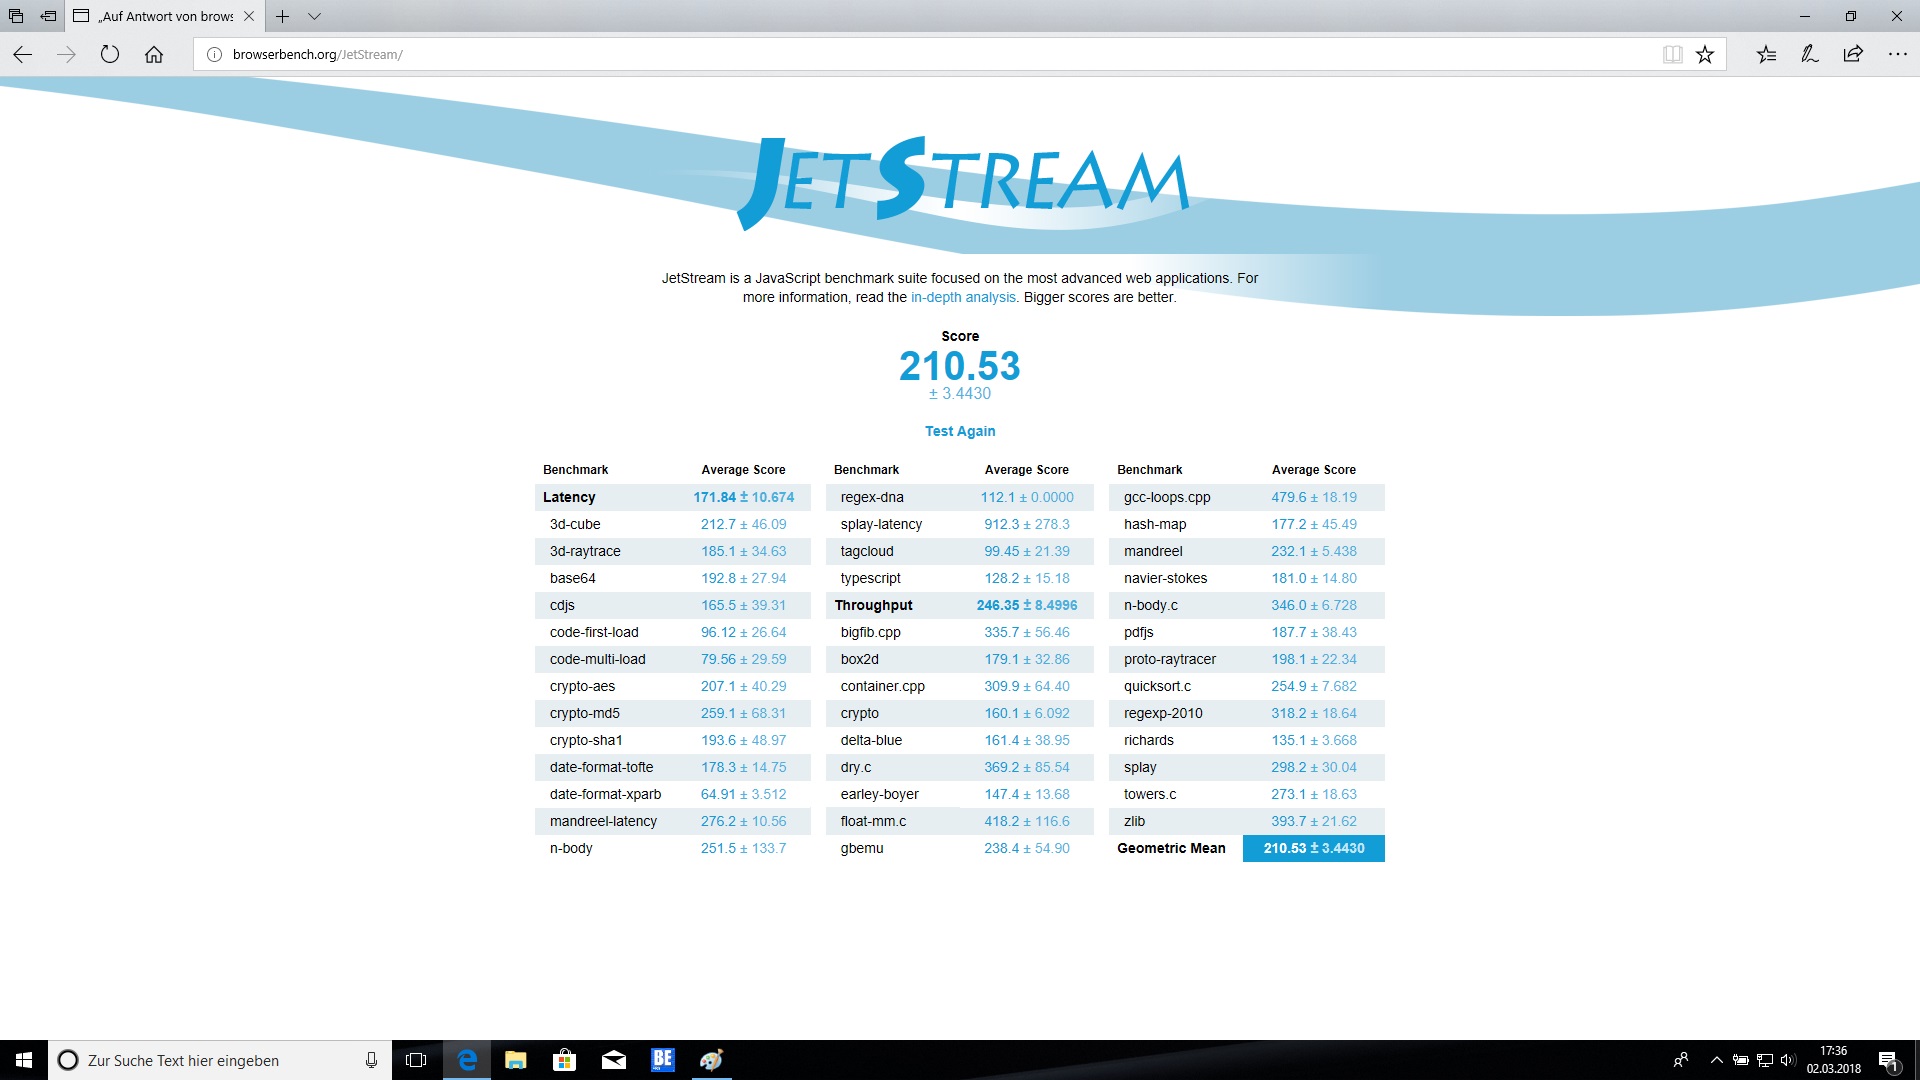
| JetStream 1.1 - 1.1 Total | |
| Lenovo ThinkPad E580-20KS001RGE | |
| Schenker Slim 15 L17 | |
| HP ProBook 450 G5-2UB53EA | |
| Média Intel Core i5-8250U (151.5 - 256, n=78) | |
| Lenovo ThinkPad E570-20H6S02M00 | |
| Lenovo ThinkPad E580-20KSCTO1WW | |
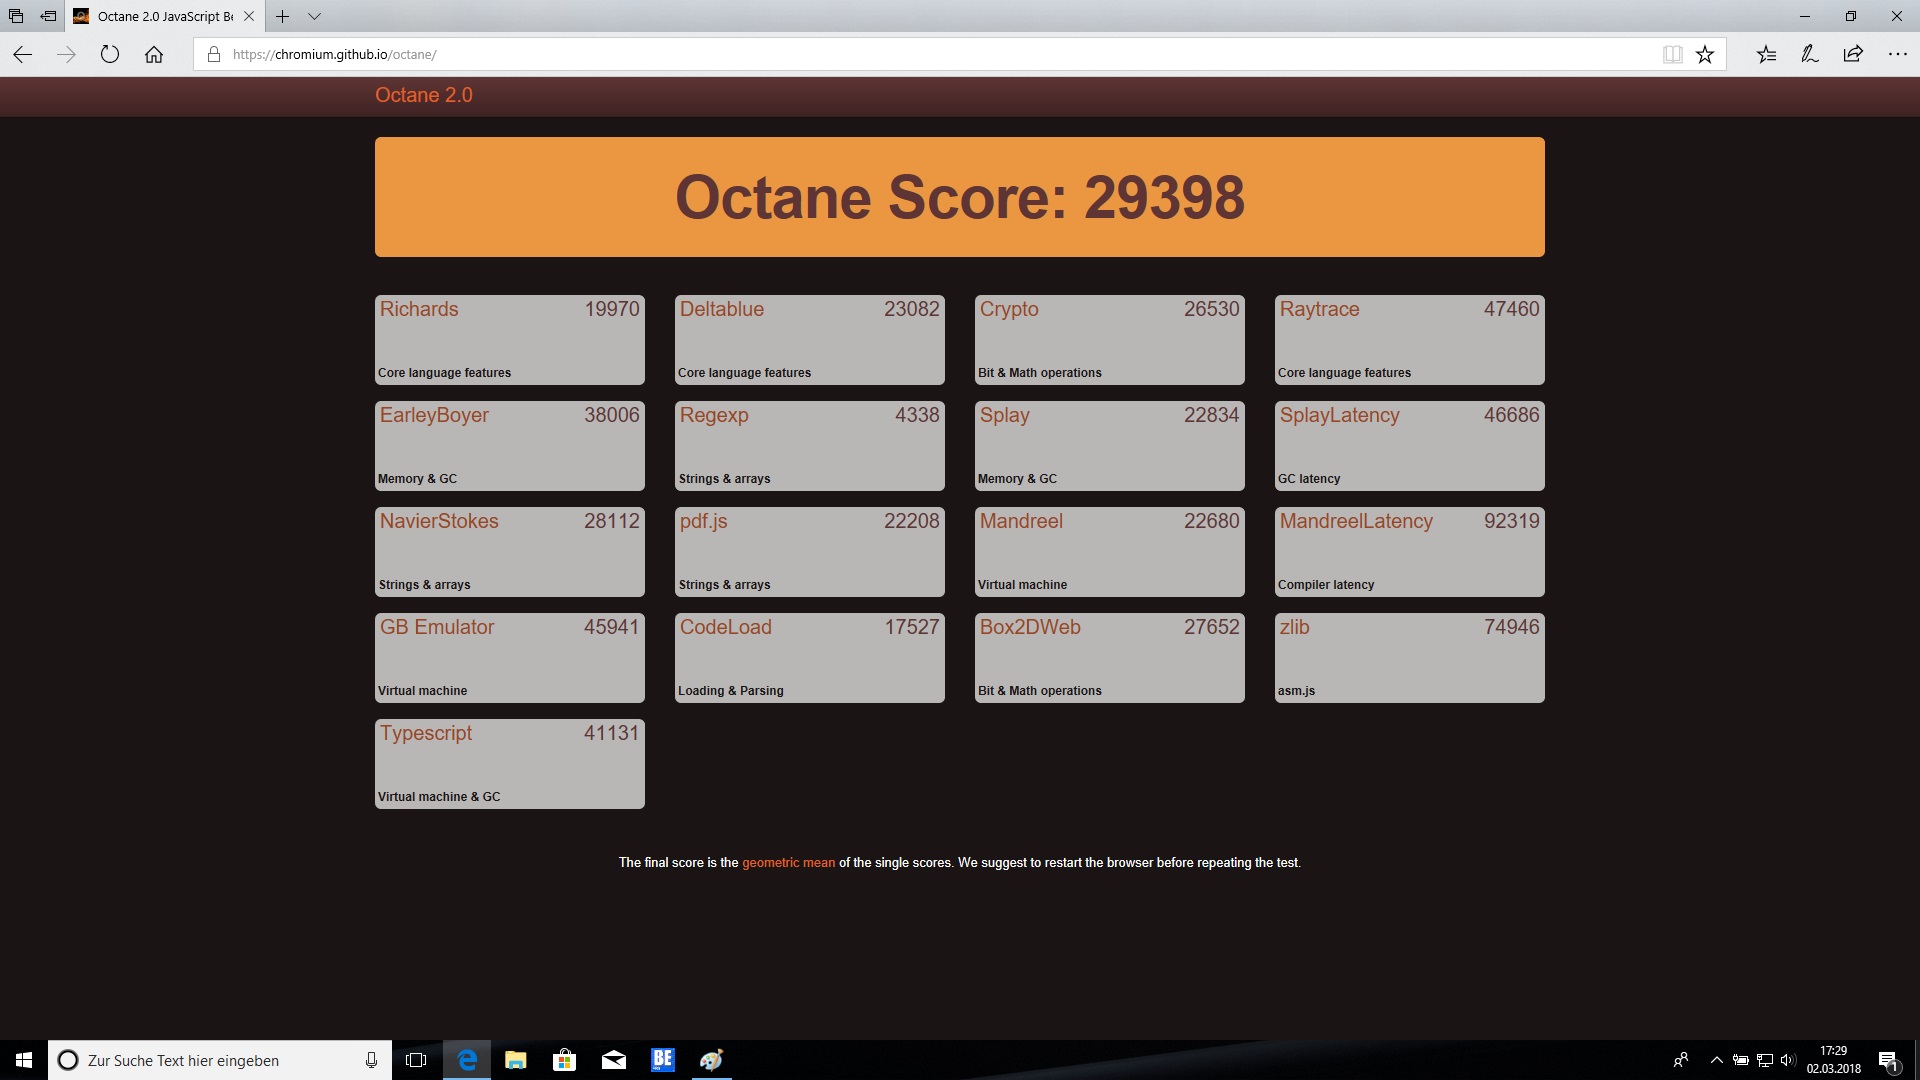
| Octane V2 - Total Score | |
| Média da turma Office (49011 - 126830, n=20, últimos 2 anos) | |
| Schenker Slim 15 L17 | |
| Lenovo ThinkPad E580-20KS001RGE | |
| Média Intel Core i5-8250U (22772 - 35817, n=54) | |
| Lenovo ThinkPad E580-20KSCTO1WW | |
| Lenovo ThinkPad E570-20H6S02M00 | |
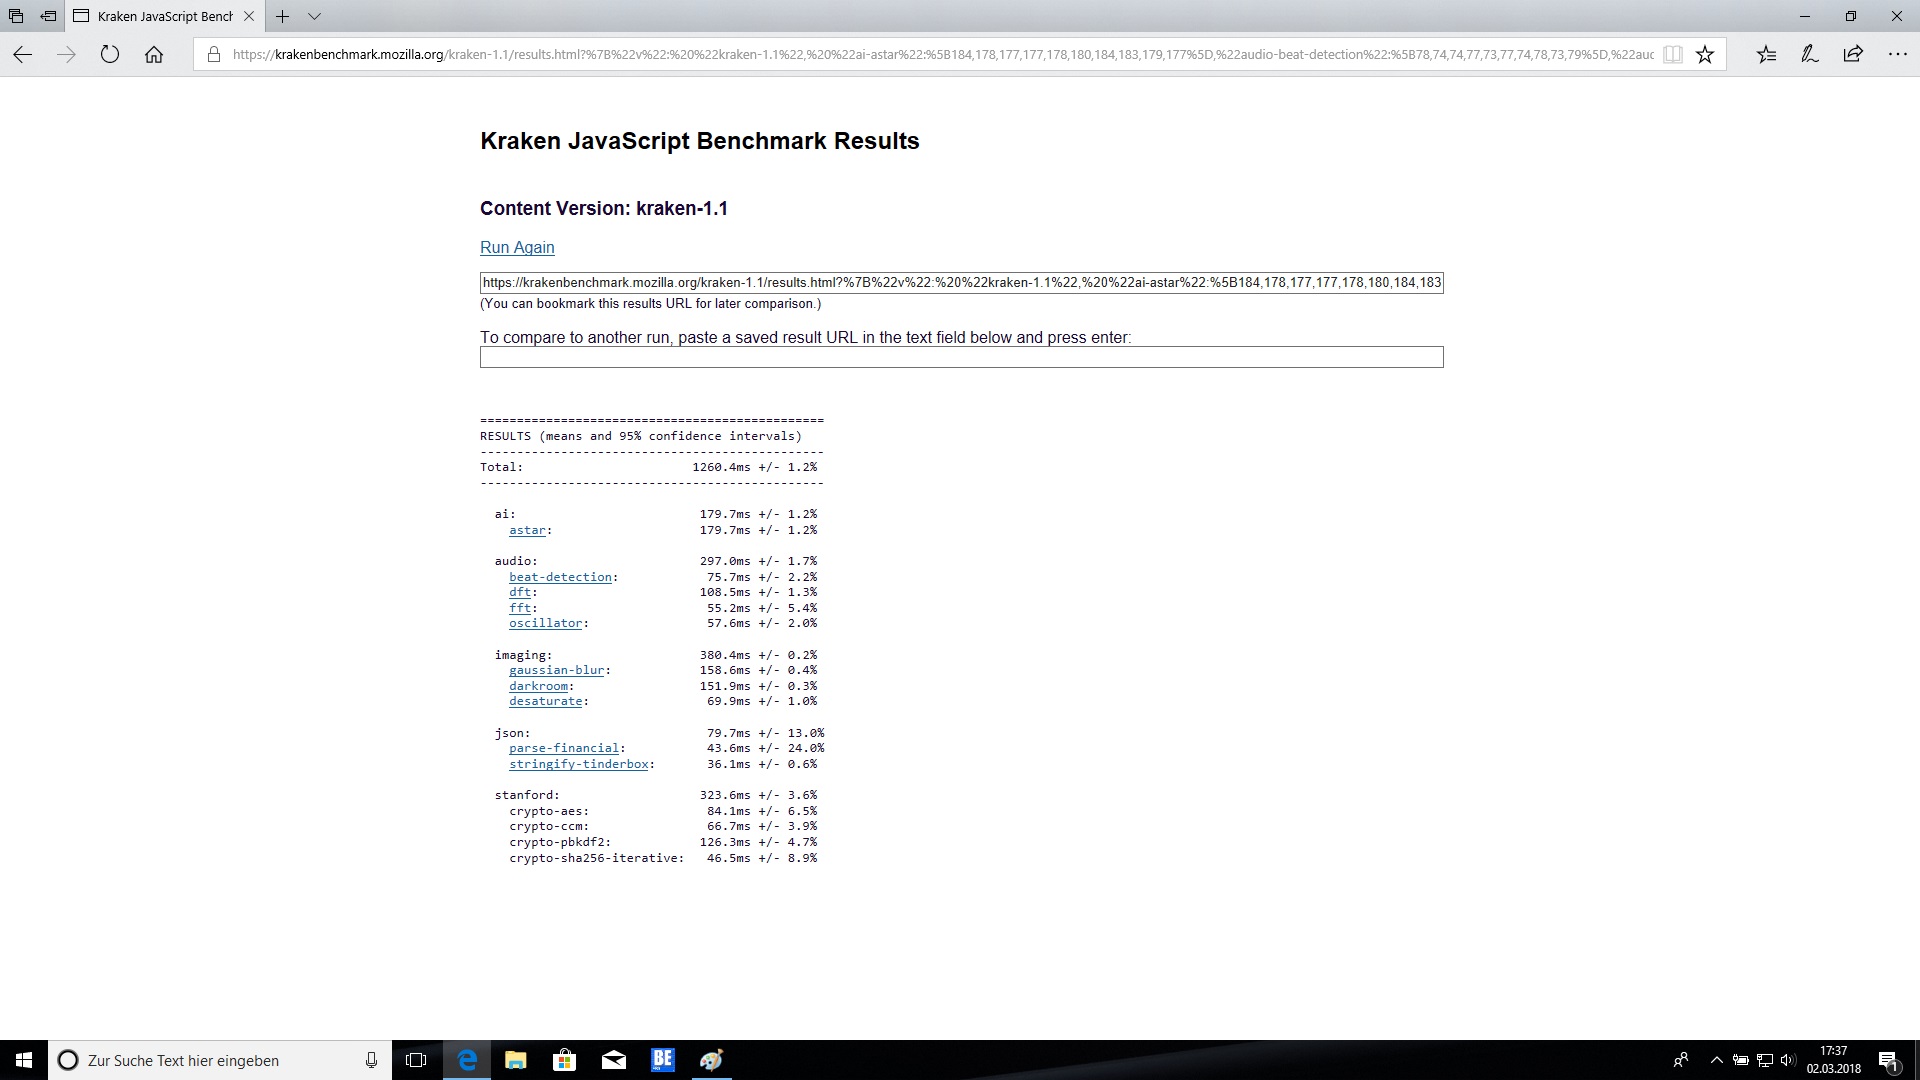
| Mozilla Kraken 1.1 - Total | |
| Lenovo ThinkPad E580-20KSCTO1WW | |
| Média Intel Core i5-8250U (986 - 1532, n=59) | |
| Lenovo ThinkPad E570-20H6S02M00 | |
| Schenker Slim 15 L17 | |
| Lenovo ThinkPad E580-20KS001RGE | |
| Média da turma Office (391 - 1297, n=78, últimos 2 anos) | |
* ... menor é melhor
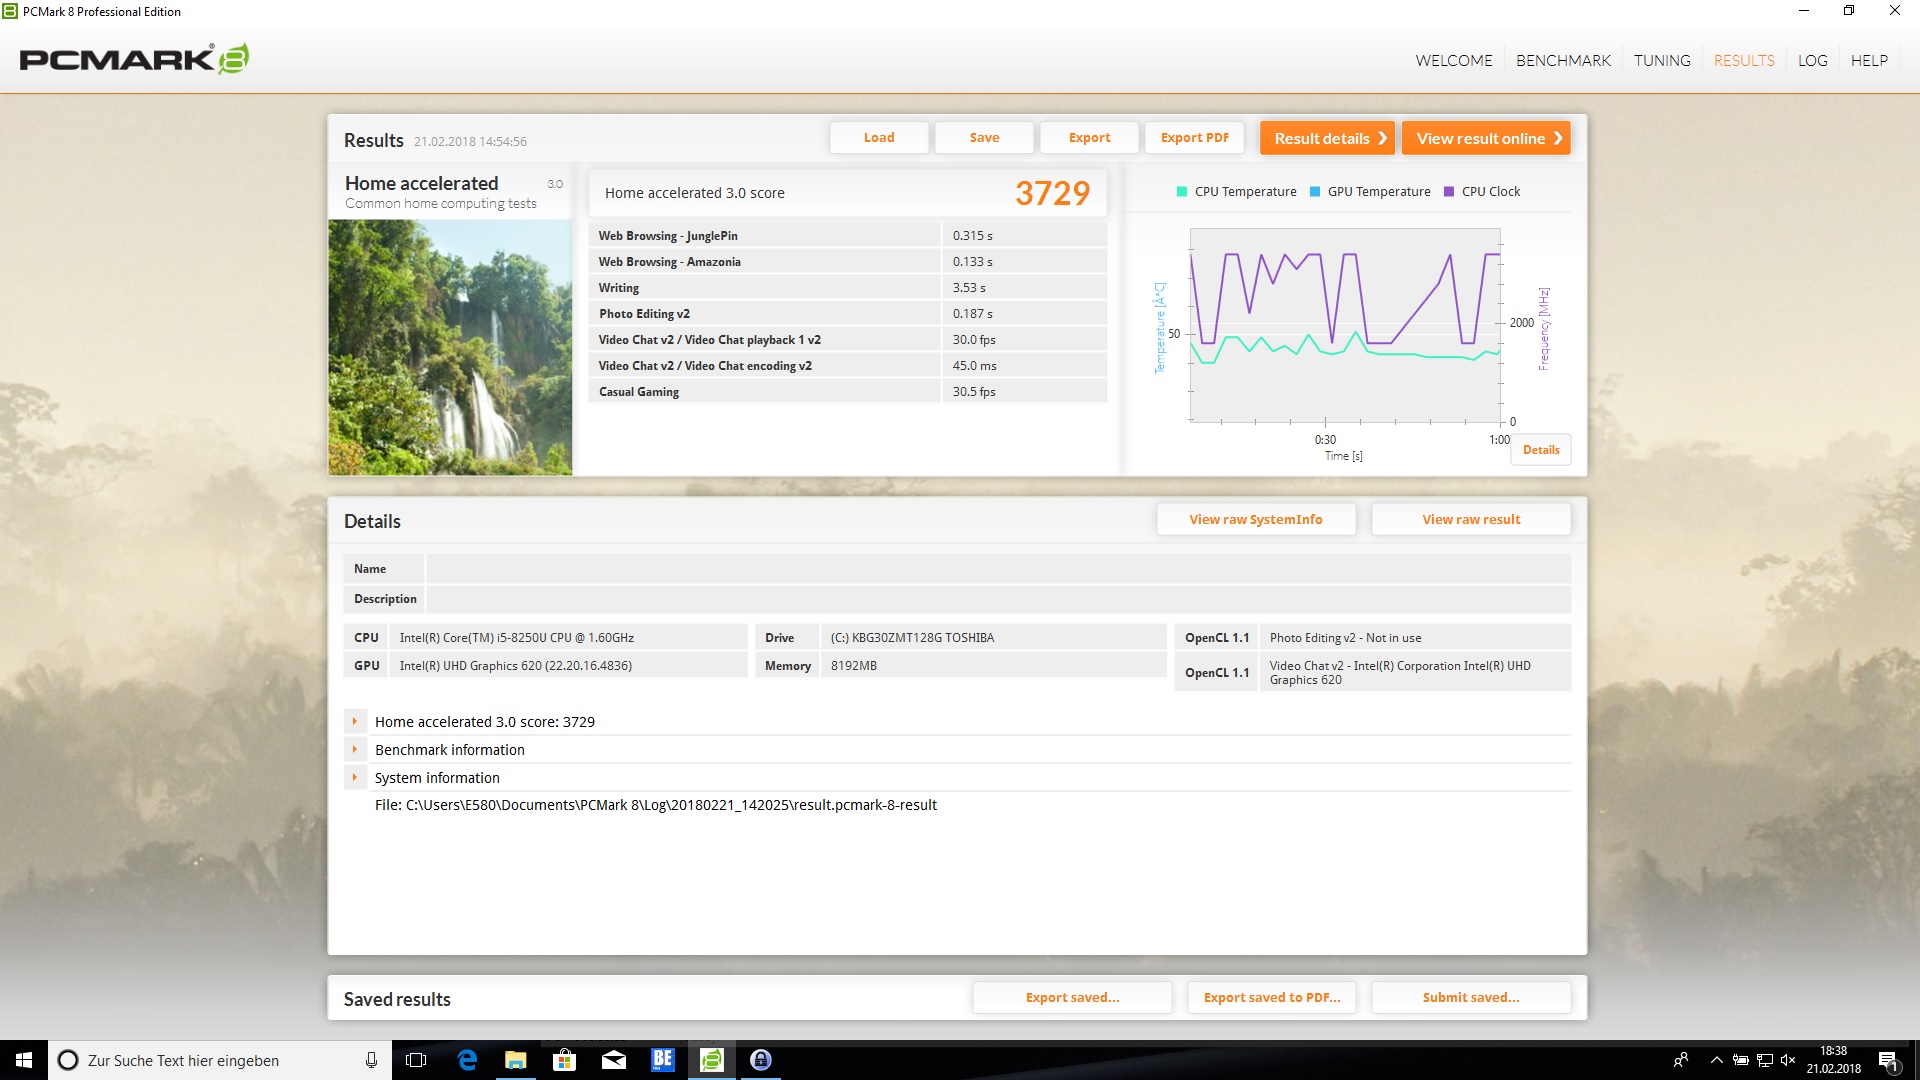
| PCMark 8 Home Score Accelerated v2 | 3729 pontos | |
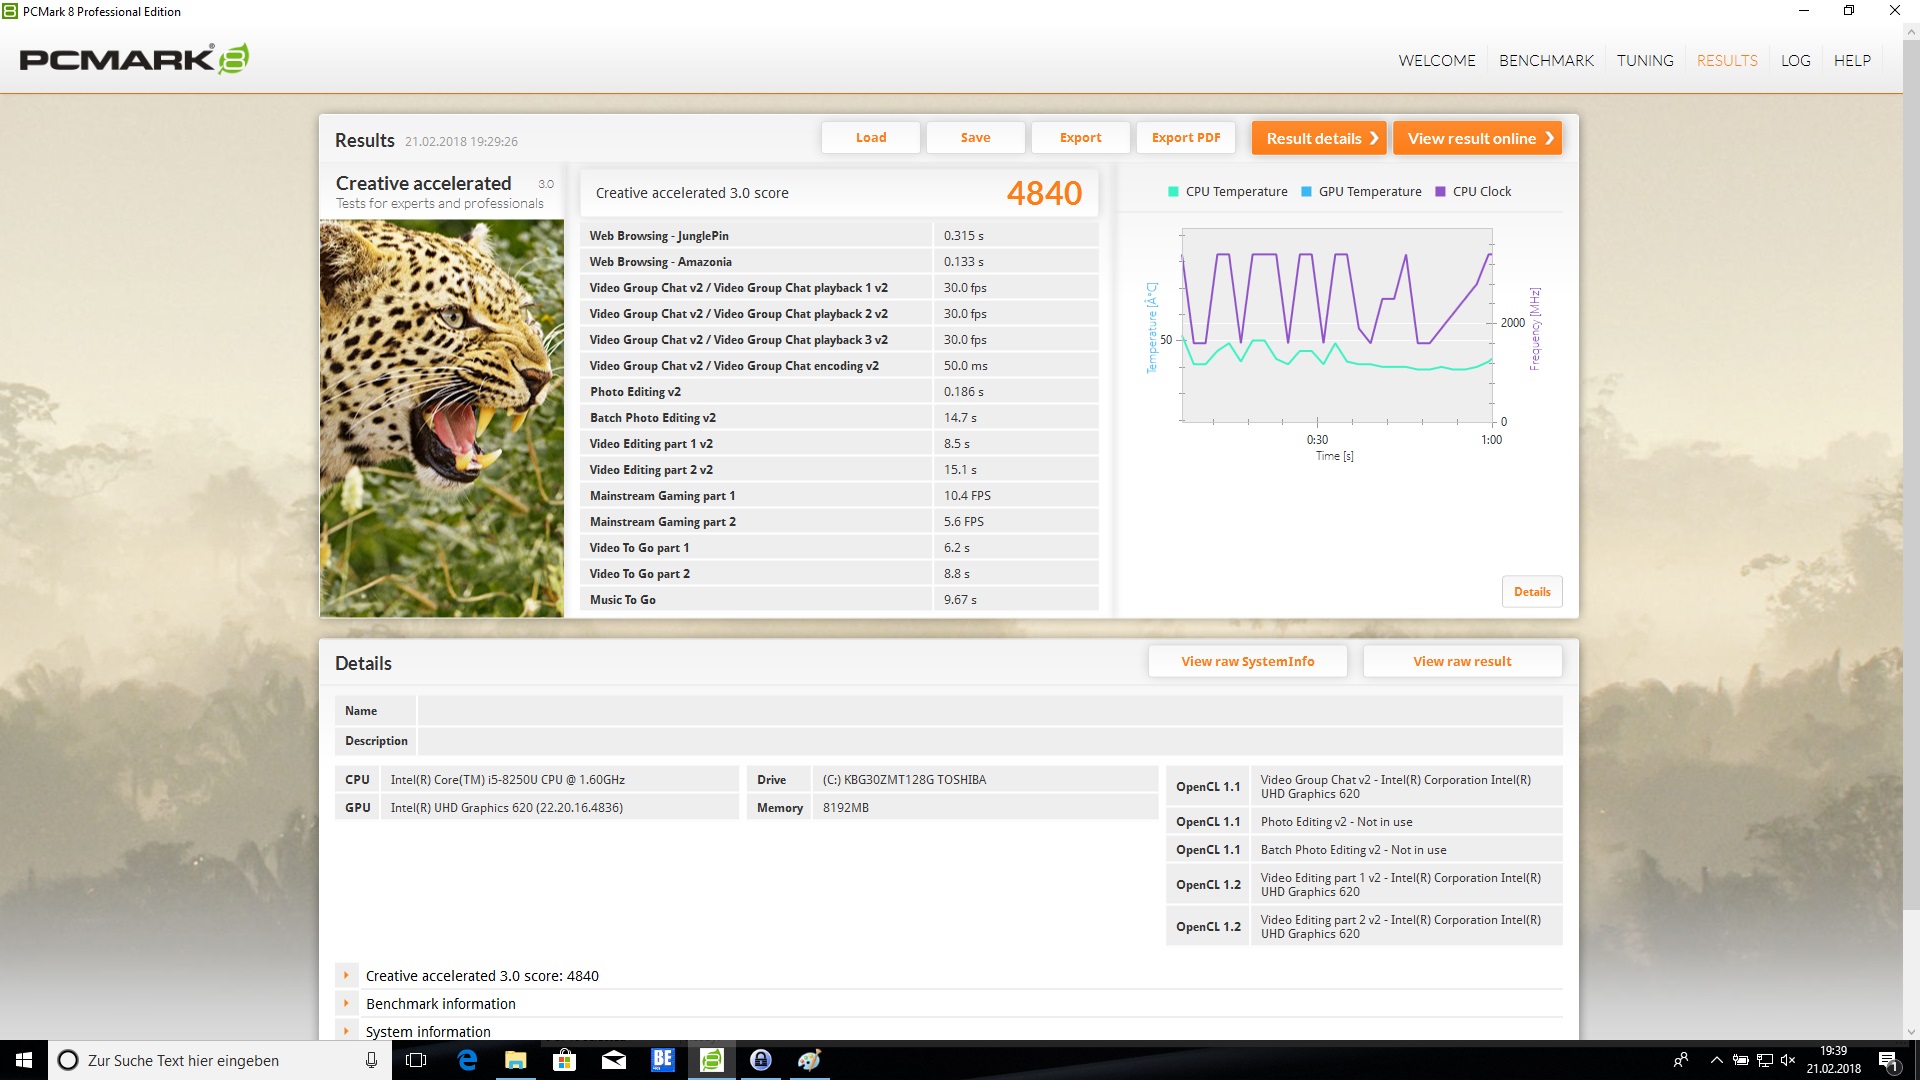
| PCMark 8 Creative Score Accelerated v2 | 4840 pontos | |
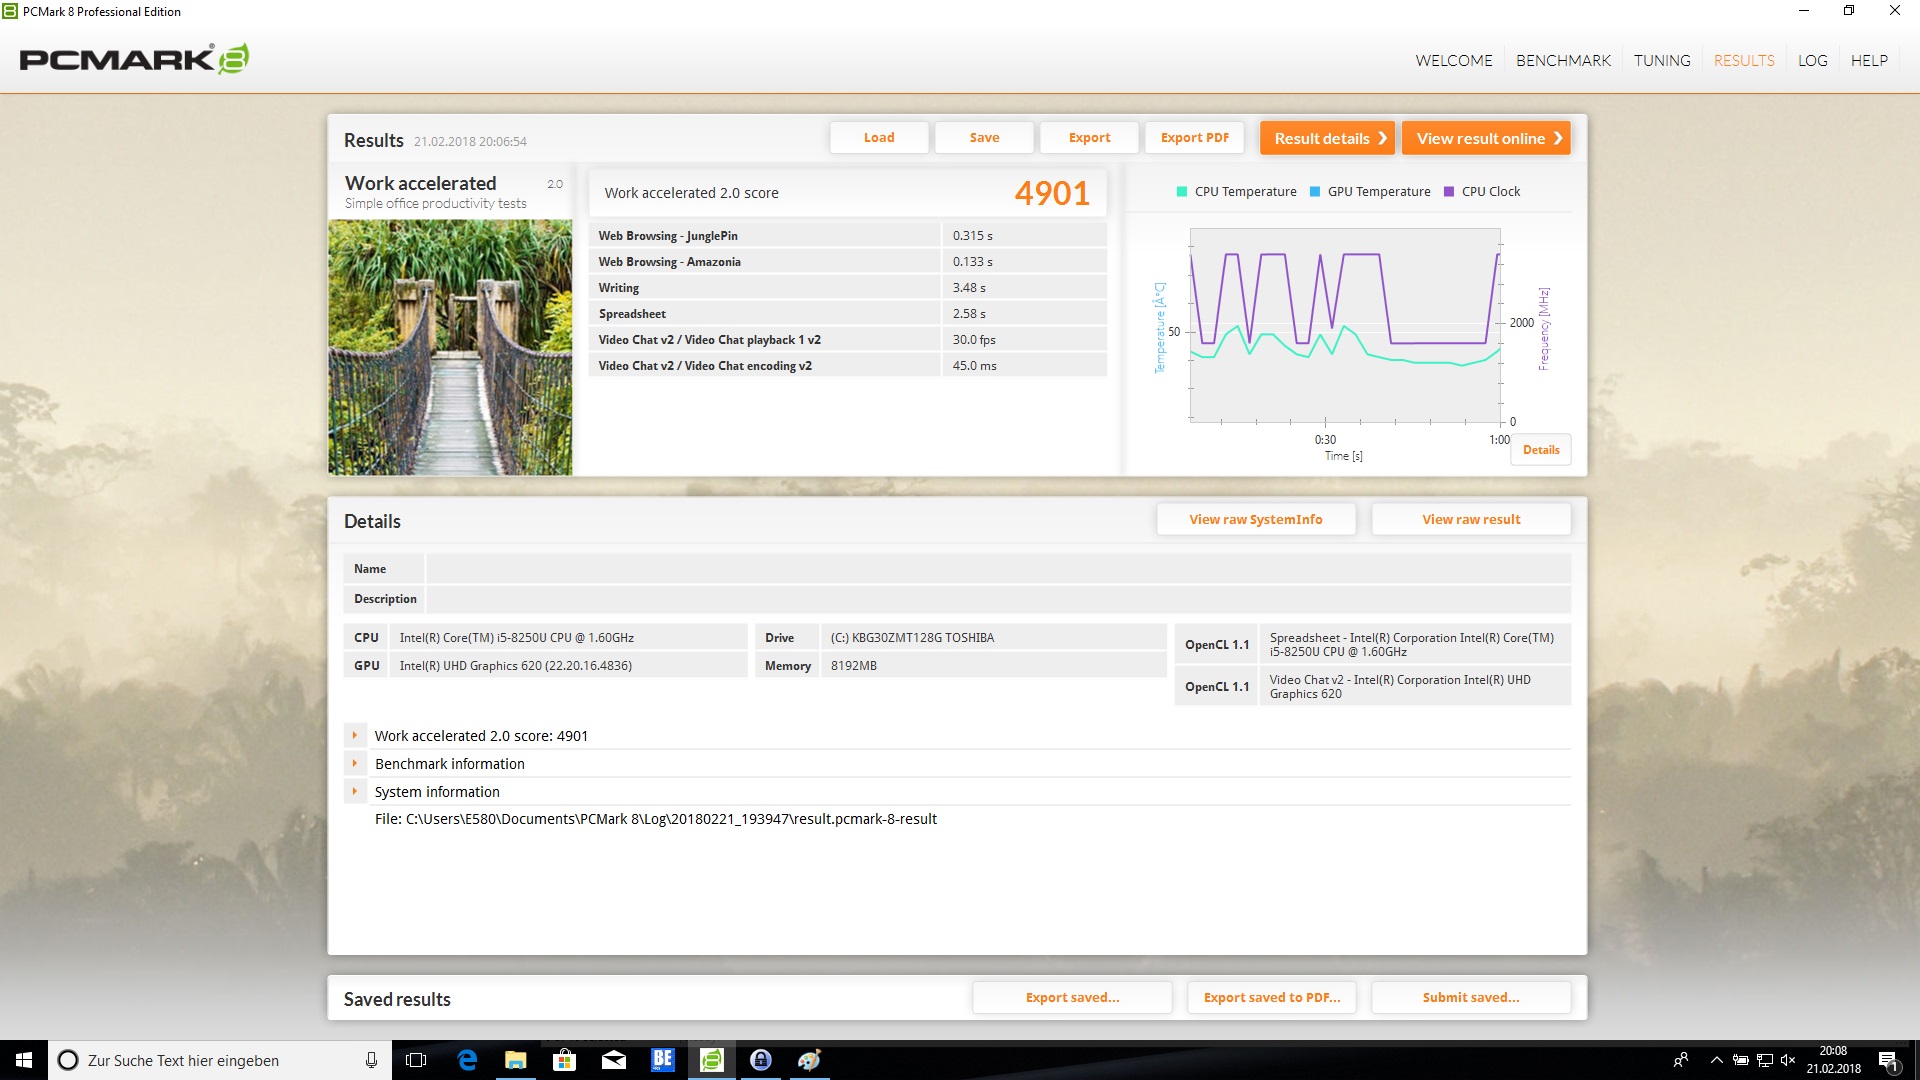
| PCMark 8 Work Score Accelerated v2 | 4901 pontos | |
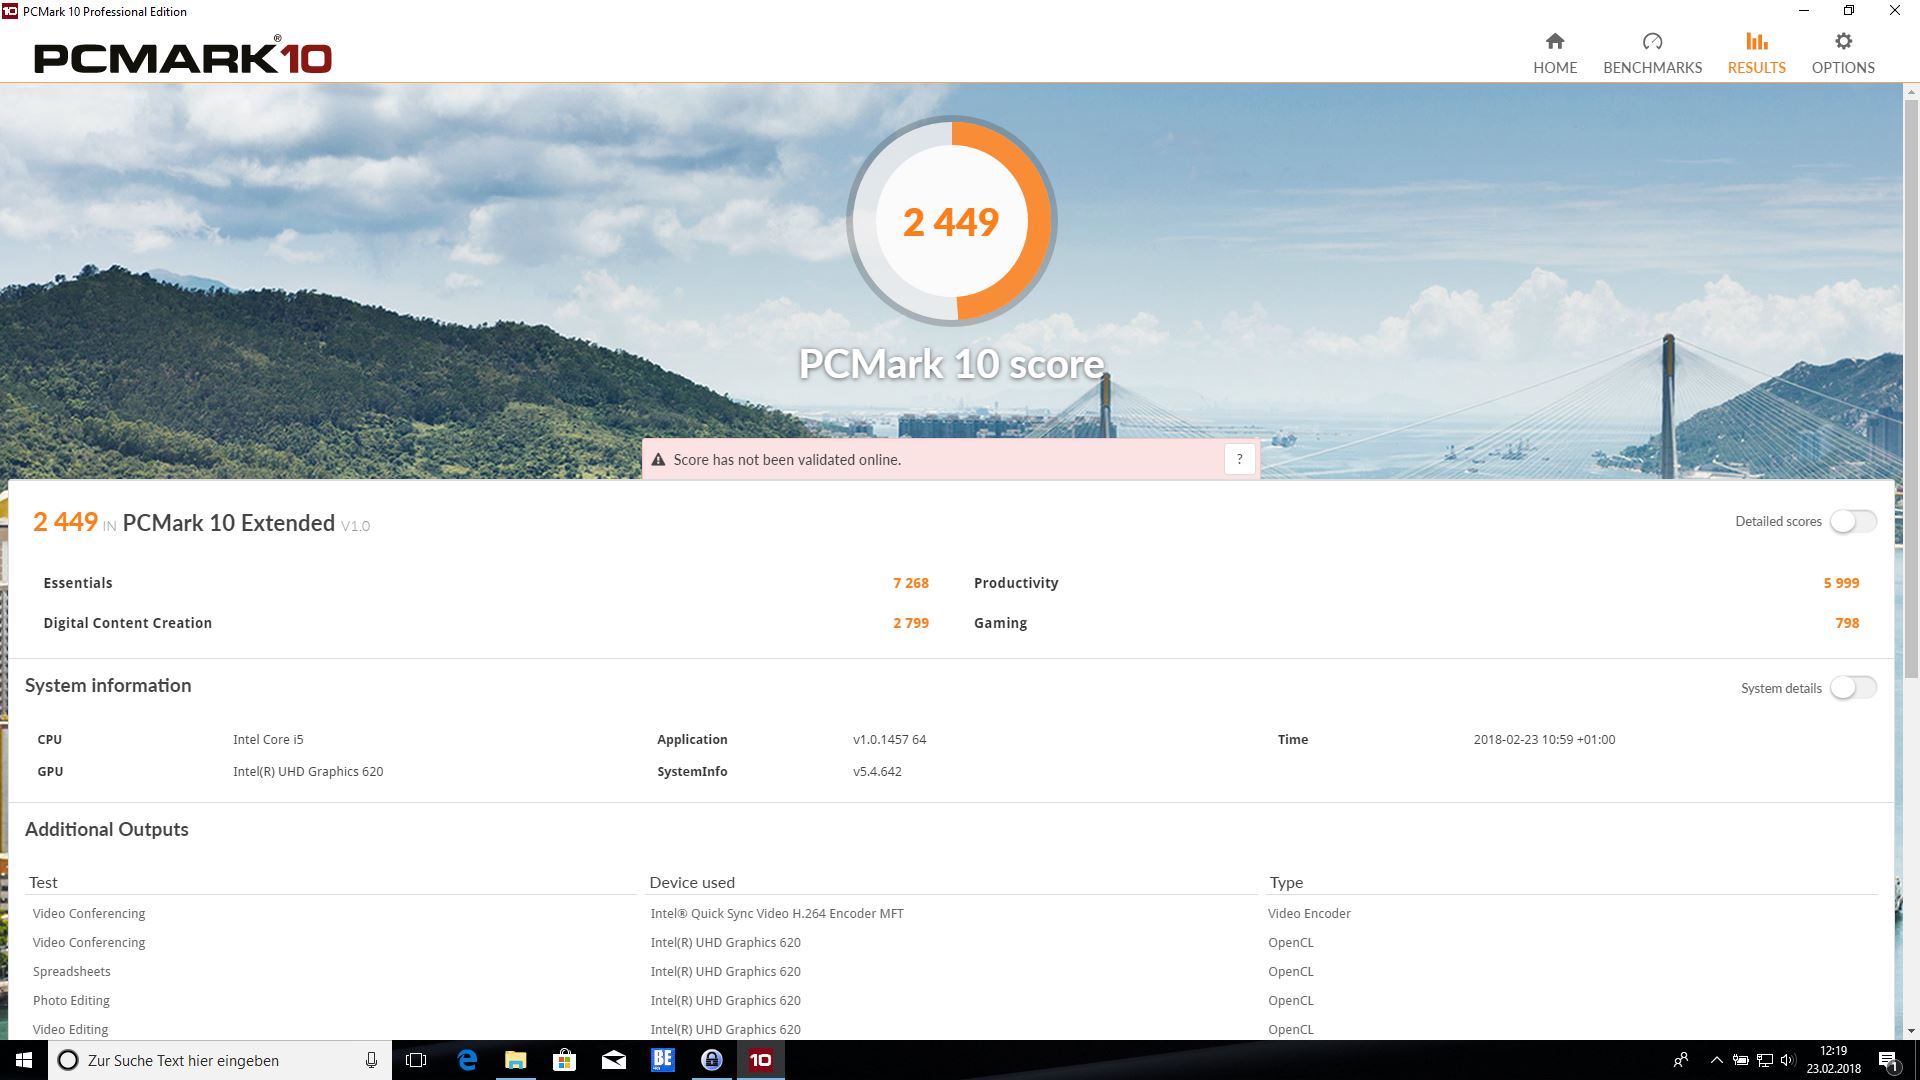
| PCMark 10 Score | 2449 pontos | |
Ajuda | ||
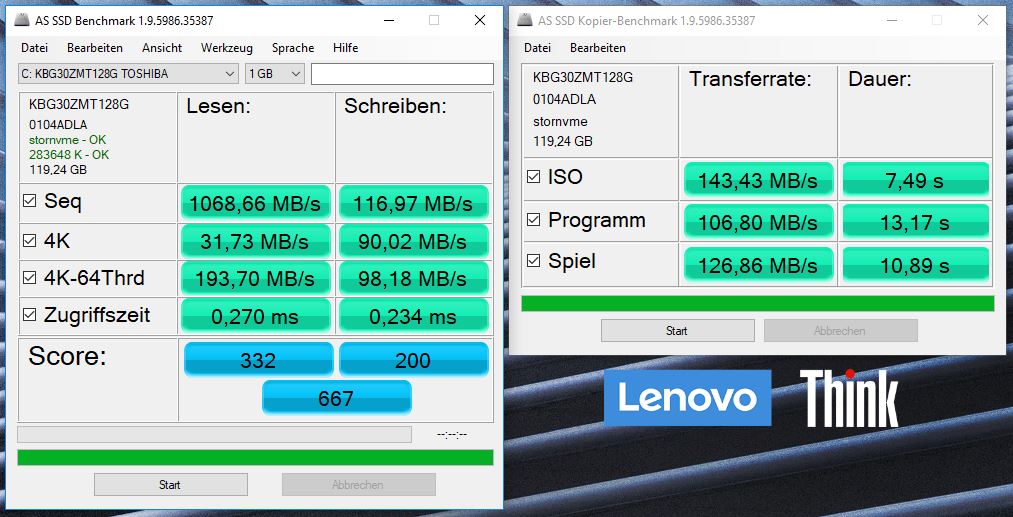
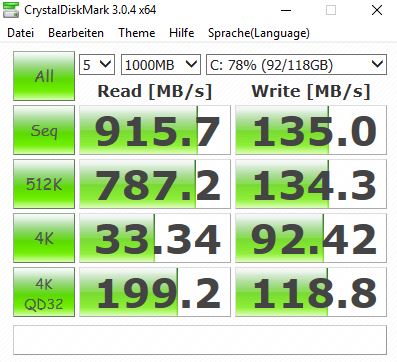
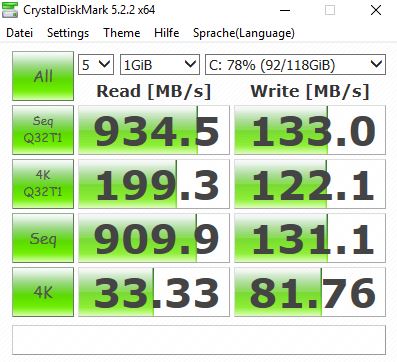
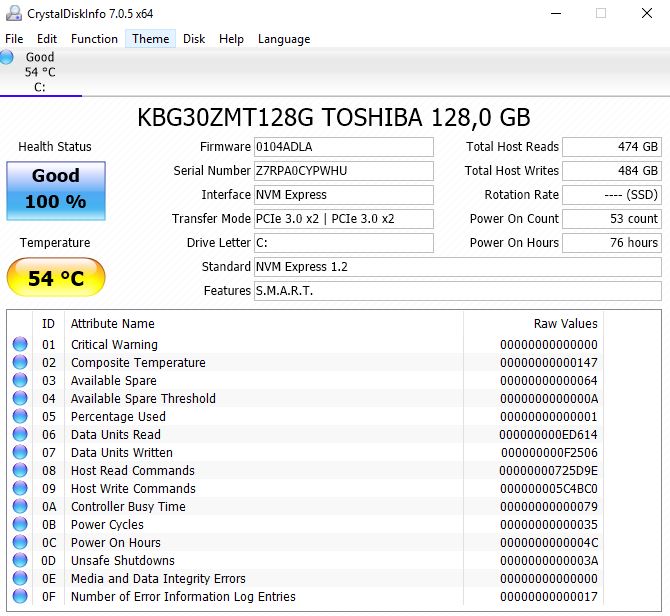
| Lenovo ThinkPad E580-20KSCTO1WW Toshiba KBG30ZMT128G | Lenovo ThinkPad E580-20KS001RGE Lenovo LENSE20256GMSP34MEAT2TA | Lenovo ThinkPad E570-20H6S02M00 Samsung PM961 MZVLW256HEHP | HP ProBook 450 G5-2UB53EA SanDisk SD8SN8U256G1006 | Acer TravelMate P2510-M-51ZQ SK Hynix HFS256G39TND-N210A | Schenker Slim 15 L17 Samsung SSD 960 Pro 512 GB m.2 | Dell Vostro 15 3568 Micron 1100 MTFDDAV256TBN | |
|---|---|---|---|---|---|---|---|
| CrystalDiskMark 3.0 | 53% | 243% | 32% | 34% | 345% | -4% | |
| Read Seq (MB/s) | 916 | 1280 40% | 1589 73% | 502 -45% | 498.1 -46% | 1958 114% | 469.3 -49% |
| Write Seq (MB/s) | 135 | 639 373% | 1217 801% | 451.6 235% | 260.1 93% | 1776 1216% | 179.7 33% |
| Read 512 (MB/s) | 787 | 1011 28% | 1155 47% | 372.5 -53% | 328.5 -58% | 819 4% | 359.6 -54% |
| Write 512 (MB/s) | 134.3 | 115.4 -14% | 783 483% | 269.7 101% | 260.9 94% | 1157 762% | 183.7 37% |
| Read 4k (MB/s) | 33.34 | 30.87 -7% | 59.7 79% | 27.76 -17% | 32.59 -2% | 54 62% | 26.01 -22% |
| Write 4k (MB/s) | 92.4 | 72.6 -21% | 148.8 61% | 52.4 -43% | 84.2 -9% | 157.7 71% | 68.7 -26% |
| Read 4k QD32 (MB/s) | 199.2 | 257.3 29% | 473.6 138% | 260.2 31% | 359.7 81% | 605 204% | 242.4 22% |
| Write 4k QD32 (MB/s) | 118.8 | 118.2 -1% | 428.7 261% | 177.7 50% | 262 121% | 511 330% | 147.1 24% |

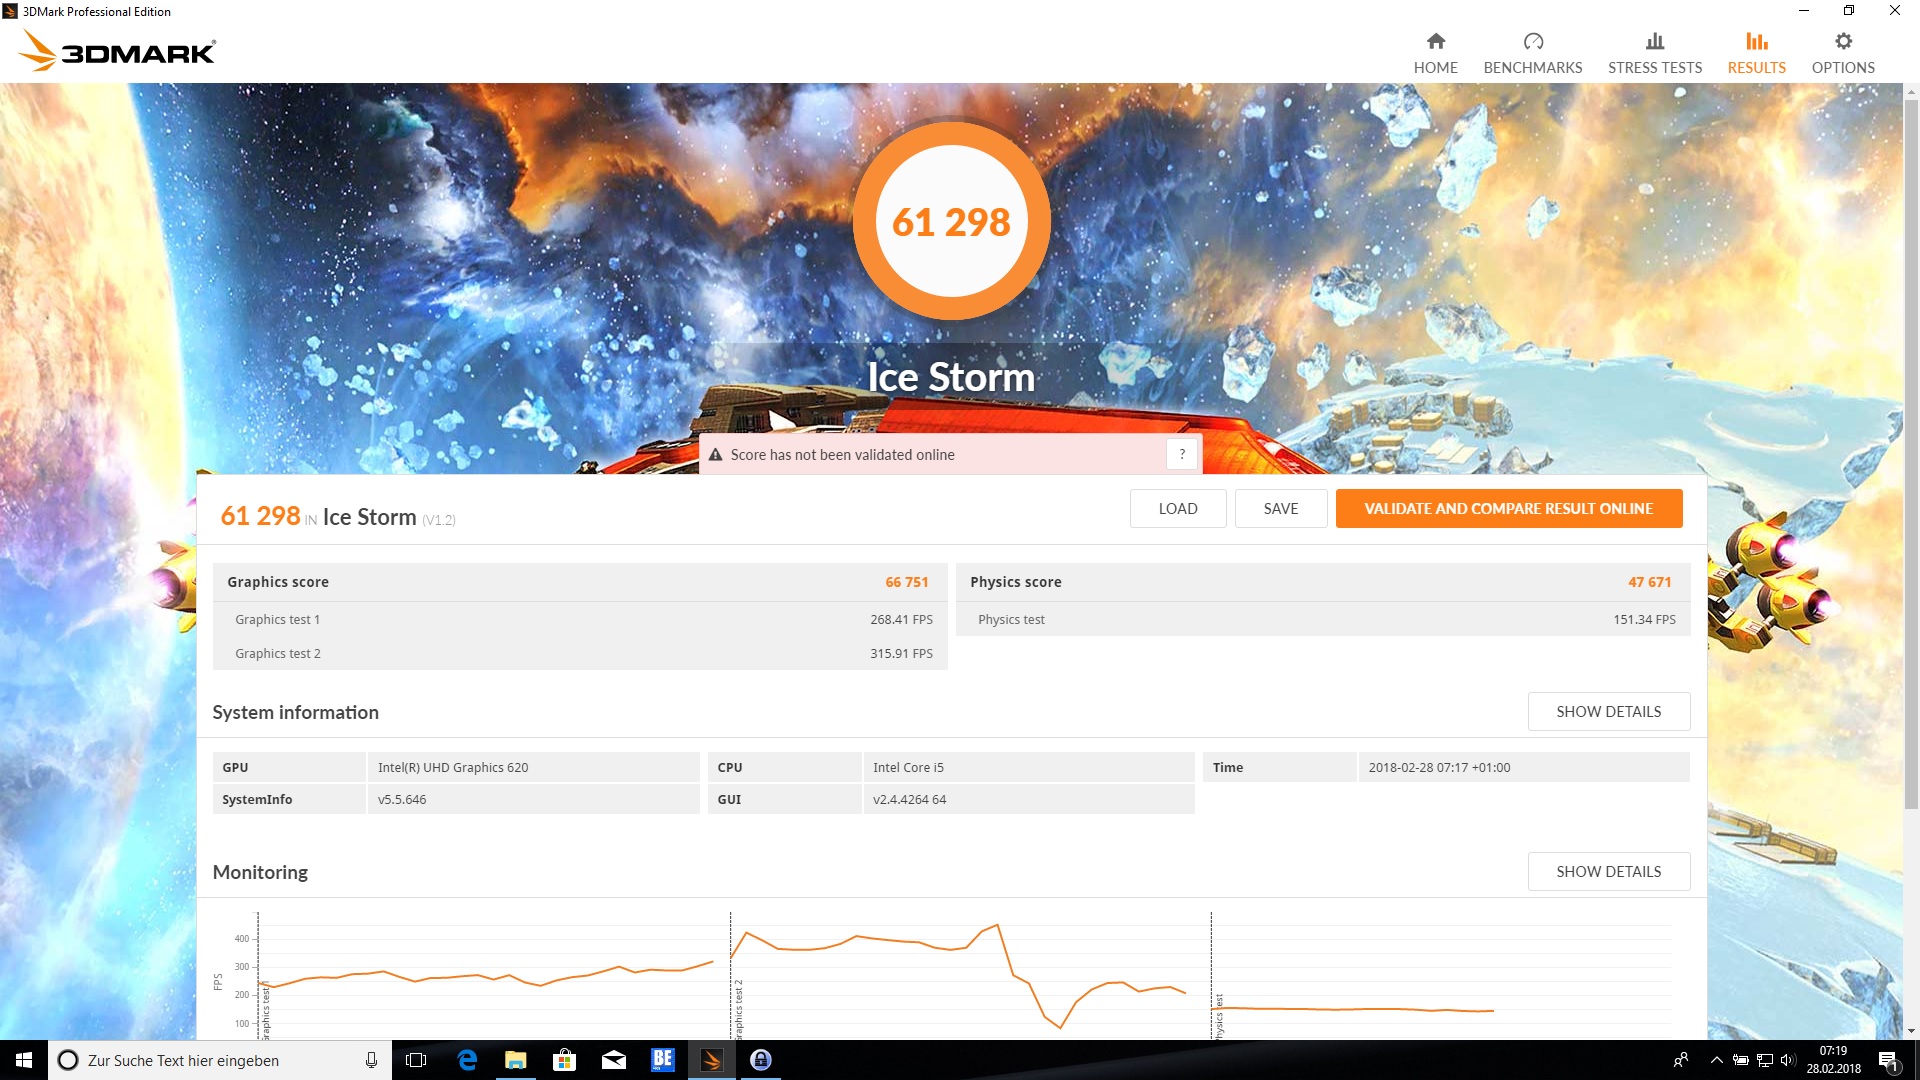
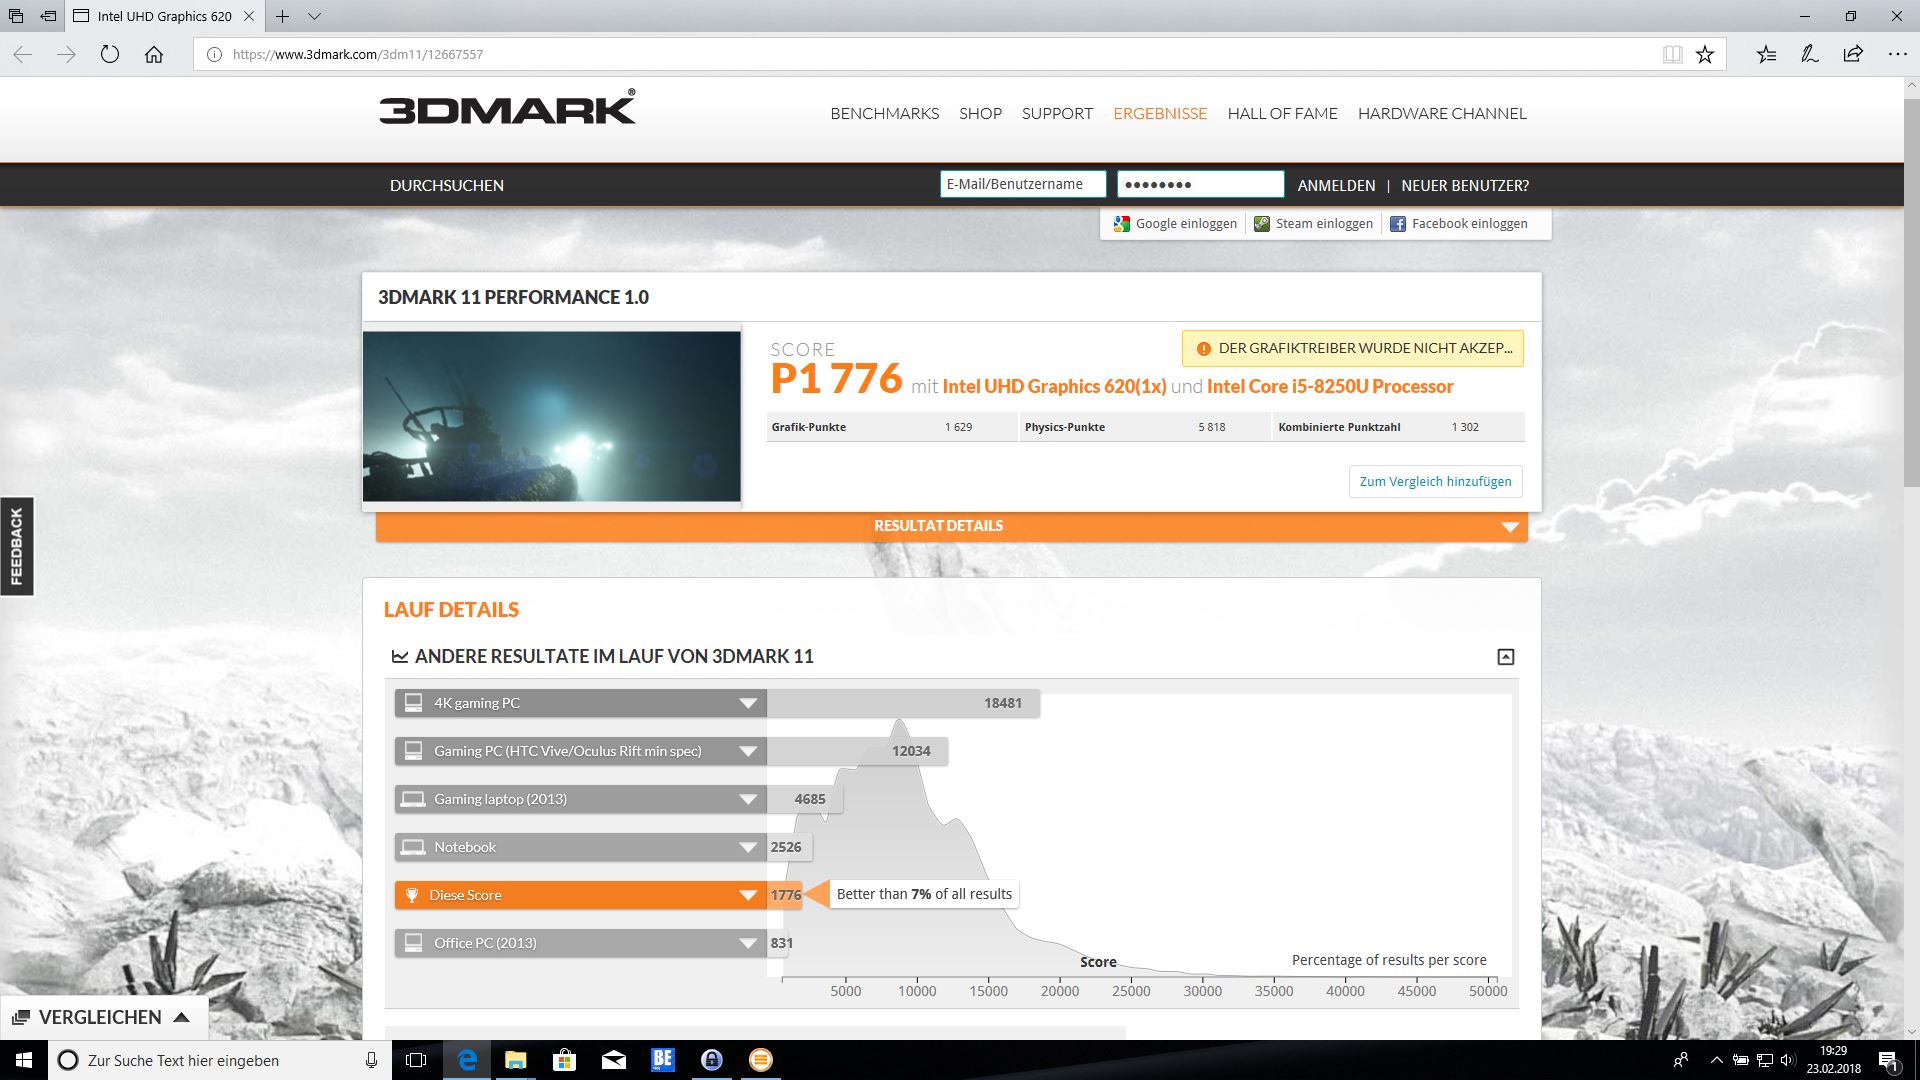
| 3DMark 11 Performance | 1776 pontos | |
| 3DMark Ice Storm Standard Score | 61298 pontos | |
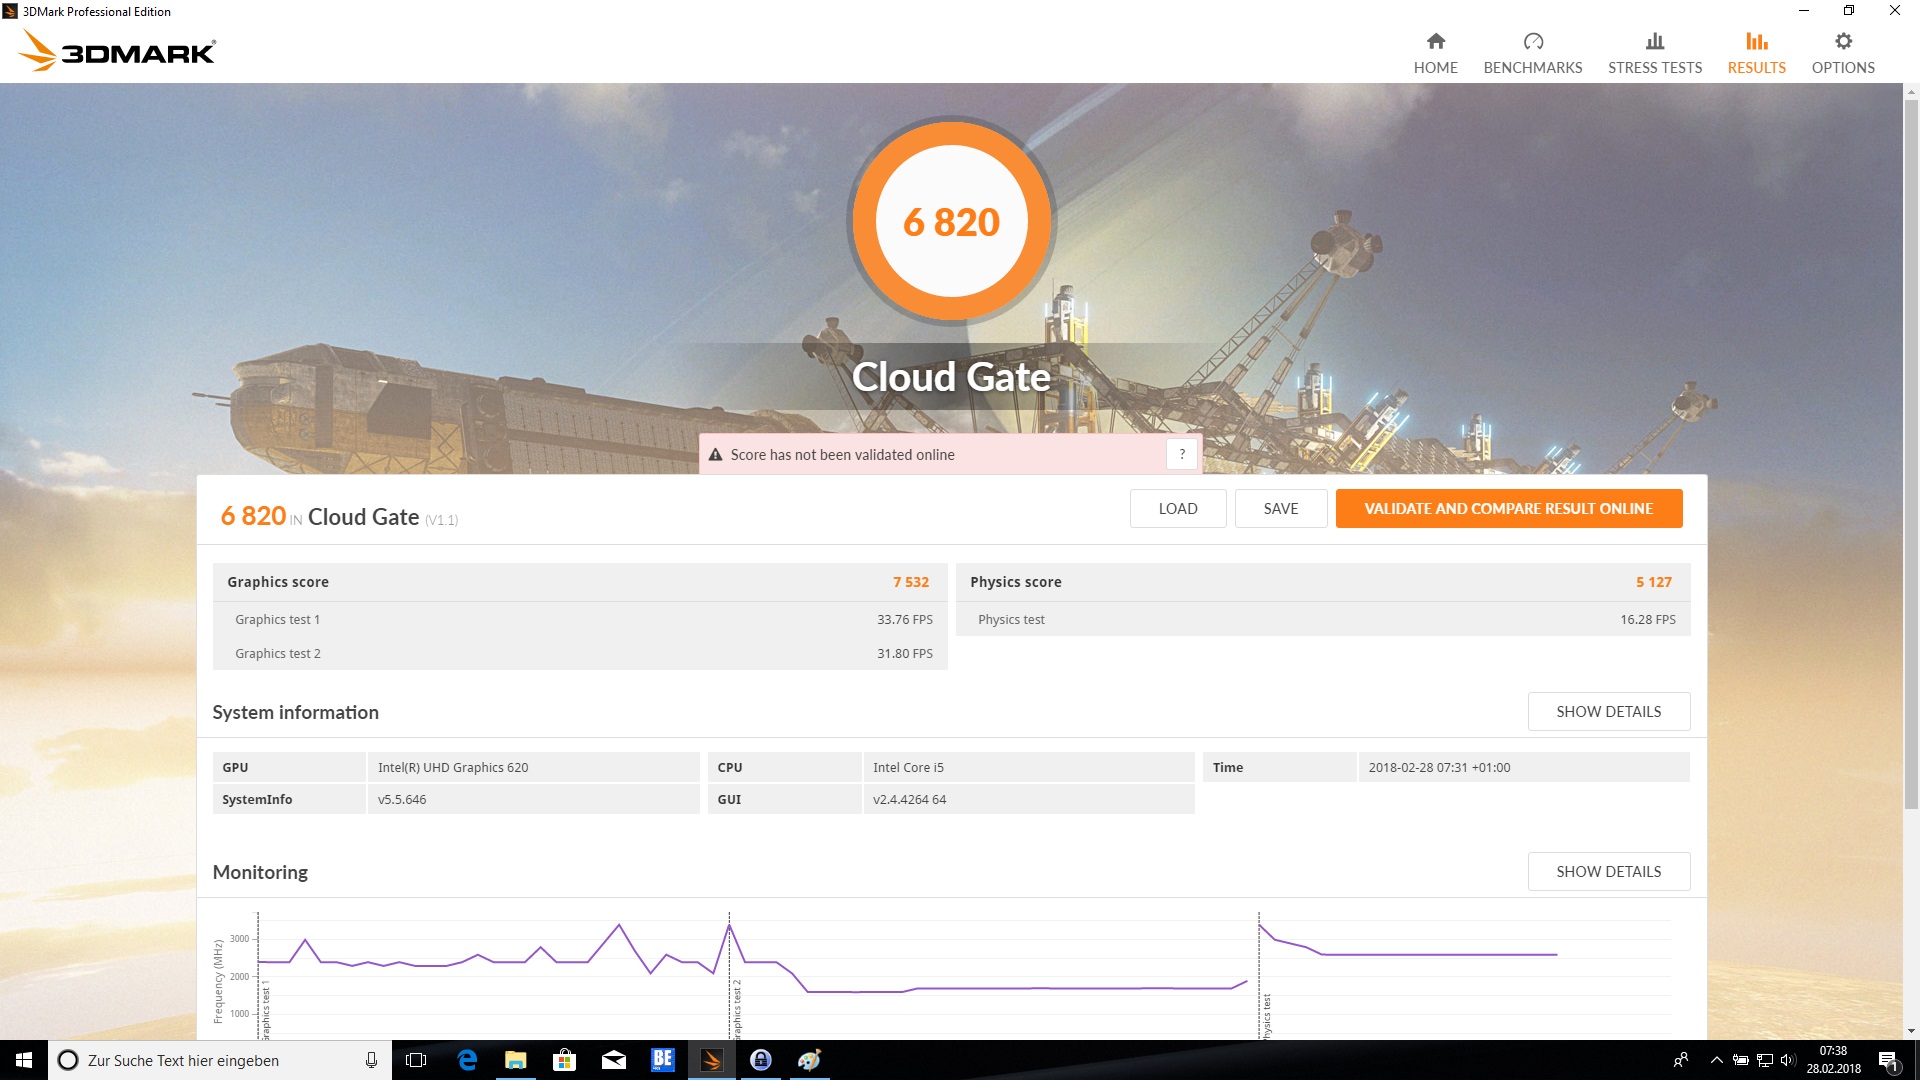
| 3DMark Cloud Gate Standard Score | 6820 pontos | |
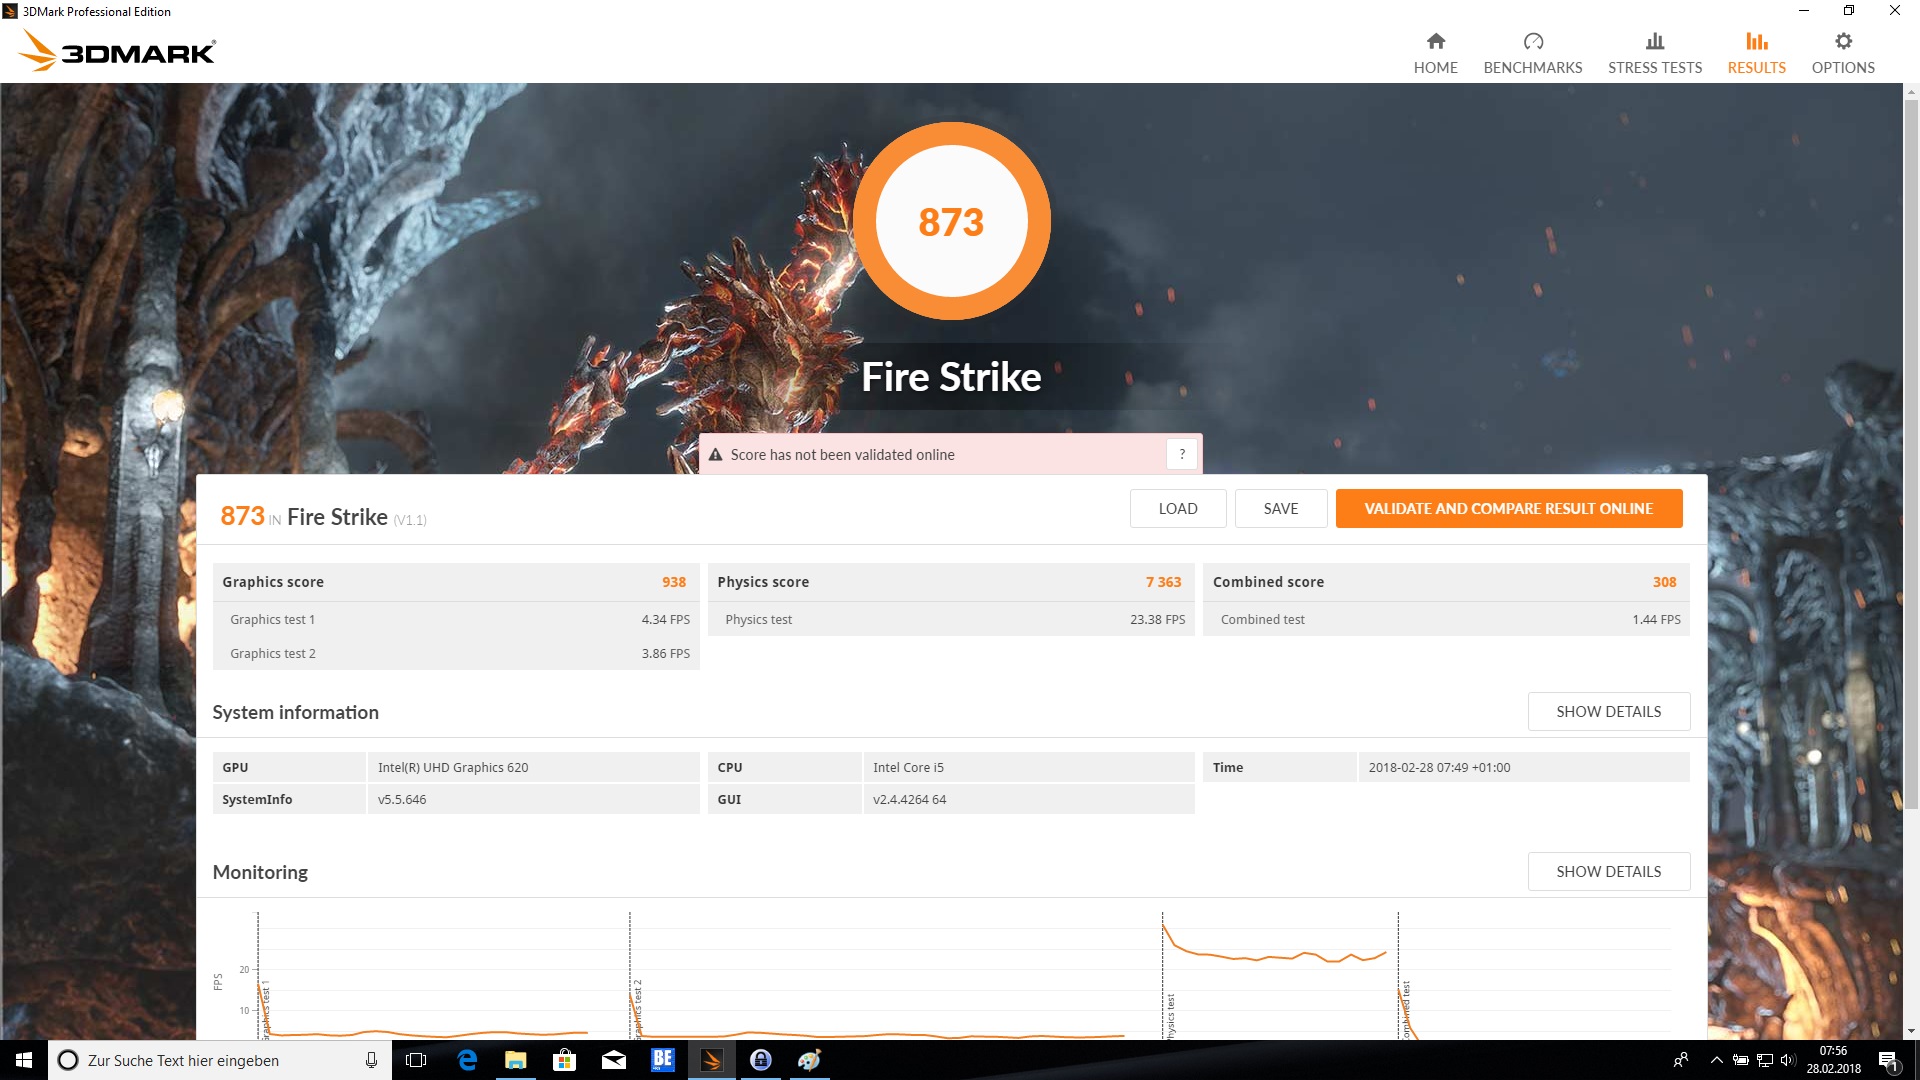
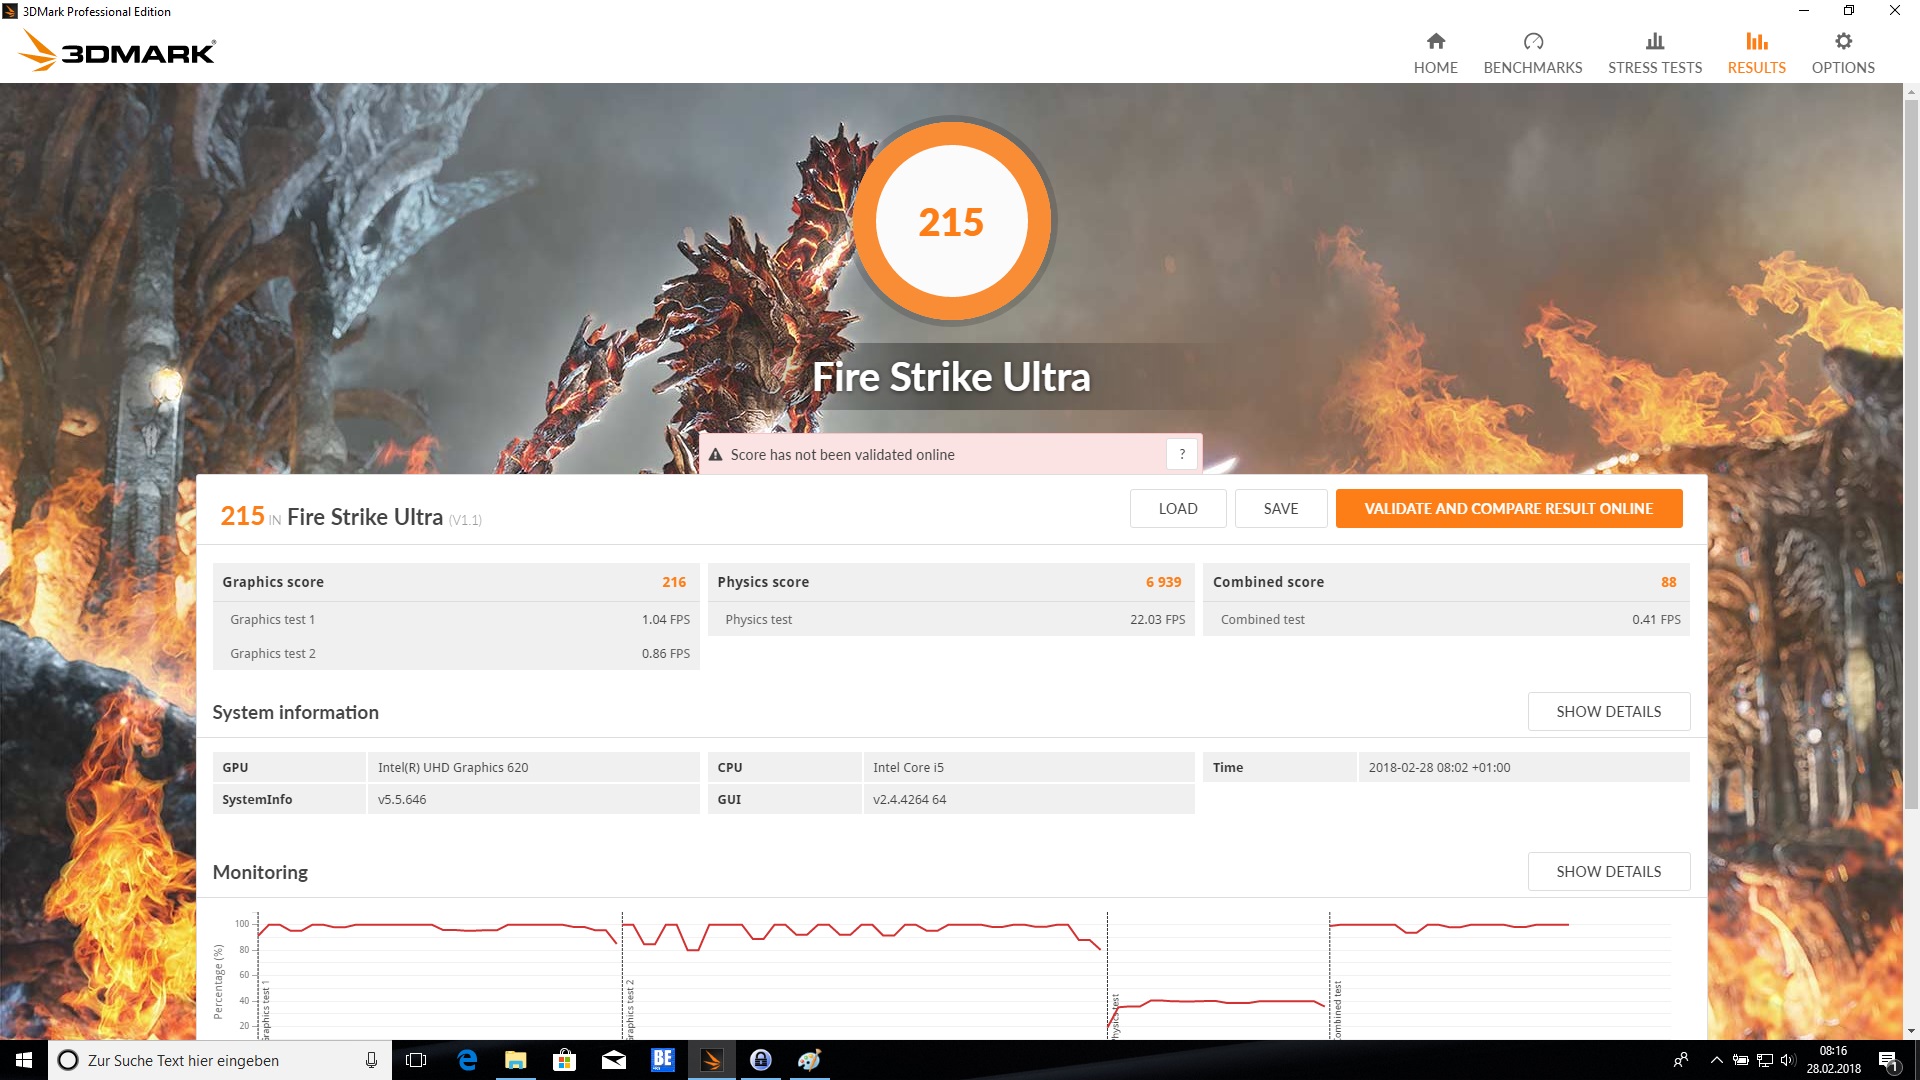
| 3DMark Fire Strike Score | 873 pontos | |
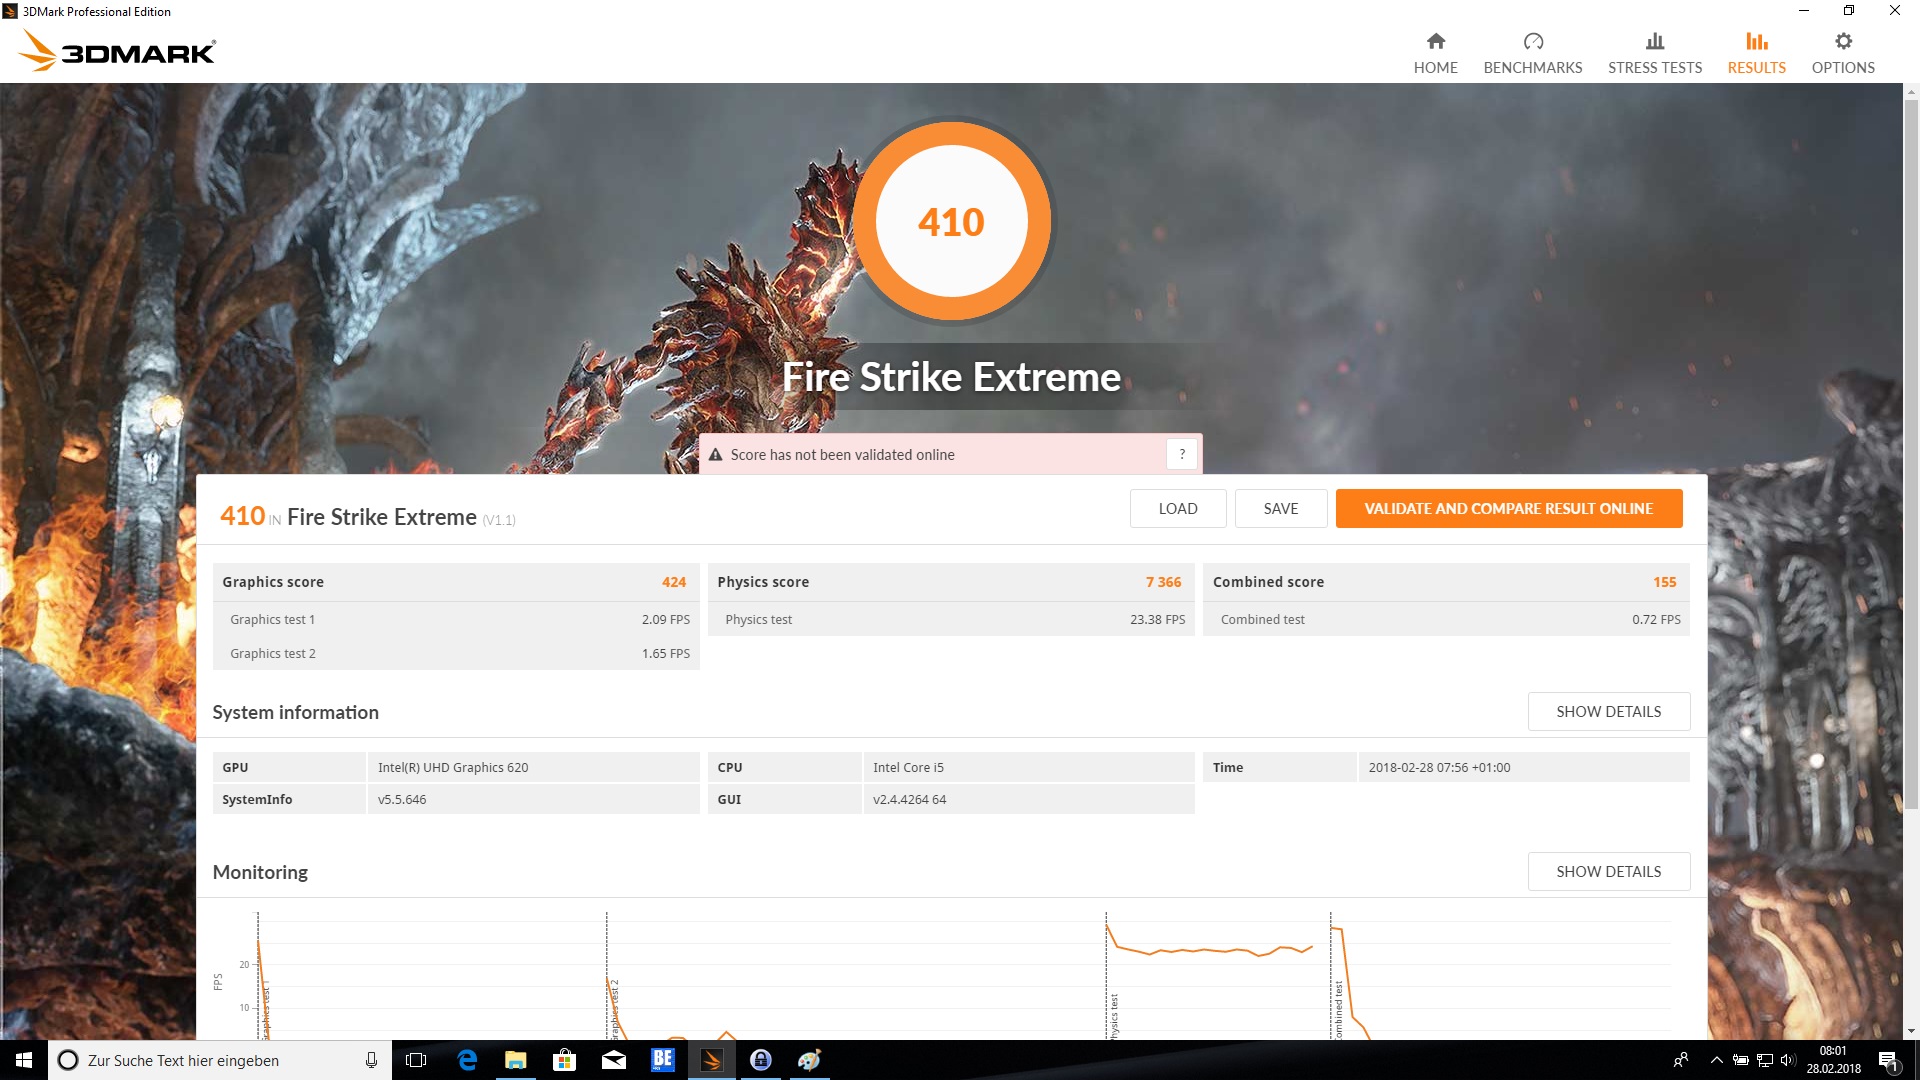
| 3DMark Fire Strike Extreme Score | 410 pontos | |
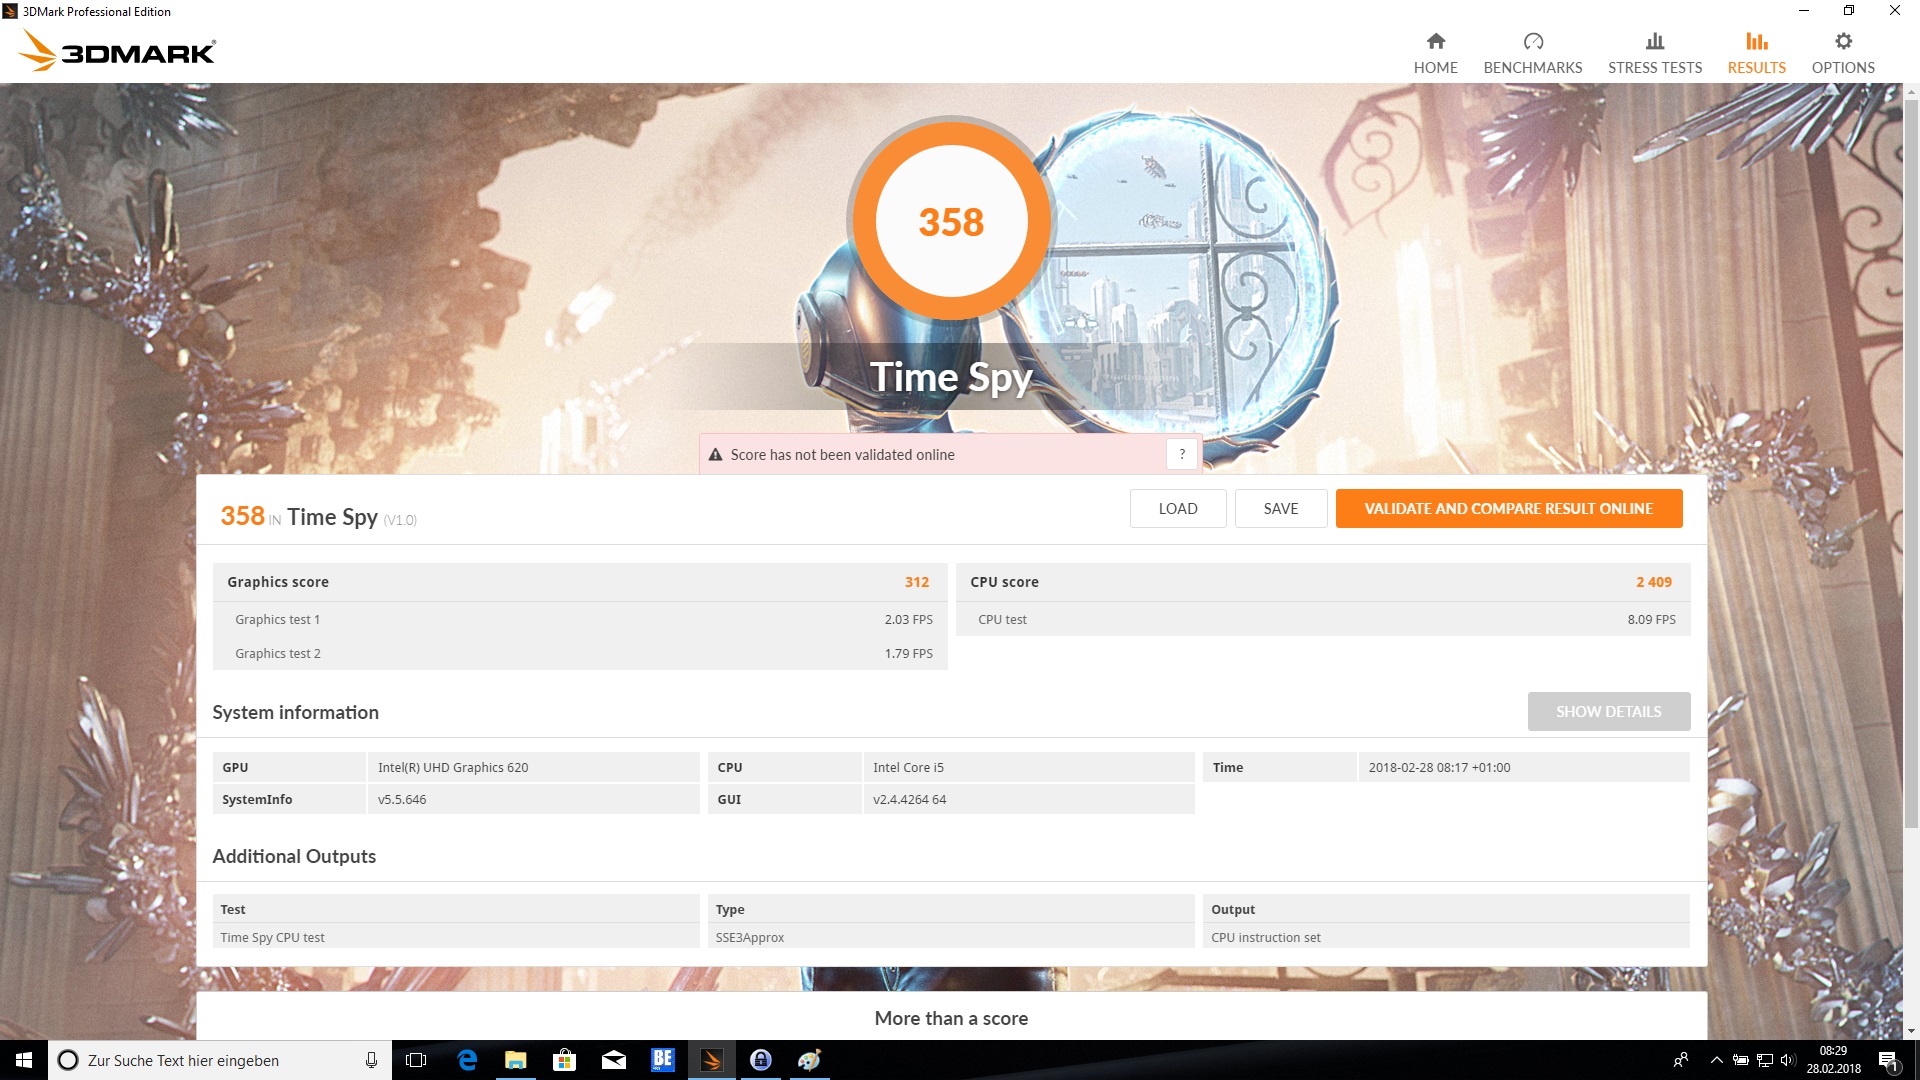
| 3DMark Time Spy Score | 358 pontos | |
Ajuda | ||
| baixo | média | alto | ultra | |
|---|---|---|---|---|
| BioShock Infinite (2013) | 46.1 | 27.7 | 22.9 | 7.6 |
| The Witcher 3 (2015) | 15.7 | 9.9 | 5.4 | |
| Rise of the Tomb Raider (2016) | 17.2 | 10.6 | 6.1 |
Barulho
| Ocioso |
| 29.1 / 29.1 / 30.2 dB |
| Carga |
| 30.8 / 32.8 dB |
 | ||
30 dB silencioso 40 dB(A) audível 50 dB(A) ruidosamente alto |
||
min: | ||
| Lenovo ThinkPad E580-20KSCTO1WW UHD Graphics 620, i5-8250U, Toshiba KBG30ZMT128G | Lenovo ThinkPad E580-20KS001RGE Radeon RX 550 (Laptop), i5-8550U, Lenovo LENSE20256GMSP34MEAT2TA | Lenovo ThinkPad E570-20H6S02M00 HD Graphics 620, i5-7200U, Samsung PM961 MZVLW256HEHP | HP ProBook 450 G5-2UB53EA UHD Graphics 620, i5-8250U, SanDisk SD8SN8U256G1006 | Acer TravelMate P2510-M-51ZQ HD Graphics 620, i5-7200U, SK Hynix HFS256G39TND-N210A | Schenker Slim 15 L17 UHD Graphics 620, i5-8550U, Samsung SSD 960 Pro 512 GB m.2 | Dell Vostro 15 3568 HD Graphics 620, i5-7200U, Micron 1100 MTFDDAV256TBN | |
|---|---|---|---|---|---|---|---|
| Noise | -9% | -2% | 1% | -10% | -7% | -7% | |
| desligado / ambiente * (dB) | 29.1 | 30.1 -3% | 30.6 -5% | 29.1 -0% | 31.4 -8% | 29.1 -0% | 30.2 -4% |
| Idle Minimum * (dB) | 29.1 | 30.1 -3% | 30.6 -5% | 29.1 -0% | 31.8 -9% | 29.1 -0% | 30.2 -4% |
| Idle Average * (dB) | 29.1 | 30.1 -3% | 30.6 -5% | 29.1 -0% | 31.8 -9% | 29.1 -0% | 30.2 -4% |
| Idle Maximum * (dB) | 30.2 | 31.6 -5% | 30.6 -1% | 29.1 4% | 31.8 -5% | 30.5 -1% | 30.2 -0% |
| Load Average * (dB) | 30.8 | 37.7 -22% | 31.8 -3% | 31.4 -2% | 36.6 -19% | 31.2 -1% | 36.4 -18% |
| Load Maximum * (dB) | 32.8 | 38 -16% | 31.3 5% | 32 2% | 36.5 -11% | 45.9 -40% | 36.5 -11% |
* ... menor é melhor
(±) A temperatura máxima no lado superior é 40.4 °C / 105 F, em comparação com a média de 34.3 °C / 94 F , variando de 21.2 a 62.5 °C para a classe Office.
(±) A parte inferior aquece até um máximo de 43.7 °C / 111 F, em comparação com a média de 36.8 °C / 98 F
(+) Em uso inativo, a temperatura média para o lado superior é 20.4 °C / 69 F, em comparação com a média do dispositivo de 29.5 °C / ### class_avg_f### F.
(+) Os apoios para as mãos e o touchpad são mais frios que a temperatura da pele, com um máximo de 22.6 °C / 72.7 F e, portanto, são frios ao toque.
(+) A temperatura média da área do apoio para as mãos de dispositivos semelhantes foi 27.5 °C / 81.5 F (+4.9 °C / 8.8 F).
| Lenovo ThinkPad E580-20KSCTO1WW UHD Graphics 620, i5-8250U, Toshiba KBG30ZMT128G | Lenovo ThinkPad E580-20KS001RGE Radeon RX 550 (Laptop), i5-8550U, Lenovo LENSE20256GMSP34MEAT2TA | Lenovo ThinkPad E570-20H6S02M00 HD Graphics 620, i5-7200U, Samsung PM961 MZVLW256HEHP | HP ProBook 450 G5-2UB53EA UHD Graphics 620, i5-8250U, SanDisk SD8SN8U256G1006 | Acer TravelMate P2510-M-51ZQ HD Graphics 620, i5-7200U, SK Hynix HFS256G39TND-N210A | Schenker Slim 15 L17 UHD Graphics 620, i5-8550U, Samsung SSD 960 Pro 512 GB m.2 | Dell Vostro 15 3568 HD Graphics 620, i5-7200U, Micron 1100 MTFDDAV256TBN | |
|---|---|---|---|---|---|---|---|
| Heat | -33% | -1% | -4% | 6% | -6% | 3% | |
| Maximum Upper Side * (°C) | 40.4 | 60 -49% | 33.2 18% | 42.2 -4% | 32 21% | 38.5 5% | 35.6 12% |
| Maximum Bottom * (°C) | 43.7 | 57 -30% | 39.4 10% | 45.5 -4% | 35.5 19% | 41.8 4% | 35.3 19% |
| Idle Upper Side * (°C) | 21.4 | 29.1 -36% | 25.9 -21% | 23.9 -12% | 25.6 -20% | 26.4 -23% | 25.1 -17% |
| Idle Bottom * (°C) | 25.5 | 30.2 -18% | 27.8 -9% | 24.2 5% | 25.1 2% | 27.9 -9% | 26.1 -2% |
* ... menor é melhor
| desligado | |
| Ocioso | |
| Carga |
|
Key:
min: | |
| Lenovo ThinkPad E580-20KSCTO1WW i5-8250U, UHD Graphics 620, Toshiba KBG30ZMT128G, IPS LED, 1920x1080, 15.6" | Lenovo ThinkPad E580-20KS001RGE i5-8550U, Radeon RX 550 (Laptop), Lenovo LENSE20256GMSP34MEAT2TA, IPS LED, 1920x1080, 15.6" | Lenovo ThinkPad E570-20H6S02M00 i5-7200U, HD Graphics 620, Samsung PM961 MZVLW256HEHP, TN LED, 1366x768, 15.6" | HP ProBook 450 G5-2UB53EA i5-8250U, UHD Graphics 620, SanDisk SD8SN8U256G1006, IPS LED, 1920x1080, 15.6" | Acer TravelMate P2510-M-51ZQ i5-7200U, HD Graphics 620, SK Hynix HFS256G39TND-N210A, IPS, 1920x1080, 15.6" | Schenker Slim 15 L17 i5-8550U, UHD Graphics 620, Samsung SSD 960 Pro 512 GB m.2, IPS, 1920x1080, 15.6" | Dell Vostro 15 3568 i5-7200U, HD Graphics 620, Micron 1100 MTFDDAV256TBN, TN LED, 1920x1080, 15.6" | |
|---|---|---|---|---|---|---|---|
| Power Consumption | -65% | 16% | -3% | 2% | -53% | 21% | |
| Idle Minimum * (Watt) | 3.4 | 7.4 -118% | 2.9 15% | 3.6 -6% | 3.4 -0% | 7.2 -112% | 3 12% |
| Idle Average * (Watt) | 6.7 | 10.4 -55% | 5.8 13% | 6.2 7% | 5.8 13% | 10.9 -63% | 5.5 18% |
| Idle Maximum * (Watt) | 7.7 | 10.3 -34% | 6.6 14% | 7.2 6% | 8 -4% | 12.6 -64% | 5.7 26% |
| Load Average * (Watt) | 31.1 | 57 -83% | 29 7% | 35.2 -13% | 38 -22% | 37 -19% | 27 13% |
| Load Maximum * (Watt) | 42.9 | 57 -33% | 29.4 31% | 46.4 -8% | 32 25% | 45.5 -6% | 27.4 36% |
* ... menor é melhor
| Lenovo ThinkPad E580-20KSCTO1WW i5-8250U, UHD Graphics 620, 45 Wh | Lenovo ThinkPad E580-20KS001RGE i5-8550U, Radeon RX 550 (Laptop), 45 Wh | Lenovo ThinkPad E570-20H6S02M00 i5-7200U, HD Graphics 620, 42 Wh | HP ProBook 450 G5-2UB53EA i5-8250U, UHD Graphics 620, 48 Wh | Acer TravelMate P2510-M-51ZQ i5-7200U, HD Graphics 620, 48 Wh | Schenker Slim 15 L17 i5-8550U, UHD Graphics 620, 44 Wh | Dell Vostro 15 3568 i5-7200U, HD Graphics 620, 40 Wh | |
|---|---|---|---|---|---|---|---|
| Duração da bateria | 2% | 5% | 10% | 17% | -34% | 1% | |
| Reader / Idle (h) | 14.4 | 14.4 0% | 18.1 26% | 15.2 6% | 7.4 -49% | 14.6 1% | |
| H.264 (h) | 7.3 | 9.1 25% | 6.5 -11% | 4.3 -41% | |||
| WiFi v1.3 (h) | 7 | 6.7 -4% | 7.2 3% | 7.7 10% | 8.8 26% | 4.6 -34% | 6.3 -10% |
| Load (h) | 1.6 | 1.4 -13% | 1.6 0% | 1.9 19% | 1.4 -13% | 1.8 13% |
Pro
Contra
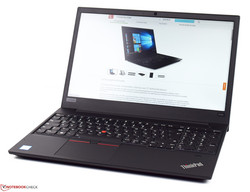
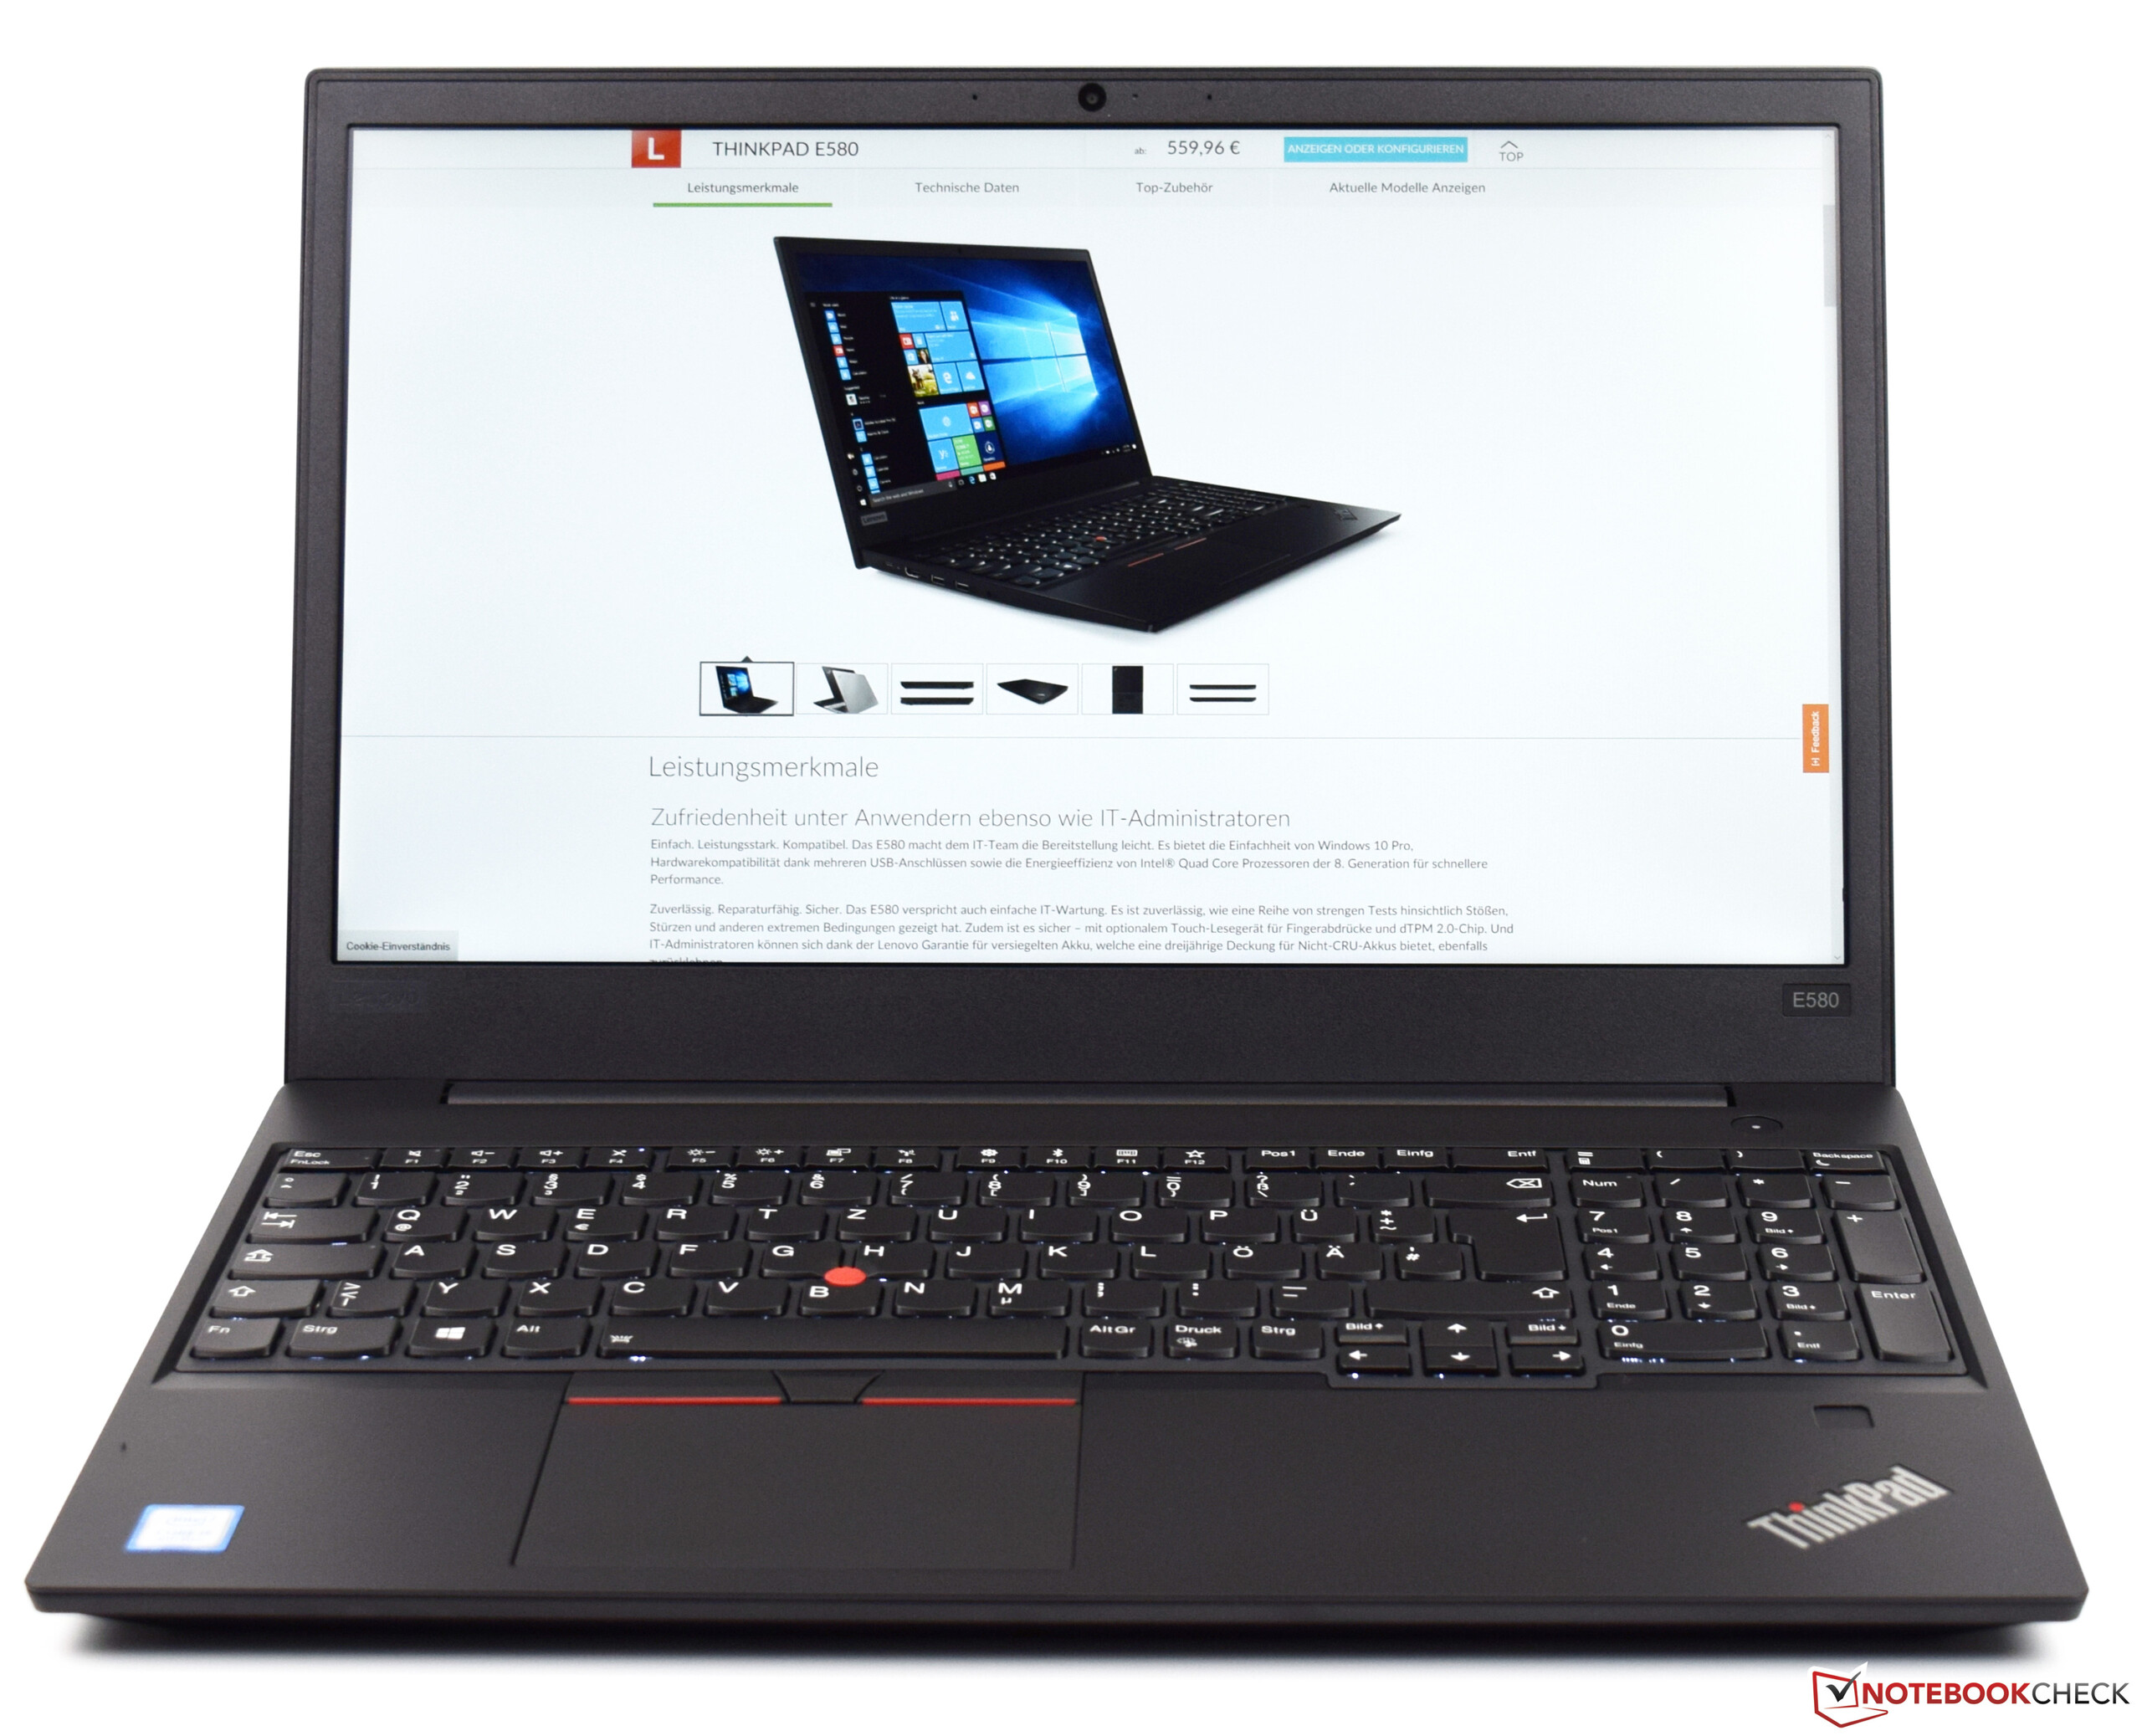
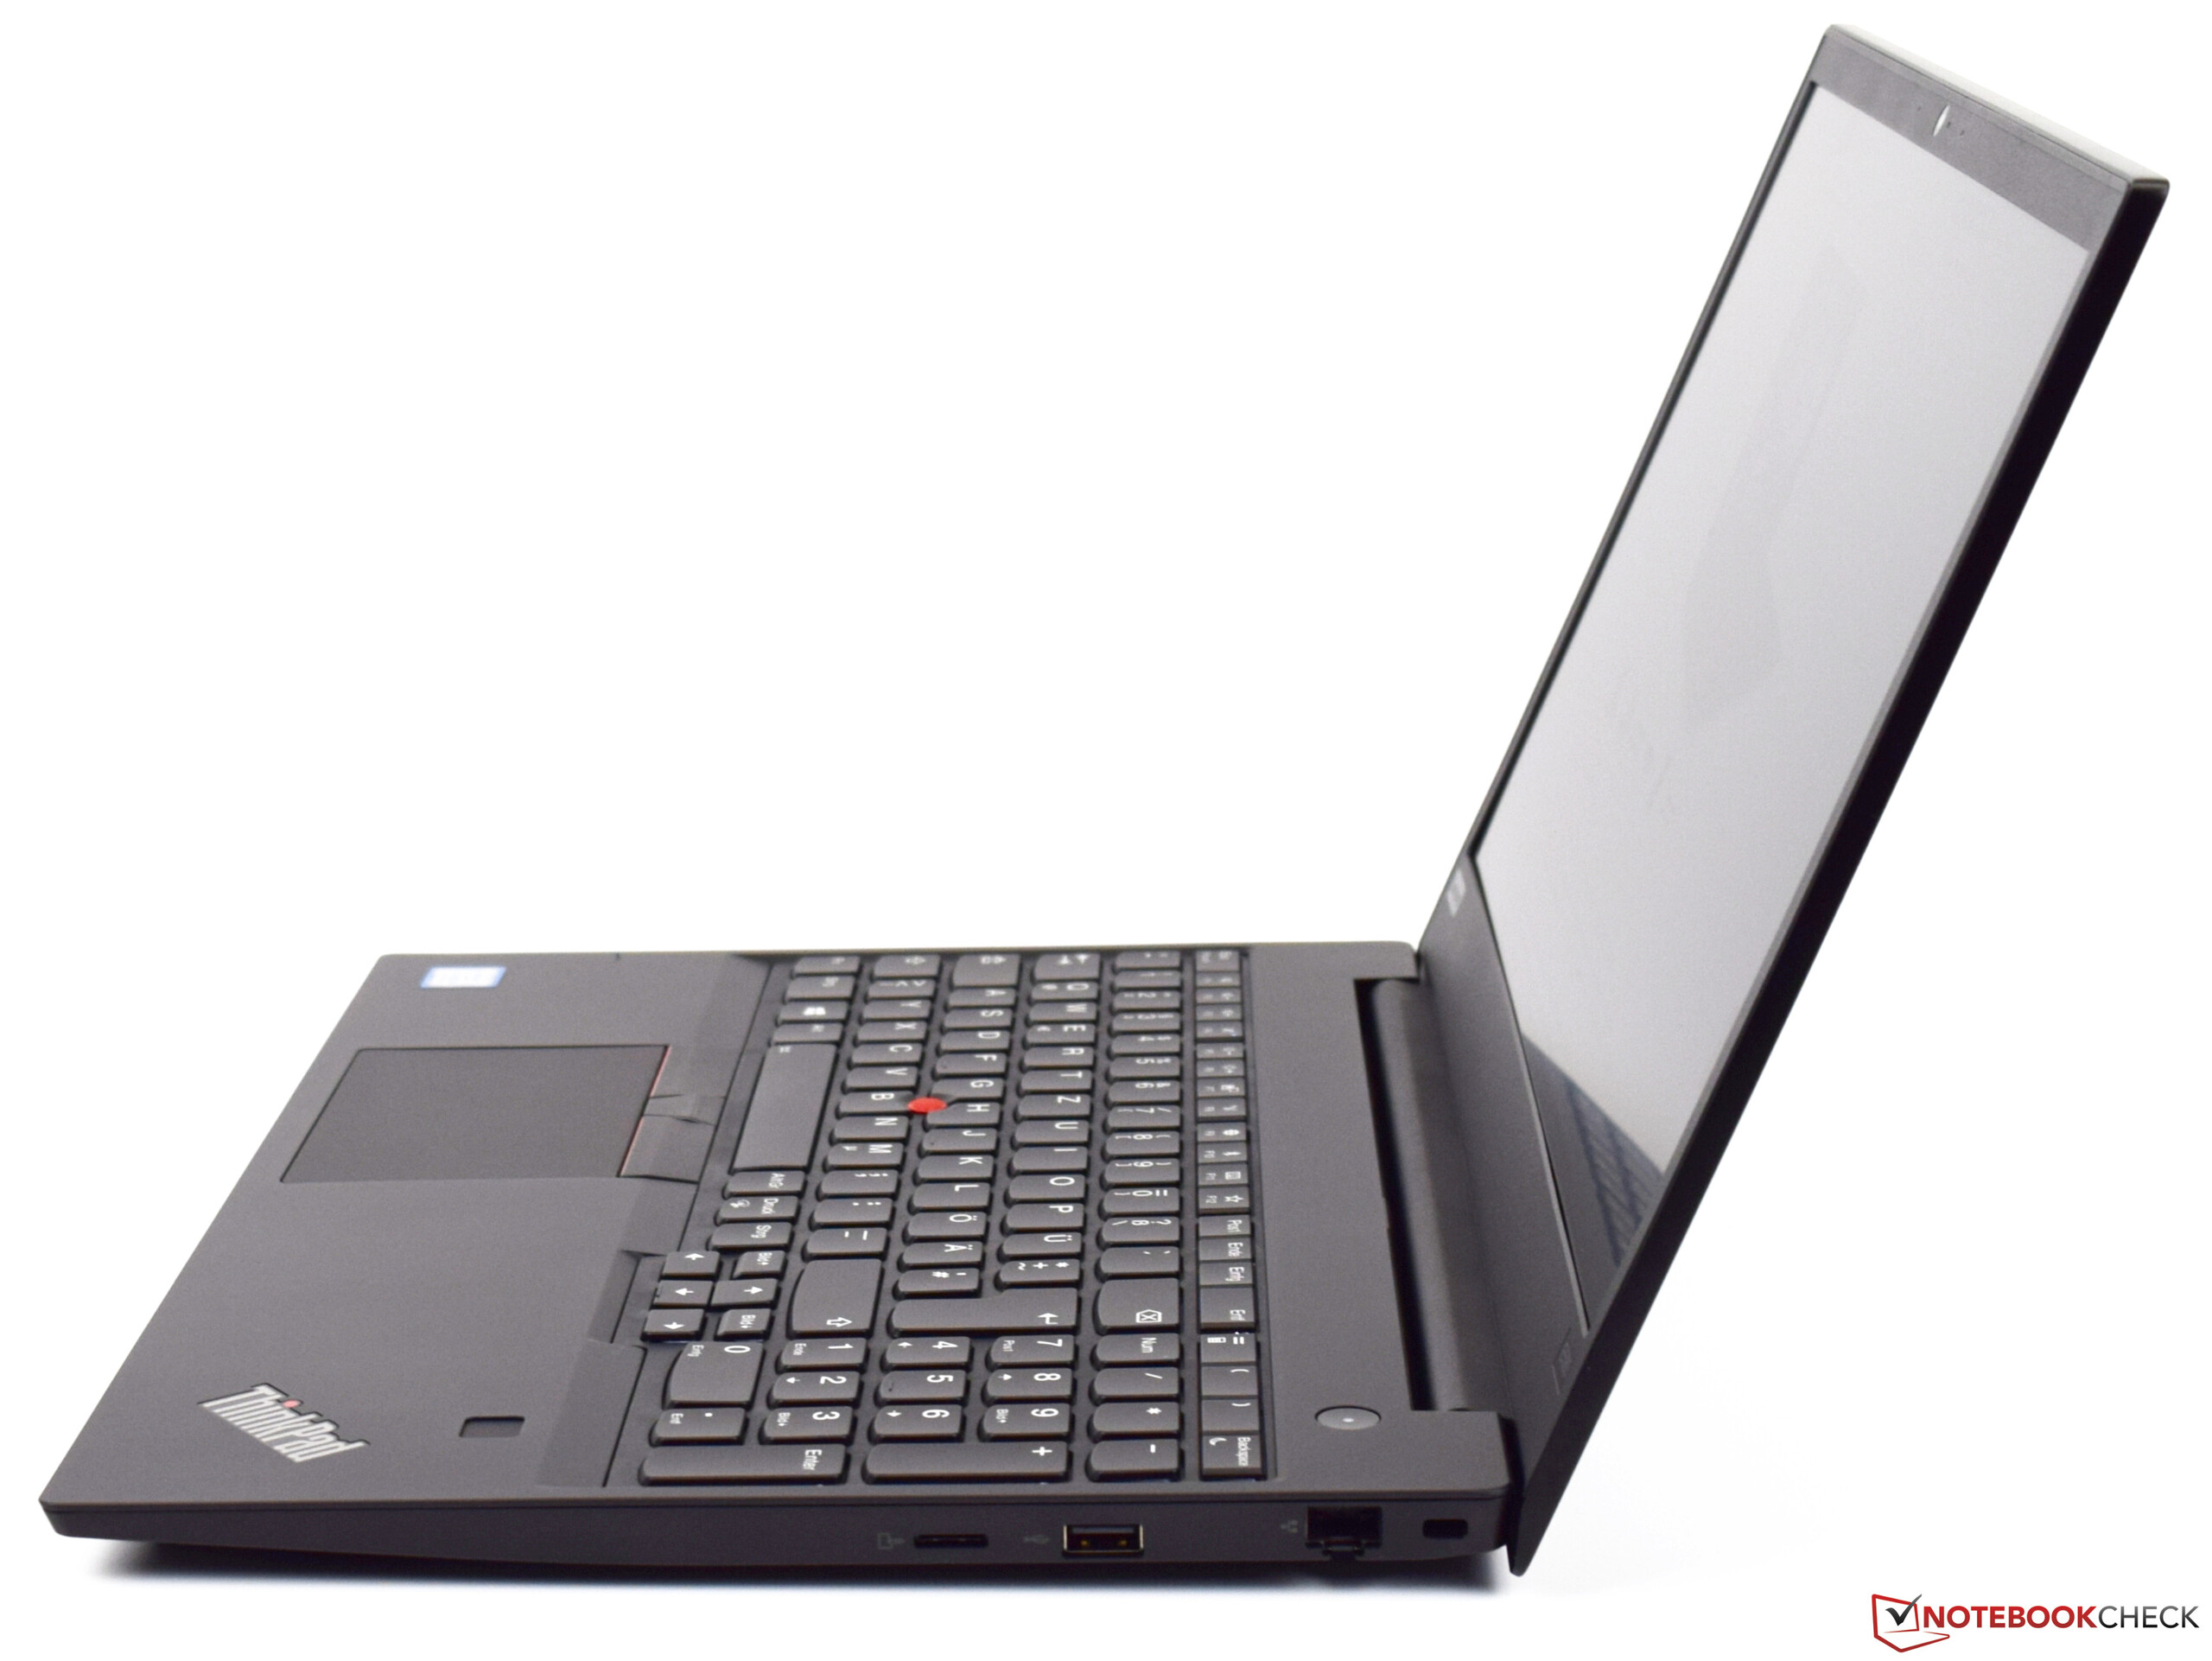
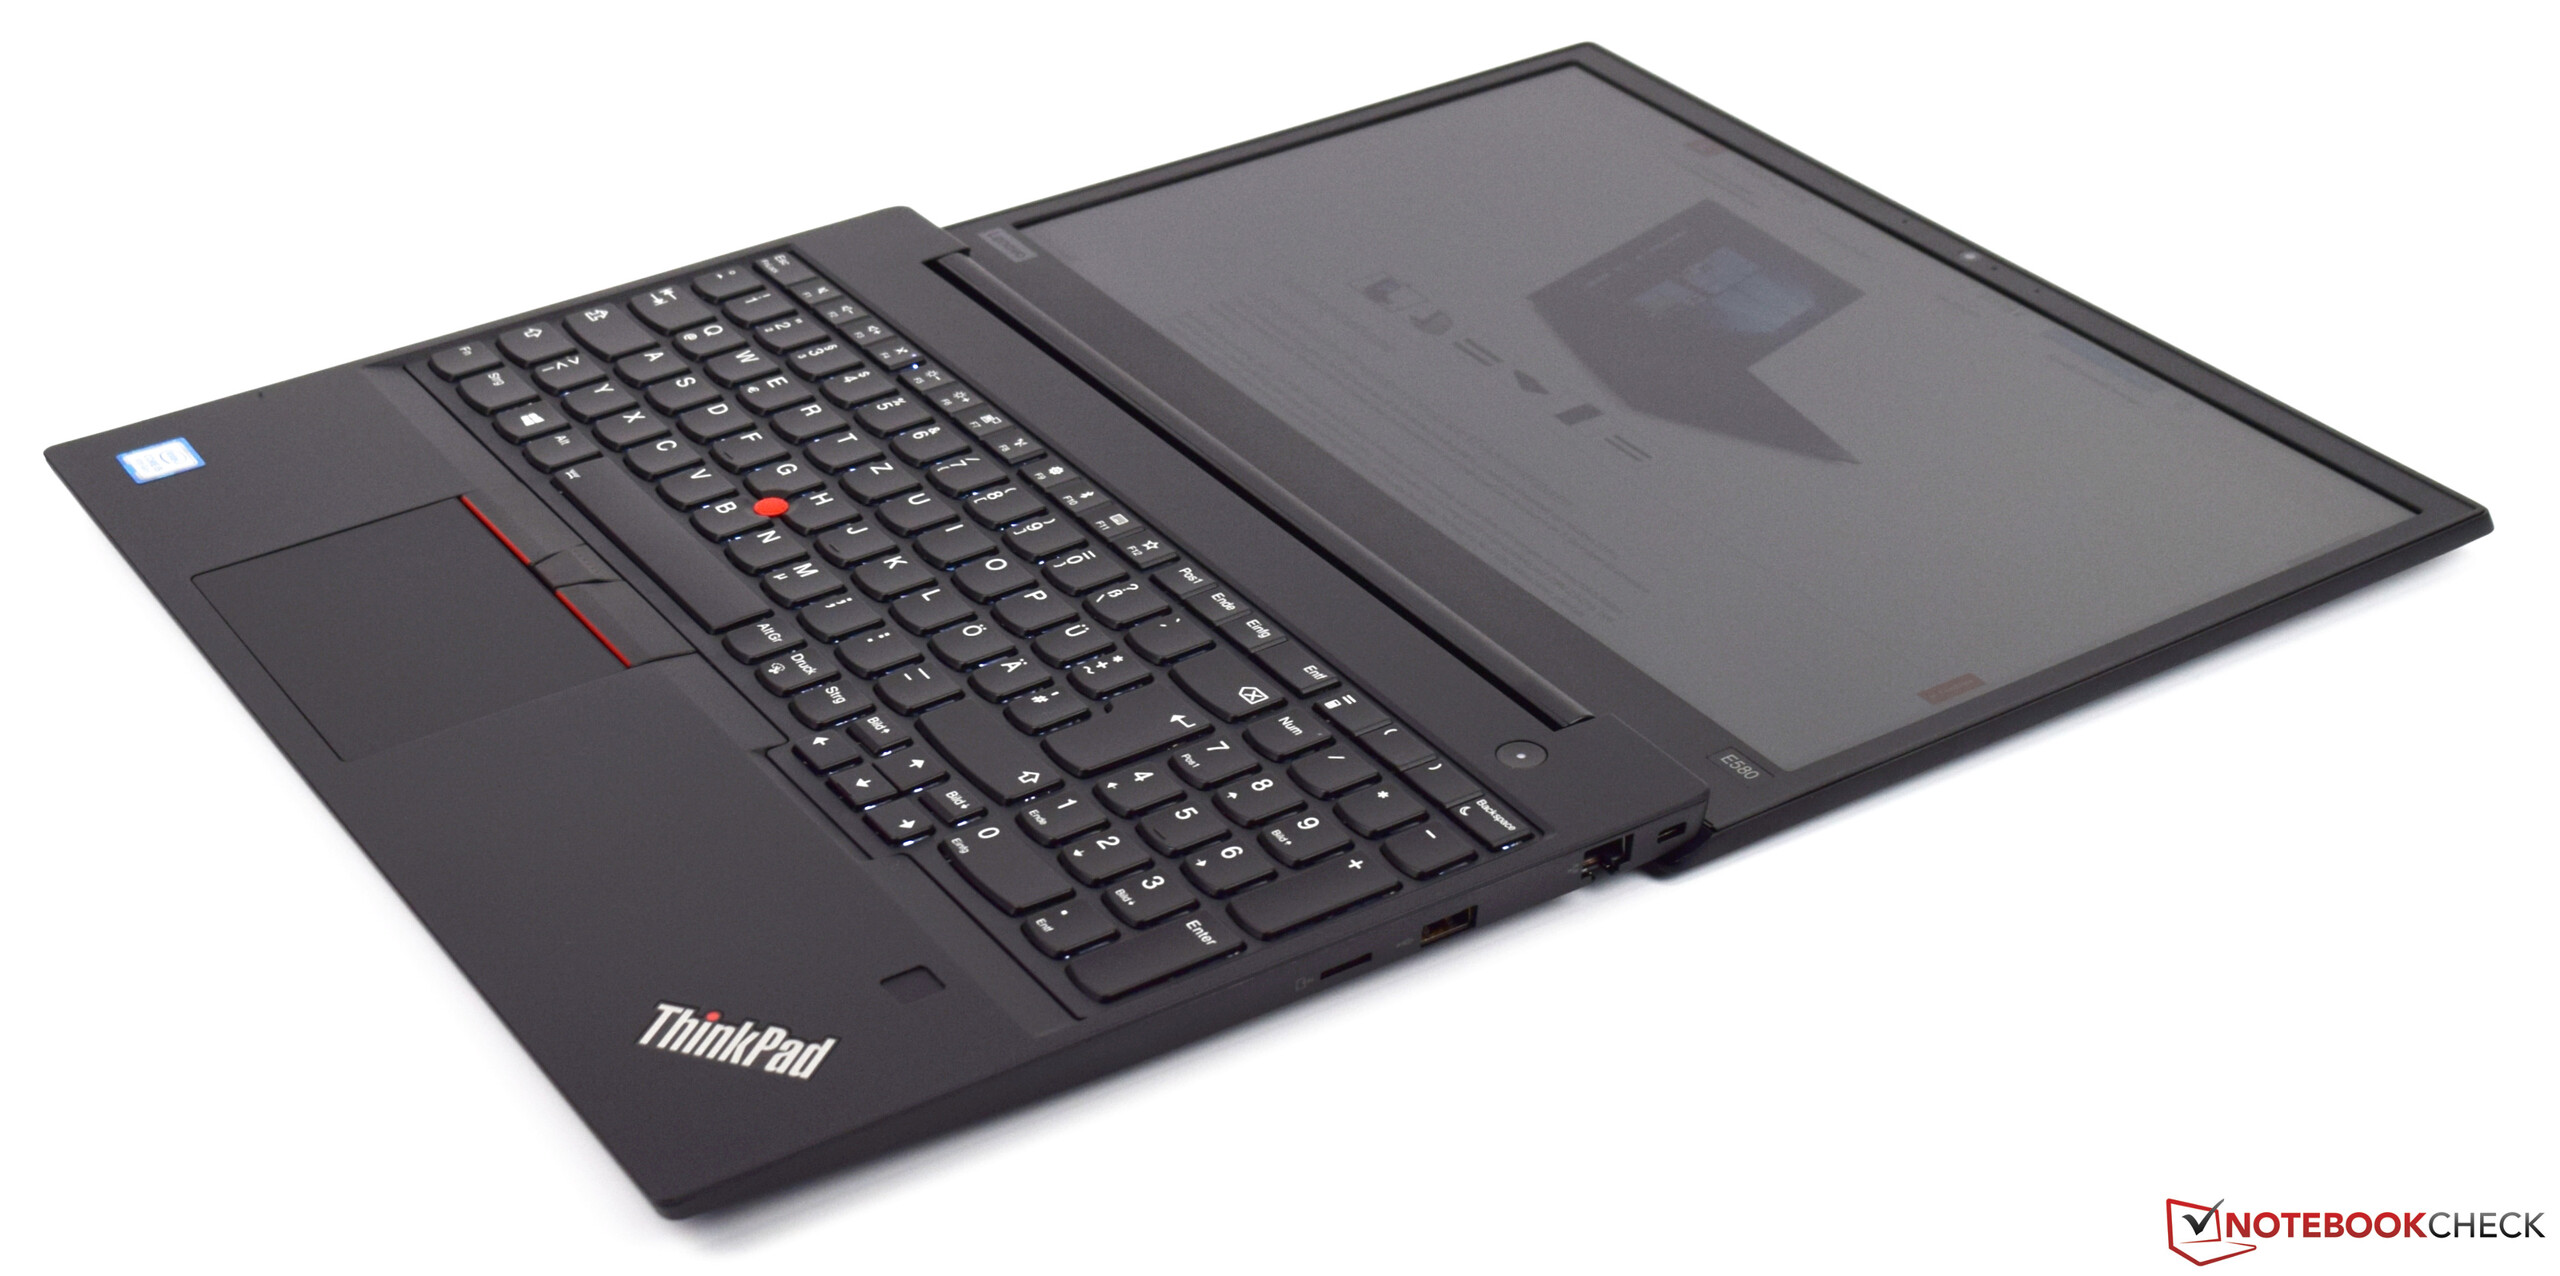
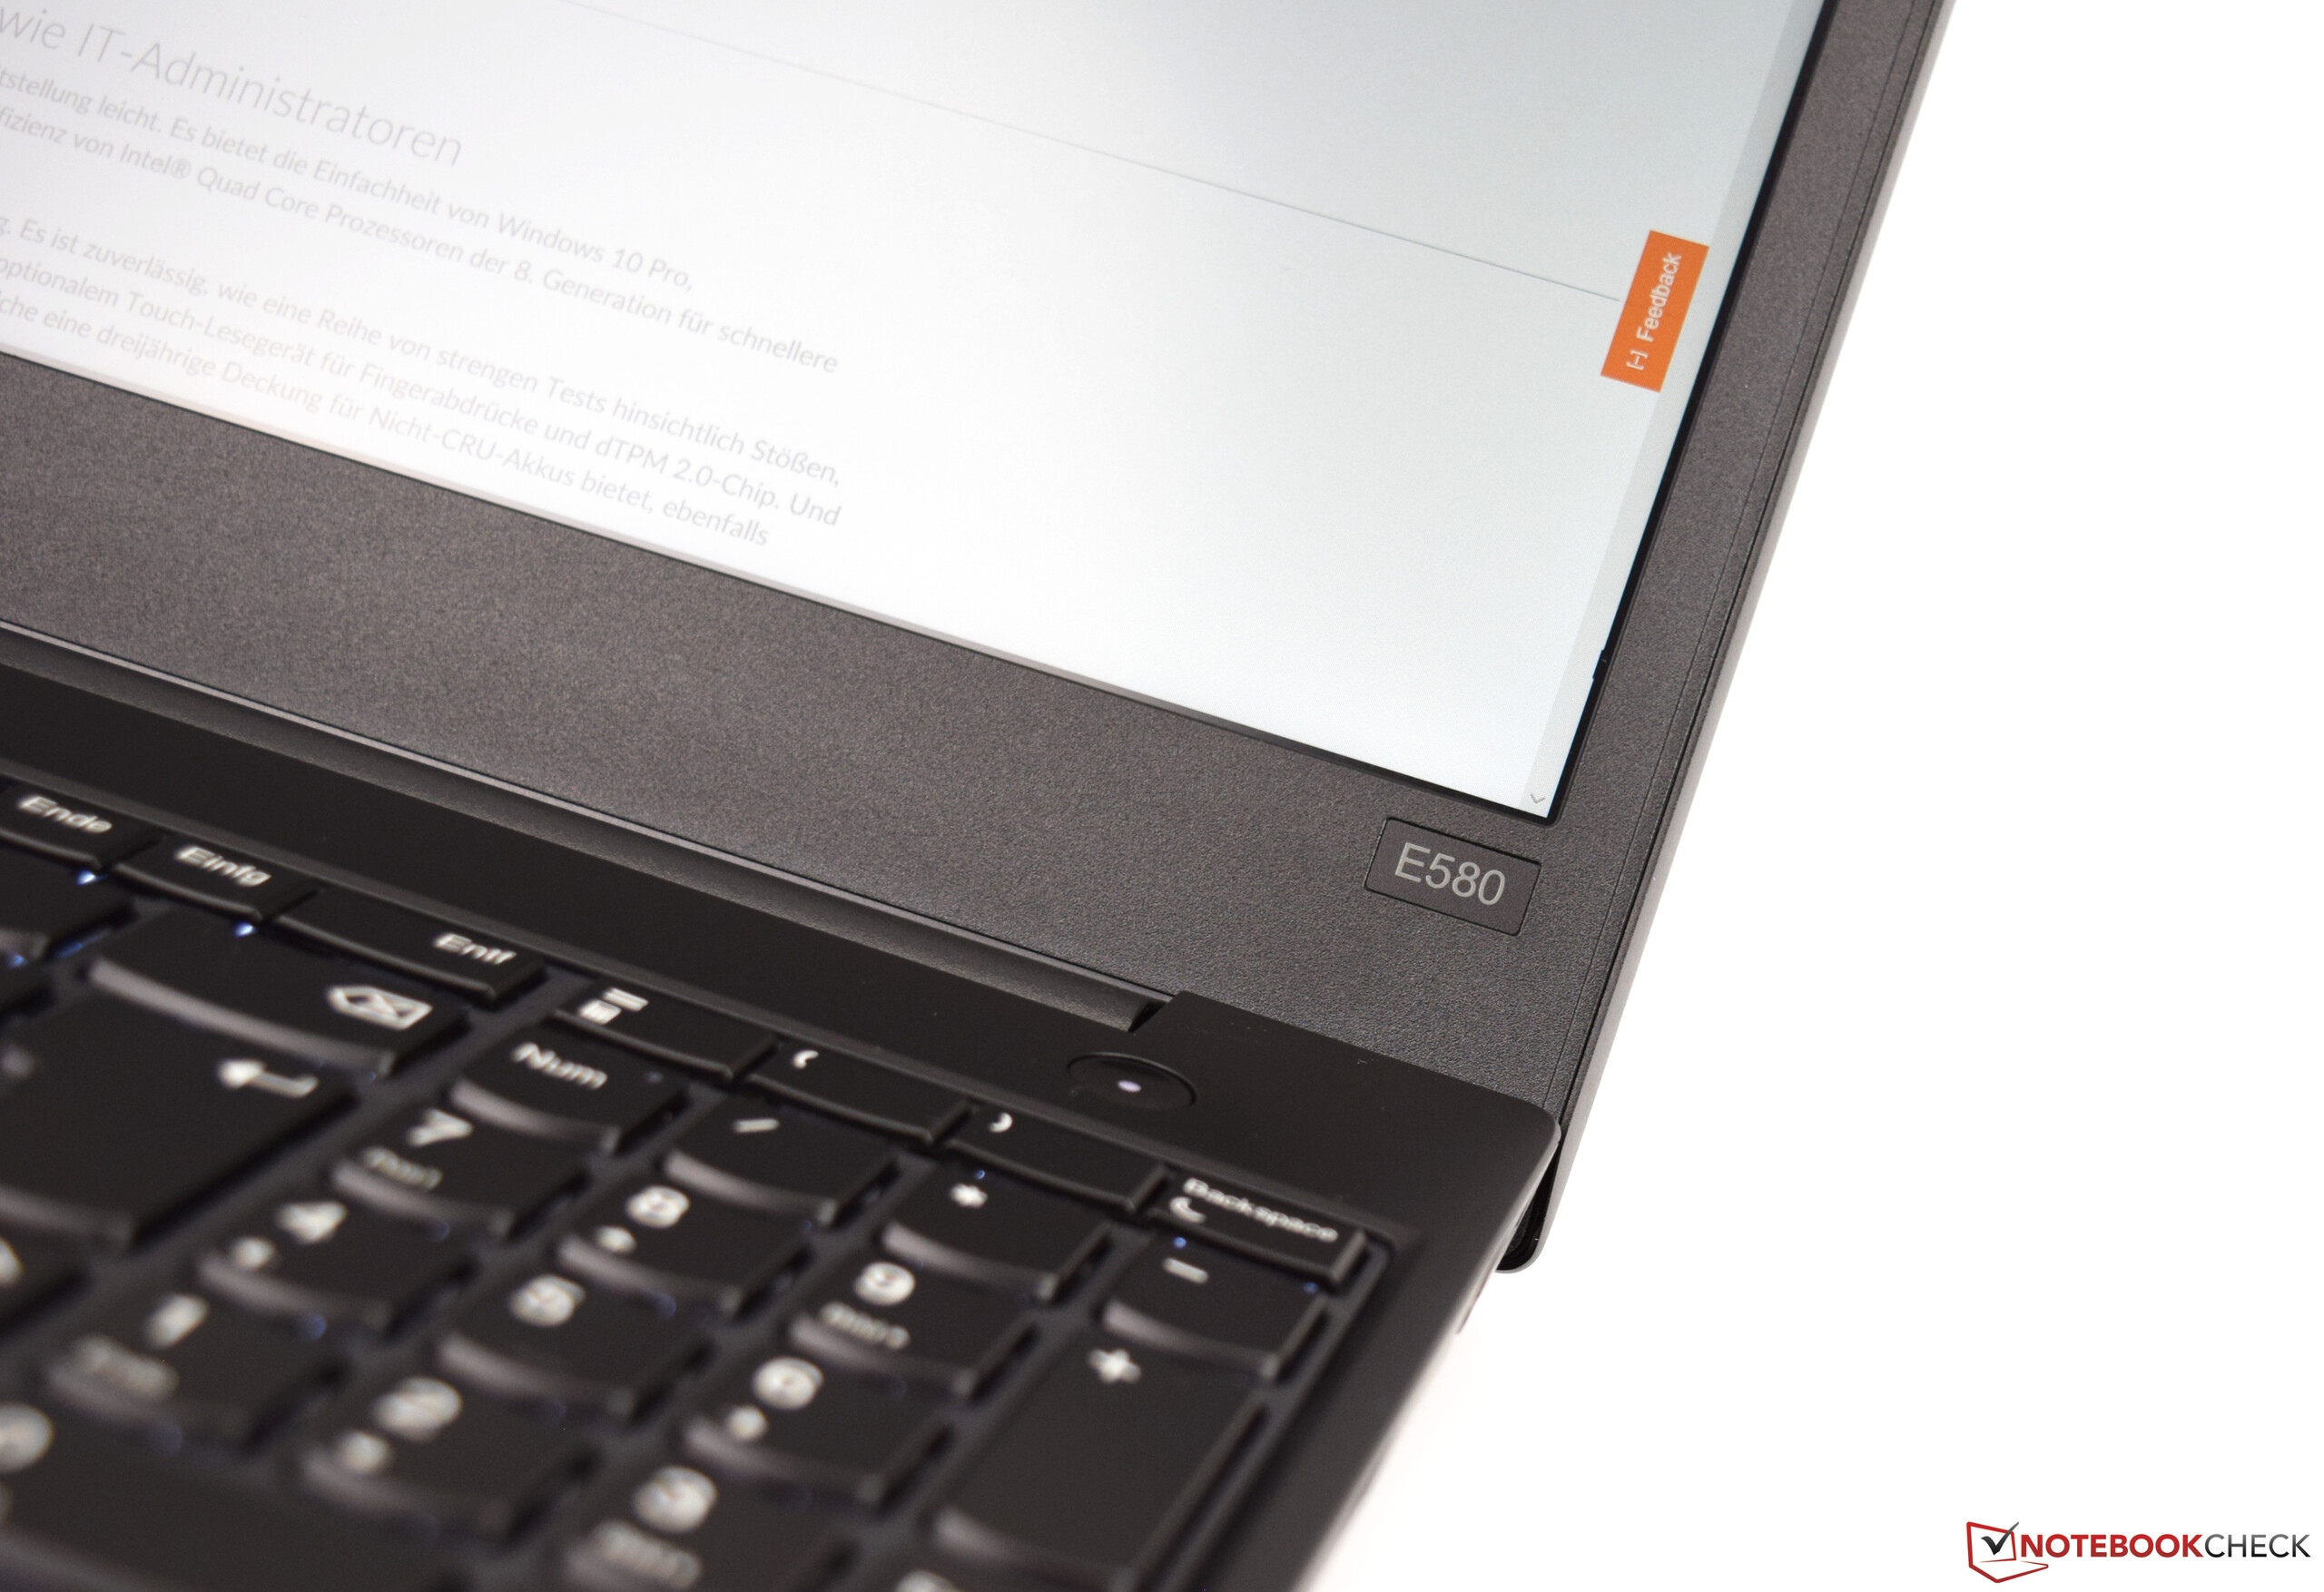
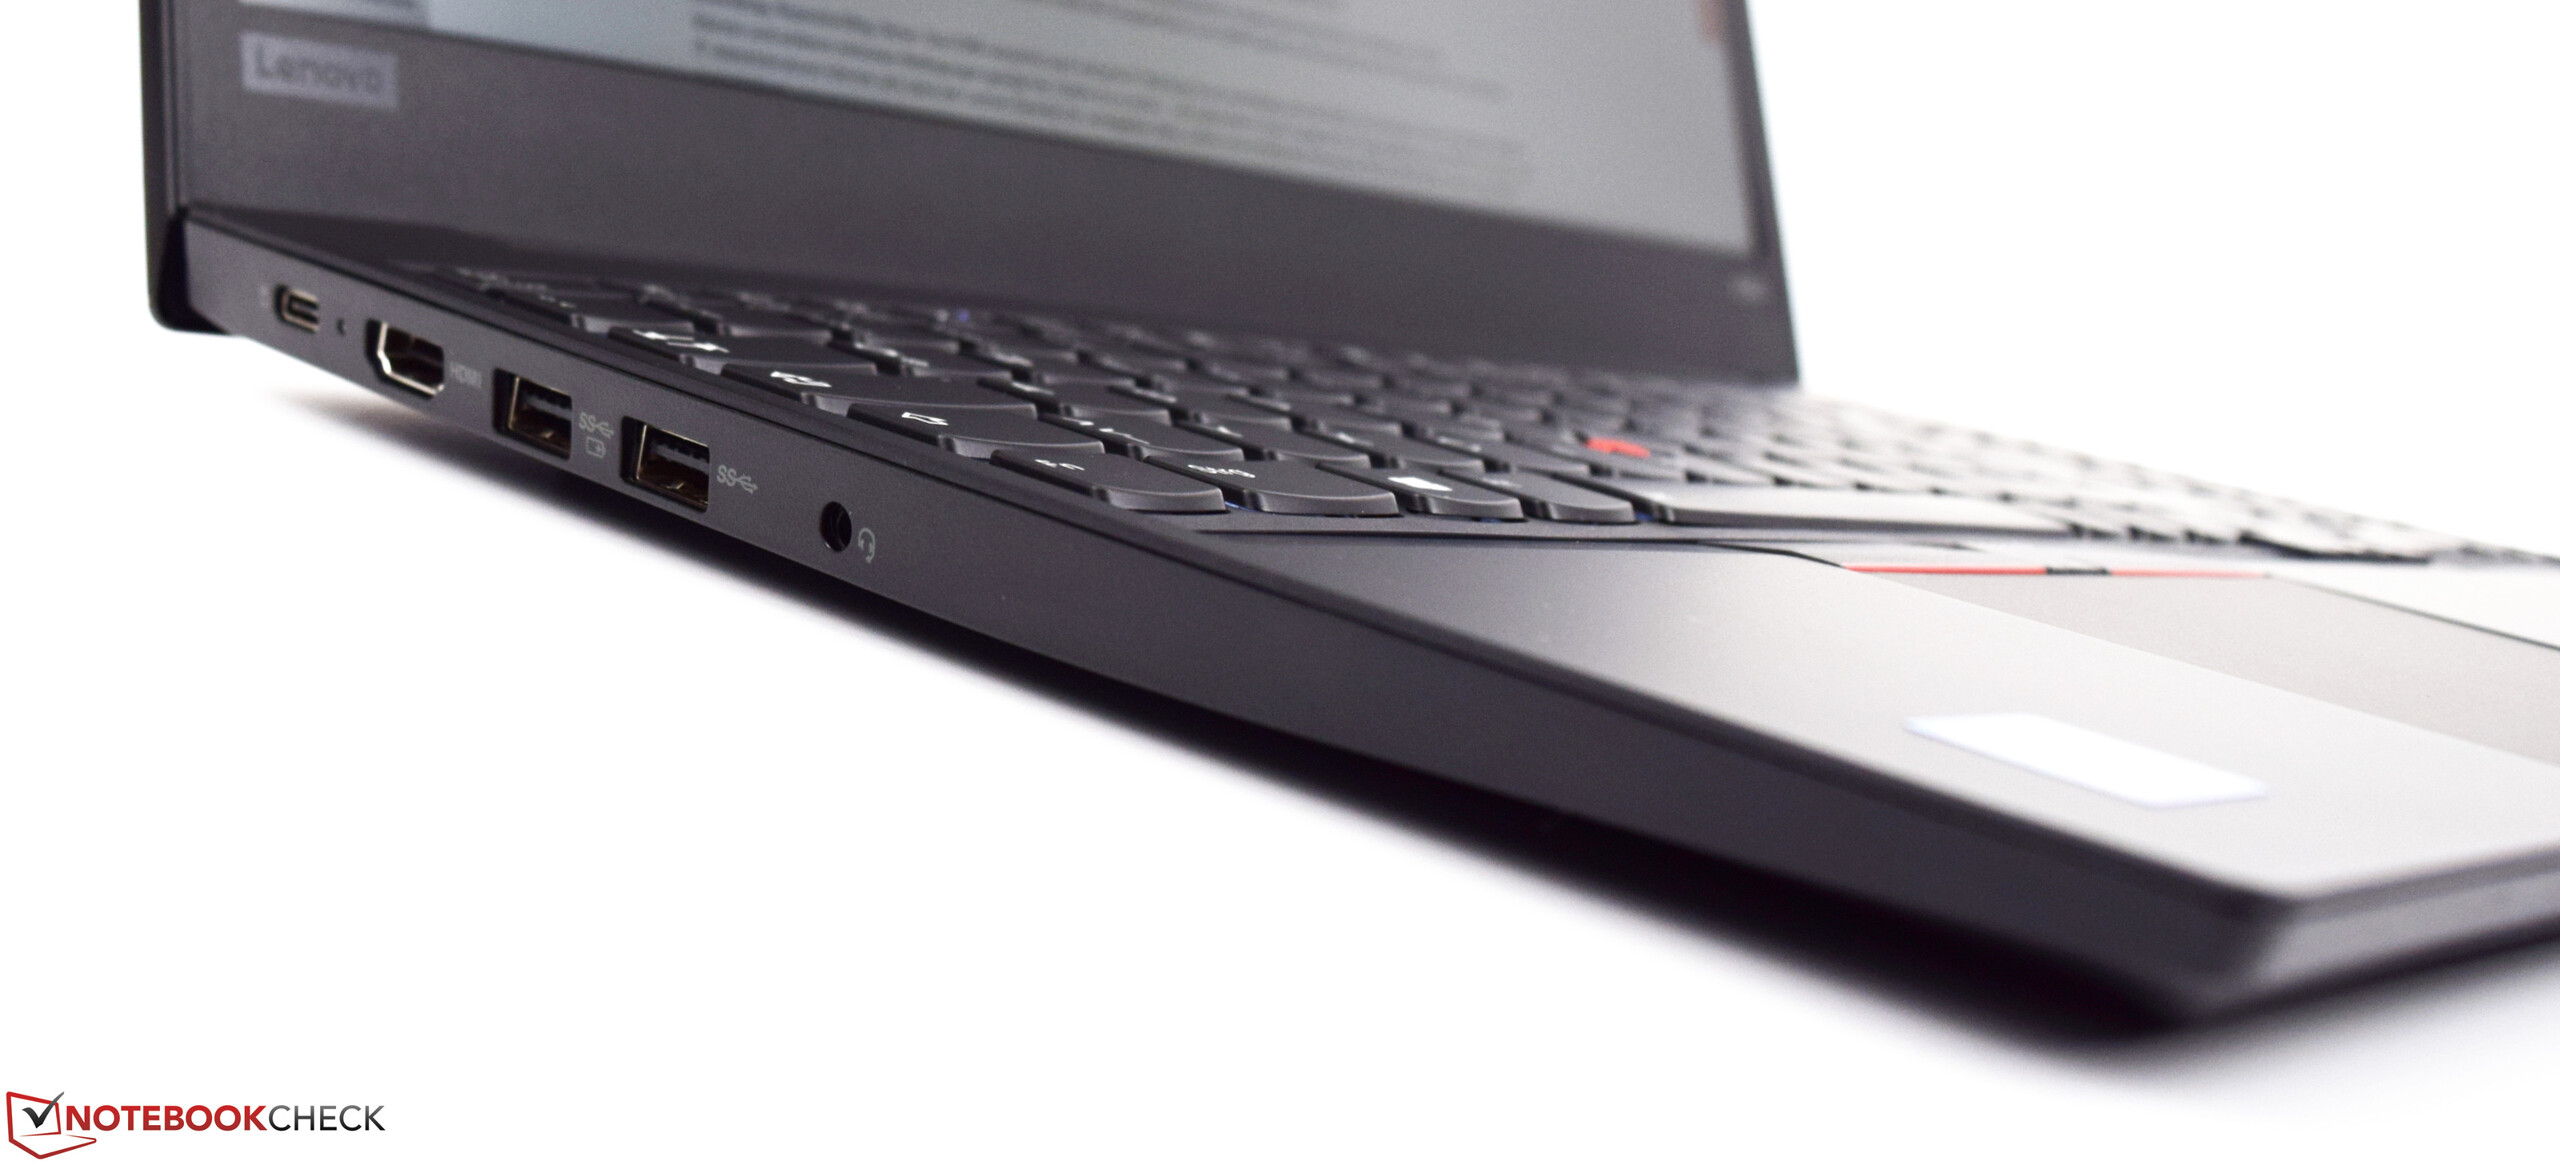
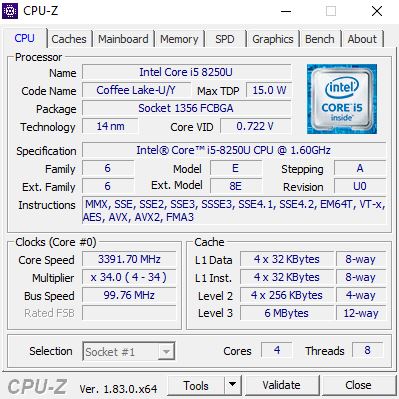
O Lenovo ThinkPad E580 é um portátil de escritório acessível de nível de entrada, equipado com um poderoso e moderno processador Intel Core i5-8250U. 8 GB de RAM DDR4 devem ser suficientes para tarefas de escritório diárias, e o SSD de 128 GB pode parecer espaçoso o suficiente agora, mas provavelmente se tornará muito pequeno com o tempo. Um SSD de 256 GB seria, portanto, uma escolha melhor. No entanto, o modelo de 128 GB é suficiente para começar. O painel IPS é particularmente digno, especialmente considerando o preço baixo do portátil. Os portáteis de escritório mais acessíveis estão equipados com painéis TN baratos e comparativamente pobres.
O Lenovo ThinkPad E580 tem tudo o que você precisa em um portátil de escritório acessível. A capacidade limitada de armazenamento do SSD é um compromisso, mas o desempenho geral foi bastante satisfatório, considerando o baixo preço do portátil. O dispositivo, portanto, definitivamente merece nosso endosso total.
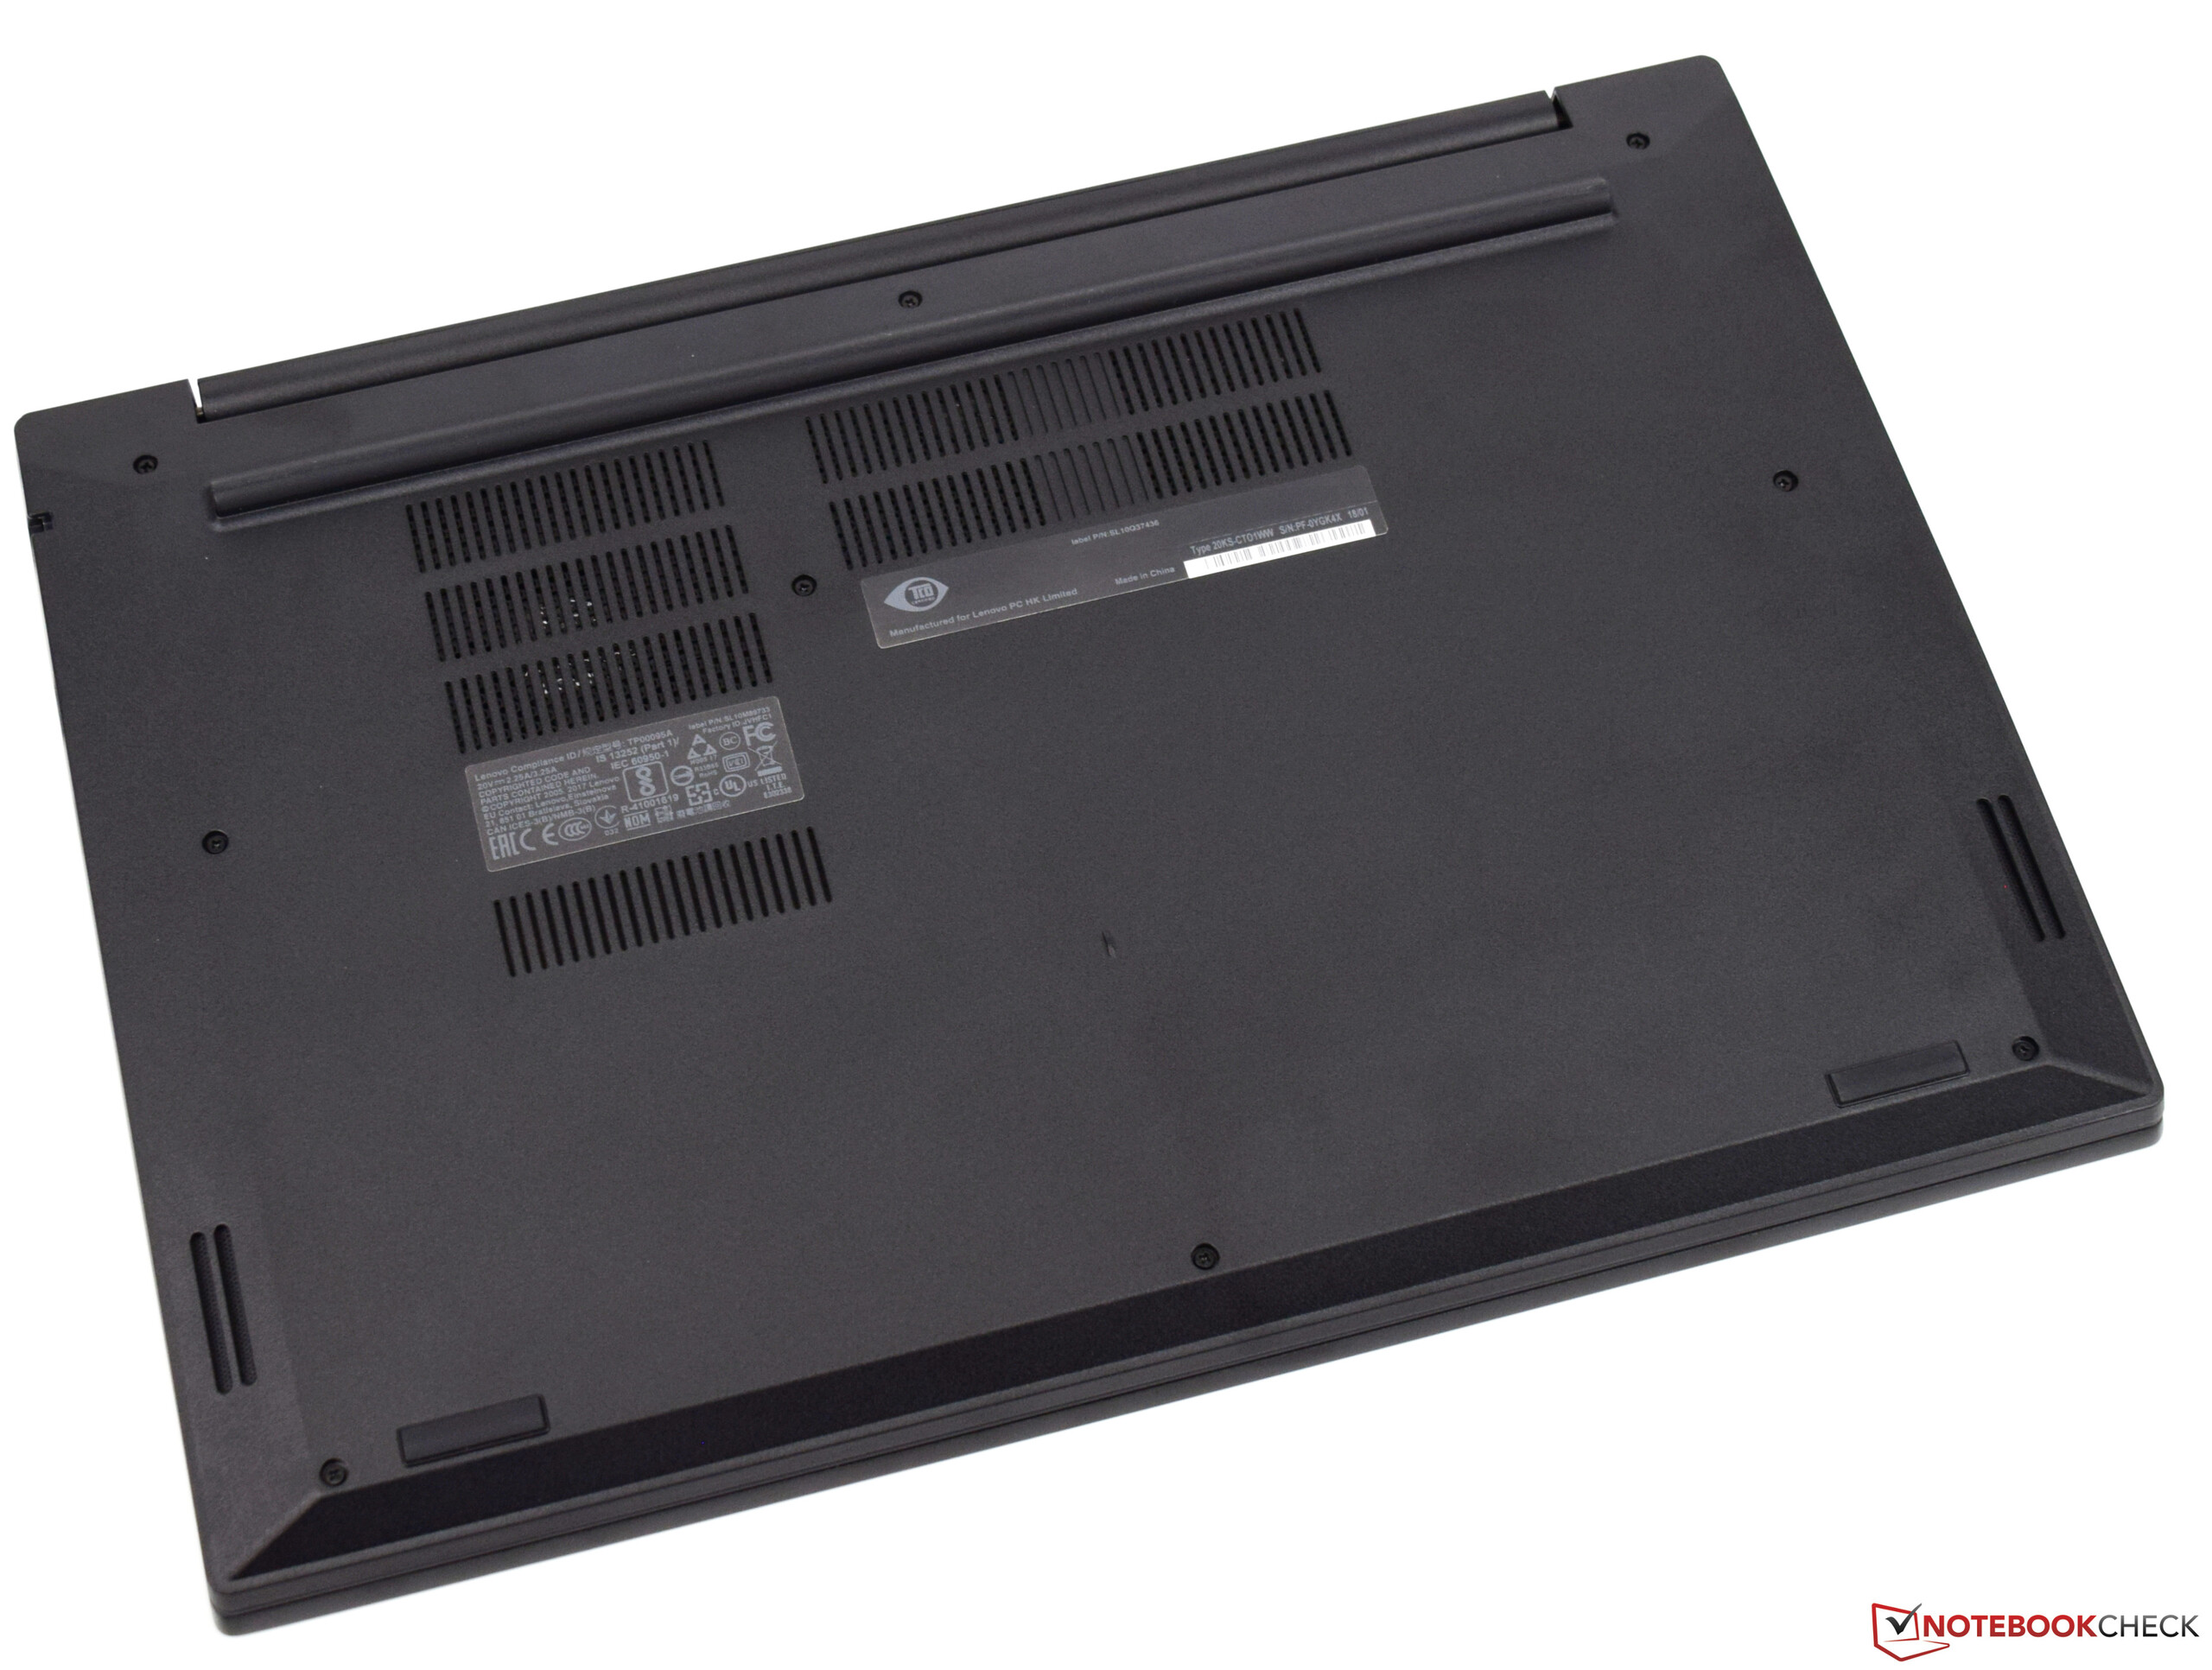
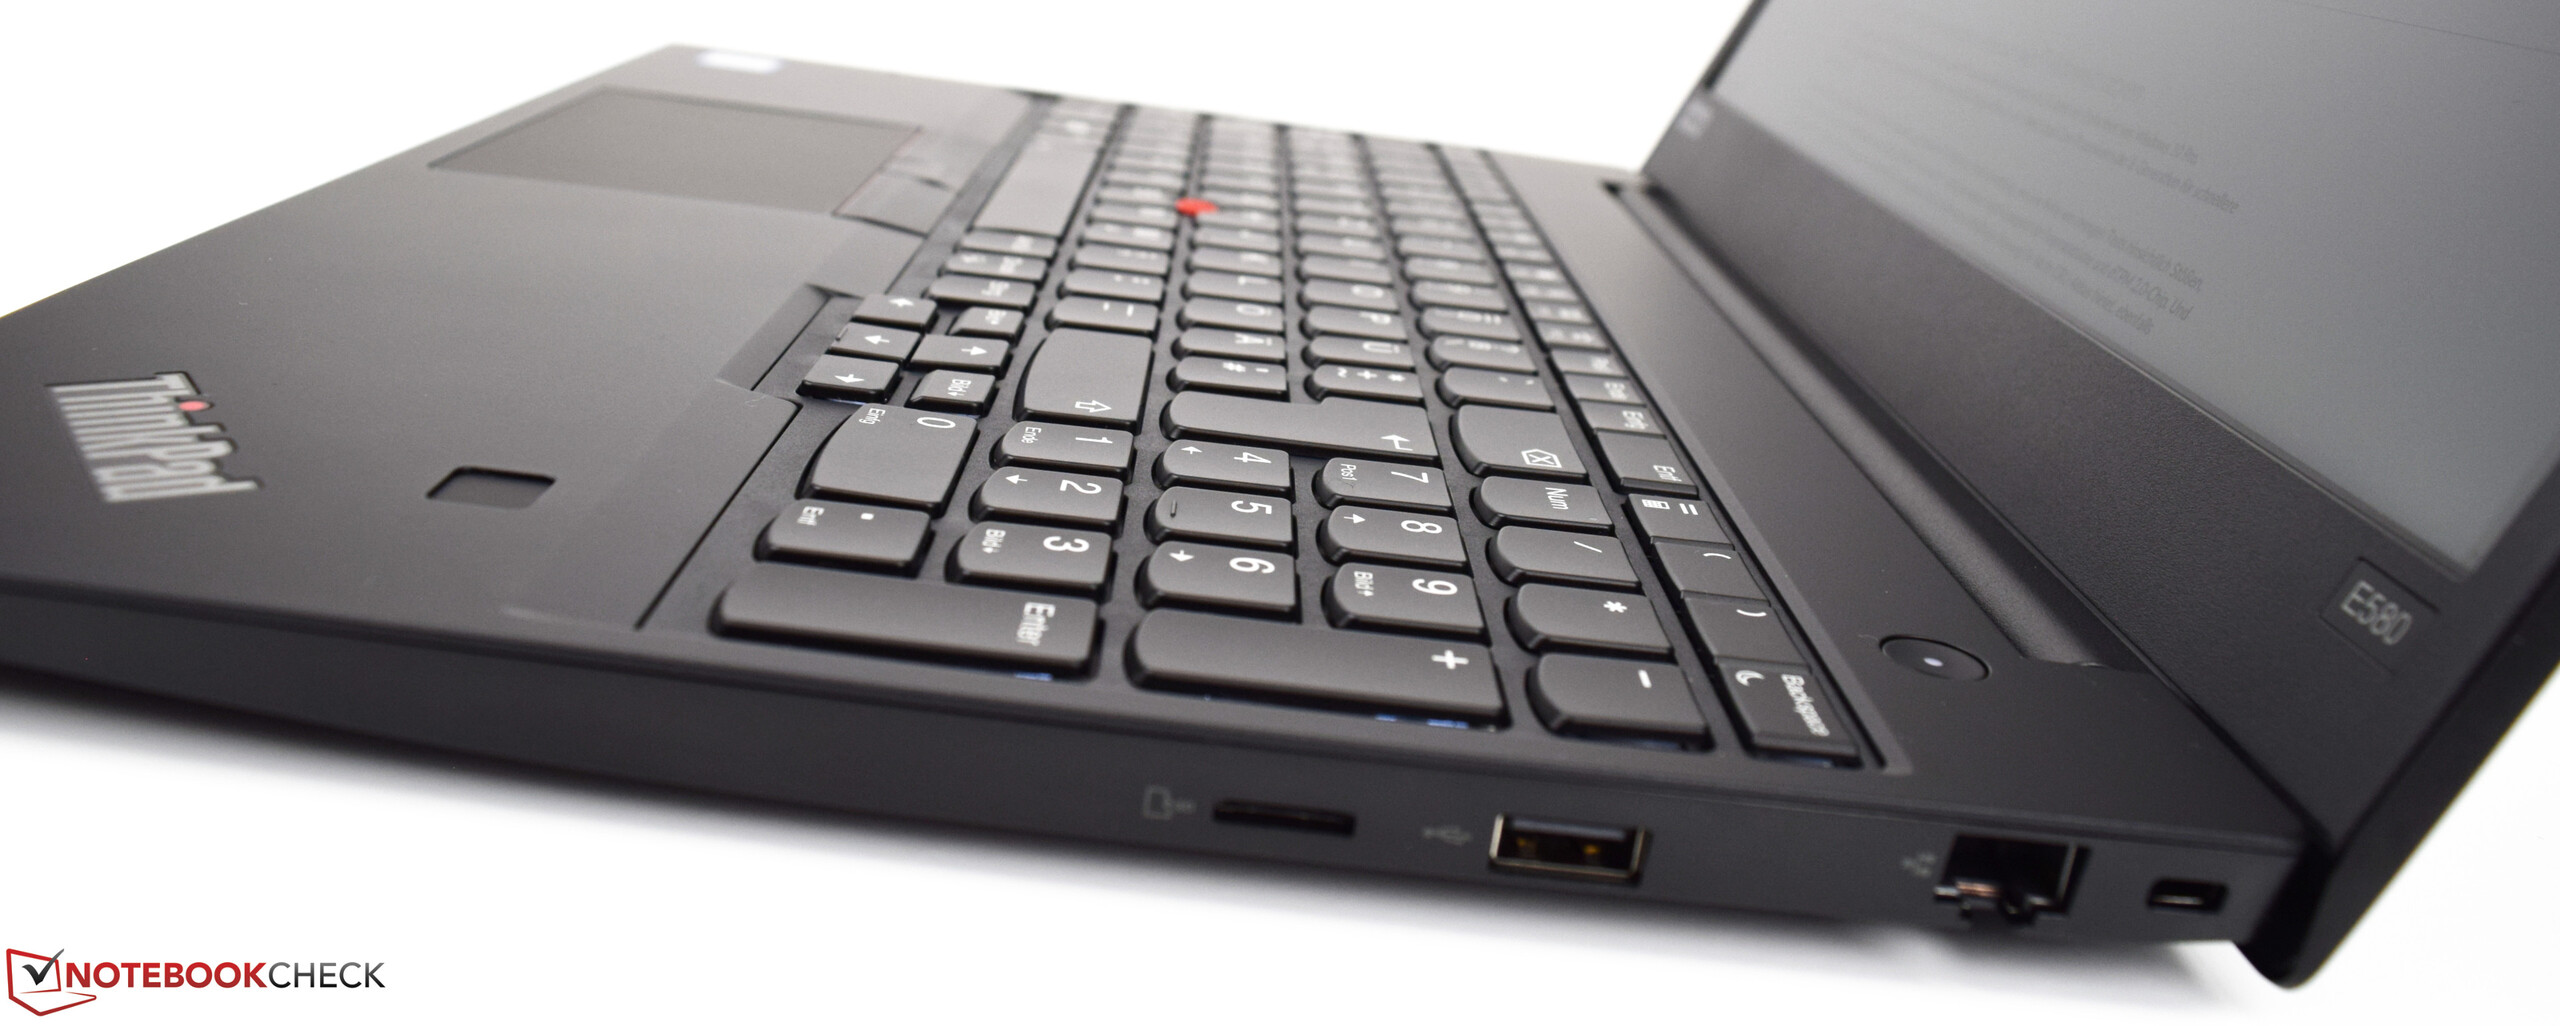
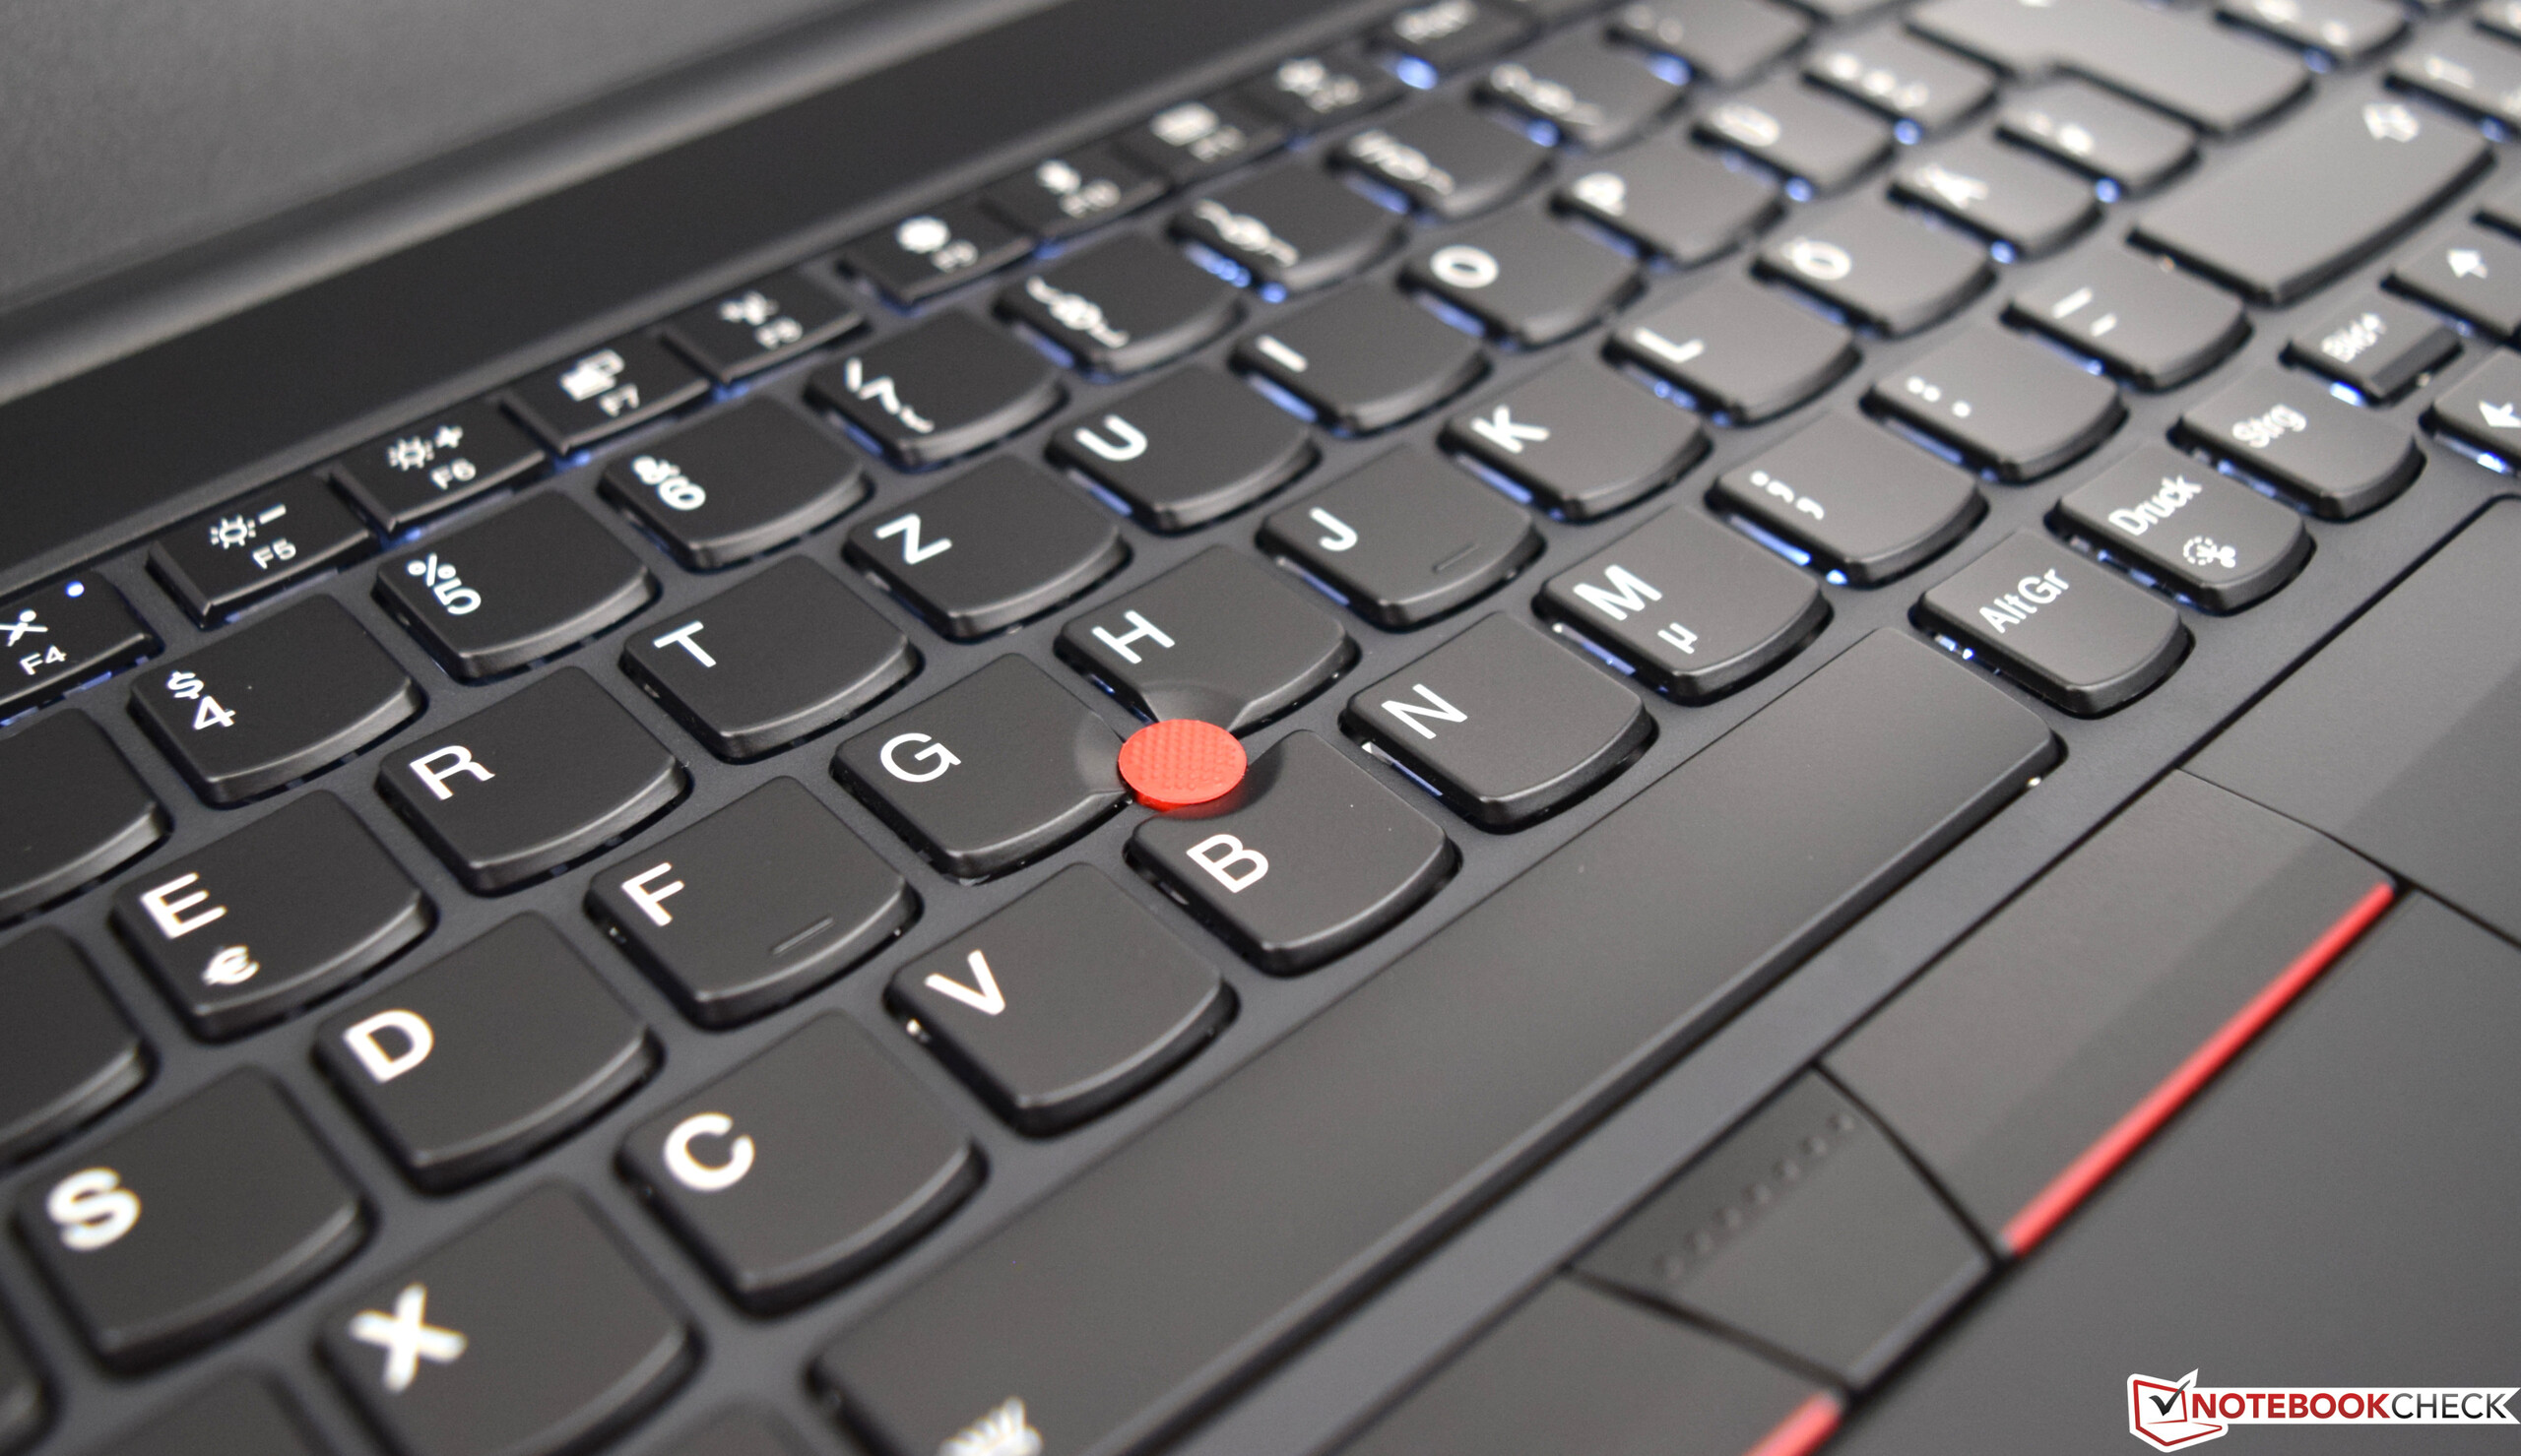
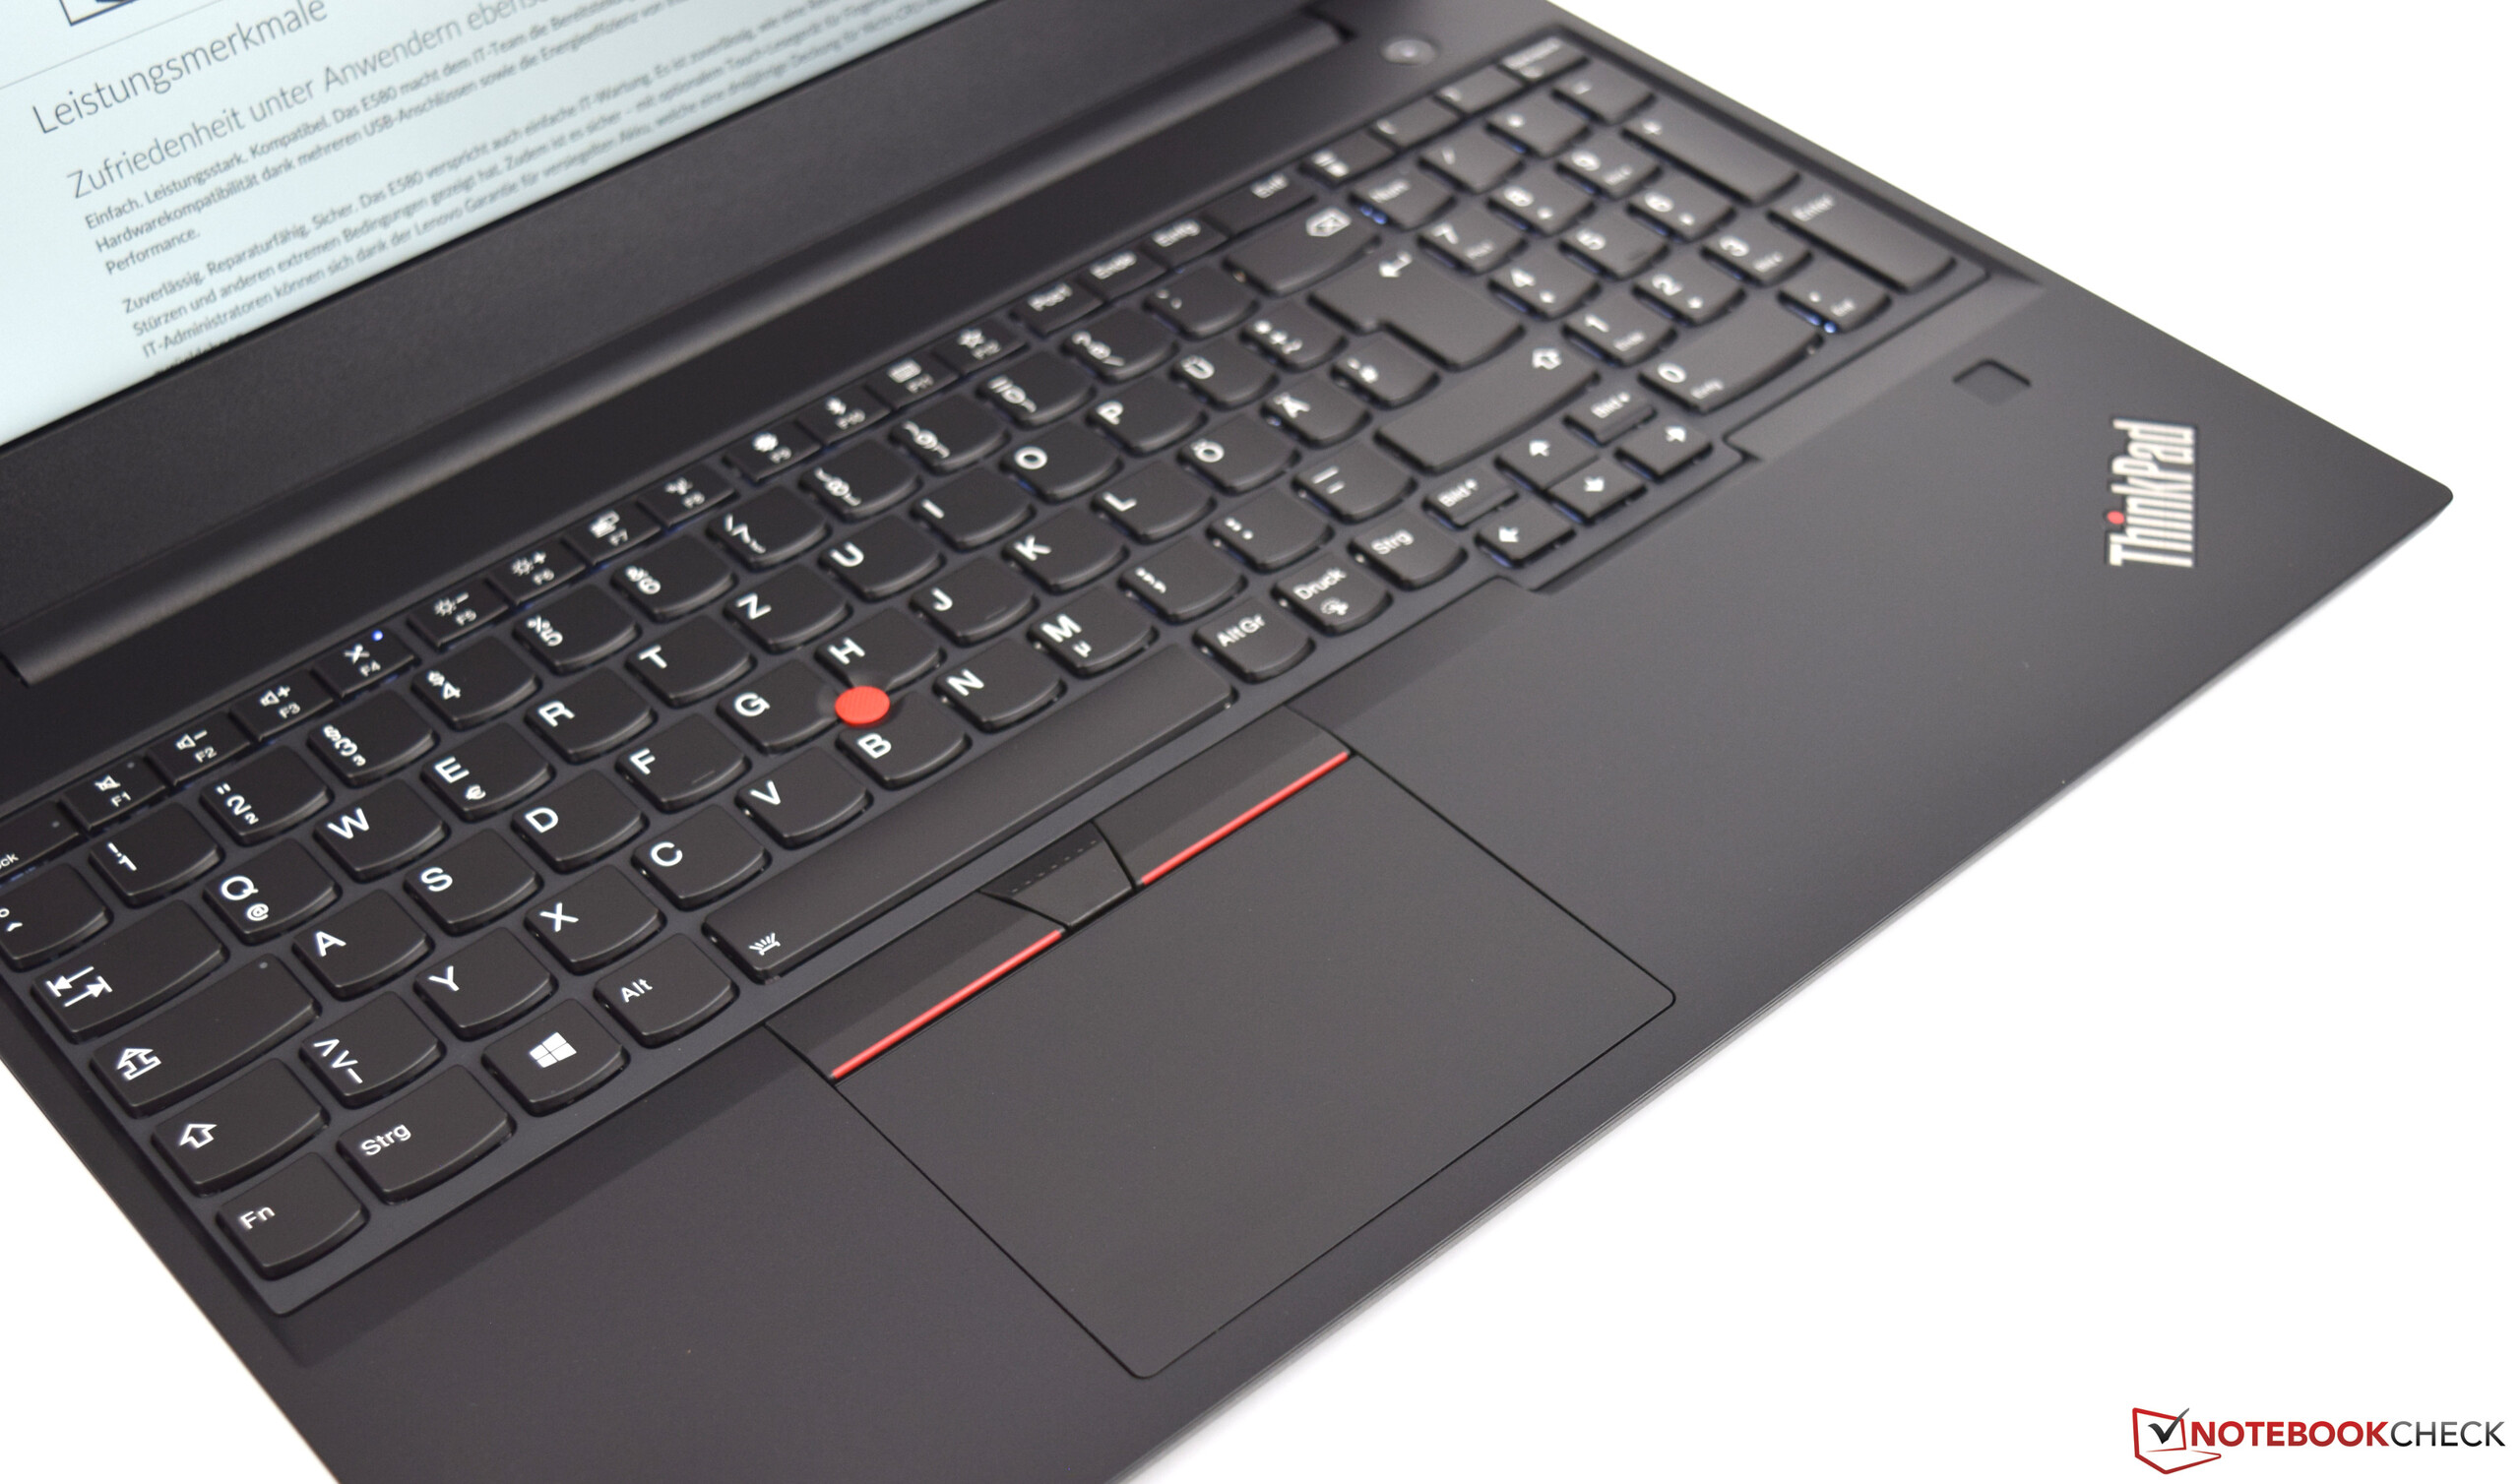
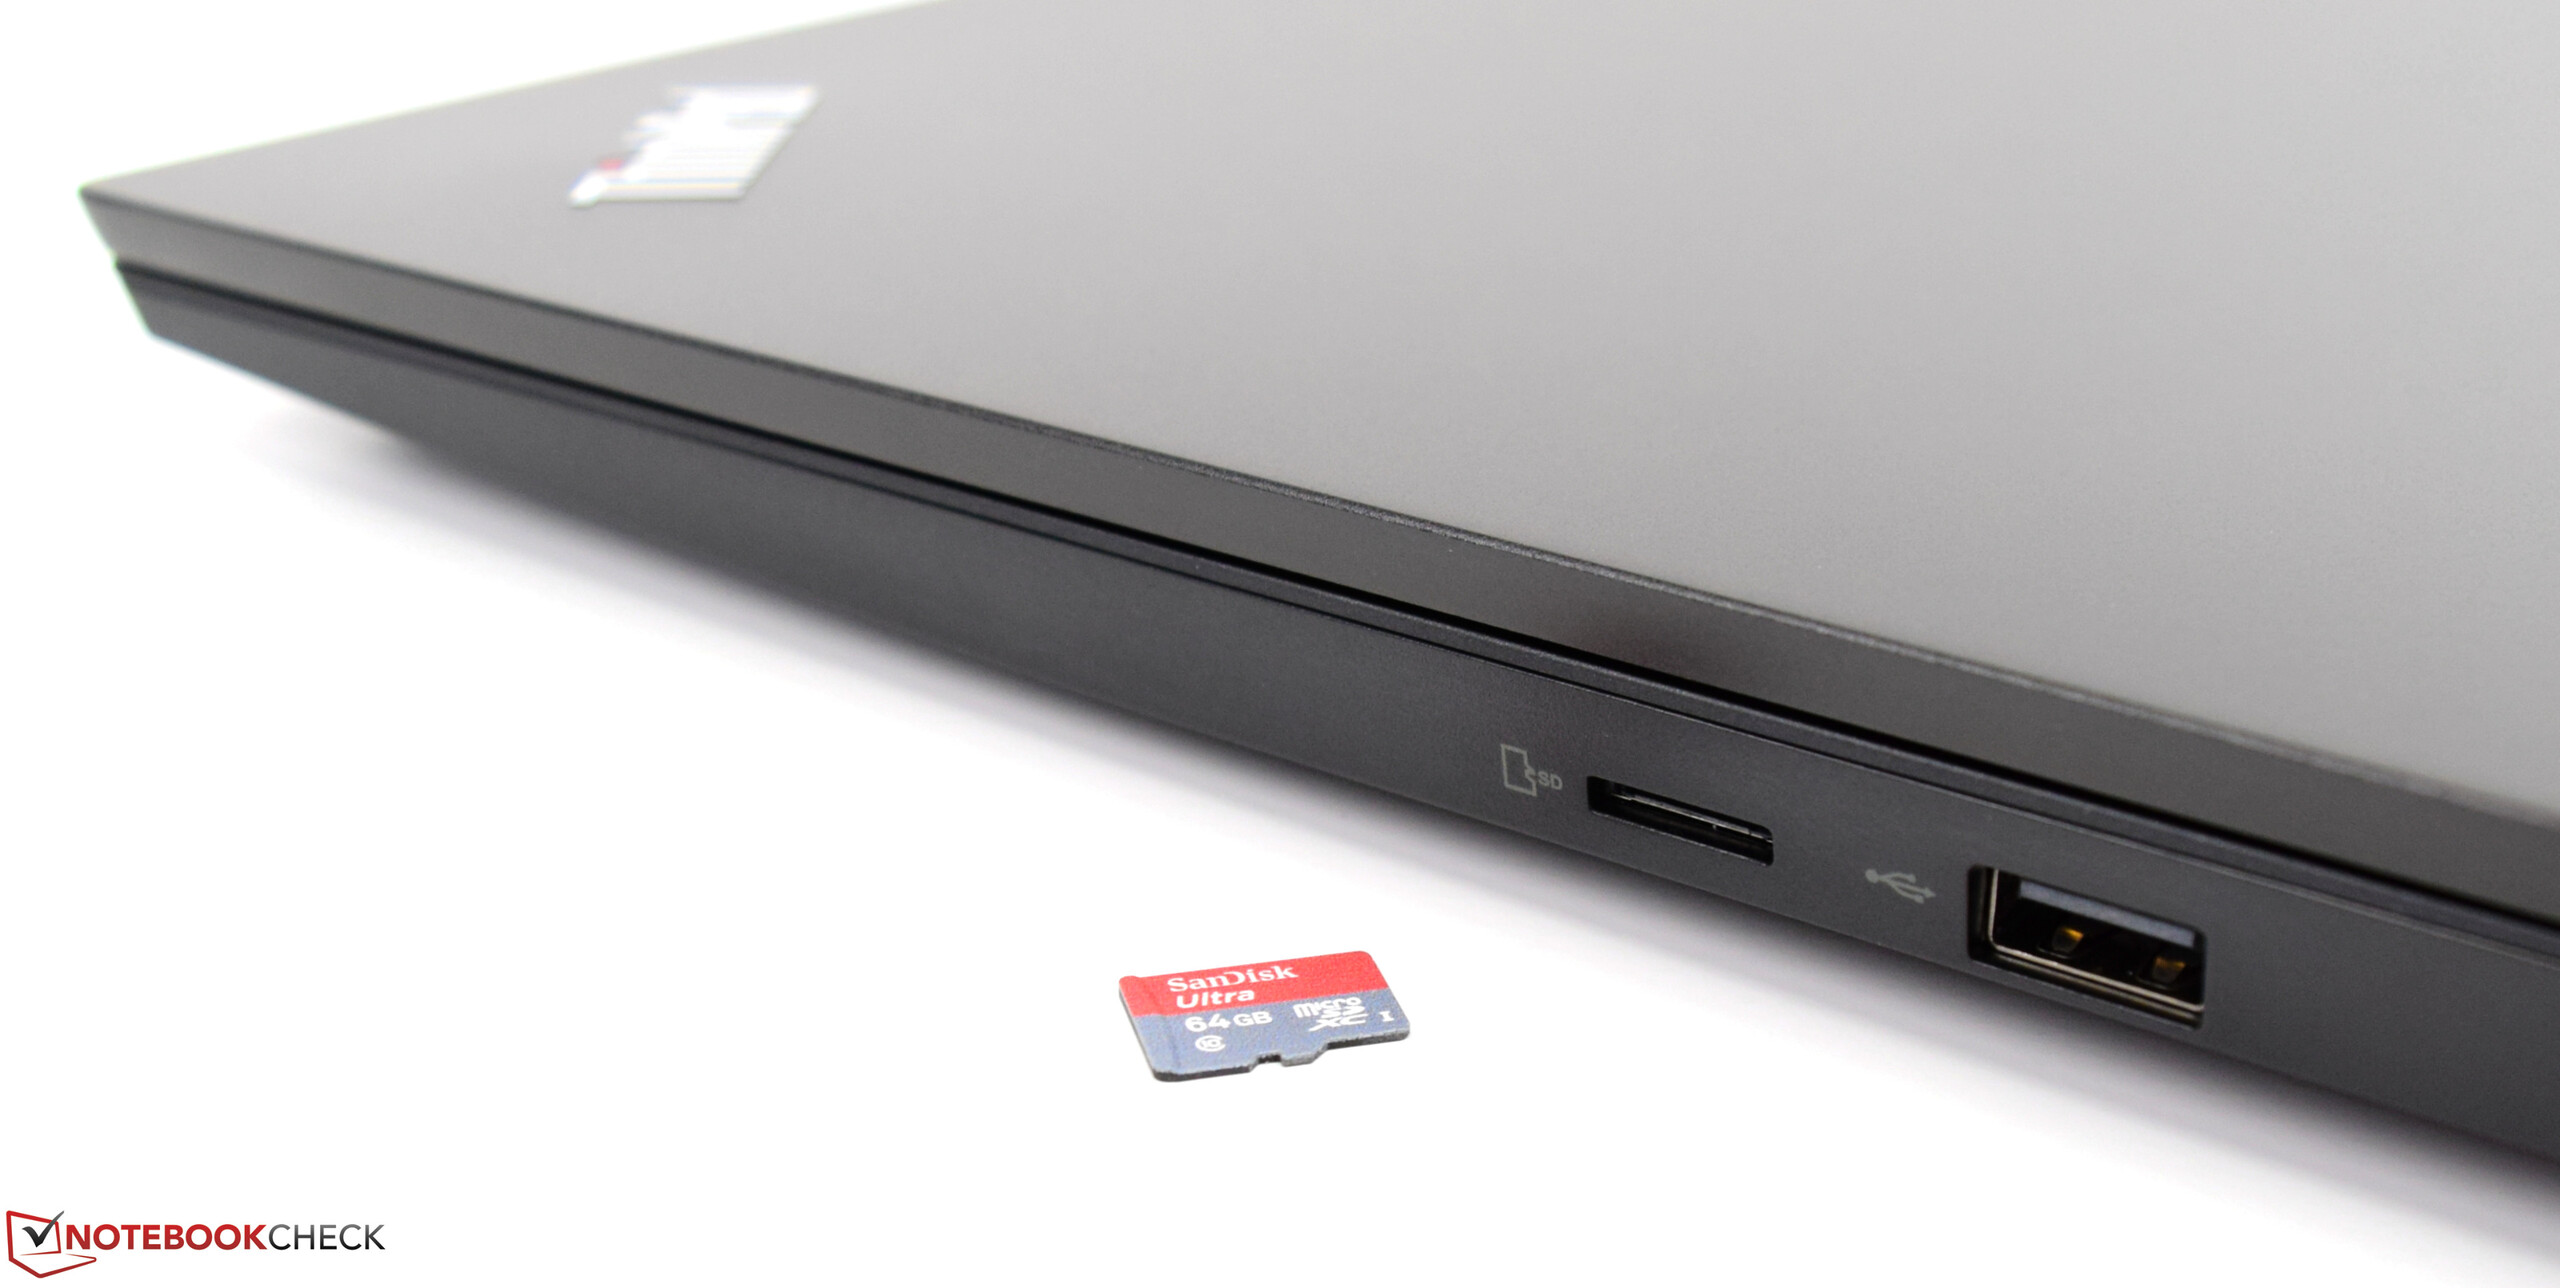
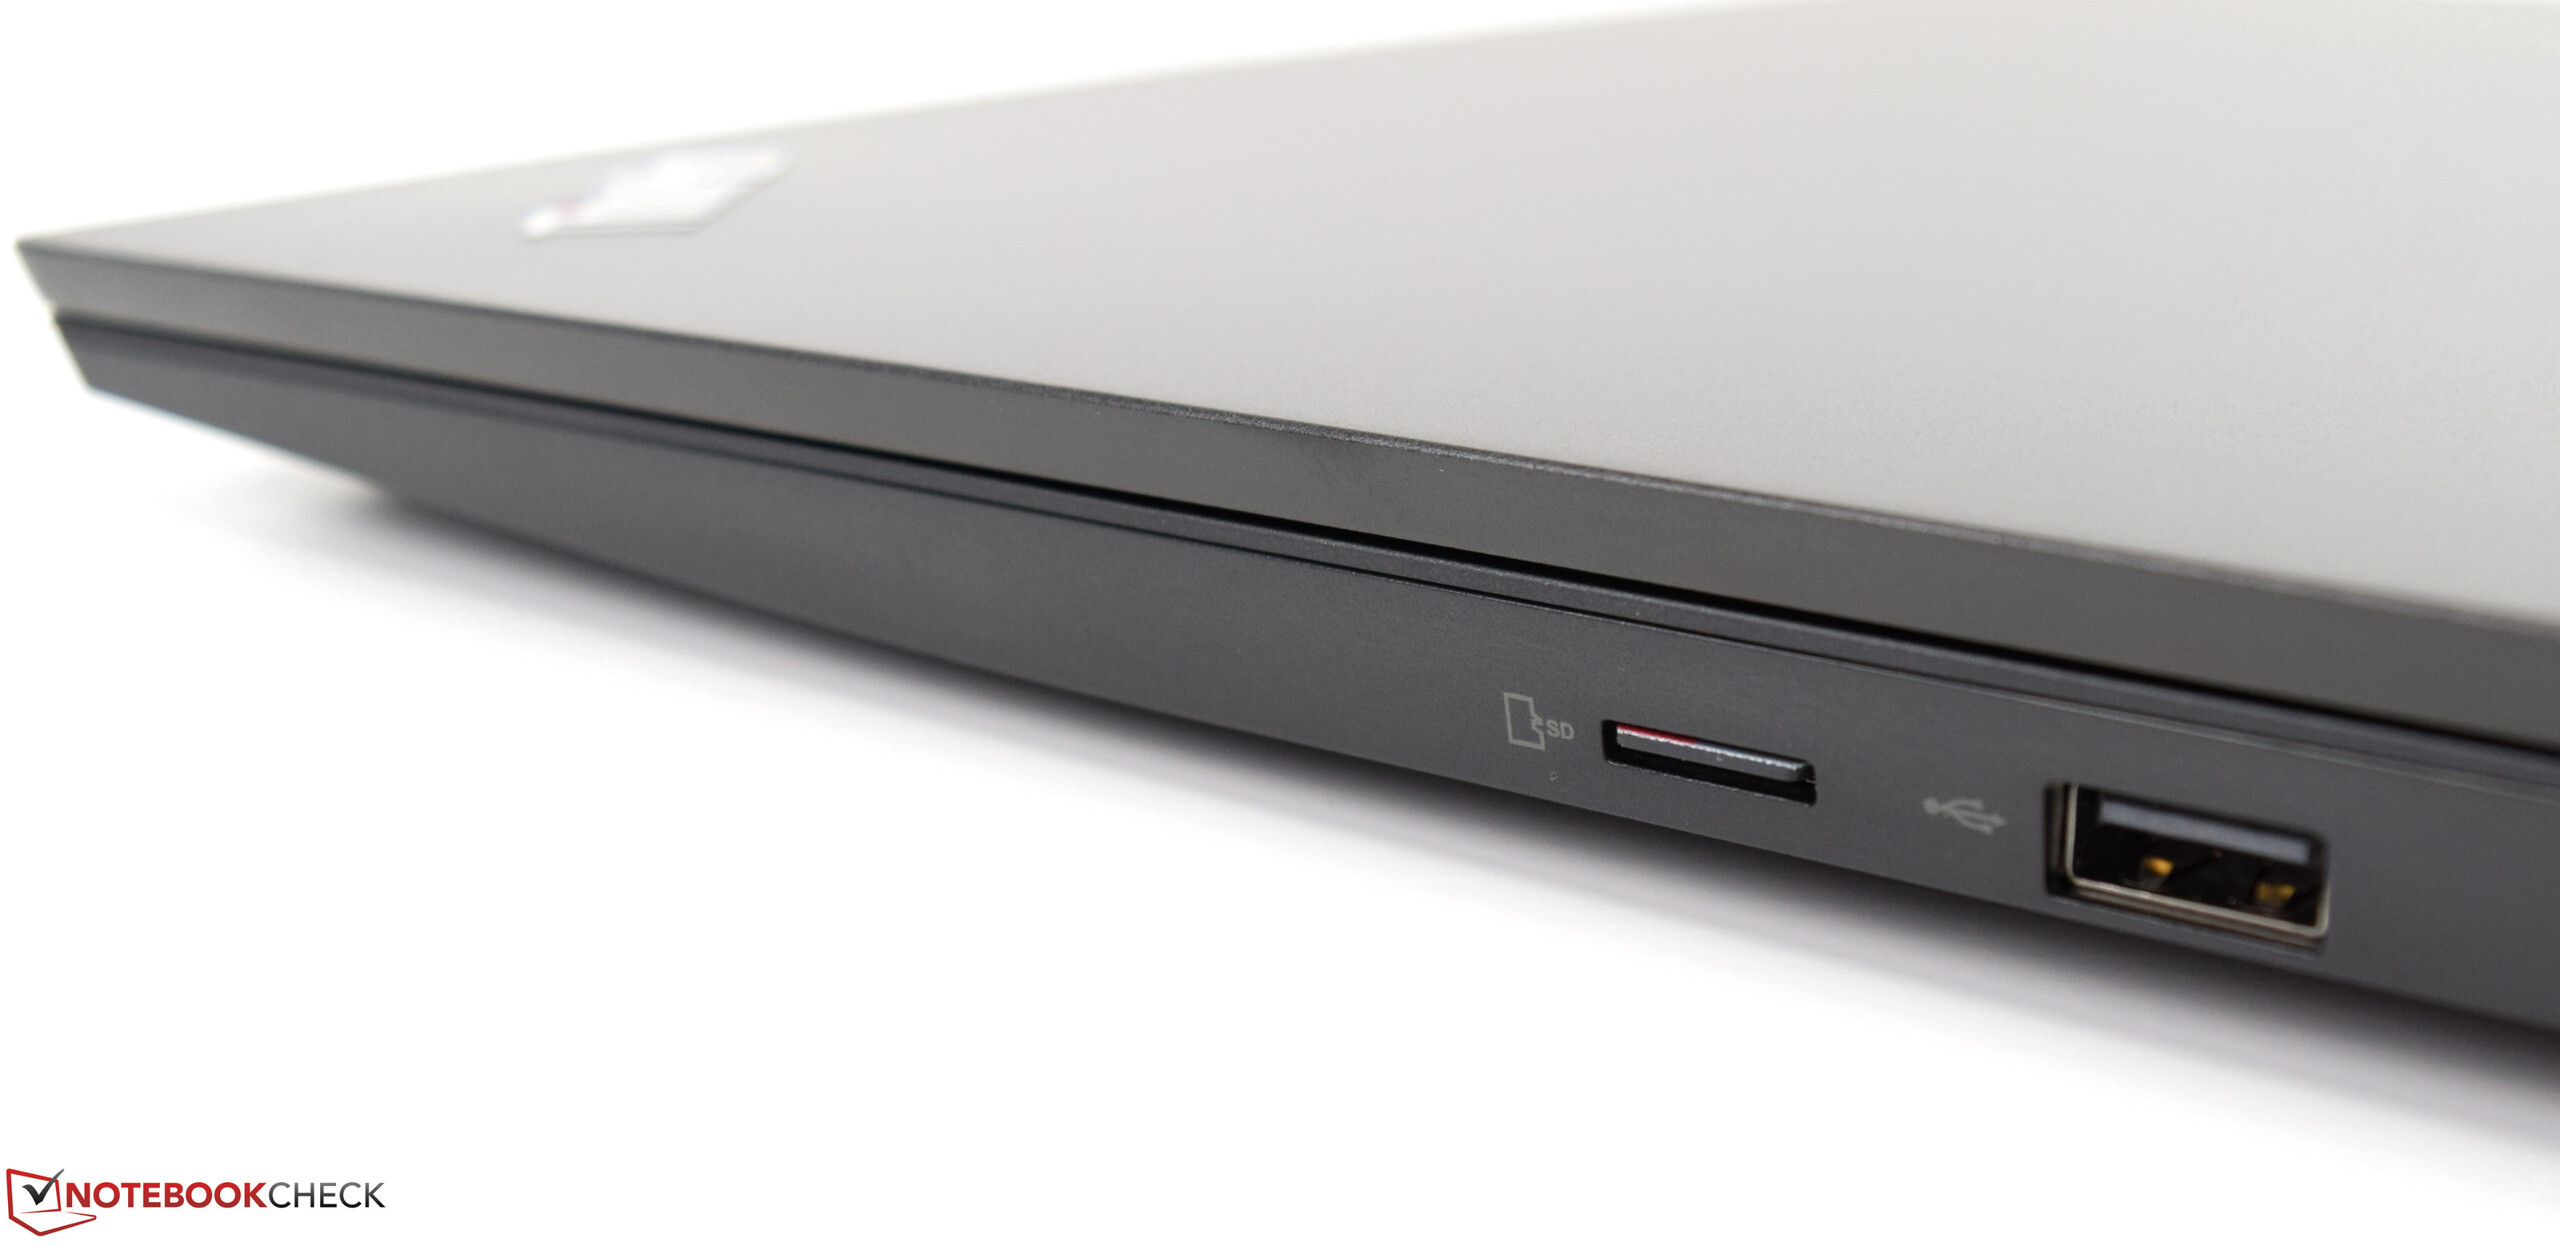
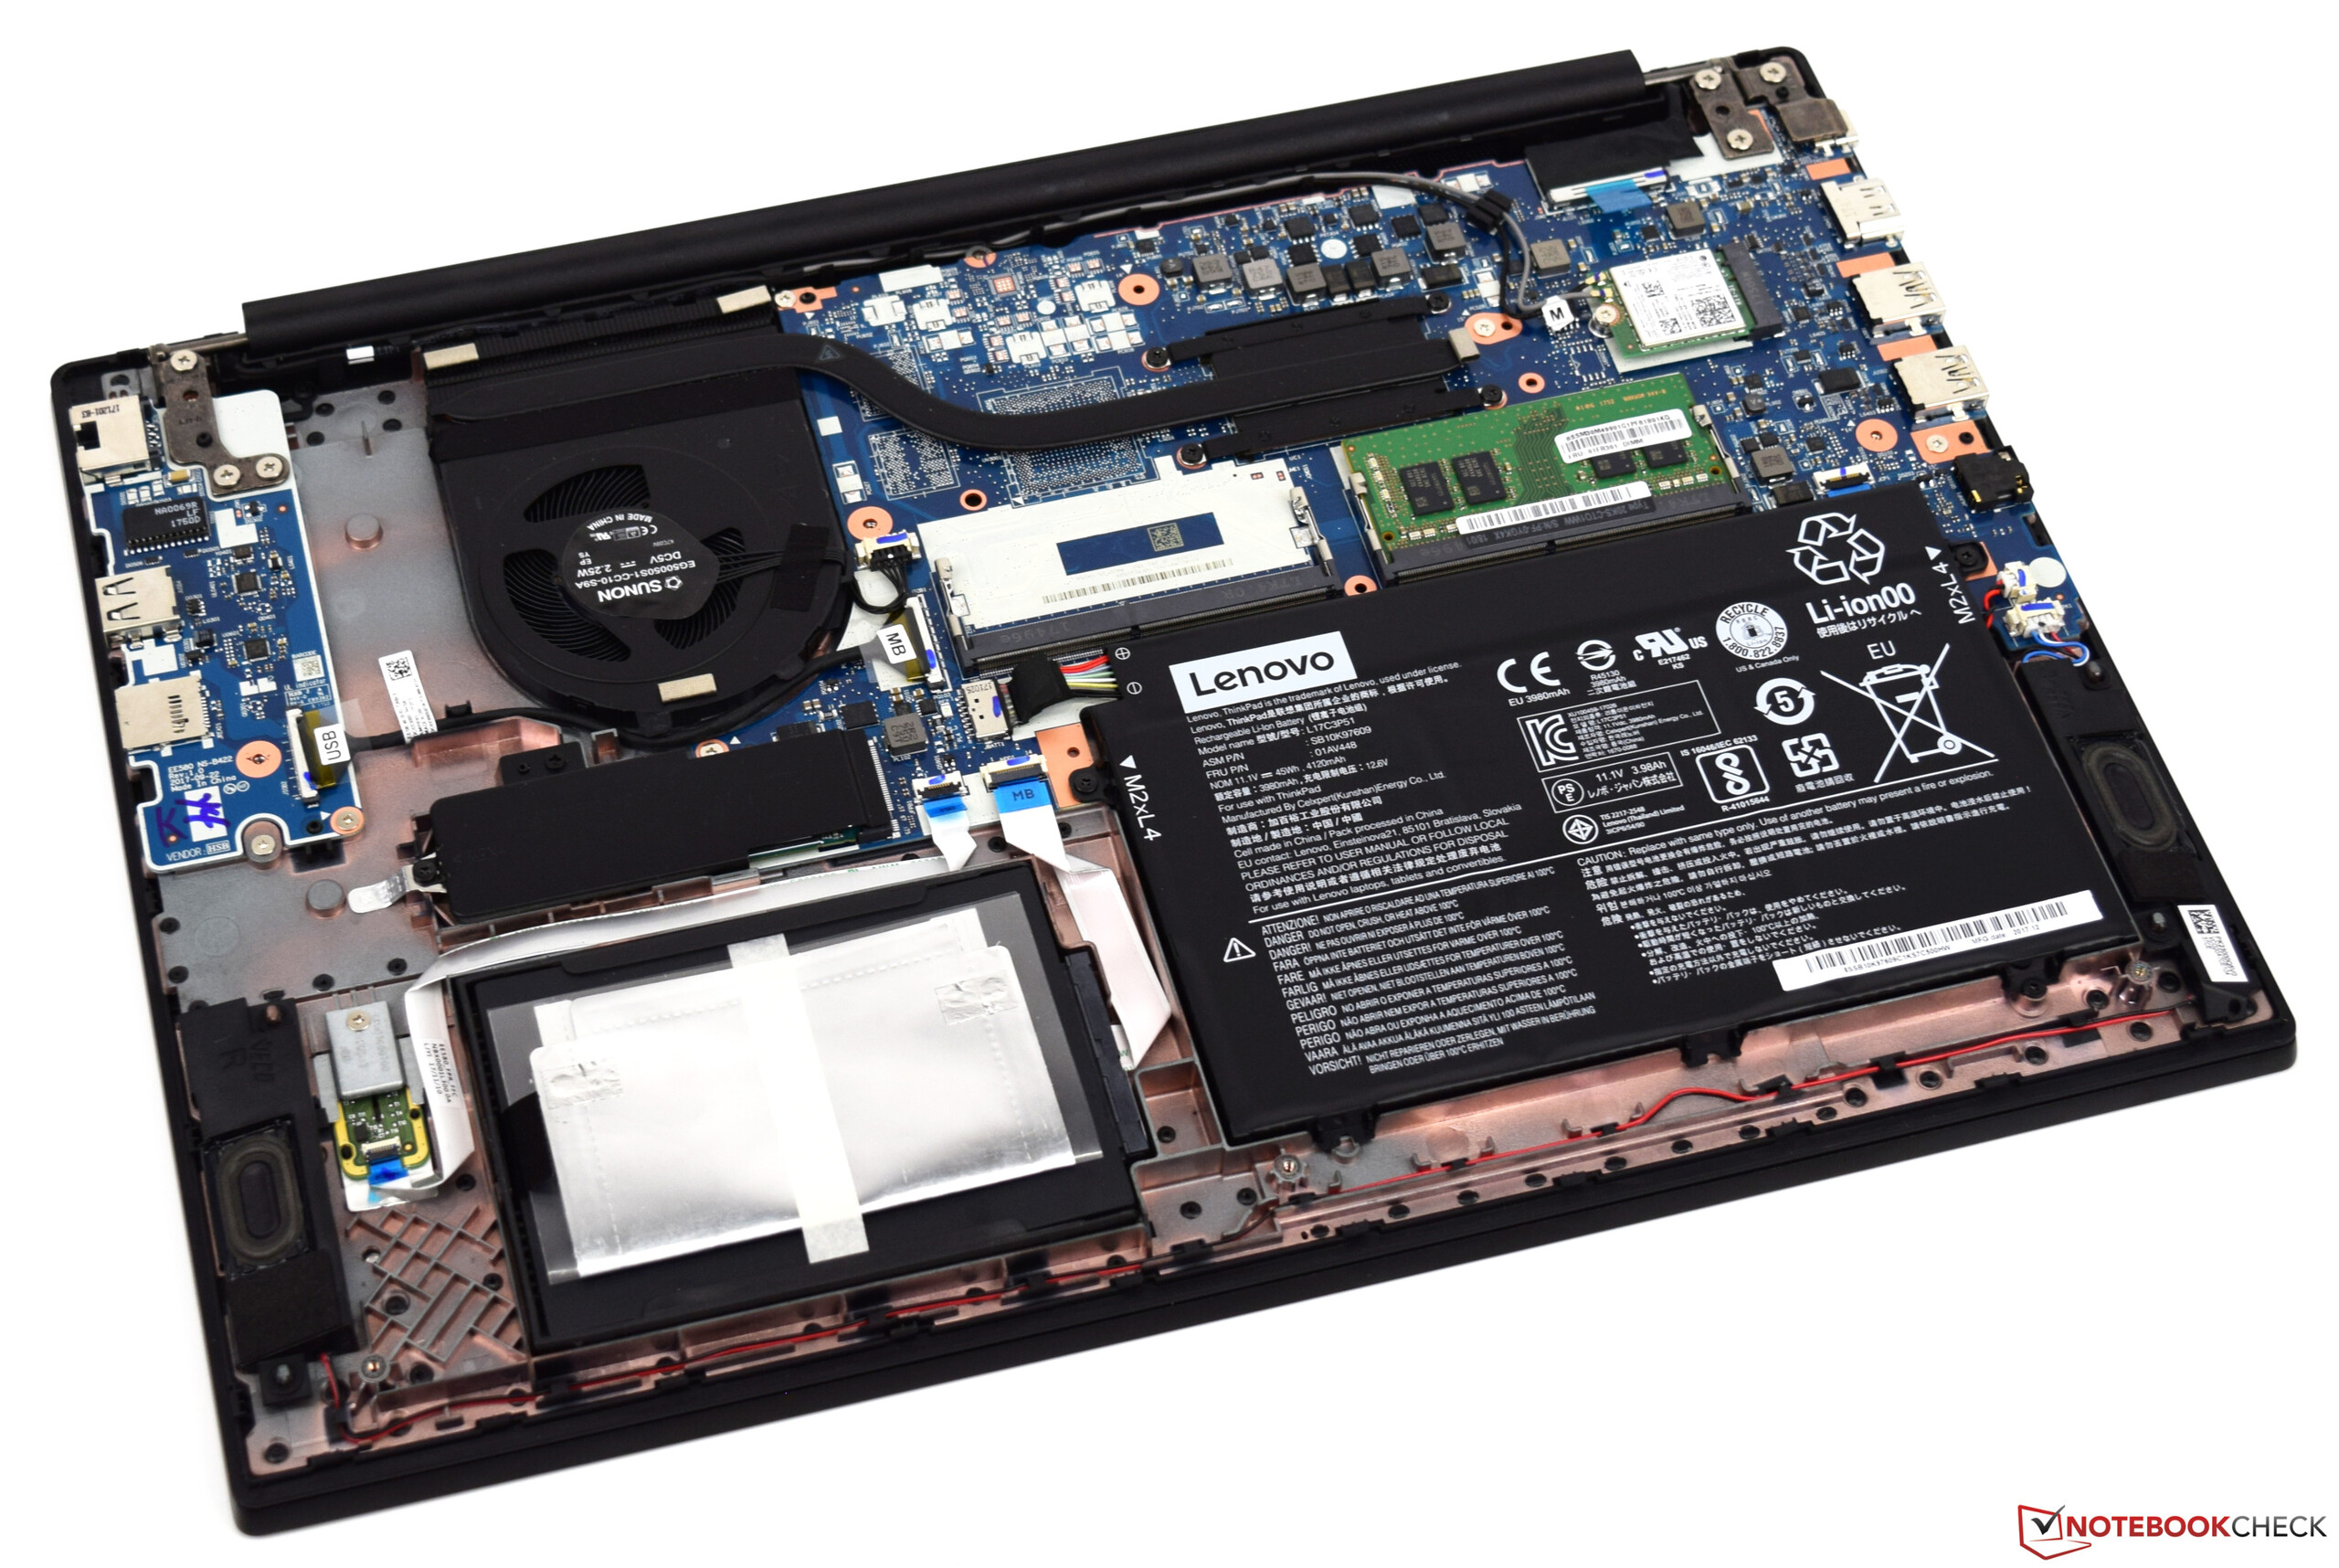
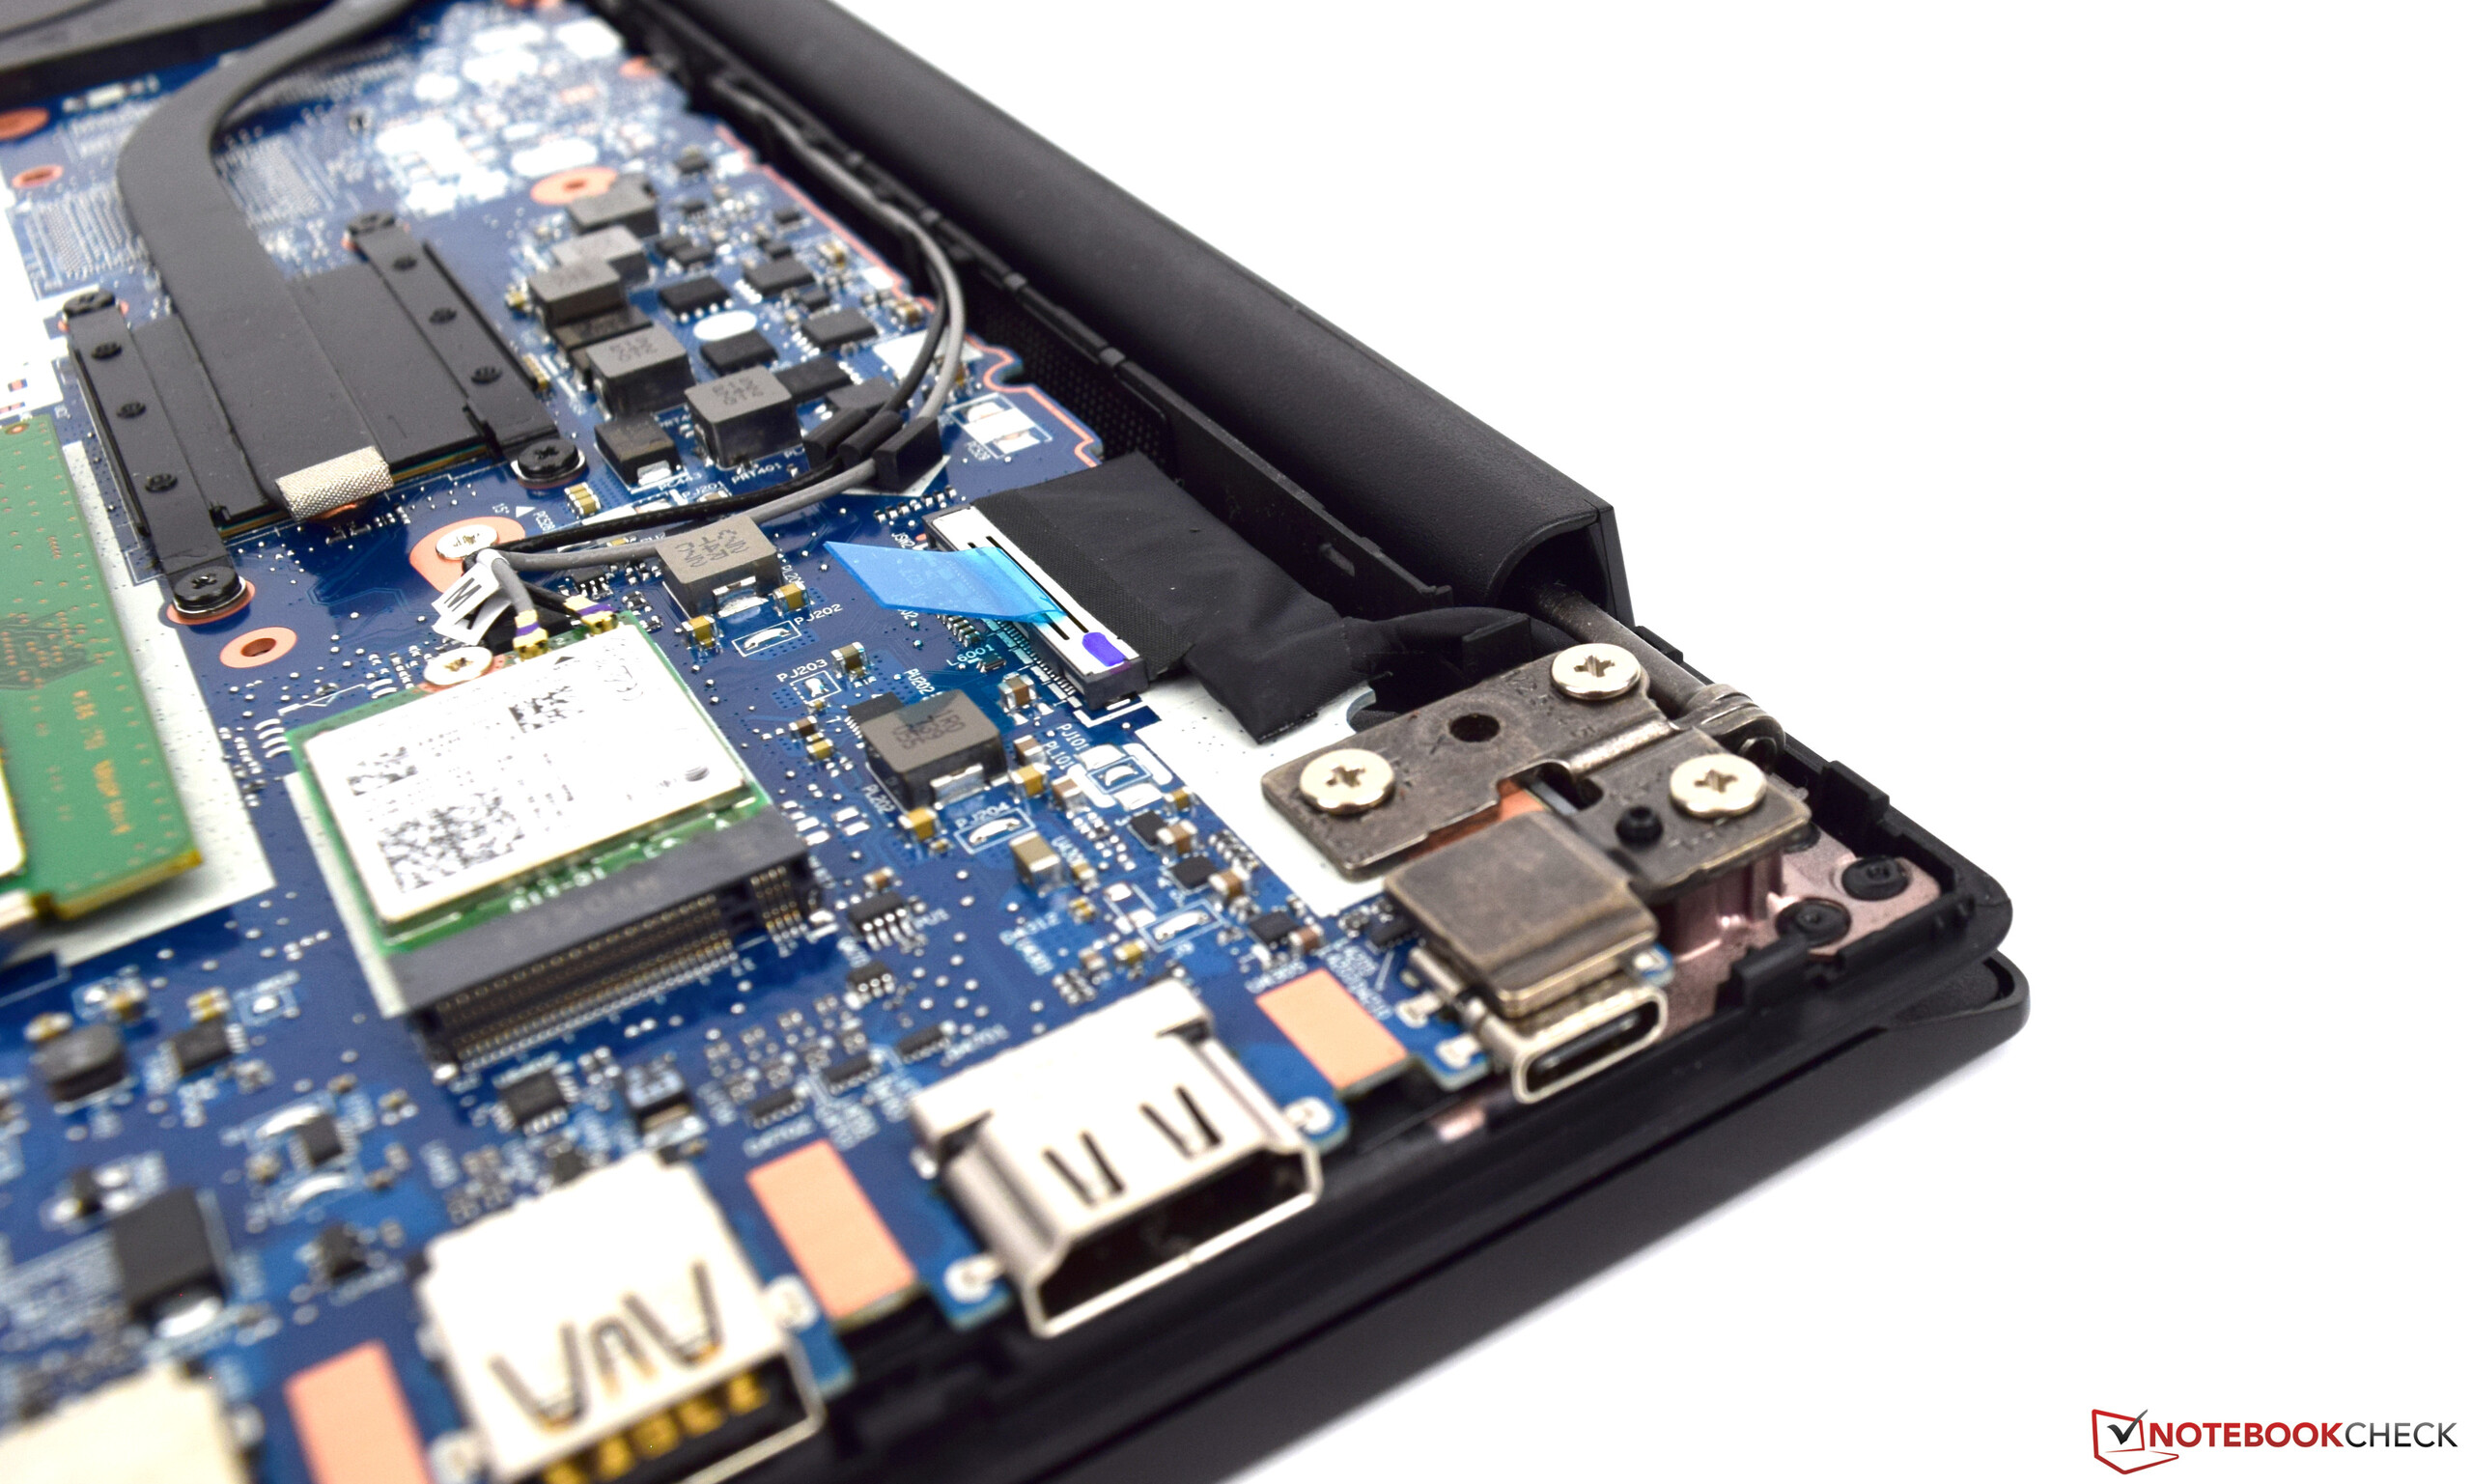
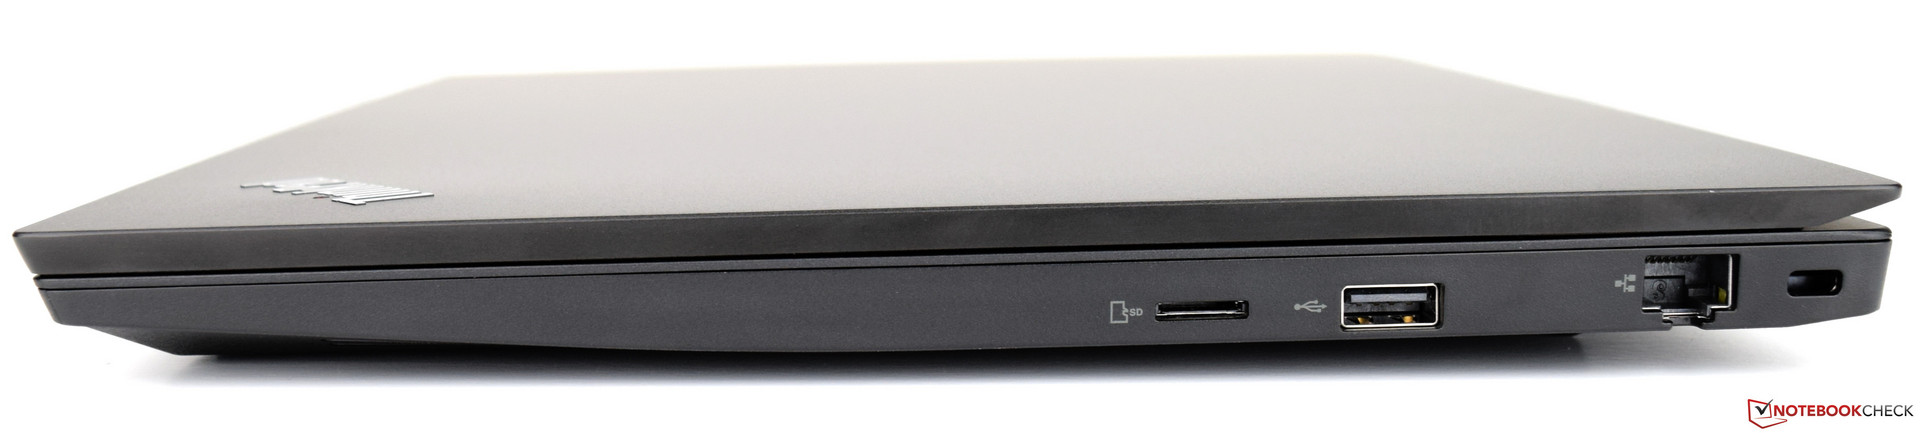
Além da alta qualidade de construção, gostaríamos também de enfatizar a capacidade de atualização do portátil, apesar da falta de uma escotilha de manutenção dedicada e dos, bem conhecidos, dispositivos de entrada de alta qualidade. Embora o SSD de 128 GB esteja no lado pequeno, é definitivamente muito melhor do que um disco rígido comum, apesar de seu desempenho geral relativamente baixo. Suspeitamos que as incompatibilidades dos controladores sejam as culpadas neste caso. Outra desvantagem é o leitor de cartões MicroSD do E580 - uma regressão incompreensível em relação ao modelo do ano passado.
Lenovo ThinkPad E580-20KSCTO1WW
- 03/06/2018 v6 (old)
Sebastian Bade
Price comparison
