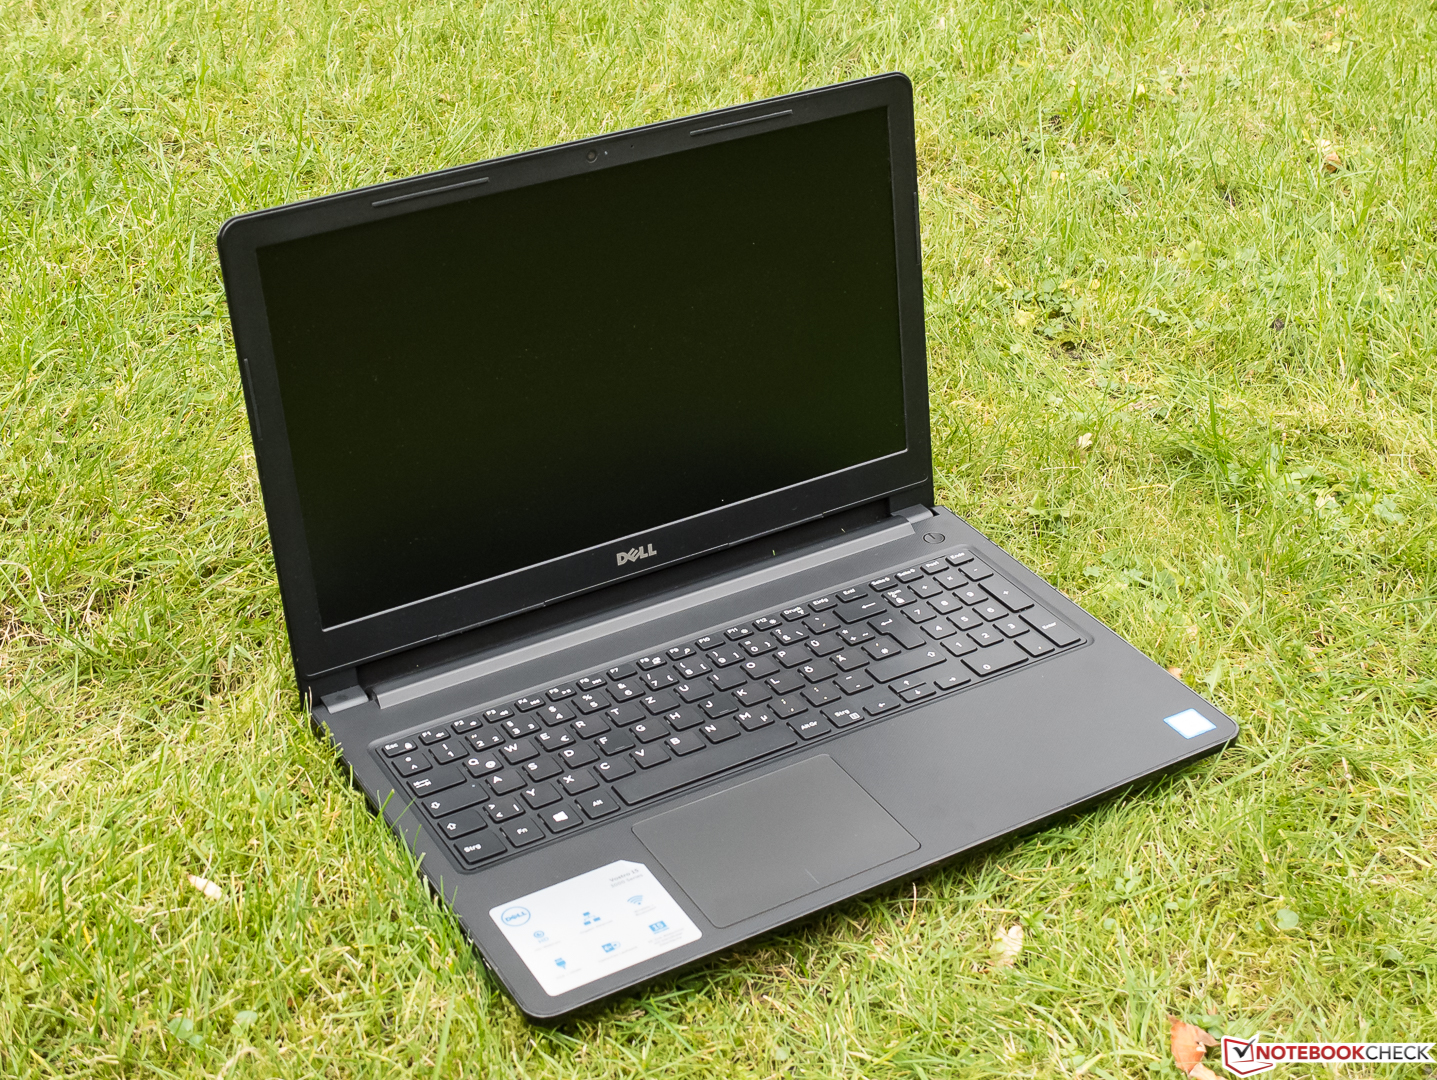
Breve Análise do Portátil Dell Vostro 15 3568 (7200U, 256GB)

| SD Card Reader | |
| average JPG Copy Test (av. of 3 runs) | |
| Acer Aspire 3 A315-51-55E4 (Toshiba Exceria Pro SDXC 64 GB UHS-II) | |
| Asus VivoBook S15 S510UA (Toshiba Exceria Pro SDXC 64 GB UHS-II) | |
| Dell Vostro 15 3568 (Toshiba Exceria Pro SDXC 64 GB UHS-II) | |
| maximum AS SSD Seq Read Test (1GB) | |
| Acer Aspire 3 A315-51-55E4 (Toshiba Exceria Pro SDXC 64 GB UHS-II) | |
| Asus VivoBook S15 S510UA (Toshiba Exceria Pro SDXC 64 GB UHS-II) | |
| Dell Vostro 15 3568 (Toshiba Exceria Pro SDXC 64 GB UHS-II) | |
| Networking | |
| iperf3 transmit AX12 | |
| Lenovo ThinkPad E570-20H6S02M00 | |
| Asus VivoBook S15 S510UA | |
| Acer Aspire 3 A315-51-55E4 | |
| Dell Vostro 15 3568 | |
| iperf3 receive AX12 | |
| Asus VivoBook S15 S510UA | |
| Lenovo ThinkPad E570-20H6S02M00 | |
| Dell Vostro 15 3568 | |
| Acer Aspire 3 A315-51-55E4 | |
| |||||||||||||||||||||||||
iluminação: 89 %
iluminação com acumulador: 195 cd/m²
Contraste: 443:1 (Preto: 0.44 cd/m²)
ΔE ColorChecker Calman: 12.23 | ∀{0.5-29.43 Ø4.71}
ΔE Greyscale Calman: 13.39 | ∀{0.09-98 Ø4.96}
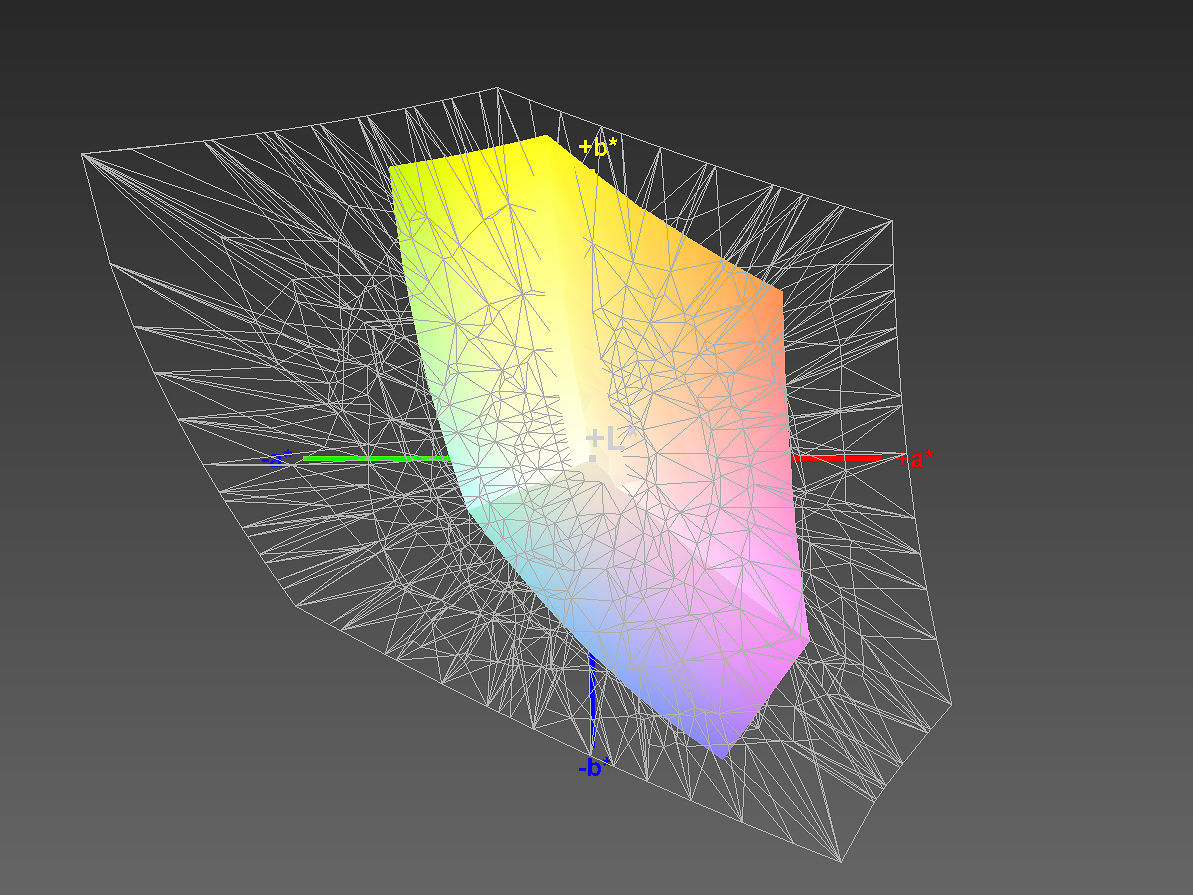
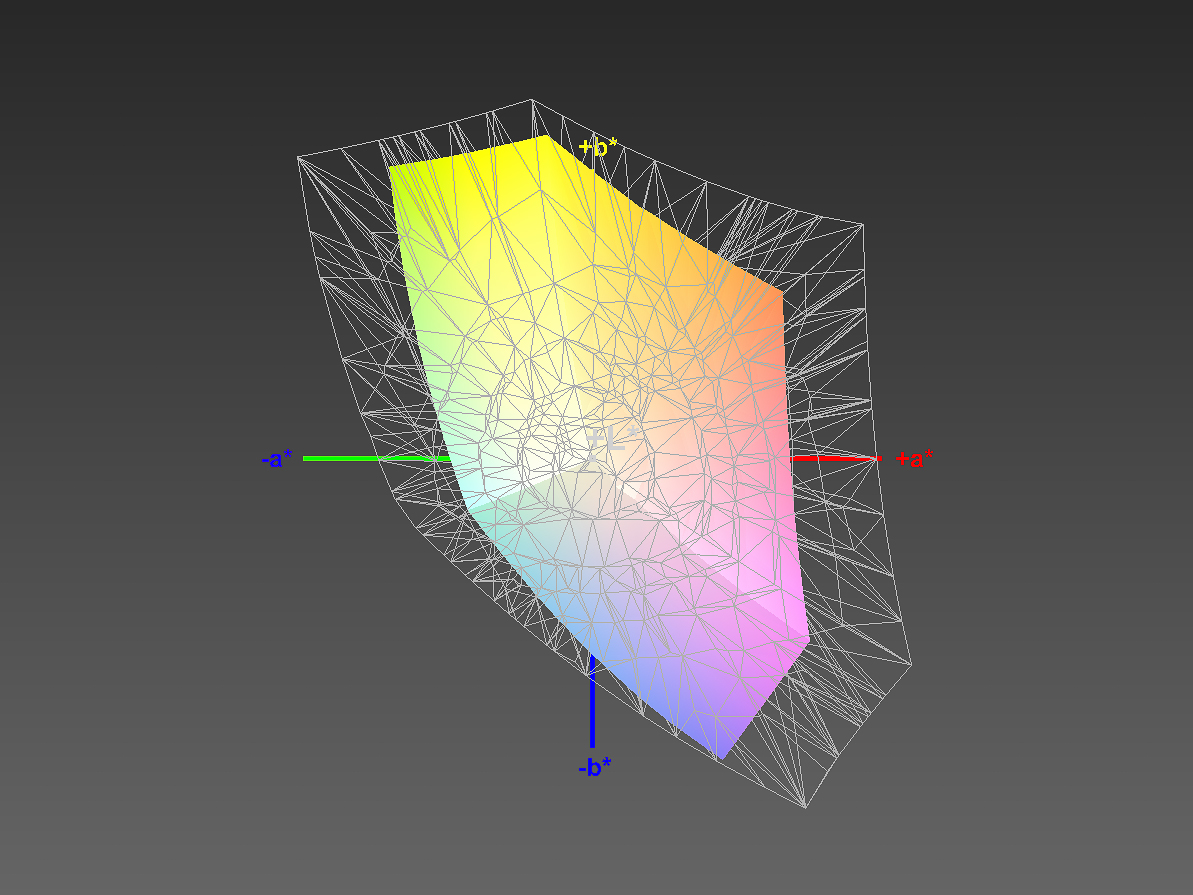
59% sRGB (Argyll 1.6.3 3D)
38% AdobeRGB 1998 (Argyll 1.6.3 3D)
40.69% AdobeRGB 1998 (Argyll 3D)
59.3% sRGB (Argyll 3D)
39.39% Display P3 (Argyll 3D)
Gamma: 2.5
CCT: 15759 K
| Dell Vostro 15 3568 BOE0690 / NT15N41 / Dell C1JFR, , 1920x1080, 15.6" | Acer Aspire 3 A315-51-55E4 AU Optronics AUO38ED, , 1920x1080, 15.6" | Lenovo ThinkPad E570-20H6S02M00 Lenovo NT156WHM-N42, , 1366x768, 15.6" | Asus VivoBook S15 S510UA ID: LGD0573, Name: LG Display LP156WF9-SPK2, , 1920x1080, 15.6" | |
|---|---|---|---|---|
| Display | -9% | -7% | 1% | |
| Display P3 Coverage (%) | 39.39 | 35.97 -9% | 36.79 -7% | 39.9 1% |
| sRGB Coverage (%) | 59.3 | 54.1 -9% | 55.4 -7% | 59.5 0% |
| AdobeRGB 1998 Coverage (%) | 40.69 | 37.17 -9% | 38.01 -7% | 41.11 1% |
| Response Times | -11% | -18% | -69% | |
| Response Time Grey 50% / Grey 80% * (ms) | 39 ? | 44 ? -13% | 46 ? -18% | 38.4 ? 2% |
| Response Time Black / White * (ms) | 11 ? | 12 ? -9% | 13 ? -18% | 26.4 ? -140% |
| PWM Frequency (Hz) | 28410 ? | 200 ? | ||
| Screen | 26% | -2% | 35% | |
| Brightness middle (cd/m²) | 195 | 241 24% | 242 24% | 277.5 42% |
| Brightness (cd/m²) | 195 | 229 17% | 233 19% | 265 36% |
| Brightness Distribution (%) | 89 | 87 -2% | 73 -18% | 89 0% |
| Black Level * (cd/m²) | 0.44 | 0.46 -5% | 0.59 -34% | 0.35 20% |
| Contrast (:1) | 443 | 524 18% | 410 -7% | 793 79% |
| Colorchecker dE 2000 * | 12.23 | 3.4 72% | 10.9 11% | 4.8 61% |
| Colorchecker dE 2000 max. * | 20.85 | 7.61 64% | 20.84 -0% | 17.8 15% |
| Greyscale dE 2000 * | 13.39 | 1.7 87% | 13.07 2% | 3 78% |
| Gamma | 2.5 88% | 2.36 93% | 2.37 93% | 2.39 92% |
| CCT | 15759 41% | 6750 96% | 13123 50% | 6854 95% |
| Color Space (Percent of AdobeRGB 1998) (%) | 38 | 34 -11% | 35 -8% | 37.7 -1% |
| Color Space (Percent of sRGB) (%) | 59 | 54 -8% | 55 -7% | 69.3 17% |
| Média Total (Programa/Configurações) | 2% /
14% | -9% /
-5% | -11% /
14% |
* ... menor é melhor
Exibir tempos de resposta
| ↔ Tempo de resposta preto para branco | ||
|---|---|---|
| 11 ms ... ascensão ↗ e queda ↘ combinadas | ↗ 7 ms ascensão | 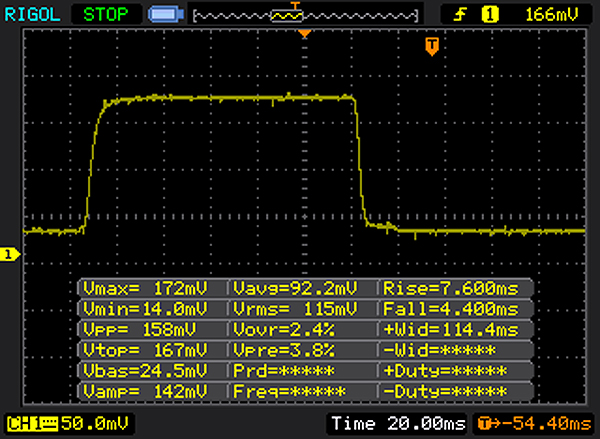 |
| ↘ 4 ms queda | ||
| A tela mostra boas taxas de resposta em nossos testes, mas pode ser muito lenta para jogadores competitivos. Em comparação, todos os dispositivos testados variam de 0.1 (mínimo) a 240 (máximo) ms. » 30 % de todos os dispositivos são melhores. Isso significa que o tempo de resposta medido é melhor que a média de todos os dispositivos testados (19.8 ms). | ||
| ↔ Tempo de resposta 50% cinza a 80% cinza | ||
| 39 ms ... ascensão ↗ e queda ↘ combinadas | ↗ 21 ms ascensão | 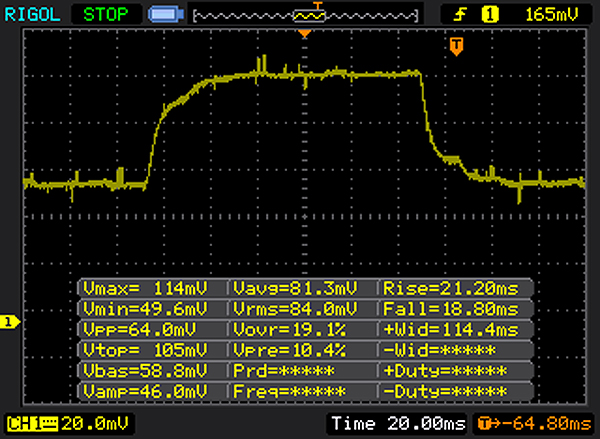 |
| ↘ 18 ms queda | ||
| A tela mostra taxas de resposta lentas em nossos testes e será insatisfatória para os jogadores. Em comparação, todos os dispositivos testados variam de 0.165 (mínimo) a 636 (máximo) ms. » 59 % de todos os dispositivos são melhores. Isso significa que o tempo de resposta medido é pior que a média de todos os dispositivos testados (31 ms). | ||
Cintilação da tela / PWM (modulação por largura de pulso)
| Tela tremeluzindo/PWM detectado | 28410 Hz | ≤ 90 % configuração de brilho | 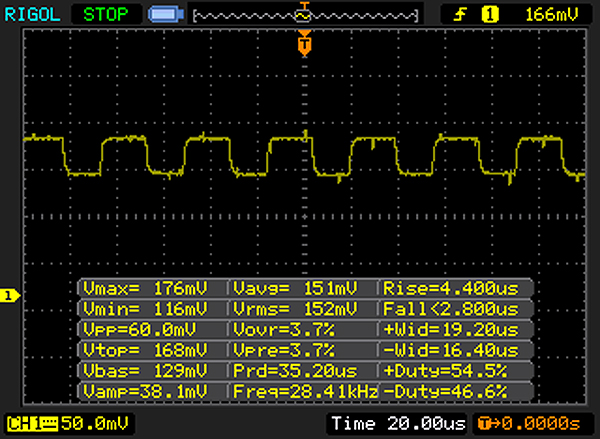 |
A luz de fundo da tela pisca em 28410 Hz (pior caso, por exemplo, utilizando PWM) Cintilação detectada em uma configuração de brilho de 90 % e abaixo. Não deve haver cintilação ou PWM acima desta configuração de brilho. A frequência de 28410 Hz é bastante alta, então a maioria dos usuários sensíveis ao PWM não deve notar nenhuma oscilação. [pwm_comparison] Em comparação: 52 % de todos os dispositivos testados não usam PWM para escurecer a tela. Se PWM foi detectado, uma média de 7754 (mínimo: 5 - máximo: 343500) Hz foi medida. | |||
| PCMark 8 | |
| Home Score Accelerated v2 | |
| Asus VivoBook S15 S510UA | |
| Lenovo ThinkPad E570-20H6S02M00 | |
| Dell Vostro 15 3568 | |
| Acer Aspire 3 A315-51-55E4 | |
| Work Score Accelerated v2 | |
| Lenovo ThinkPad E570-20H6S02M00 | |
| Asus VivoBook S15 S510UA | |
| Dell Vostro 15 3568 | |
| Acer Aspire 3 A315-51-55E4 | |
| PCMark 8 Home Score Accelerated v2 | 3417 pontos | |
| PCMark 8 Work Score Accelerated v2 | 4544 pontos | |
Ajuda | ||
| Dell Vostro 15 3568 Micron 1100 MTFDDAV256TBN | Acer Aspire 3 A315-51-55E4 Micron 1100 MTFDDAV256TBN | Lenovo ThinkPad E570-20H6S02M00 Samsung PM961 MZVLW256HEHP | Asus VivoBook S15 S510UA Toshiba HG6 THNSNJ128G8NY | |
|---|---|---|---|---|
| CrystalDiskMark 3.0 | 53% | 237% | 21% | |
| Read Seq (MB/s) | 469.3 | 485.8 4% | 1589 239% | 503 7% |
| Write Seq (MB/s) | 179.7 | 456.1 154% | 1217 577% | 396 120% |
| Read 512 (MB/s) | 359.6 | 328 -9% | 1155 221% | 417.7 16% |
| Write 512 (MB/s) | 183.7 | 446.8 143% | 783 326% | 342 86% |
| Read 4k (MB/s) | 26.01 | 26.95 4% | 59.7 130% | 19.48 -25% |
| Write 4k (MB/s) | 68.7 | 86.7 26% | 148.8 117% | 64.6 -6% |
| Read 4k QD32 (MB/s) | 242.4 | 245.9 1% | 473.6 95% | 250.3 3% |
| Write 4k QD32 (MB/s) | 147.1 | 300.2 104% | 428.7 191% | 94.3 -36% |

| 3DMark 11 - 1280x720 Performance GPU | |
| Asus VivoBook S15 S510UA | |
| Dell Vostro 15 3568 | |
| Lenovo ThinkPad E570-20H6S02M00 | |
| Acer Aspire 3 A315-51-55E4 | |
| 3DMark | |
| 1280x720 Cloud Gate Standard Graphics | |
| Asus VivoBook S15 S510UA | |
| Lenovo ThinkPad E570-20H6S02M00 | |
| Dell Vostro 15 3568 | |
| Acer Aspire 3 A315-51-55E4 | |
| 1920x1080 Fire Strike Graphics | |
| Asus VivoBook S15 S510UA | |
| Lenovo ThinkPad E570-20H6S02M00 | |
| Acer Aspire 3 A315-51-55E4 | |
| 3DMark 11 Performance | 1532 pontos | |
| 3DMark Cloud Gate Standard Score | 5611 pontos | |
Ajuda | ||
| baixo | média | alto | ultra | |
|---|---|---|---|---|
| The Witcher 3 (2015) | 13.3 | |||
| Rise of the Tomb Raider (2016) | 13.1 | |||
| Farming Simulator 17 (2016) | 42.7 | 16.6 |
Barulho
| Ocioso |
| 30.2 / 30.2 / 30.2 dB |
| DVD |
| 35.2 / dB |
| Carga |
| 36.4 / 36.5 dB |
 | ||
30 dB silencioso 40 dB(A) audível 50 dB(A) ruidosamente alto |
||
min: | ||
(+) A temperatura máxima no lado superior é 35.6 °C / 96 F, em comparação com a média de 34.3 °C / 94 F , variando de 21.2 a 62.5 °C para a classe Office.
(+) A parte inferior aquece até um máximo de 35.3 °C / 96 F, em comparação com a média de 36.8 °C / 98 F
(+) Em uso inativo, a temperatura média para o lado superior é 24.1 °C / 75 F, em comparação com a média do dispositivo de 29.5 °C / ### class_avg_f### F.
(+) Os apoios para as mãos e o touchpad são mais frios que a temperatura da pele, com um máximo de 30.2 °C / 86.4 F e, portanto, são frios ao toque.
(-) A temperatura média da área do apoio para as mãos de dispositivos semelhantes foi 27.5 °C / 81.5 F (-2.7 °C / -4.9 F).
Dell Vostro 15 3568 análise de áudio
(-) | alto-falantes não muito altos (###valor### dB)
Graves 100 - 315Hz
(-) | quase nenhum baixo - em média 18.4% menor que a mediana
(±) | a linearidade dos graves é média (11% delta para a frequência anterior)
Médios 400 - 2.000 Hz
(±) | médios mais altos - em média 5.9% maior que a mediana
(+) | médios são lineares (6.9% delta para frequência anterior)
Altos 2 - 16 kHz
(+) | agudos equilibrados - apenas 2% longe da mediana
(+) | os máximos são lineares (5.8% delta da frequência anterior)
Geral 100 - 16.000 Hz
(±) | a linearidade do som geral é média (20.5% diferença em relação à mediana)
Comparado com a mesma classe
» 46% de todos os dispositivos testados nesta classe foram melhores, 10% semelhantes, 44% piores
» O melhor teve um delta de 7%, a média foi 21%, o pior foi 53%
Comparado com todos os dispositivos testados
» 54% de todos os dispositivos testados foram melhores, 8% semelhantes, 38% piores
» O melhor teve um delta de 4%, a média foi 23%, o pior foi 134%
Acer Aspire 3 A315-51-55E4 análise de áudio
(±) | o volume do alto-falante é médio, mas bom (###valor### dB)
Graves 100 - 315Hz
(-) | quase nenhum baixo - em média 23.3% menor que a mediana
(±) | a linearidade dos graves é média (9.3% delta para a frequência anterior)
Médios 400 - 2.000 Hz
(±) | médios mais altos - em média 7.4% maior que a mediana
(±) | a linearidade dos médios é média (13.3% delta para frequência anterior)
Altos 2 - 16 kHz
(+) | agudos equilibrados - apenas 3.6% longe da mediana
(±) | a linearidade dos máximos é média (7.5% delta para frequência anterior)
Geral 100 - 16.000 Hz
(±) | a linearidade do som geral é média (27.9% diferença em relação à mediana)
Comparado com a mesma classe
» 87% de todos os dispositivos testados nesta classe foram melhores, 3% semelhantes, 10% piores
» O melhor teve um delta de 7%, a média foi 21%, o pior foi 53%
Comparado com todos os dispositivos testados
» 85% de todos os dispositivos testados foram melhores, 3% semelhantes, 12% piores
» O melhor teve um delta de 4%, a média foi 23%, o pior foi 134%
Lenovo ThinkPad E570-20H6S02M00 análise de áudio
(-) | alto-falantes não muito altos (###valor### dB)
Graves 100 - 315Hz
(-) | quase nenhum baixo - em média 17.1% menor que a mediana
(±) | a linearidade dos graves é média (10.9% delta para a frequência anterior)
Médios 400 - 2.000 Hz
(+) | médios equilibrados - apenas 3.9% longe da mediana
(±) | a linearidade dos médios é média (8.2% delta para frequência anterior)
Altos 2 - 16 kHz
(+) | agudos equilibrados - apenas 3.4% longe da mediana
(±) | a linearidade dos máximos é média (7% delta para frequência anterior)
Geral 100 - 16.000 Hz
(±) | a linearidade do som geral é média (20.3% diferença em relação à mediana)
Comparado com a mesma classe
» 45% de todos os dispositivos testados nesta classe foram melhores, 10% semelhantes, 45% piores
» O melhor teve um delta de 7%, a média foi 21%, o pior foi 53%
Comparado com todos os dispositivos testados
» 53% de todos os dispositivos testados foram melhores, 8% semelhantes, 39% piores
» O melhor teve um delta de 4%, a média foi 23%, o pior foi 134%
Asus VivoBook S15 S510UA análise de áudio
(-) | alto-falantes não muito altos (###valor### dB)
Graves 100 - 315Hz
(-) | quase nenhum baixo - em média 15.3% menor que a mediana
(±) | a linearidade dos graves é média (12.2% delta para a frequência anterior)
Médios 400 - 2.000 Hz
(+) | médios equilibrados - apenas 1.6% longe da mediana
(+) | médios são lineares (6.8% delta para frequência anterior)
Altos 2 - 16 kHz
(+) | agudos equilibrados - apenas 3.8% longe da mediana
(±) | a linearidade dos máximos é média (10.6% delta para frequência anterior)
Geral 100 - 16.000 Hz
(±) | a linearidade do som geral é média (19.8% diferença em relação à mediana)
Comparado com a mesma classe
» 65% de todos os dispositivos testados nesta classe foram melhores, 6% semelhantes, 28% piores
» O melhor teve um delta de 5%, a média foi 17%, o pior foi 45%
Comparado com todos os dispositivos testados
» 51% de todos os dispositivos testados foram melhores, 7% semelhantes, 42% piores
» O melhor teve um delta de 4%, a média foi 23%, o pior foi 134%
| desligado | |
| Ocioso | |
| Carga |
|
Key:
min: | |
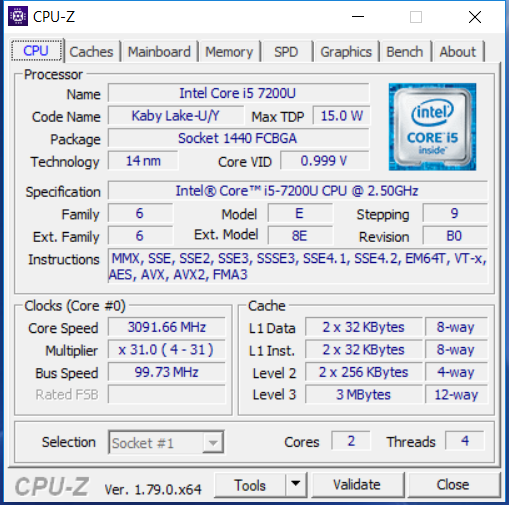
| Dell Vostro 15 3568 i5-7200U, HD Graphics 620, Micron 1100 MTFDDAV256TBN, TN LED, 1920x1080, 15.6" | Acer Aspire 3 A315-51-55E4 i5-7200U, HD Graphics 620, Micron 1100 MTFDDAV256TBN, TN LED, 1920x1080, 15.6" | Lenovo ThinkPad E570-20H6S02M00 i5-7200U, HD Graphics 620, Samsung PM961 MZVLW256HEHP, TN LED, 1366x768, 15.6" | Asus VivoBook S15 S510UA i5-7200U, HD Graphics 620, Toshiba HG6 THNSNJ128G8NY, IPS, 1920x1080, 15.6" | |
|---|---|---|---|---|
| Power Consumption | -27% | -6% | -38% | |
| Idle Minimum * (Watt) | 3 | 4.1 -37% | 2.9 3% | 4.6 -53% |
| Idle Average * (Watt) | 5.5 | 7.5 -36% | 5.8 -5% | 7.6 -38% |
| Idle Maximum * (Watt) | 5.7 | 8.9 -56% | 6.6 -16% | 7.7 -35% |
| Load Average * (Watt) | 27 | 28.1 -4% | 29 -7% | 35.1 -30% |
| Load Maximum * (Watt) | 27.4 | 28.3 -3% | 29.4 -7% | 36.2 -32% |
* ... menor é melhor
| Dell Vostro 15 3568 i5-7200U, HD Graphics 620, 40 Wh | Acer Aspire 3 A315-51-55E4 i5-7200U, HD Graphics 620, 37 Wh | Lenovo ThinkPad E570-20H6S02M00 i5-7200U, HD Graphics 620, 42 Wh | Asus VivoBook S15 S510UA i5-7200U, HD Graphics 620, 42 Wh | |
|---|---|---|---|---|
| Duração da bateria | -11% | 9% | -32% | |
| Reader / Idle (h) | 14.6 | 14.3 -2% | 18.1 24% | 10.2 -30% |
| WiFi v1.3 (h) | 6.3 | 5.8 -8% | 7.2 14% | 4.3 -32% |
| Load (h) | 1.8 | 1.4 -22% | 1.6 -11% | 1.2 -33% |
| H.264 (h) | 6.5 |
Pro
Contra
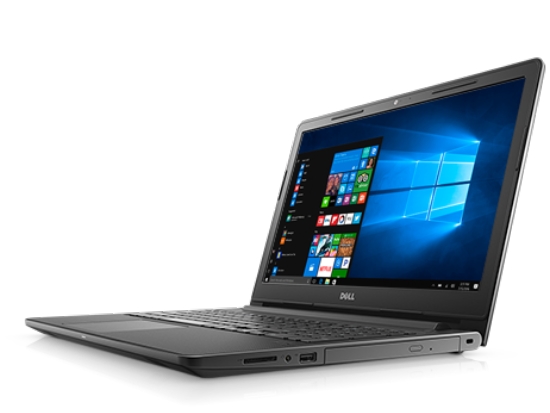
A tela realmente mesquinha com seu matiz azul extremo no estado de entrega, como não vimos anteriormente, é o único componente do novo Dell Vostro 15 3568 que podemos reclamar contra o fabricante, mesmo considerando o preço muito baixo da configuração de nível de entrada. A melhor parte da tela é realmente a superfície mate. Todas as outras desvantagens que coletamos em nossa lista de contras carrega muito menos peso.
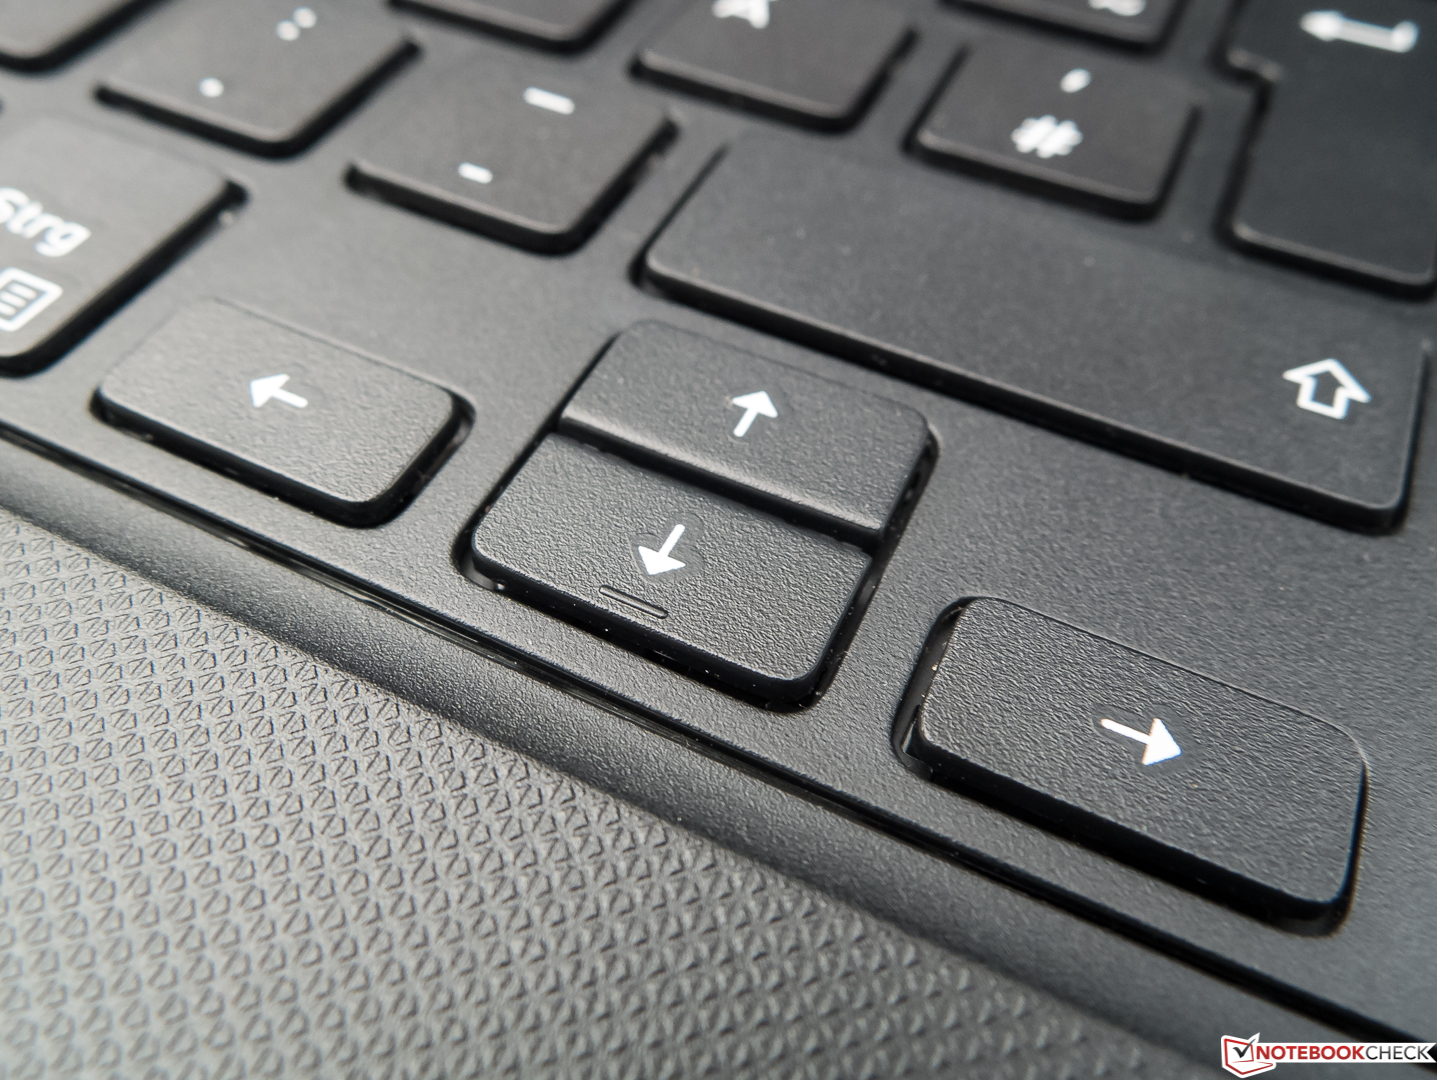
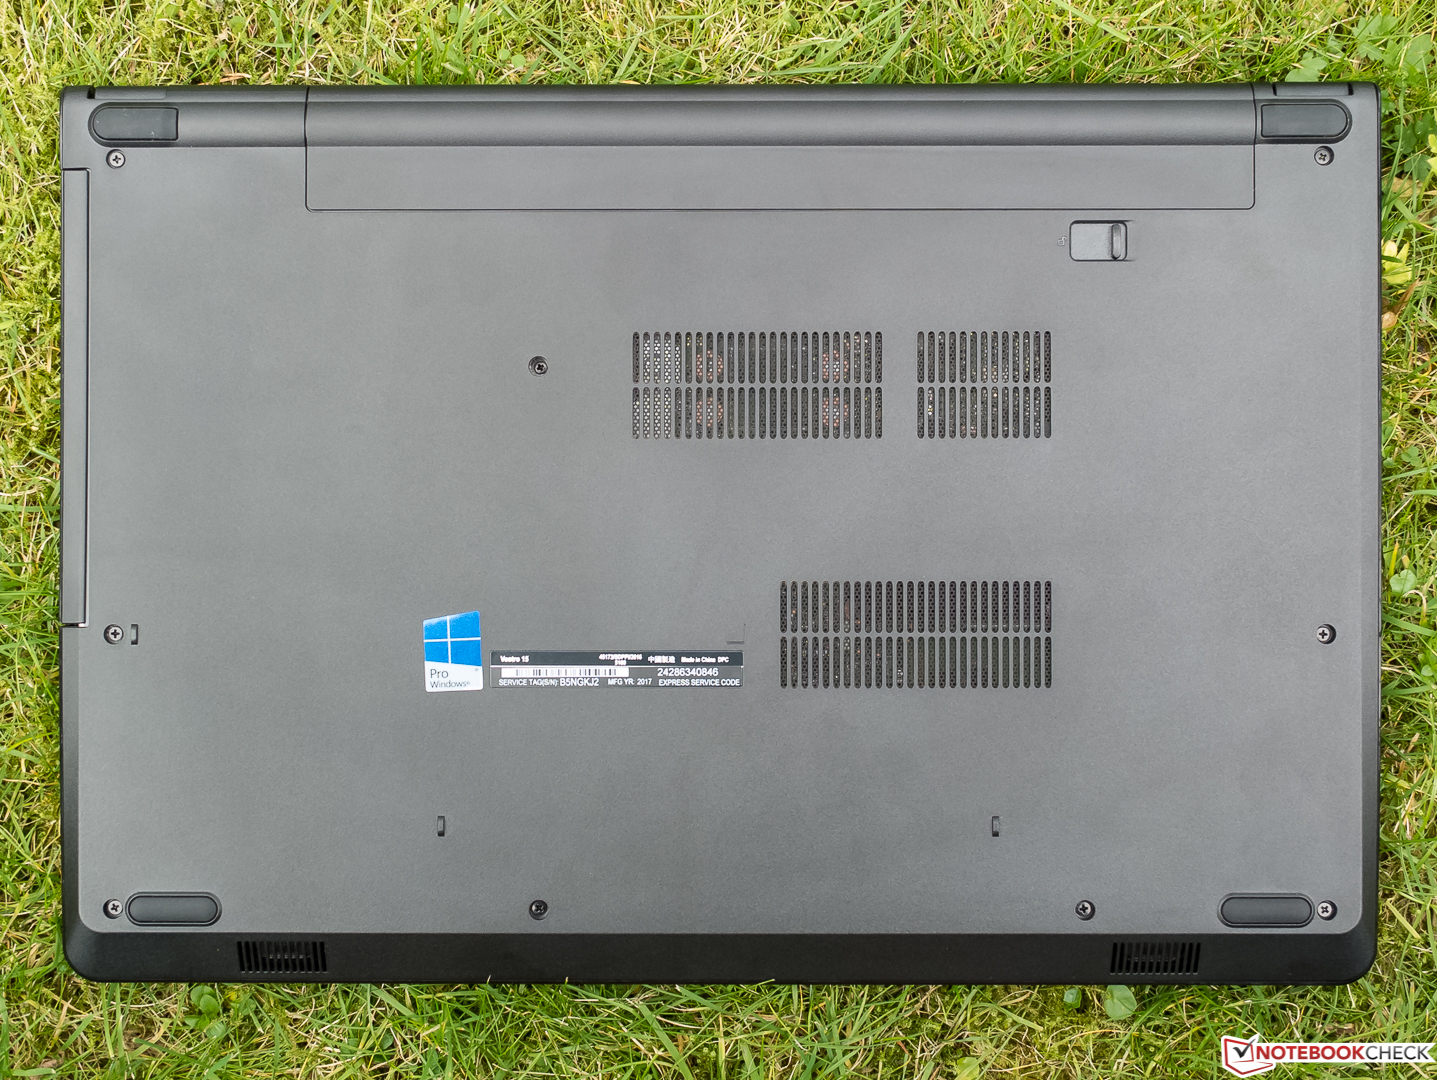
Se você pode ignorar a tela(como surpreendentemente muitos usuários podem fazer), obtém um portátil de escritório simples com mobilidade limitada, que lida com suas tarefas adequadamente. A bateria pode ser facilmente trocada, um módulo TPM está integrado para segurança e o Windows 10 Pro nivela o caminho para a criptografia do disco rígido e as opções administrativas expandidas na rede da empresa. Do lado positivo, devemos também mencionar os dispositivos de entrada decentes e a operação fria e normalmente silenciosa.
Os destaques da nossa versão do Dell Vostro 15 3568, que é em grande medida bem sucedida, são seus 256 GB do SSD e W10 Pro, que podem compensar a tela ruim aos olhos de alguns usuários.
Um SSD e a versão Pro do Windows 10 só estão disponíveis com uma taxa extra, o que eleva o preço mais para o nível dos concorrentes no teste. Qualquer um que escolha a variante mínima ainda terá desempenho suficiente para o escritório. Somente por causa da tela, não conseguimos dar uma recomendação de compra.
Dell Vostro 15 3568
- 12/12/2017 v6 (old)
Sven Kloevekorn