Breve Análise do Subportátil Dell XPS 13 9380 2019 (i5-8265U, 256GB, UHD)

| SD Card Reader | |
| average JPG Copy Test (av. of 3 runs) | |
| Dell XPS 13 9380 2019 (Toshiba Exceria Pro SDXC 64 GB UHS-II) | |
| Dell XPS 13 9370 FHD i5 (Toshiba Exceria Pro M501 64 GB UHS-II) | |
| Dell XPS 13 9370 i7 UHD (Toshiba Exceria Pro UHS-II) | |
| Fujitsu Lifebook U938 (Toshiba Exceria Pro SDXC 64 GB UHS-II) | |
| HP Envy 13-ah0003ng (Toshiba Exceria Pro M501 microSDXC 64GB) | |
| Lenovo ThinkPad X280-20KES01S00 (Toshiba Excerie Pro M501) | |
| Média da turma Subnotebook (23.7 - 188, n=9, últimos 2 anos) | |
| maximum AS SSD Seq Read Test (1GB) | |
| Dell XPS 13 9370 i7 UHD (Toshiba Exceria Pro UHS-II) | |
| Dell XPS 13 9370 FHD i5 (Toshiba Exceria Pro M501 64 GB UHS-II) | |
| Dell XPS 13 9380 2019 (Toshiba Exceria Pro SDXC 64 GB UHS-II) | |
| Fujitsu Lifebook U938 (Toshiba Exceria Pro SDXC 64 GB UHS-II) | |
| Média da turma Subnotebook (24.9 - 195, n=8, últimos 2 anos) | |
| Lenovo ThinkPad X280-20KES01S00 (Toshiba Excerie Pro M501) | |
| HP Envy 13-ah0003ng (Toshiba Exceria Pro M501 microSDXC 64GB) | |
| |||||||||||||||||||||||||
iluminação: 85 %
iluminação com acumulador: 404 cd/m²
Contraste: 1092:1 (Preto: 0.37 cd/m²)
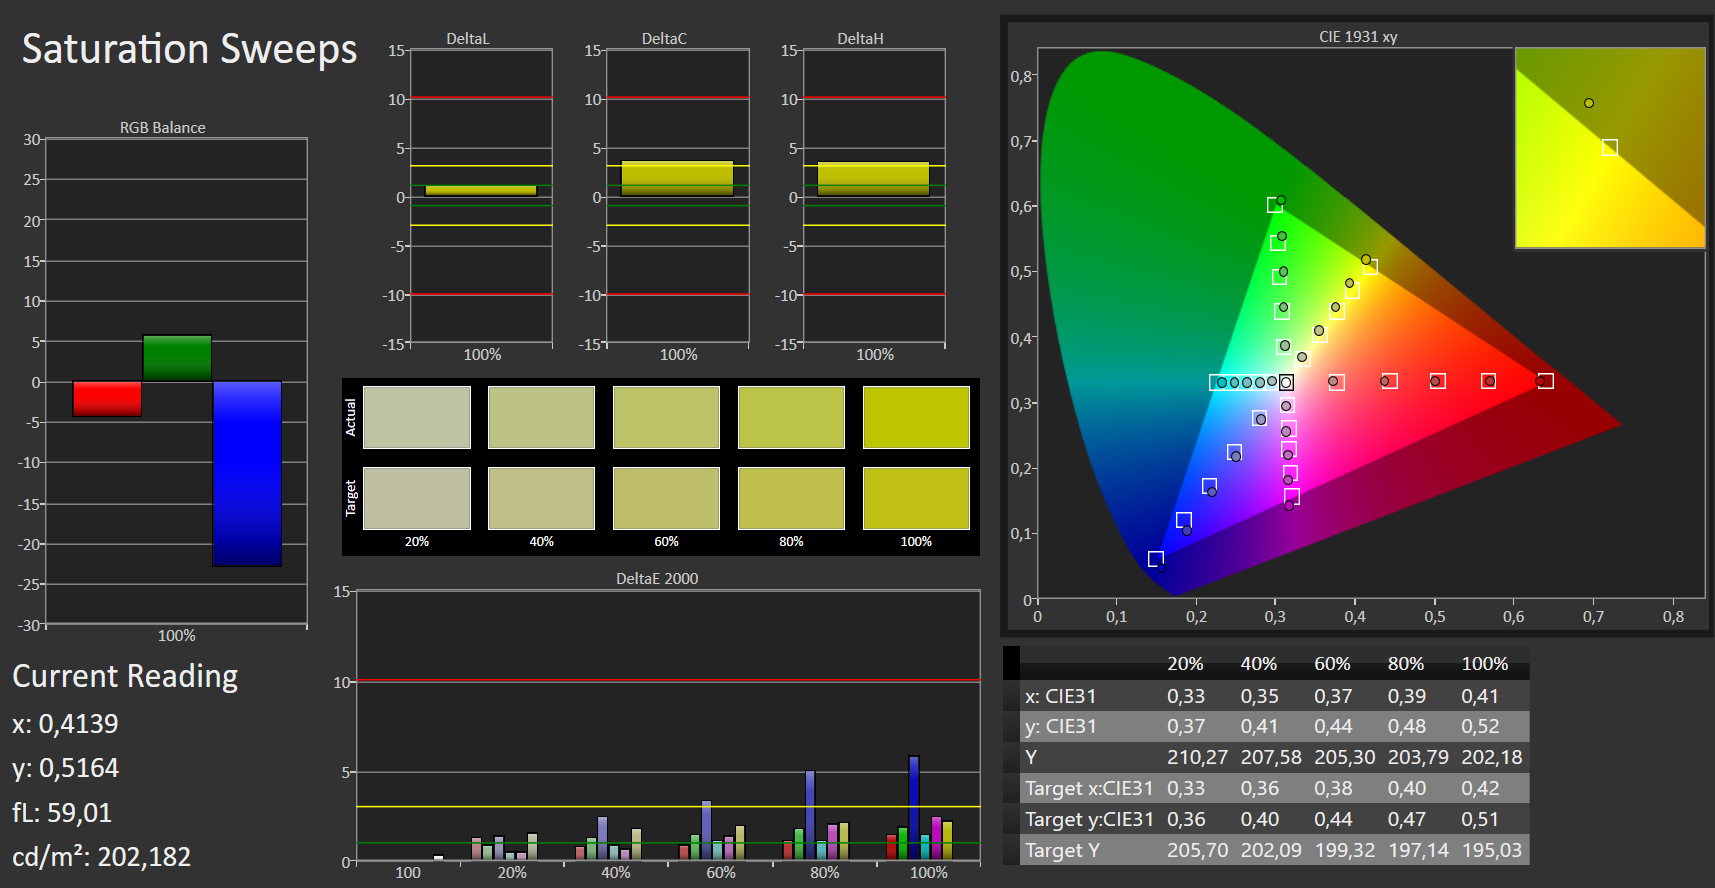
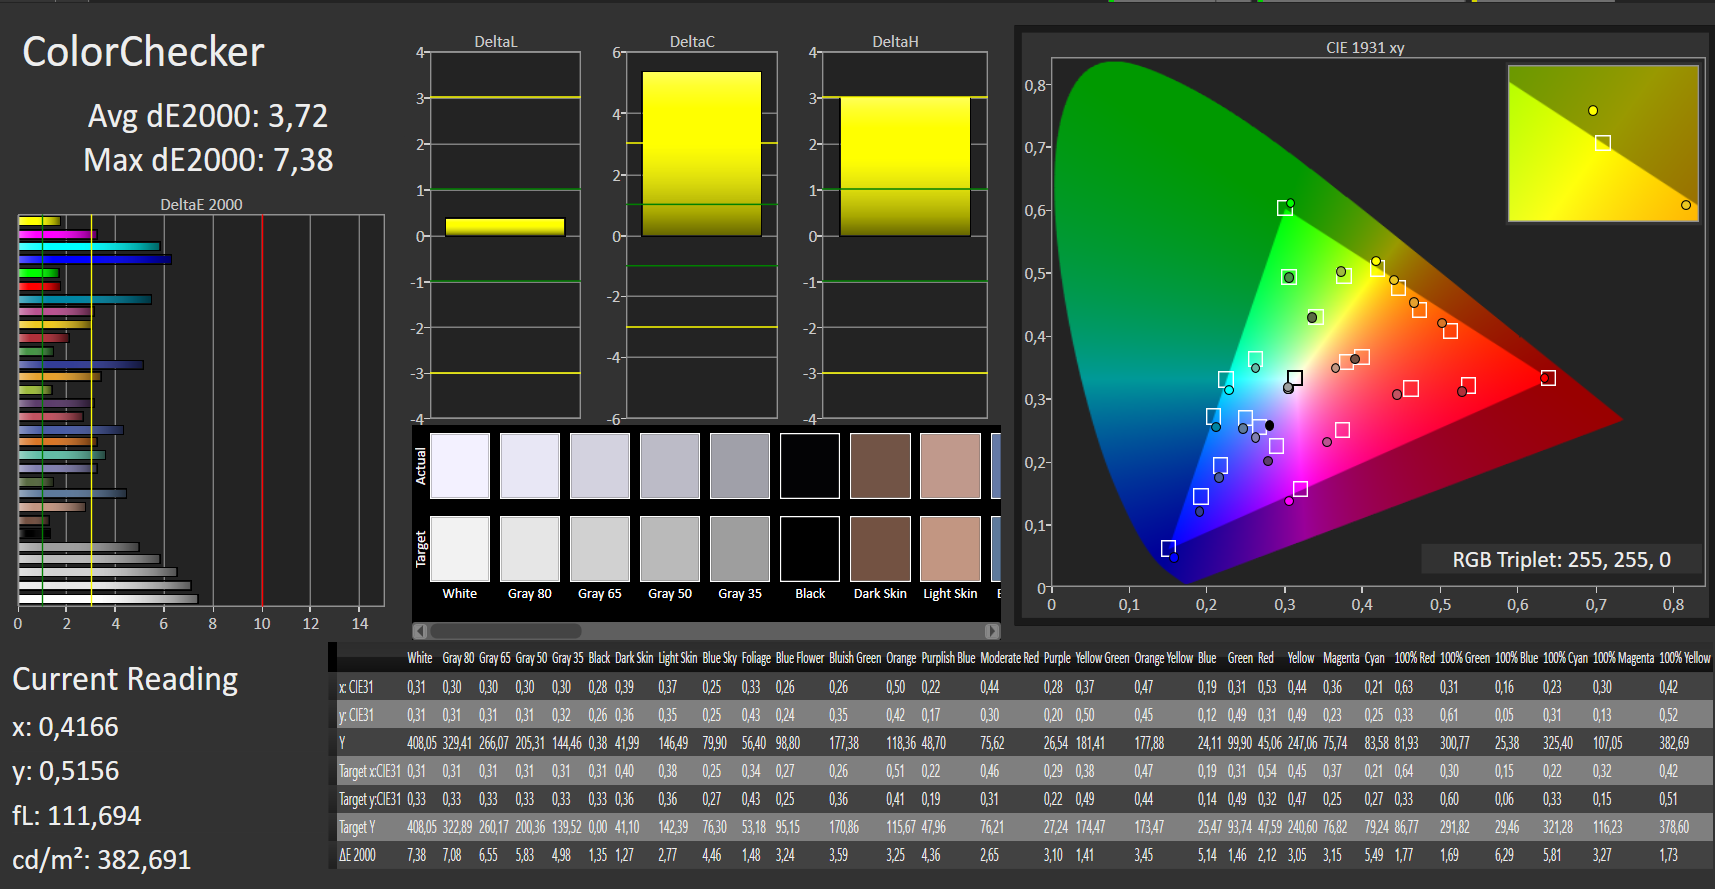
ΔE ColorChecker Calman: 3.72 | ∀{0.5-29.43 Ø4.73}
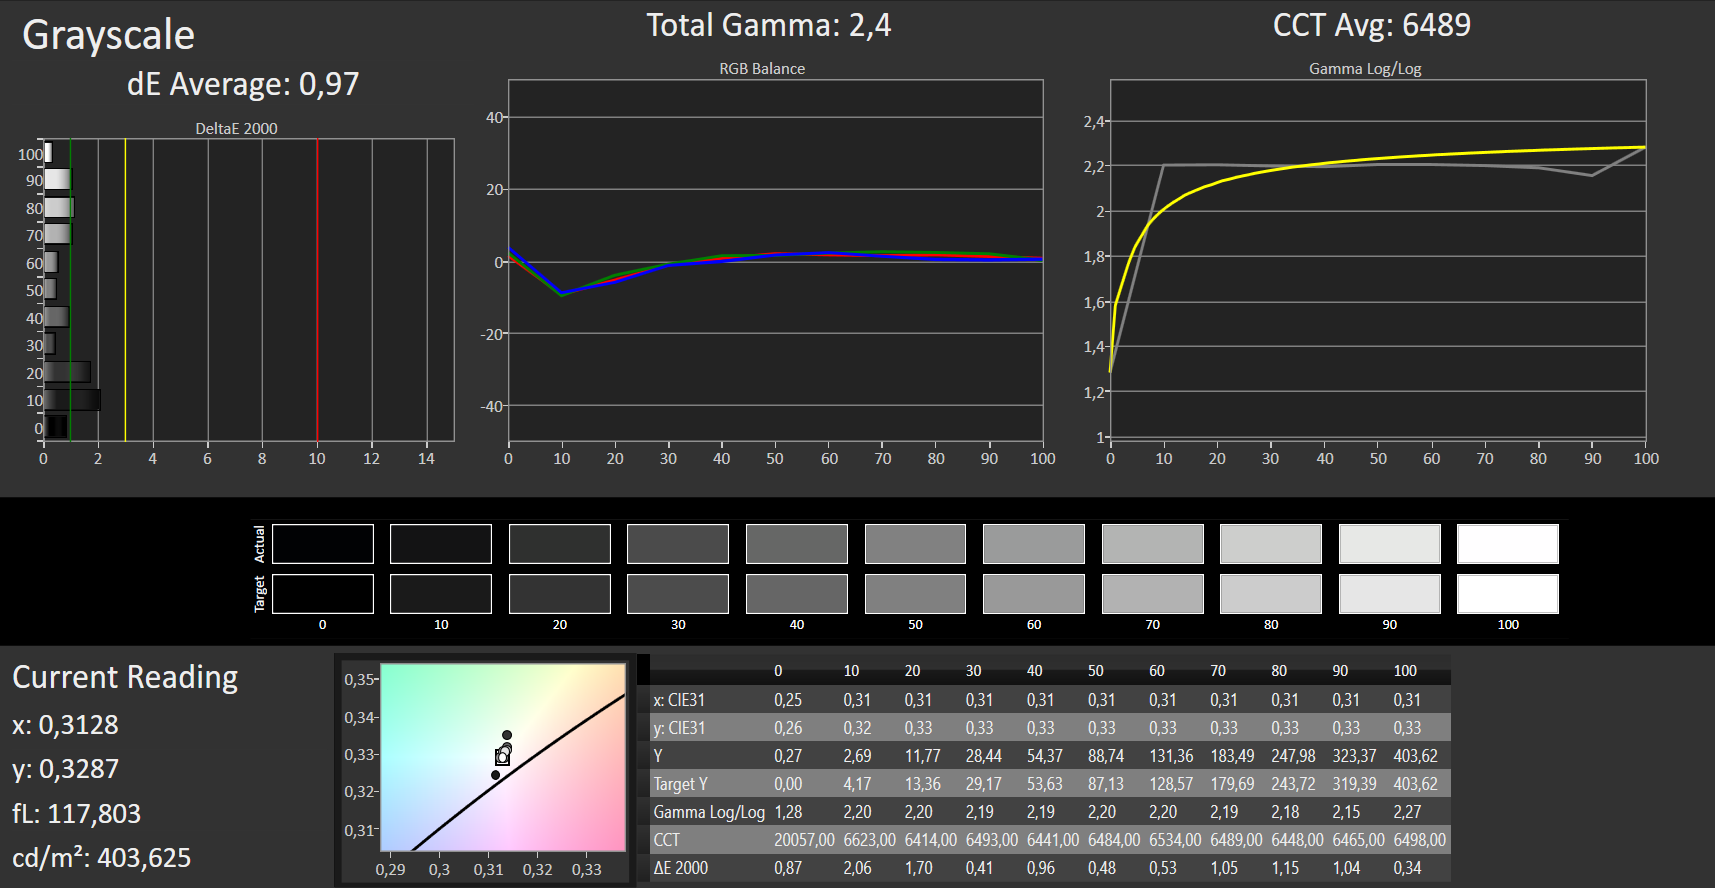
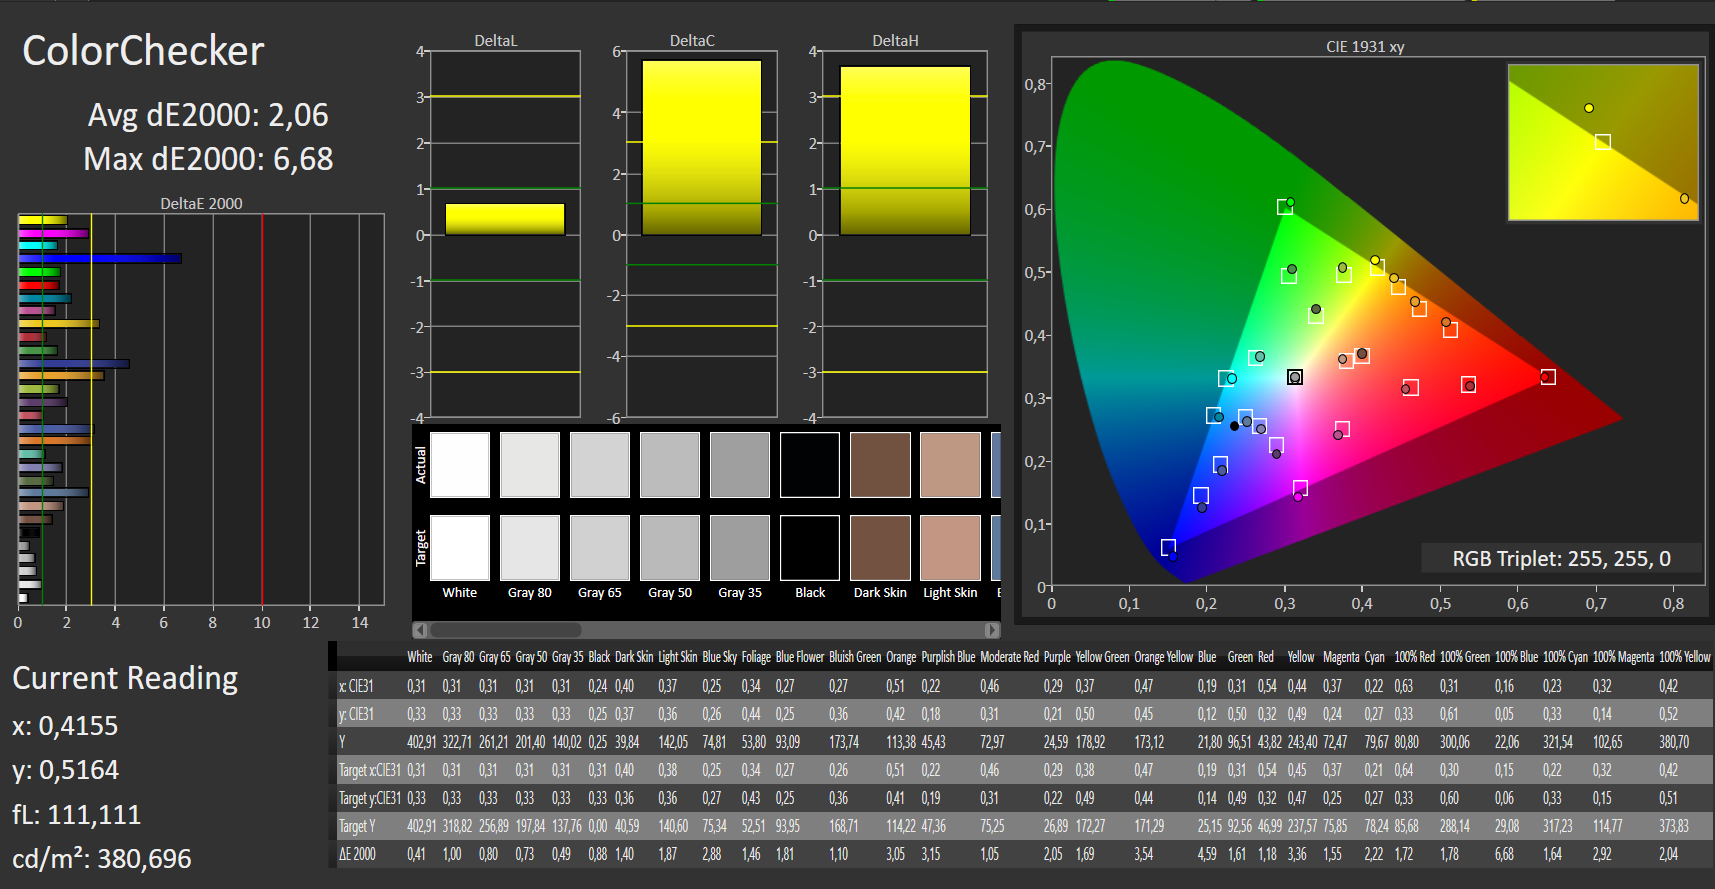
calibrated: 2.06
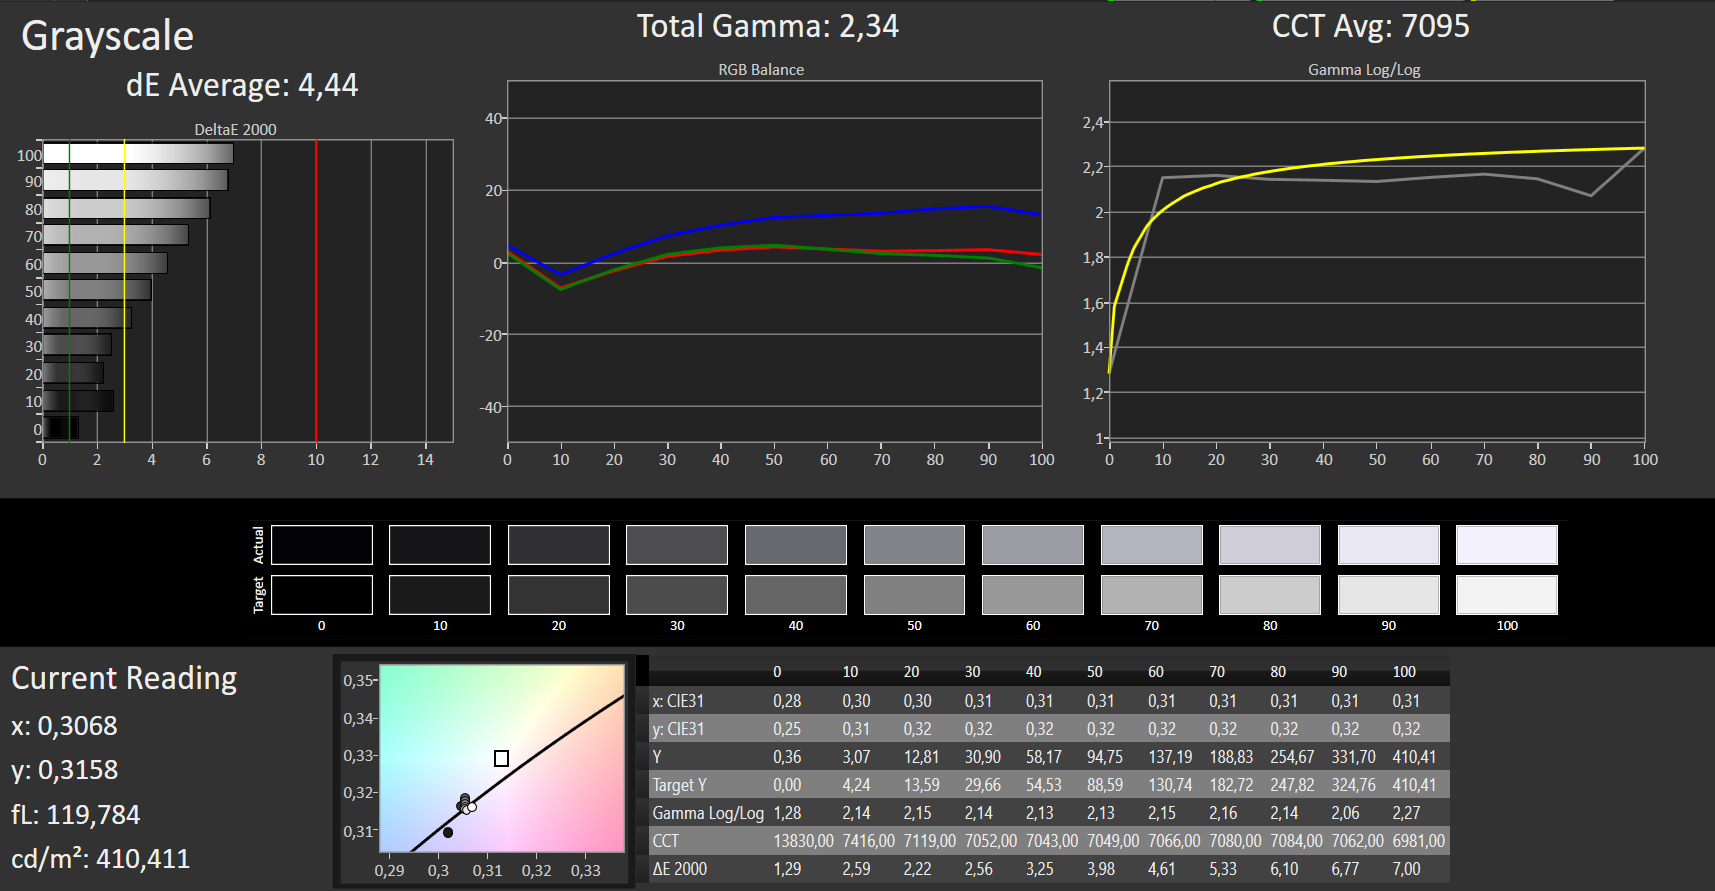
ΔE Greyscale Calman: 4.44 | ∀{0.09-98 Ø4.97}
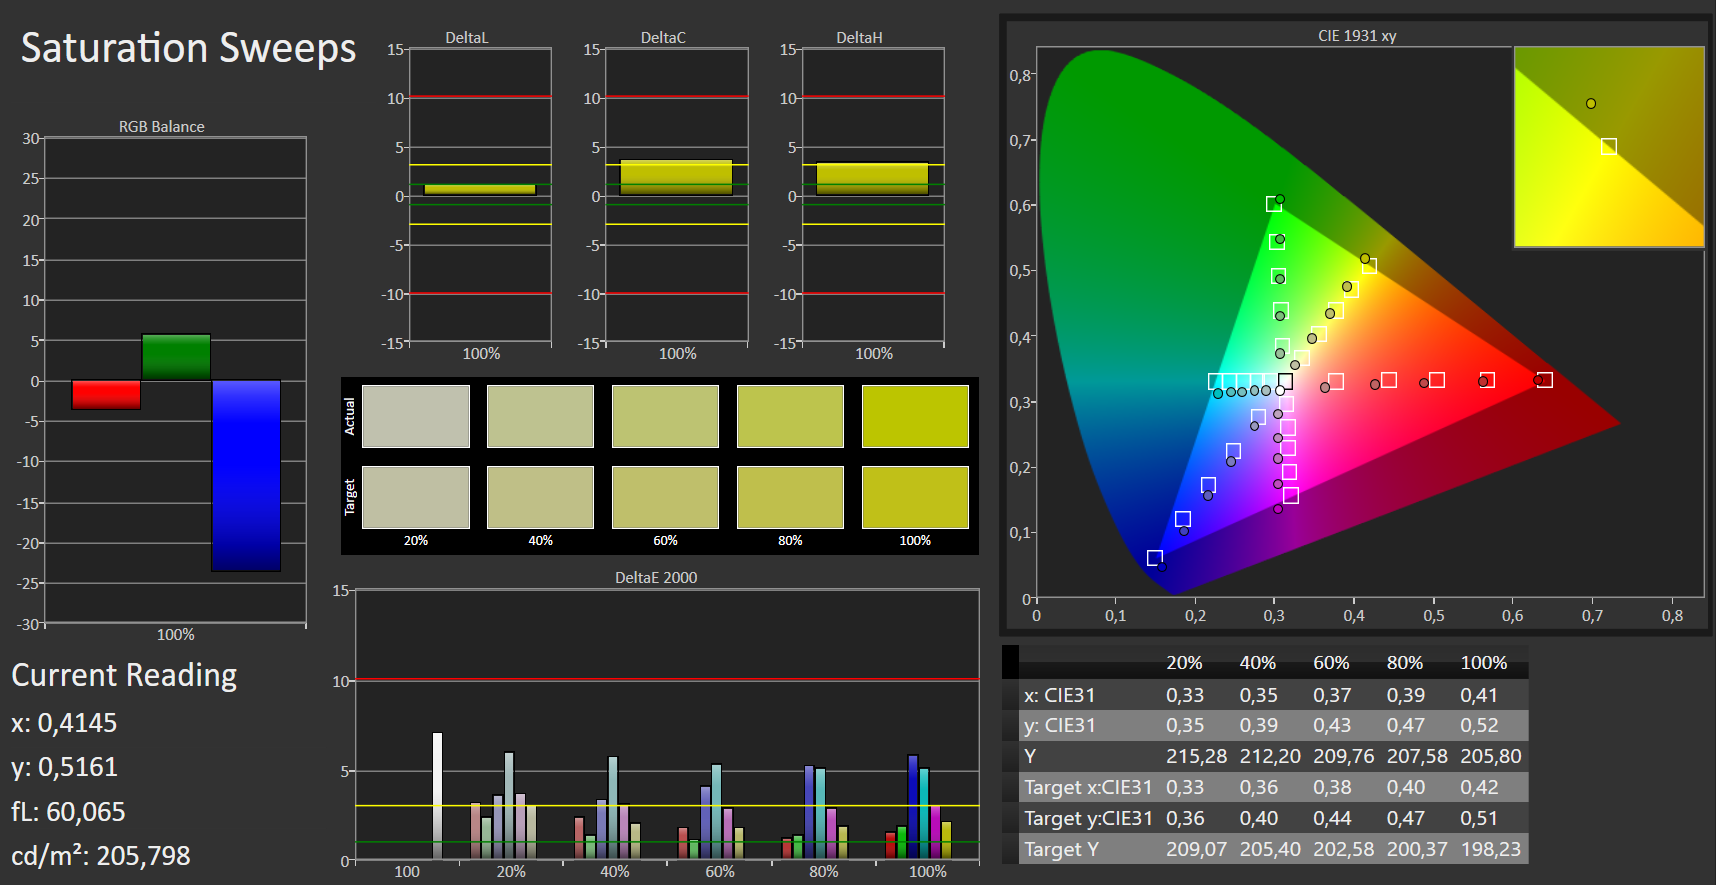
93% sRGB (Argyll 1.6.3 3D)
60% AdobeRGB 1998 (Argyll 1.6.3 3D)
65.3% AdobeRGB 1998 (Argyll 3D)
93.1% sRGB (Argyll 3D)
64.7% Display P3 (Argyll 3D)
Gamma: 2.34
CCT: 7095 K
| Dell XPS 13 9380 2019 ID: AUO 282B B133ZAN Dell: 90NTH, , 3840x2160, 13.3" | Dell XPS 13 9370 i7 UHD ID: Sharp SHP148B, Name: LQ133D1, Dell P/N: 8XDHY, , 3840x2160, 13.3" | Dell XPS 13 9370 FHD i5 SHP1484, , 1920x1080, 13.3" | Apple MacBook Pro 13 2018 Touchbar i5 APPA03E, , 2560x1600, 13.3" | Lenovo ThinkPad X280-20KES01S00 B125HAN02.2, , 1920x1080, 12.5" | Fujitsu Lifebook U938 Sharp LQ133M1JW28, , 1920x1080, 13.3" | HP EliteBook 830 G5-3JX74EA IVO M133NVF3-R0, , 1920x1080, 13.3" | HP Envy 13-ah0003ng M133NVF3 R0, , 1920x1080, 13.3" | Huawei MateBook 13 i7 Chi Mei CMN8201, , 2160x1440, 13" | |
|---|---|---|---|---|---|---|---|---|---|
| Display | 6% | 6% | 31% | -31% | 4% | -2% | -13% | 5% | |
| Display P3 Coverage (%) | 64.7 | 68.9 6% | 68.9 6% | 98.5 52% | 44 -32% | 67.5 4% | 64.2 -1% | 54.8 -15% | 68.1 5% |
| sRGB Coverage (%) | 93.1 | 98.4 6% | 96.6 4% | 99.9 7% | 64.5 -31% | 94.5 2% | 89.2 -4% | 82.5 -11% | 97.7 5% |
| AdobeRGB 1998 Coverage (%) | 65.3 | 69.5 6% | 69.6 7% | 87.3 34% | 45.45 -30% | 68.7 5% | 65.2 0% | 56.6 -13% | 69.2 6% |
| Response Times | -21% | -18% | 16% | 25% | 23% | 35% | 40% | 19% | |
| Response Time Grey 50% / Grey 80% * (ms) | 58 ? | 69.6 ? -20% | 62.4 ? -8% | 46 ? 21% | 40 ? 31% | 43 ? 26% | 36 ? 38% | 31 ? 47% | 43.2 ? 26% |
| Response Time Black / White * (ms) | 36 ? | 44 ? -22% | 45.6 ? -27% | 32 ? 11% | 29.6 ? 18% | 29 ? 19% | 24.8 ? 31% | 24 ? 33% | 32 ? 11% |
| PWM Frequency (Hz) | 3759 ? | 1008 ? | 118000 ? | 217 ? | 1020 ? | 1000 ? | |||
| Screen | 12% | 10% | 34% | -18% | 6% | -8% | 19% | 5% | |
| Brightness middle (cd/m²) | 404 | 478.5 18% | 428 6% | 519 28% | 344 -15% | 344 -15% | 316 -22% | 289 -28% | 366.6 -9% |
| Brightness (cd/m²) | 389 | 466 20% | 405 4% | 504 30% | 313 -20% | 320 -18% | 326 -16% | 310 -20% | 360 -7% |
| Brightness Distribution (%) | 85 | 86 1% | 87 2% | 95 12% | 82 -4% | 77 -9% | 85 0% | 85 0% | 93 9% |
| Black Level * (cd/m²) | 0.37 | 0.43 -16% | 0.26 30% | 0.33 11% | 0.25 32% | 0.31 16% | 0.19 49% | 0.23 38% | 0.39 -5% |
| Contrast (:1) | 1092 | 1113 2% | 1646 51% | 1573 44% | 1376 26% | 1110 2% | 1663 52% | 1257 15% | 940 -14% |
| Colorchecker dE 2000 * | 3.72 | 3.09 17% | 3.8 -2% | 1.4 62% | 4.7 -26% | 2.72 27% | 4.5 -21% | 1.64 56% | 2.76 26% |
| Colorchecker dE 2000 max. * | 7.38 | 5.94 20% | 7.2 2% | 2.8 62% | 19.4 -163% | 5.92 20% | 12.1 -64% | 3.31 55% | 6.19 16% |
| Colorchecker dE 2000 calibrated * | 2.06 | 2.06 -0% | 2.9 -41% | 0.99 52% | 1.53 26% | ||||
| Greyscale dE 2000 * | 4.44 | 2.4 46% | 4.4 1% | 2.2 50% | 2.2 50% | 2.74 38% | 5 -13% | 1.71 61% | 4.2 5% |
| Gamma | 2.34 94% | 2.063 107% | 2.21 100% | 2.22 99% | 2.16 102% | 2.38 92% | 2.22 99% | 2.32 95% | 2.22 99% |
| CCT | 7095 92% | 6883 94% | 7067 92% | 6908 94% | 6252 104% | 6794 96% | 6018 108% | 6291 103% | 6271 104% |
| Color Space (Percent of AdobeRGB 1998) (%) | 60 | 69.47 16% | 62.8 5% | 77.3 29% | 41.2 -31% | 61 2% | 57.9 -3% | 52 -13% | 63.2 5% |
| Color Space (Percent of sRGB) (%) | 93 | 98.36 6% | 96.4 4% | 99.99 8% | 64.1 -31% | 94 1% | 87.3 -6% | 82 -12% | 97.6 5% |
| Média Total (Programa/Configurações) | -1% /
7% | -1% /
6% | 27% /
31% | -8% /
-15% | 11% /
8% | 8% /
-1% | 15% /
15% | 10% /
7% |
* ... menor é melhor
Exibir tempos de resposta
| ↔ Tempo de resposta preto para branco | ||
|---|---|---|
| 36 ms ... ascensão ↗ e queda ↘ combinadas | ↗ 20 ms ascensão | 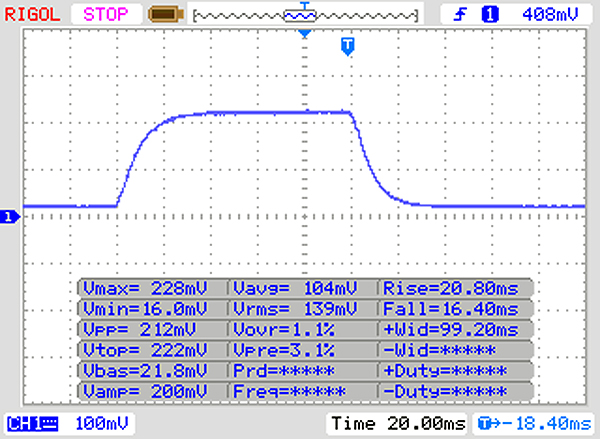 |
| ↘ 16 ms queda | ||
| A tela mostra taxas de resposta lentas em nossos testes e será insatisfatória para os jogadores. Em comparação, todos os dispositivos testados variam de 0.1 (mínimo) a 240 (máximo) ms. » 94 % de todos os dispositivos são melhores. Isso significa que o tempo de resposta medido é pior que a média de todos os dispositivos testados (19.9 ms). | ||
| ↔ Tempo de resposta 50% cinza a 80% cinza | ||
| 58 ms ... ascensão ↗ e queda ↘ combinadas | ↗ 26 ms ascensão | 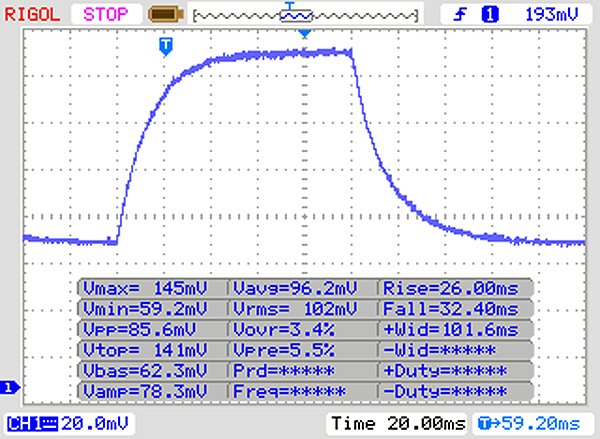 |
| ↘ 32 ms queda | ||
| A tela mostra taxas de resposta lentas em nossos testes e será insatisfatória para os jogadores. Em comparação, todos os dispositivos testados variam de 0.165 (mínimo) a 636 (máximo) ms. » 94 % de todos os dispositivos são melhores. Isso significa que o tempo de resposta medido é pior que a média de todos os dispositivos testados (31.1 ms). | ||
Cintilação da tela / PWM (modulação por largura de pulso)
| Tela tremeluzindo / PWM não detectado | 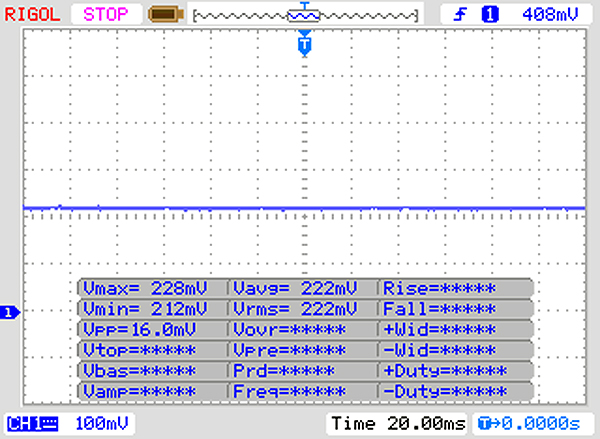 | ||
[pwm_comparison] Em comparação: 52 % de todos os dispositivos testados não usam PWM para escurecer a tela. Se PWM foi detectado, uma média de 7798 (mínimo: 5 - máximo: 343500) Hz foi medida. | |||
| PCMark 8 Home Score Accelerated v2 | 3519 pontos | |
| PCMark 8 Work Score Accelerated v2 | 4302 pontos | |
| PCMark 10 Score | 3835 pontos | |
Ajuda | ||
| Dell XPS 13 9380 2019 SK hynix PC401 HFS256GD9TNG | Dell XPS 13 9370 FHD i5 Toshiba XG5 KXG50ZNV256G | Apple MacBook Pro 13 2018 Touchbar i5 | Lenovo ThinkPad X280-20KES01S00 Samsung SSD PM981 MZVLB512HAJQ | Fujitsu Lifebook U938 Micron 1100 MTFDDAV256TBN | HP EliteBook 830 G5-3JX74EA Samsung SSD PM961 1TB M.2 PCIe 3.0 x4 NVMe (MZVLW1T0) | HP Envy 13-ah0003ng SK Hynix BC501 HFM512GDJTNG | Huawei MateBook 13 i7 Samsung SSD PM981 MZVLB512HAJQ | Média SK hynix PC401 HFS256GD9TNG | |
|---|---|---|---|---|---|---|---|---|---|
| CrystalDiskMark 5.2 / 6 | 47% | 3% | 58% | -32% | 56% | 6% | 100% | 12% | |
| Write 4K (MB/s) | 84.6 | 128.2 52% | 43.24 -49% | 125.3 48% | 80.5 -5% | 108.5 28% | 112.9 33% | 159.4 88% | 101.8 ? 20% |
| Read 4K (MB/s) | 38.52 | 48.09 25% | 14.07 -63% | 43.5 13% | 26.14 -32% | 40.53 5% | 38.69 0% | 47.31 23% | 40.9 ? 6% |
| Write Seq (MB/s) | 557 | 1088 95% | 887 59% | 112 -80% | 396.8 -29% | 1026 84% | 654 17% | 1899 241% | 673 ? 21% |
| Read Seq (MB/s) | 1393 | 1877 35% | 1515 9% | 2273 63% | 473.1 -66% | 2080 49% | 642 -54% | 2173 56% | 1464 ? 5% |
| Write 4K Q32T1 (MB/s) | 339.5 | 367.1 8% | 225.3 -34% | 641 89% | 264.2 -22% | 451 33% | 305.9 -10% | 368.1 8% | 294 ? -13% |
| Read 4K Q32T1 (MB/s) | 255.4 | 411.9 61% | 346.5 36% | 392 53% | 244 -4% | 269.7 6% | 351.6 38% | 526 106% | 302 ? 18% |
| Write Seq Q32T1 (MB/s) | 558 | 1078 93% | 859 54% | 1903 241% | 464.6 -17% | 1770 217% | 869 56% | 1914 243% | 760 ? 36% |
| Read Seq Q32T1 (MB/s) | 2541 | 2771 9% | 2915 15% | 3398 34% | 525 -79% | 3214 26% | 1683 -34% | 3487 37% | 2561 ? 1% |
| AS SSD | 6% | 90% | -41% | 114% | 12% | 119% | -19% | ||
| Seq Read (MB/s) | 2035 | 1442 -29% | 2316 14% | 455.5 -78% | 2423 19% | 494.3 -76% | 1889 -7% | 1882 ? -8% | |
| Seq Write (MB/s) | 658 | 1694 157% | 1385 110% | 364.5 -45% | 1141 73% | 720 9% | 1812 175% | 593 ? -10% | |
| 4K Read (MB/s) | 39.74 | 9.7 -76% | 47.2 19% | 24.41 -39% | 47.17 19% | 38.35 -3% | 55.5 40% | 38.9 ? -2% | |
| 4K Write (MB/s) | 105.7 | 20 -81% | 105.3 0% | 73.8 -30% | 115.6 9% | 98.4 -7% | 118.4 12% | 100.2 ? -5% | |
| 4K-64 Read (MB/s) | 461 | 957 108% | 1218 164% | 235.7 -49% | 1144 148% | 611 33% | 1257 173% | 452 ? -2% | |
| 4K-64 Write (MB/s) | 300.1 | 162 -46% | 1309 336% | 308.8 3% | 1571 423% | 712 137% | 1571 423% | 290 ? -3% | |
| Access Time Read * (ms) | 0.061 | 0.041 33% | 0.099 -62% | 0.04 34% | 0.061 -0% | 0.041 33% | 0.1118 ? -83% | ||
| Access Time Write * (ms) | 0.051 | 0.036 29% | 0.057 -12% | 0.031 39% | 0.037 27% | 0.032 37% | 0.1111 ? -118% | ||
| Score Read (Points) | 704 | 1497 113% | 306 -57% | 1433 104% | 698 -1% | 1502 113% | 679 ? -4% | ||
| Score Write (Points) | 471 | 1553 230% | 419 -11% | 1801 282% | 883 87% | 1871 297% | 450 ? -4% | ||
| Score Total (Points) | 1479 | 3774 155% | 885 -40% | 3910 164% | 1961 33% | 4147 180% | 1423 ? -4% | ||
| Copy ISO MB/s (MB/s) | 893 | 1068 20% | 442.4 -50% | 2452 175% | 860 -4% | 1800 102% | 748 ? -16% | ||
| Copy Program MB/s (MB/s) | 287.9 | 327.5 14% | 163.9 -43% | 421.9 47% | 244 -15% | 385.6 34% | 358 ? 24% | ||
| Copy Game MB/s (MB/s) | 618 | 717 16% | 275.8 -55% | 991 60% | 282 -54% | 982 59% | 423 ? -32% | ||
| Média Total (Programa/Configurações) | 47% /
47% | 5% /
4% | 74% /
78% | -37% /
-37% | 85% /
93% | 9% /
10% | 110% /
112% | -4% /
-8% |
* ... menor é melhor

| 3DMark 11 Performance | 2053 pontos | |
| 3DMark Cloud Gate Standard Score | 9514 pontos | |
Ajuda | ||
| Thief - 1024x768 Very Low Preset | |
| Média Intel UHD Graphics 620 (16.3 - 34.3, n=10) | |
| Dell XPS 13 9380 2019 | |
| Rise of the Tomb Raider - 1024x768 Lowest Preset | |
| Apple MacBook Pro 13 2018 Touchbar i5 | |
| HP EliteBook 830 G5-3JX74EA | |
| Dell XPS 13 9370 i7 UHD | |
| Lenovo ThinkPad X280-20KES01S00 | |
| Média Intel UHD Graphics 620 (10.4 - 110.7, n=82) | |
| Dell XPS 13 9380 2019 | |
| Fujitsu Lifebook U938 | |
| F1 2018 - 1280x720 Ultra Low Preset | |
| HP Envy 13-ah0003ng | |
| Apple MacBook Pro 13 2018 Touchbar i5 | |
| Dell XPS 13 9380 2019 | |
| Média Intel UHD Graphics 620 (31 - 35.8, n=5) | |
| Shadow of the Tomb Raider - 1280x720 Lowest Preset | |
| Média da turma Subnotebook (41 - 109, n=8, últimos 2 anos) | |
| HP Envy 13-ah0003ng | |
| Apple MacBook Pro 13 2018 Touchbar i5 | |
| Dell XPS 13 9380 2019 | |
| Média Intel UHD Graphics 620 (12 - 21.7, n=13) | |
| FIFA 19 - 1920x1080 High Preset AA:2x MS | |
| Dell XPS 13 9380 2019 | |
| HP Envy 13-ah0003ng | |
| Média Intel UHD Graphics 620 (20.7 - 51, n=2) | |
| Darksiders III - 1280x720 Low | |
| Dell XPS 13 9380 2019 | |
| Média Intel UHD Graphics 620 (16.5 - 30.4, n=4) | |
| baixo | média | alto | ultra | |
|---|---|---|---|---|
| BioShock Infinite (2013) | 71.3 | 37.4 | 31.2 | 9.8 |
| Thief (2014) | 23.9 | 12.8 | ||
| Rise of the Tomb Raider (2016) | 20.5 | 17.4 | 6.9 | |
| F1 2018 (2018) | 33 | 15 | 14 | |
| Shadow of the Tomb Raider (2018) | 15 | 10 | ||
| FIFA 19 (2018) | 48 | 53.4 | 51 | |
| Darksiders III (2018) | 26.3 | 7.3 |
Barulho
| Ocioso |
| 30.4 / 30.4 / 30.4 dB |
| Carga |
| 31.7 / 38.1 dB |
 | ||
30 dB silencioso 40 dB(A) audível 50 dB(A) ruidosamente alto |
||
min: | ||
(-) A temperatura máxima no lado superior é 47.2 °C / 117 F, em comparação com a média de 35.9 °C / 97 F , variando de 21.4 a 59 °C para a classe Subnotebook.
(±) A parte inferior aquece até um máximo de 43.3 °C / 110 F, em comparação com a média de 39.2 °C / 103 F
(+) Em uso inativo, a temperatura média para o lado superior é 26.4 °C / 80 F, em comparação com a média do dispositivo de 30.8 °C / ### class_avg_f### F.
(+) Os apoios para as mãos e o touchpad estão atingindo a temperatura máxima da pele (32.4 °C / 90.3 F) e, portanto, não estão quentes.
(-) A temperatura média da área do apoio para as mãos de dispositivos semelhantes foi 28.2 °C / 82.8 F (-4.2 °C / -7.5 F).
Dell XPS 13 9380 2019 análise de áudio
(-) | alto-falantes não muito altos (###valor### dB)
Graves 100 - 315Hz
(-) | quase nenhum baixo - em média 20.4% menor que a mediana
(±) | a linearidade dos graves é média (9.4% delta para a frequência anterior)
Médios 400 - 2.000 Hz
(±) | médios mais altos - em média 6.9% maior que a mediana
(±) | a linearidade dos médios é média (10.2% delta para frequência anterior)
Altos 2 - 16 kHz
(+) | agudos equilibrados - apenas 3.6% longe da mediana
(+) | os máximos são lineares (5% delta da frequência anterior)
Geral 100 - 16.000 Hz
(±) | a linearidade do som geral é média (26.6% diferença em relação à mediana)
Comparado com a mesma classe
» 88% de todos os dispositivos testados nesta classe foram melhores, 1% semelhantes, 10% piores
» O melhor teve um delta de 5%, a média foi 18%, o pior foi 53%
Comparado com todos os dispositivos testados
» 82% de todos os dispositivos testados foram melhores, 3% semelhantes, 15% piores
» O melhor teve um delta de 4%, a média foi 24%, o pior foi 134%
Apple MacBook Pro 13 2018 Touchbar i5 análise de áudio
(+) | os alto-falantes podem tocar relativamente alto (###valor### dB)
Graves 100 - 315Hz
(±) | graves reduzidos - em média 6.9% menor que a mediana
(+) | o baixo é linear (6.7% delta para a frequência anterior)
Médios 400 - 2.000 Hz
(+) | médios equilibrados - apenas 1.9% longe da mediana
(+) | médios são lineares (3.8% delta para frequência anterior)
Altos 2 - 16 kHz
(+) | agudos equilibrados - apenas 3.6% longe da mediana
(+) | os máximos são lineares (6.3% delta da frequência anterior)
Geral 100 - 16.000 Hz
(+) | o som geral é linear (9.5% diferença em relação à mediana)
Comparado com a mesma classe
» 5% de todos os dispositivos testados nesta classe foram melhores, 2% semelhantes, 93% piores
» O melhor teve um delta de 5%, a média foi 18%, o pior foi 53%
Comparado com todos os dispositivos testados
» 4% de todos os dispositivos testados foram melhores, 1% semelhantes, 95% piores
» O melhor teve um delta de 4%, a média foi 24%, o pior foi 134%
HP Envy 13-ah0003ng análise de áudio
(-) | alto-falantes não muito altos (###valor### dB)
Graves 100 - 315Hz
(-) | quase nenhum baixo - em média 23.3% menor que a mediana
(±) | a linearidade dos graves é média (12.4% delta para a frequência anterior)
Médios 400 - 2.000 Hz
(+) | médios equilibrados - apenas 2.2% longe da mediana
(+) | médios são lineares (4.8% delta para frequência anterior)
Altos 2 - 16 kHz
(+) | agudos equilibrados - apenas 1.3% longe da mediana
(+) | os máximos são lineares (4.4% delta da frequência anterior)
Geral 100 - 16.000 Hz
(±) | a linearidade do som geral é média (16.8% diferença em relação à mediana)
Comparado com a mesma classe
» 43% de todos os dispositivos testados nesta classe foram melhores, 7% semelhantes, 49% piores
» O melhor teve um delta de 5%, a média foi 18%, o pior foi 53%
Comparado com todos os dispositivos testados
» 29% de todos os dispositivos testados foram melhores, 8% semelhantes, 63% piores
» O melhor teve um delta de 4%, a média foi 24%, o pior foi 134%
| desligado | |
| Ocioso | |
| Carga |
|
Key:
min: | |
| Dell XPS 13 9380 2019 i5-8265U, UHD Graphics 620, SK hynix PC401 HFS256GD9TNG, IPS, 3840x2160, 13.3" | Dell XPS 13 9370 FHD i5 i5-8250U, UHD Graphics 620, Toshiba XG5 KXG50ZNV256G, IPS, 1920x1080, 13.3" | Dell XPS 13 9370 i7 UHD i5-8550U, UHD Graphics 620, Toshiba XG5 KXG50ZNV512G, IPS, 3840x2160, 13.3" | Apple MacBook Pro 13 2018 Touchbar i5 i5-8259U, Iris Plus Graphics 655, , IPS, 2560x1600, 13.3" | Lenovo ThinkPad X280-20KES01S00 i5-8250U, UHD Graphics 620, Samsung SSD PM981 MZVLB512HAJQ, IPS LED, 1920x1080, 12.5" | Fujitsu Lifebook U938 i5-8250U, UHD Graphics 620, Micron 1100 MTFDDAV256TBN, IPS, 1920x1080, 13.3" | HP EliteBook 830 G5-3JX74EA i5-8550U, UHD Graphics 620, Samsung SSD PM961 1TB M.2 PCIe 3.0 x4 NVMe (MZVLW1T0), IPS LED, 1920x1080, 13.3" | HP Envy 13-ah0003ng i5-8550U, GeForce MX150, SK Hynix BC501 HFM512GDJTNG, IPS, 1920x1080, 13.3" | Huawei MateBook 13 i7 i7-8565U, GeForce MX150, Samsung SSD PM981 MZVLB512HAJQ, IPS, 2160x1440, 13" | Média Intel UHD Graphics 620 | Média da turma Subnotebook | |
|---|---|---|---|---|---|---|---|---|---|---|---|
| Power Consumption | 22% | -2% | -8% | 15% | 36% | 3% | 4% | -17% | 13% | 5% | |
| Idle Minimum * (Watt) | 4.8 | 3.14 35% | 5 -4% | 2.3 52% | 3.11 35% | 2.4 50% | 4.5 6% | 5.3 -10% | 3.5 27% | 3.81 ? 21% | 3.82 ? 20% |
| Idle Average * (Watt) | 8.6 | 5.22 39% | 8.3 3% | 8.7 -1% | 5.01 42% | 5.5 36% | 6.4 26% | 7.3 15% | 7.5 13% | 6.94 ? 19% | 6.61 ? 23% |
| Idle Maximum * (Watt) | 10.4 | 6 42% | 8.8 15% | 12.2 -17% | 8.11 22% | 6 42% | 9.2 12% | 9.3 11% | 12.4 -19% | 8.75 ? 16% | 7.99 ? 23% |
| Load Average * (Watt) | 37.9 | 38.5 -2% | 46.4 -22% | 53.3 -41% | 44.6 -18% | 31 18% | 35.7 6% | 39 -3% | 64.2 -69% | 35 ? 8% | 41.9 ? -11% |
| Load Maximum * (Watt) | 48.5 | 50.4 -4% | 48.6 -0% | 64 -32% | 51.7 -7% | 32.6 33% | 65.4 -35% | 46 5% | 65.7 -35% | 47.5 ? 2% | 64.1 ? -32% |
| Witcher 3 ultra * (Watt) | 52.5 |
* ... menor é melhor
| Dell XPS 13 9380 2019 i5-8265U, UHD Graphics 620, 52 Wh | Dell XPS 13 9370 FHD i5 i5-8250U, UHD Graphics 620, 52 Wh | Apple MacBook Pro 13 2018 Touchbar i5 i5-8259U, Iris Plus Graphics 655, 58 Wh | Lenovo ThinkPad X280-20KES01S00 i5-8250U, UHD Graphics 620, 50 Wh | Fujitsu Lifebook U938 i5-8250U, UHD Graphics 620, 50 Wh | HP EliteBook 830 G5-3JX74EA i5-8550U, UHD Graphics 620, 49 Wh | HP Envy 13-ah0003ng i5-8550U, GeForce MX150, 53.2 Wh | Huawei MateBook 13 i7 i7-8565U, GeForce MX150, 41.7 Wh | Média da turma Subnotebook | |
|---|---|---|---|---|---|---|---|---|---|
| Duração da bateria | 16% | 17% | 2% | 1% | -15% | -12% | -27% | 39% | |
| Reader / Idle (h) | 17.2 | 23.6 37% | 20.2 17% | 19.5 13% | 12.8 -26% | 15.5 -10% | 15.4 -10% | 28.6 ? 66% | |
| WiFi v1.3 (h) | 8.3 | 10.7 29% | 9.7 17% | 8.9 7% | 8.4 1% | 7.1 -14% | 8 -4% | 7.6 -8% | 14 ? 69% |
| Load (h) | 2.4 | 2 -17% | 2 -17% | 2.1 -12% | 2.3 -4% | 1.9 -21% | 0.9 -62% | 1.946 ? -19% | |
| H.264 (h) | 13.9 | 10.9 | 9.5 | 7.2 | 8 | 6.3 | 15.6 ? | ||
| Witcher 3 ultra (h) | 1.6 |
Pro
Contra
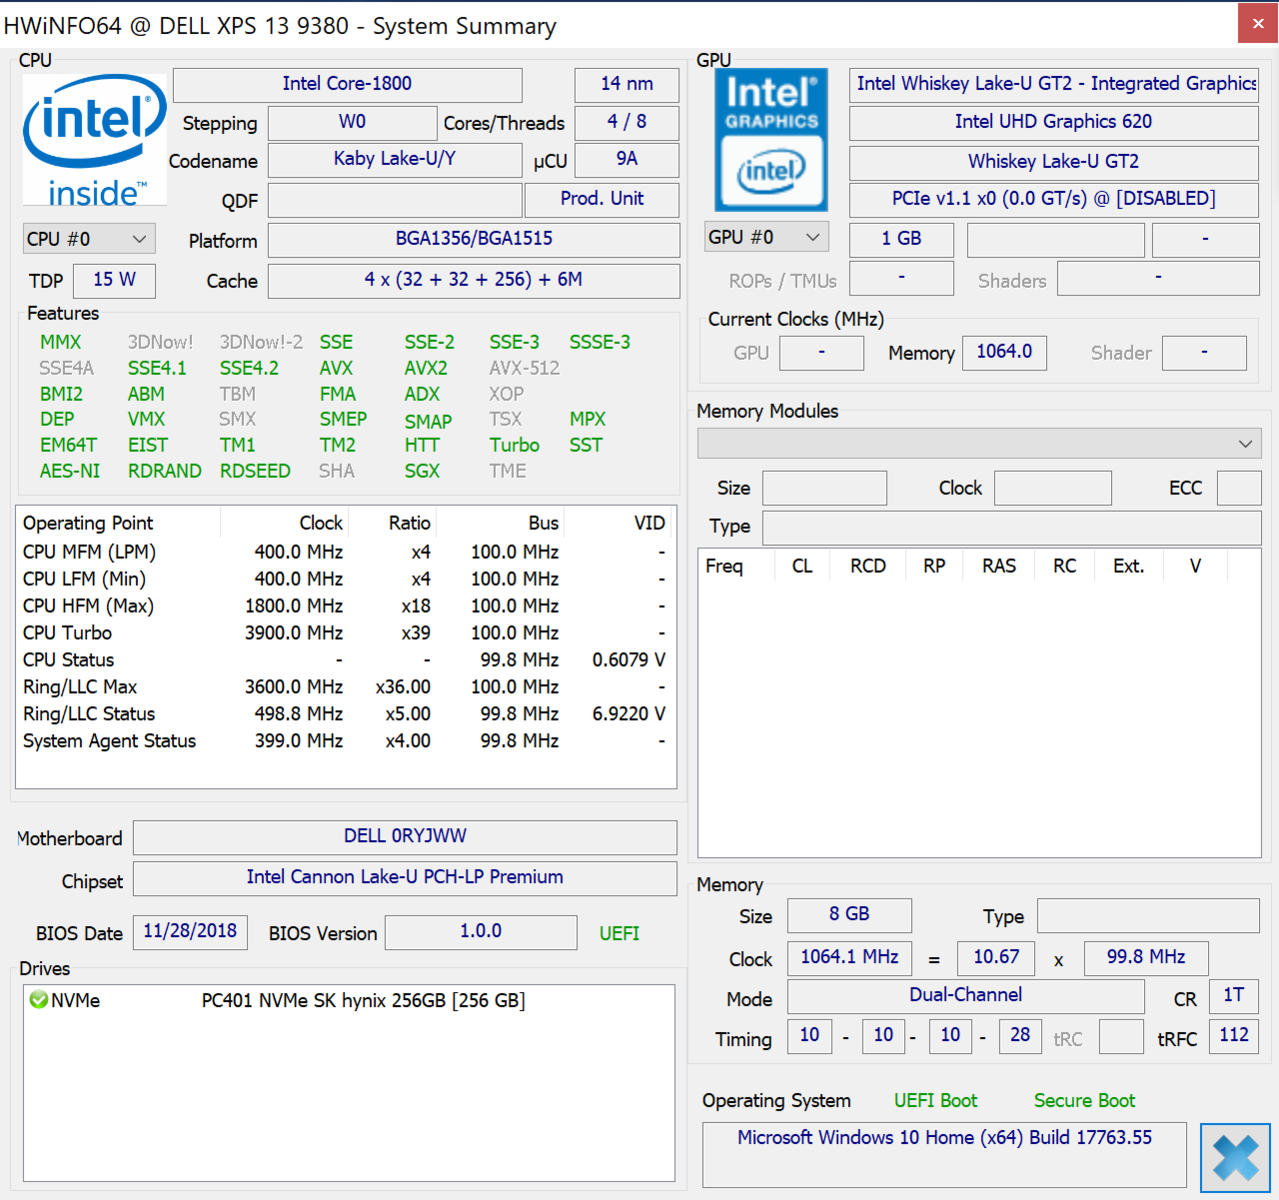
A Dell lança a próxima atualização do XPS 13, mas as alterações são pequenas e não justificam uma atualização do predecessor XPS 13 9370 (2018), mas certamente justifica uma atualização do 9360 (2016). Sua CPU dual-core Kaby Lake é notavelmente mais lenta que os atuais quatro núcleos.
A Dell obviamente retrabalhou o controle de temperatura. Em comparação com o processador quad-core de 2018, o desempenho é melhor, mas apenas sob uso intenso sustentado. Muitos Ultrabooks precisam reduzir a velocidade da CPU sob uso intenso sustentado para reduzir as temperaturas; o XPS continua a funcionar em altas velocidades. O XPS 13 2019 reduz apenas a sua frequência da CPU em 8% em média (comparado com a velocidade Turbo máxima!) e é mais rápida do que a quad-core Kaby Lake-R no 2018 XPS 13 9370.
O 2019 XPS 13 reduz apenas sua frequência de CPU em 8% sob cargas de trabalho sustentadas e é mais rápido do que o quad-core Kaby Lake-R no XPS 13 2018.
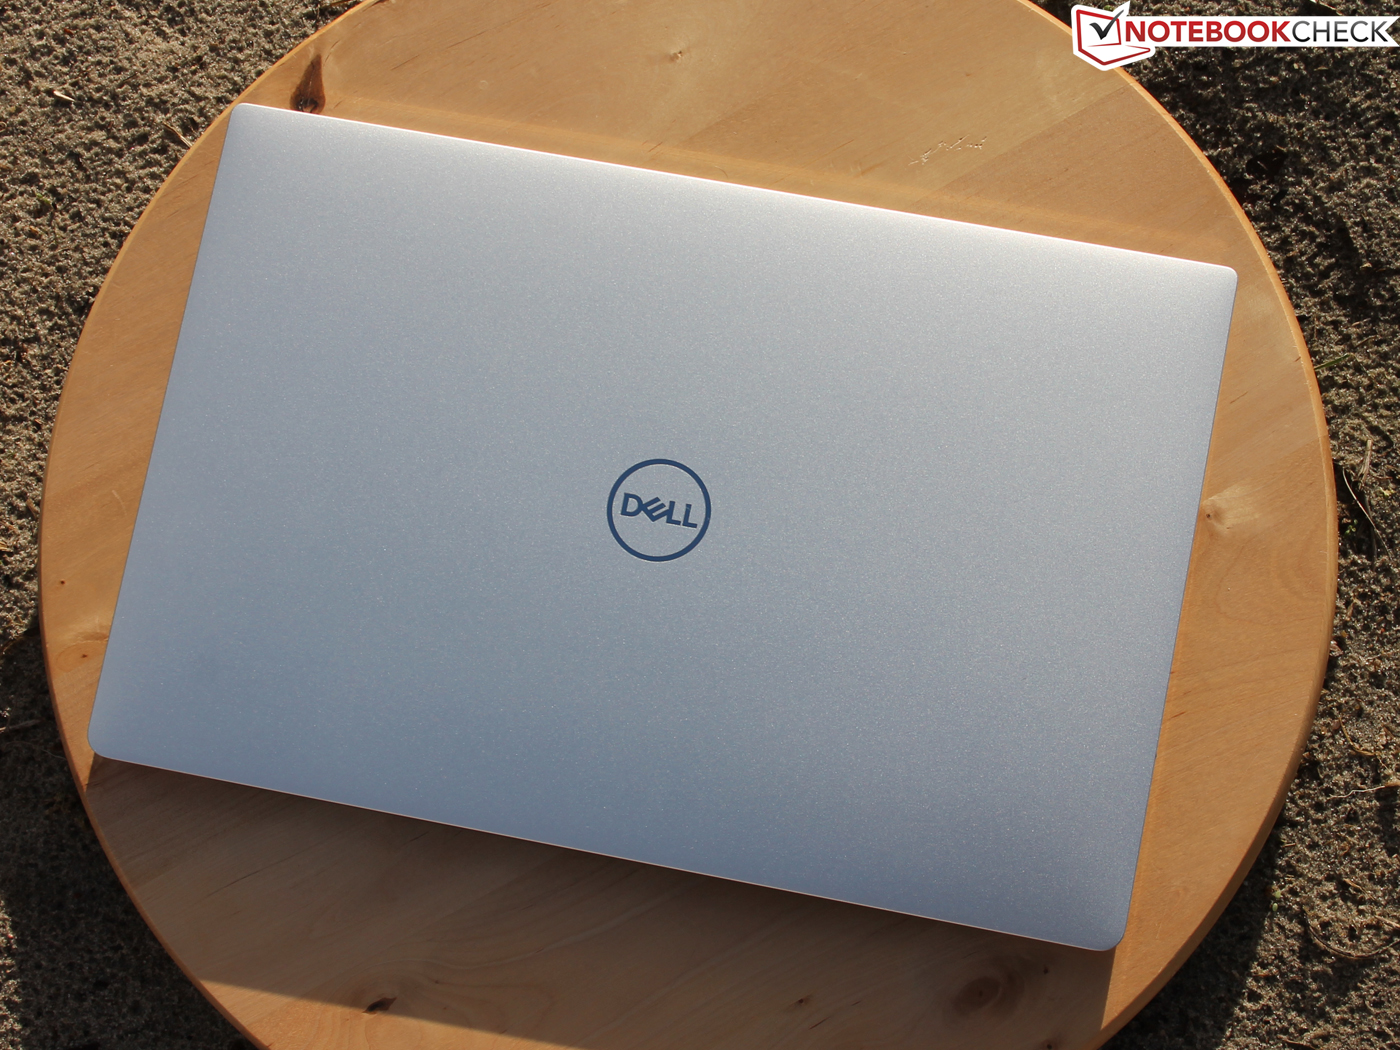
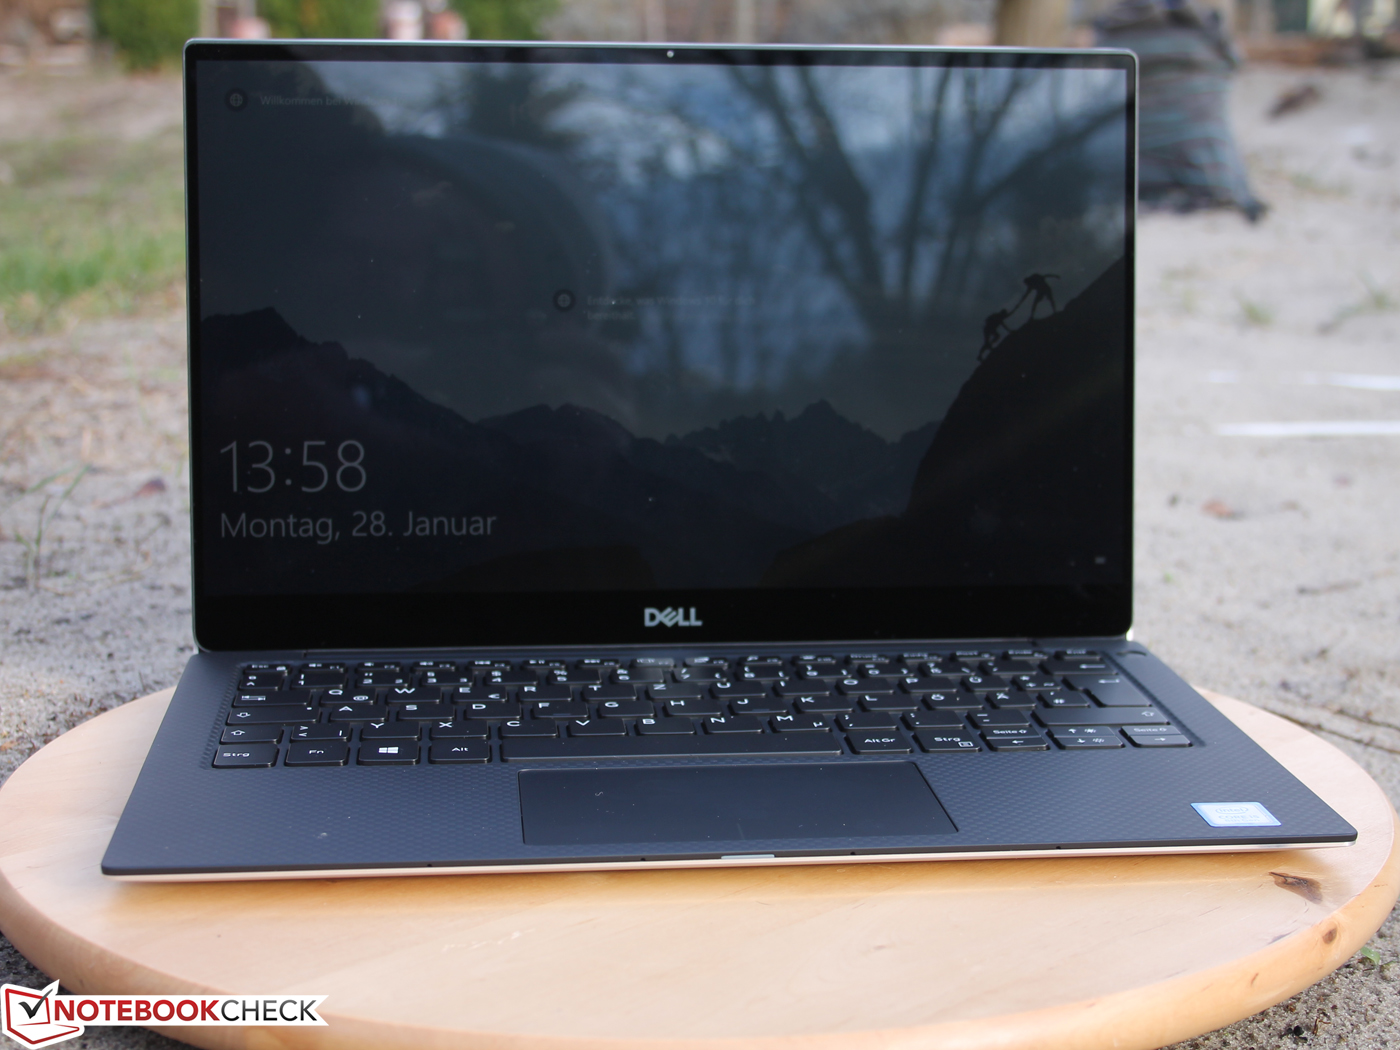
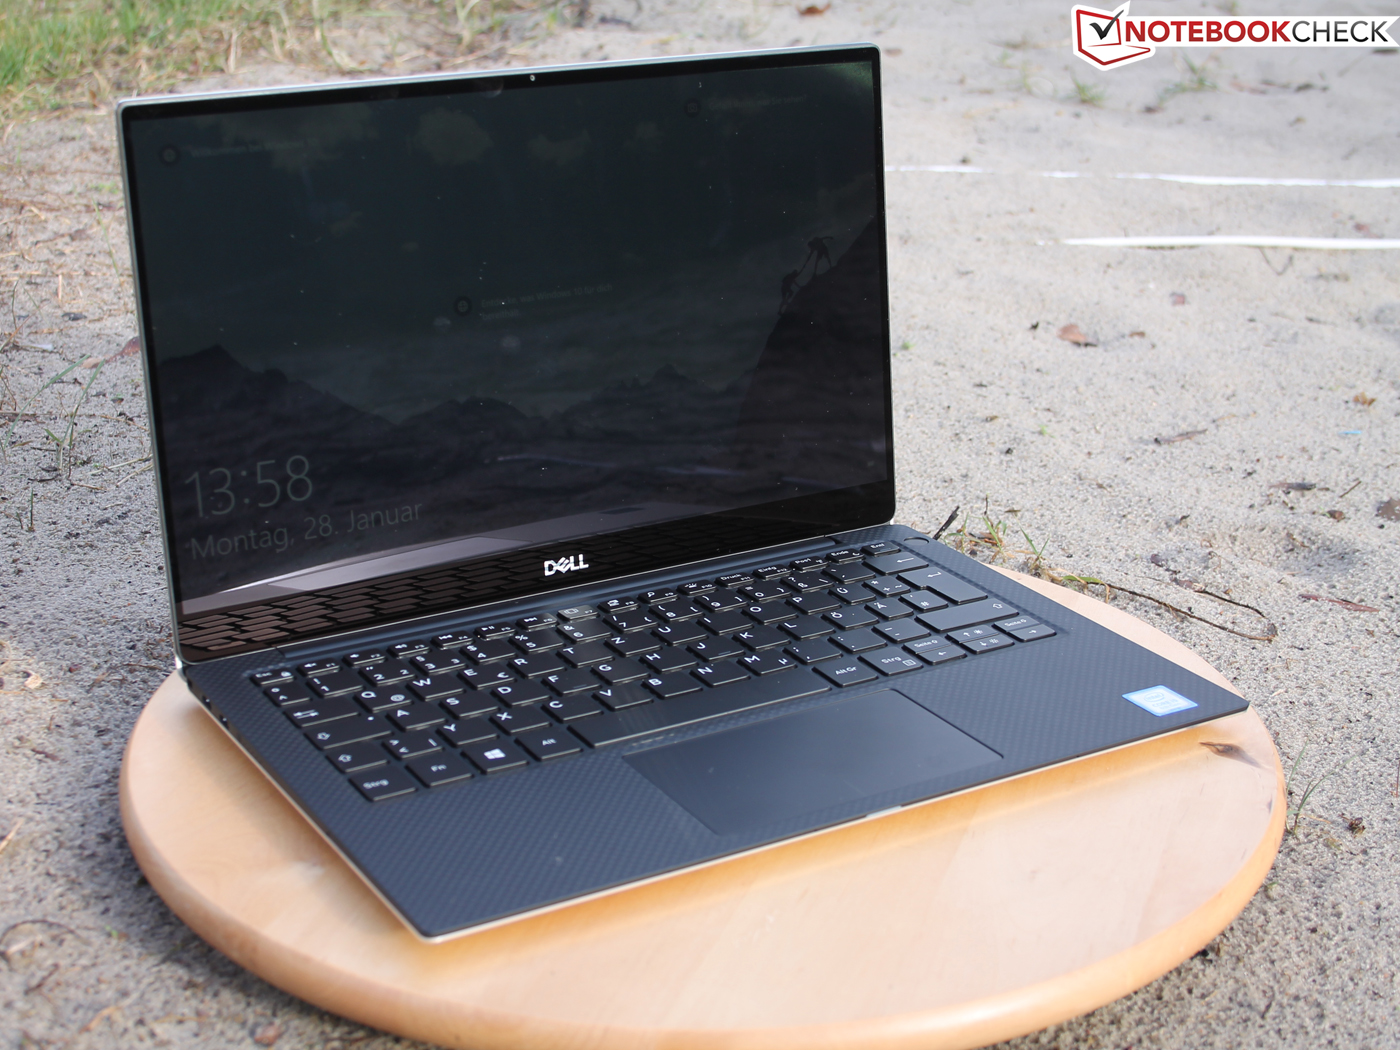
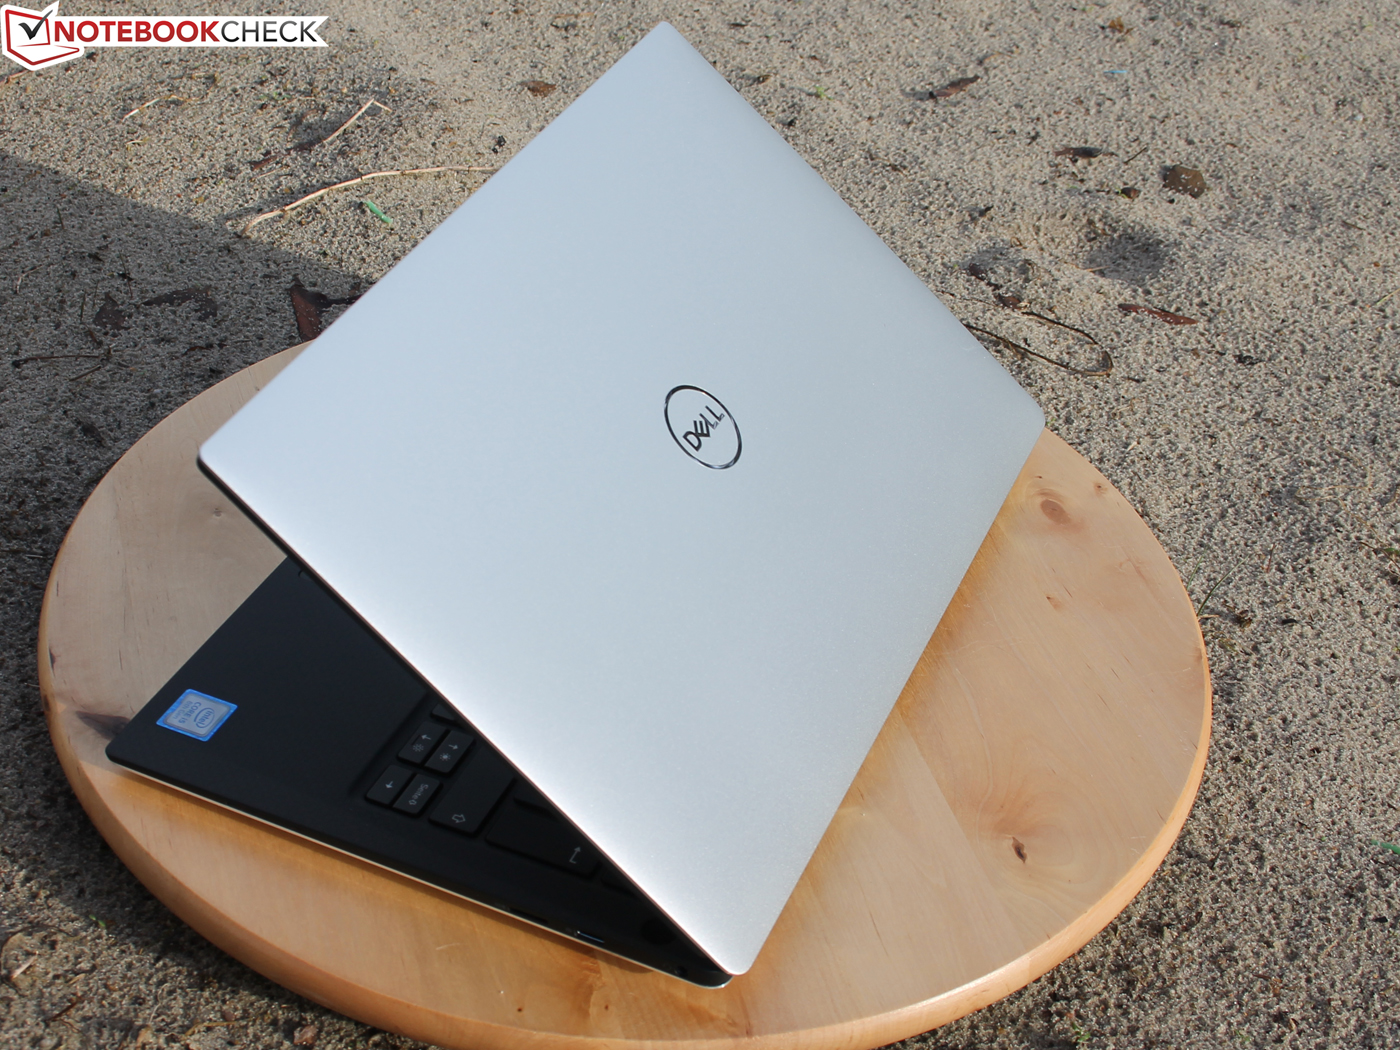
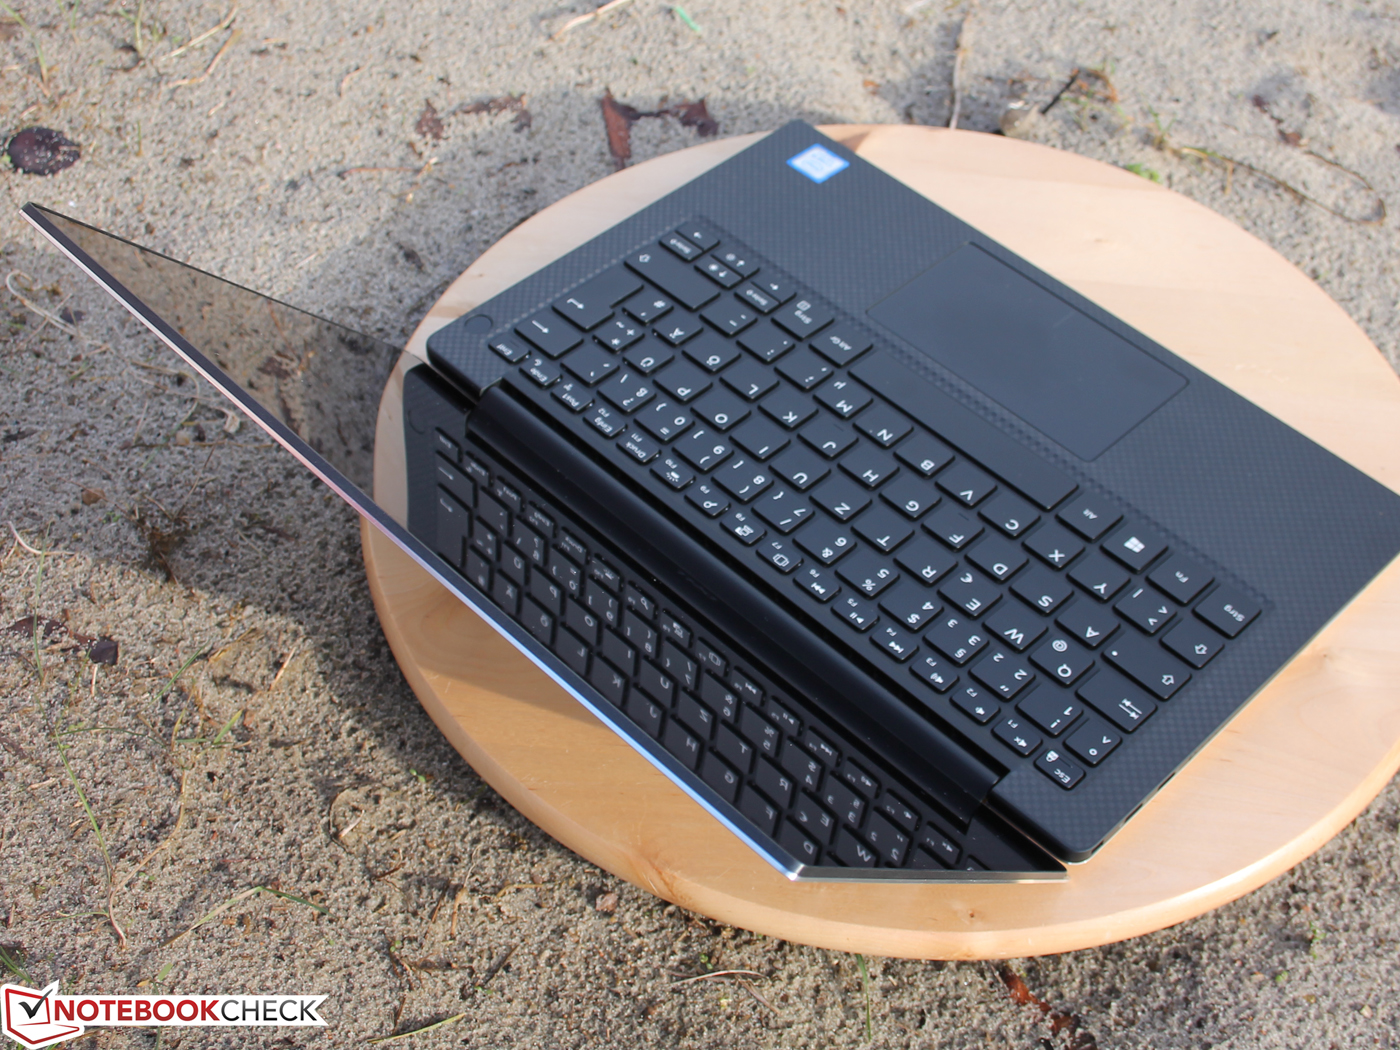
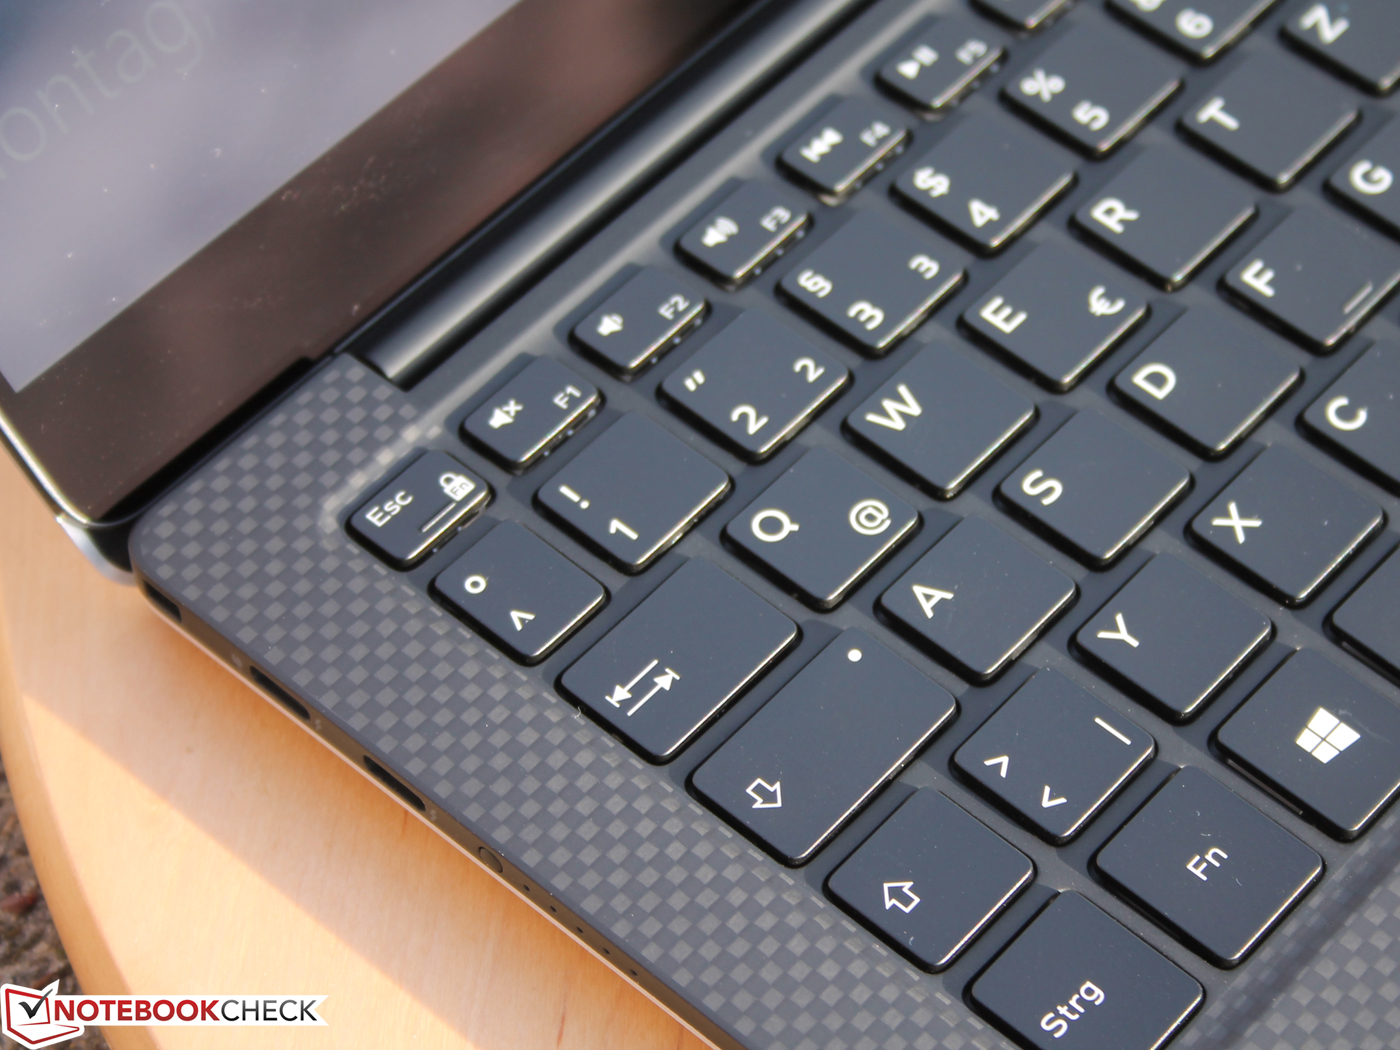
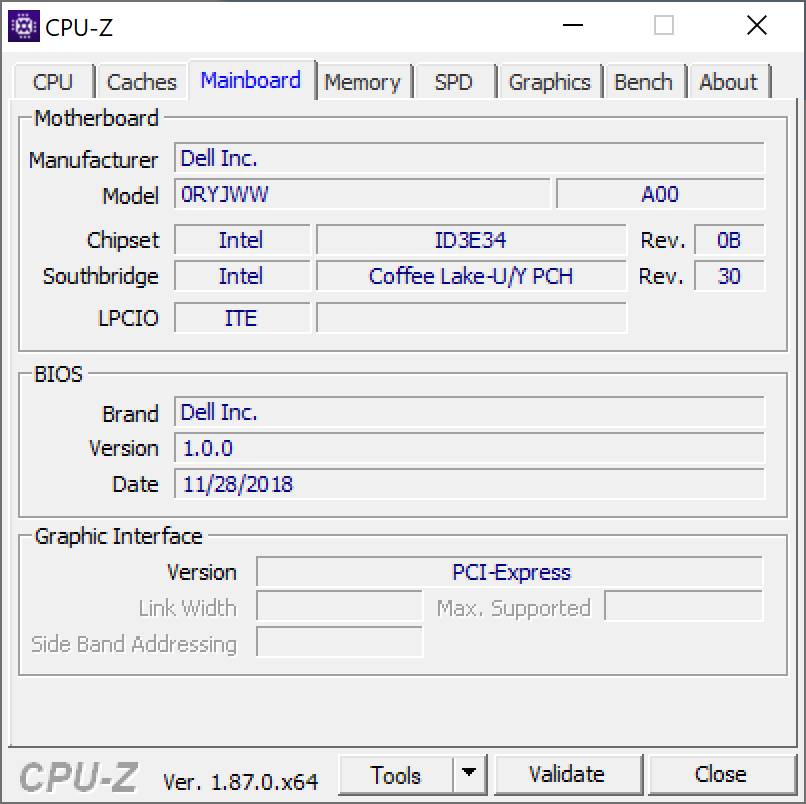
O design da carcaça ainda é muito atraente com seus marcos finos. A mudança da posição da webcam (de volta ao topo) é definitivamente uma mudança bem-vinda. A Dell Agora utiliza paineis 4K da AUO em vez da Sharp. Determinamos valores de luminância semelhantes, mas o contraste e a cobertura sRGB são menores.
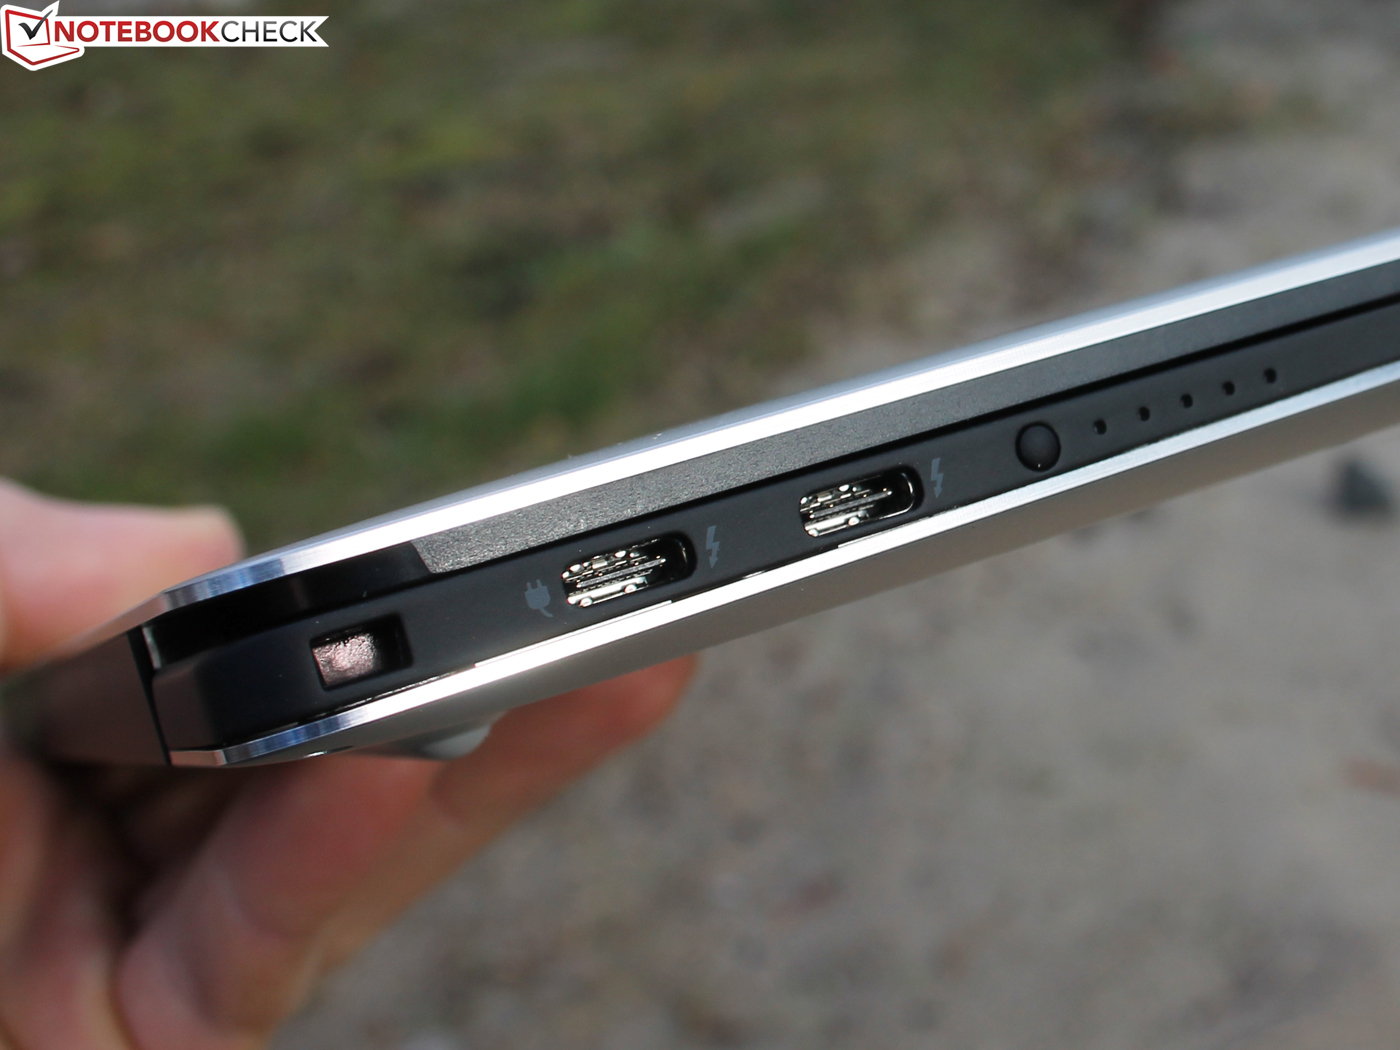
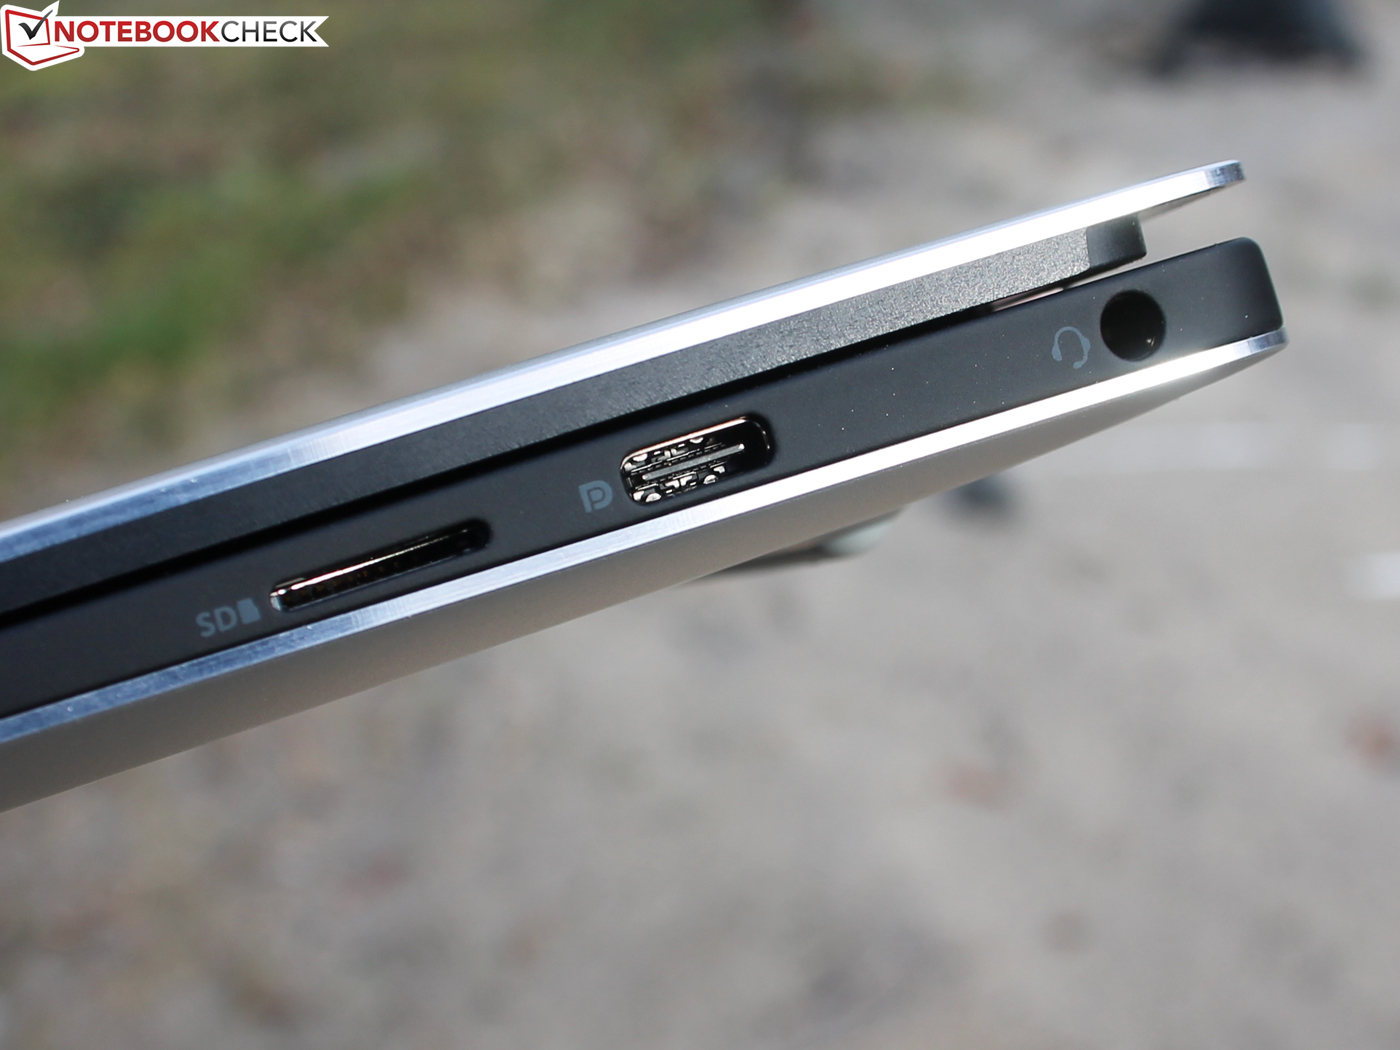
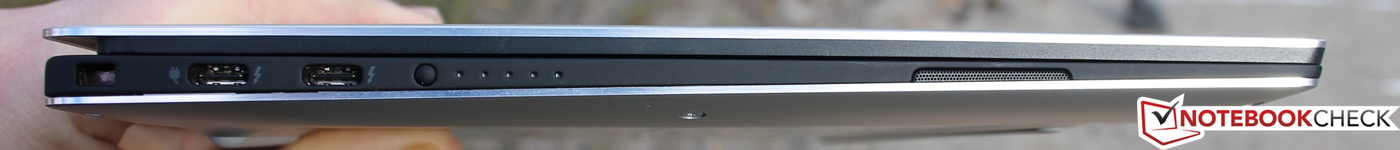
As portas permanecem igual. Duas portas Thunderbolt 3 e a porta USB-C (com DisplayPort) são boas para periféricos profissionais.
Estamos contentes com a duração: 8 horas, é muito similar ao XPS 13 9370 UHD 2018. Já estamos ansiosos para ver se o SKU 1080p do XPS 13 9380 durará mais. O 9370 FHD atingiu 11 horas em vez de 8 horas (teste Wi-Fi, +29%).
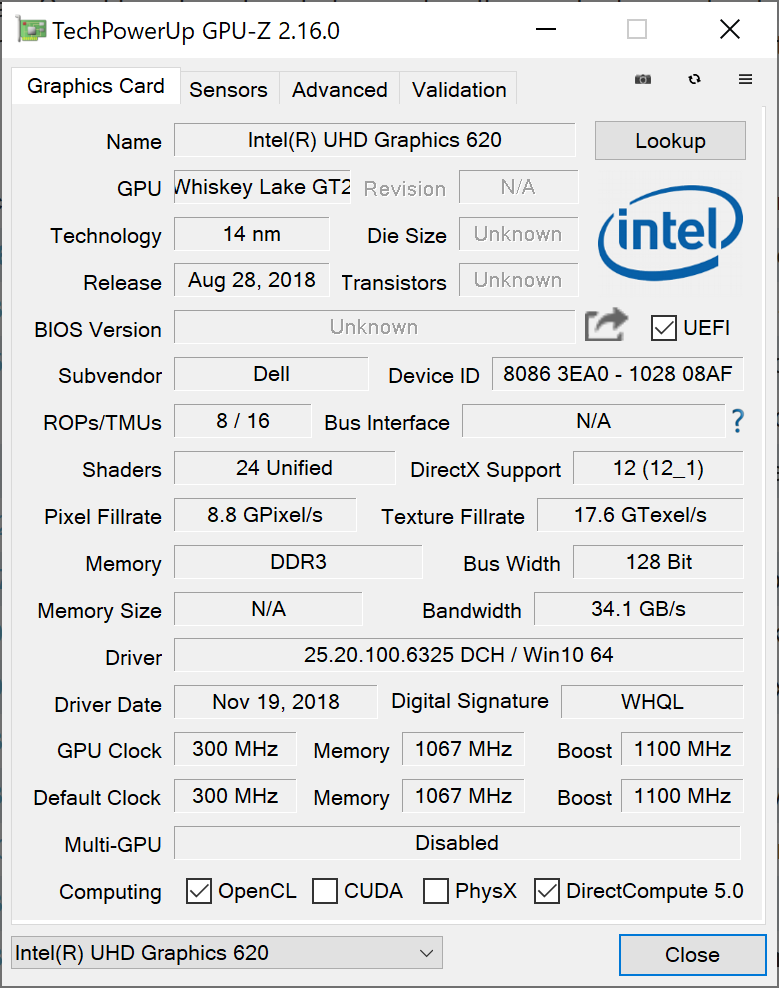
Qualquer usuário decepcionado com o baixo desempenho da GPU do XPS 13 - mas também outros populares Ultrabooks de 13 polegadas como o Spectre 13, Gram 13 ou ZenBook 13 – deveria dar uma olhada no Huawei MateBook 13 i7 e HP Envy 13-ah0003ng com a GeForce MX150, que é mais poderosa que a Graphics 620 UHD integrada e também consegue lidar com jogos.
Isso significa que o XPS 13 é para usuários que não precisam de uma GPU poderosa e que preferem dispositivos de entrada perfeitos, bem como um grande número de portas. A versão touch UHD da nossa unidade de teste sofre com tempos de duração mais curtos da bateria e menor contraste. Se você deseja a melhor mobilidade possível, recomendamos o SKU de 1080p. Em breve também iremos analisar essa versão.
Dell XPS 13 9380 2019
- 02/02/2019 v6 (old)
Sebastian Jentsch
Price comparison
