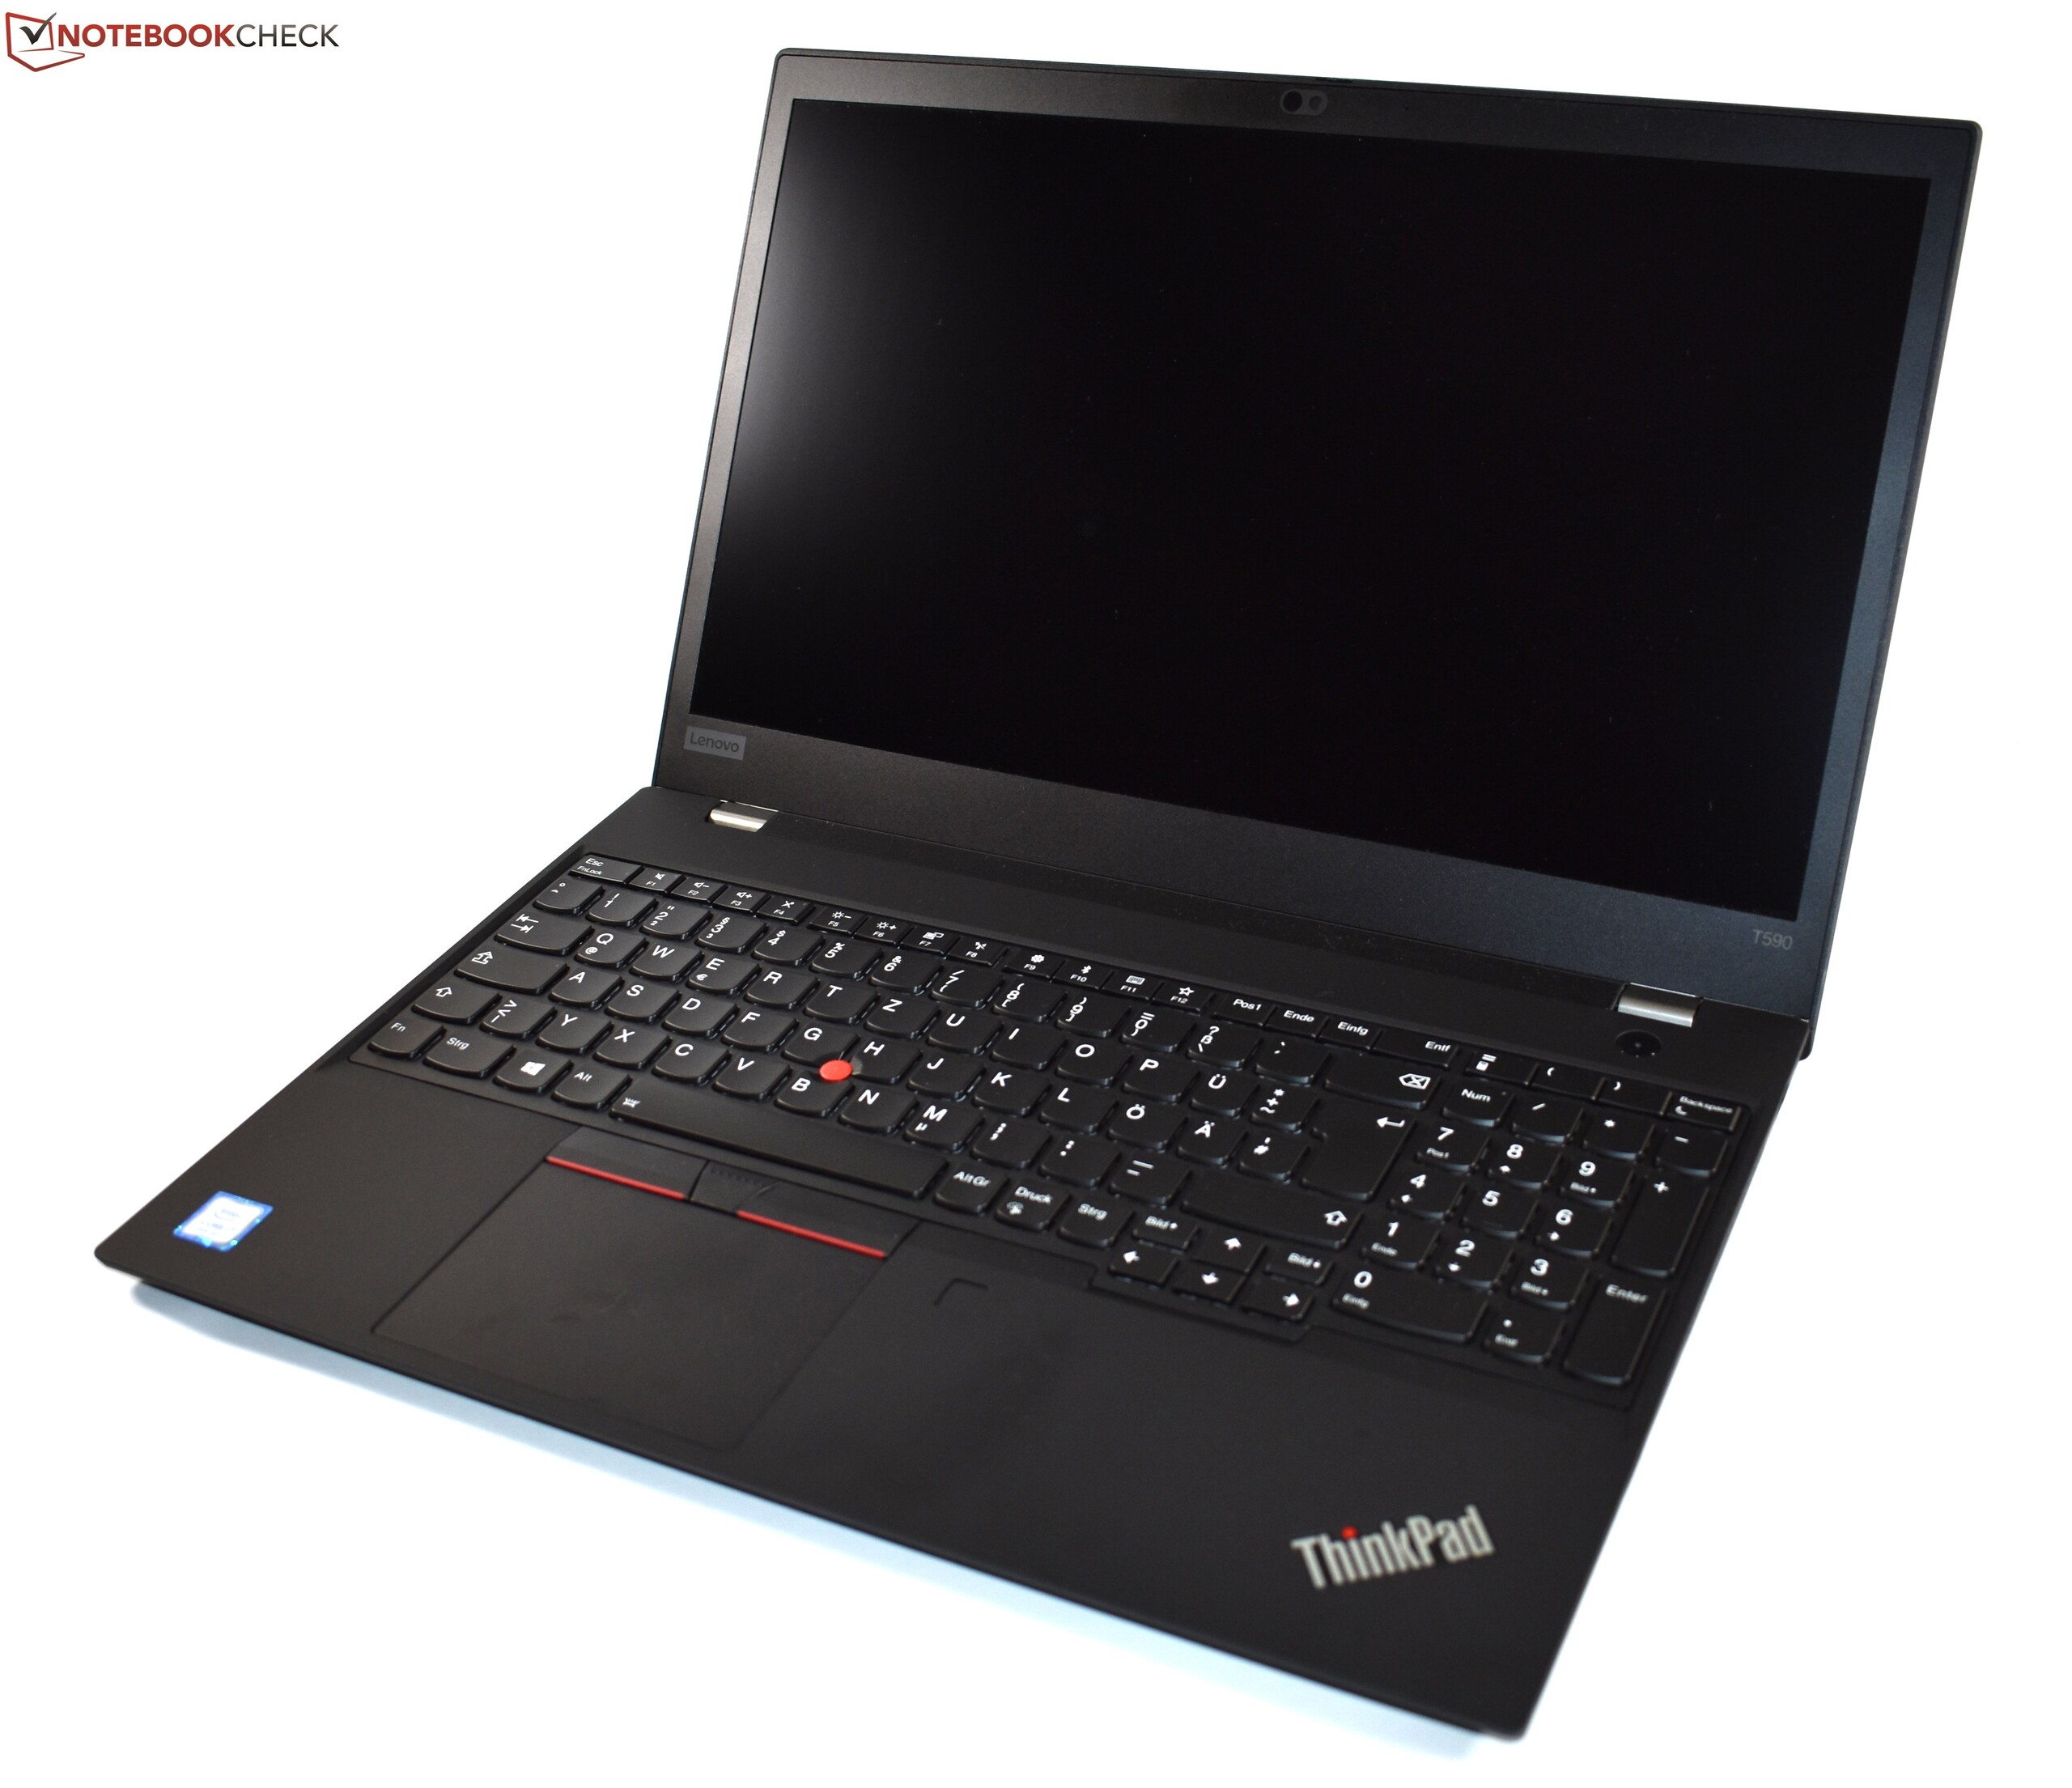
Breve Análise do Portátil Lenovo ThinkPad P53s: Com processador ultrabook e gráficos Quadro
Avaliação | Data | Modelo | Peso | Altura | Size | Resolução | Preço |
|---|---|---|---|---|---|---|---|
| 81.2 % v7 (old) | 11/2019 | Lenovo ThinkPad P53s-20N6001NGE i7-8565U, Quadro P520 | 1.9 kg | 19.95 mm | 15.60" | 1920x1080 | |
| 80.8 % v7 (old) | 10/2019 | HP ZBook 15u G6 6TP54EA i7-8565U, Radeon Pro WX 3200 | 1.6 kg | 19 mm | 15.60" | 3840x2160 | |
| 86.6 % v7 (old) | 07/2019 | Lenovo ThinkPad T590-20N4002VGE i7-8565U, GeForce MX250 | 1.9 kg | 19.95 mm | 15.60" | 1920x1080 | |
| 80.9 % v6 (old) | 07/2018 | Lenovo ThinkPad P52S-20LB001FUS i7-8650U, Quadro P500 | 2 kg | 20.2 mm | 15.60" | 3840x2160 | |
| 88.5 % v6 (old) | 09/2018 | Dell Precision 5530 Xeon E-2176M E-2176M, Quadro P2000 | 2 kg | 16.82 mm | 15.60" | 3840x2160 | |
| 85.6 % v6 (old) | Fujitsu Celsius H780 i7-8850H, Quadro P2000 | 2.8 kg | 31.9 mm | 15.60" | 1920x1080 |
| SD Card Reader | |
| average JPG Copy Test (av. of 3 runs) | |
| Dell Precision 5530 Xeon E-2176M (Toshiba Exceria Pro SDXC 64 GB UHS-II) | |
| Fujitsu Celsius H780 (Toshiba Exceria Pro SDXC 64 GB UHS-II) | |
| Média da turma Workstation (49.6 - 681, n=14, últimos 2 anos) | |
| Lenovo ThinkPad P52S-20LB001FUS (Toshiba Exceria Pro SDXC 64 GB UHS-II) | |
| Lenovo ThinkPad P53s-20N6001NGE (Toshiba Exceria Pro M501 64 GB UHS-II) | |
| Lenovo ThinkPad T590-20N4002VGE (Toshiba Exceria Pro M501 UHS-II) | |
| maximum AS SSD Seq Read Test (1GB) | |
| Média da turma Workstation (87.6 - 1455, n=14, últimos 2 anos) | |
| Dell Precision 5530 Xeon E-2176M (Toshiba Exceria Pro SDXC 64 GB UHS-II) | |
| Fujitsu Celsius H780 (Toshiba Exceria Pro SDXC 64 GB UHS-II) | |
| Lenovo ThinkPad P52S-20LB001FUS (Toshiba Exceria Pro SDXC 64 GB UHS-II) | |
| Lenovo ThinkPad P53s-20N6001NGE (Toshiba Exceria Pro M501 64 GB UHS-II) | |
| Lenovo ThinkPad T590-20N4002VGE (Toshiba Exceria Pro M501 UHS-II) | |
| Networking | |
| iperf3 transmit AX12 | |
| HP ZBook 15u G6 6TP54EA | |
| Lenovo ThinkPad T590-20N4002VGE | |
| Fujitsu Celsius H780 | |
| Dell Precision 5530 Xeon E-2176M | |
| Lenovo ThinkPad P53s-20N6001NGE | |
| Lenovo ThinkPad P52S-20LB001FUS | |
| iperf3 receive AX12 | |
| Lenovo ThinkPad P52S-20LB001FUS | |
| Dell Precision 5530 Xeon E-2176M | |
| Lenovo ThinkPad T590-20N4002VGE | |
| HP ZBook 15u G6 6TP54EA | |
| Fujitsu Celsius H780 | |
| Lenovo ThinkPad P53s-20N6001NGE | |
| |||||||||||||||||||||||||
iluminação: 88 %
iluminação com acumulador: 258 cd/m²
Contraste: 1444:1 (Preto: 0.18 cd/m²)
ΔE ColorChecker Calman: 6 | ∀{0.5-29.43 Ø4.73}
calibrated: 4.3
ΔE Greyscale Calman: 4.2 | ∀{0.09-98 Ø4.97}
59.2% sRGB (Argyll 1.6.3 3D)
37.6% AdobeRGB 1998 (Argyll 1.6.3 3D)
40.89% AdobeRGB 1998 (Argyll 3D)
57.6% sRGB (Argyll 3D)
39.58% Display P3 (Argyll 3D)
Gamma: 2.49
CCT: 6865 K
| Lenovo ThinkPad P53s-20N6001NGE Lenovo LEN40BA, IPS, 1920x1080, 15.6" | HP ZBook 15u G6 6TP54EA AU Optronics AUO30EB, IPS, 3840x2160, 15.6" | Lenovo ThinkPad T590-20N4002VGE LP156WFC-SPD1, aSi IPS LED, 1920x1080, 15.6" | Lenovo ThinkPad P52S-20LB001FUS Lenovo LEN40BD, IPS, 3840x2160, 15.6" | Dell Precision 5530 Xeon E-2176M Sharp SHP148D / LQ156D1, IGZO, 3840x2160, 15.6" | Fujitsu Celsius H780 LP156WF6-SPP1, IPS LED, 1920x1080, 15.6" | Lenovo ThinkPad T590-20N40009GE NE156QUM-N66, IPS, 3840x2160, 15.6" | |
|---|---|---|---|---|---|---|---|
| Display | 71% | -1% | 62% | 84% | 57% | 102% | |
| Display P3 Coverage (%) | 39.58 | 69.2 75% | 38.79 -2% | 67.3 70% | 76.5 93% | 66.3 68% | 80.2 103% |
| sRGB Coverage (%) | 57.6 | 97.1 69% | 58.3 1% | 89.4 55% | 98.4 71% | 85.9 49% | 97.8 70% |
| AdobeRGB 1998 Coverage (%) | 40.89 | 69.7 70% | 40.11 -2% | 65.4 60% | 76.4 87% | 62.8 54% | 95 132% |
| Response Times | -11% | 23% | 31% | 3% | 23% | 12% | |
| Response Time Grey 50% / Grey 80% * (ms) | 51.2 ? | 68.8 ? -34% | 37.2 ? 27% | 43.2 ? 16% | 48 ? 6% | 38 ? 26% | 48.4 ? 5% |
| Response Time Black / White * (ms) | 33.6 ? | 29.6 12% | 27.2 ? 19% | 18 ? 46% | 33.6 ? -0% | 26.8 ? 20% | 27.2 ? 19% |
| PWM Frequency (Hz) | 980 | 1000 | 20830 ? | ||||
| Screen | 37% | 1% | 20% | 28% | 15% | 49% | |
| Brightness middle (cd/m²) | 260 | 451 73% | 276 6% | 305.5 18% | 451.7 74% | 271 4% | 531 104% |
| Brightness (cd/m²) | 243 | 434 79% | 262 8% | 282 16% | 440 81% | 260 7% | 523 115% |
| Brightness Distribution (%) | 88 | 89 1% | 88 0% | 78 -11% | 90 2% | 86 -2% | 96 9% |
| Black Level * (cd/m²) | 0.18 | 0.25 -39% | 0.23 -28% | 0.24 -33% | 0.4 -122% | 0.29 -61% | 0.37 -106% |
| Contrast (:1) | 1444 | 1804 25% | 1200 -17% | 1273 -12% | 1129 -22% | 934 -35% | 1435 -1% |
| Colorchecker dE 2000 * | 6 | 4.4 27% | 5.6 7% | 3.51 41% | 3.11 48% | 3.9 35% | 2.5 58% |
| Colorchecker dE 2000 max. * | 19.2 | 6.7 65% | 16.4 15% | 7.28 62% | 8.62 55% | 10.2 47% | 4.4 77% |
| Colorchecker dE 2000 calibrated * | 4.3 | 1.8 58% | 4.7 -9% | 3.15 27% | 3.07 29% | 2.9 33% | 1 77% |
| Greyscale dE 2000 * | 4.2 | 5 -19% | 3 29% | 4 5% | 3.7 12% | 2.6 38% | 3.5 17% |
| Gamma | 2.49 88% | 2.31 95% | 2.18 101% | 2.18 101% | 2.11 104% | 2.29 96% | 2.31 95% |
| CCT | 6865 95% | 7717 84% | 7075 92% | 7291 89% | 6492 100% | 6517 100% | 7189 90% |
| Color Space (Percent of AdobeRGB 1998) (%) | 37.6 | 63 68% | 36.9 -2% | 58 54% | 69 84% | 56.1 49% | 84.3 124% |
| Color Space (Percent of sRGB) (%) | 59.2 | 97 64% | 58.1 -2% | 89 50% | 98 66% | 85.8 45% | 97.7 65% |
| Média Total (Programa/Configurações) | 32% /
37% | 8% /
3% | 38% /
29% | 38% /
35% | 32% /
24% | 54% /
54% |
* ... menor é melhor
Exibir tempos de resposta
| ↔ Tempo de resposta preto para branco | ||
|---|---|---|
| 33.6 ms ... ascensão ↗ e queda ↘ combinadas | ↗ 18 ms ascensão | 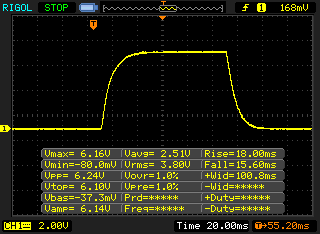 |
| ↘ 15.6 ms queda | ||
| A tela mostra taxas de resposta lentas em nossos testes e será insatisfatória para os jogadores. Em comparação, todos os dispositivos testados variam de 0.1 (mínimo) a 240 (máximo) ms. » 90 % de todos os dispositivos são melhores. Isso significa que o tempo de resposta medido é pior que a média de todos os dispositivos testados (19.9 ms). | ||
| ↔ Tempo de resposta 50% cinza a 80% cinza | ||
| 51.2 ms ... ascensão ↗ e queda ↘ combinadas | ↗ 24.4 ms ascensão | 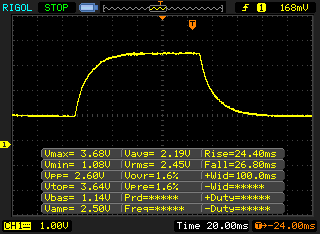 |
| ↘ 26.8 ms queda | ||
| A tela mostra taxas de resposta lentas em nossos testes e será insatisfatória para os jogadores. Em comparação, todos os dispositivos testados variam de 0.165 (mínimo) a 636 (máximo) ms. » 88 % de todos os dispositivos são melhores. Isso significa que o tempo de resposta medido é pior que a média de todos os dispositivos testados (31.1 ms). | ||
Cintilação da tela / PWM (modulação por largura de pulso)
| Tela tremeluzindo / PWM não detectado | 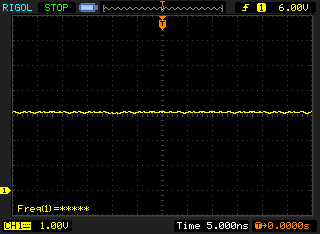 | ||
[pwm_comparison] Em comparação: 52 % de todos os dispositivos testados não usam PWM para escurecer a tela. Se PWM foi detectado, uma média de 7794 (mínimo: 5 - máximo: 343500) Hz foi medida. | |||
| PCMark 8 | |
| Home Score Accelerated v2 | |
| Fujitsu Celsius H780 | |
| Lenovo ThinkPad T590-20N4002VGE | |
| Lenovo ThinkPad P53s-20N6001NGE | |
| Dell Precision 5530 Xeon E-2176M | |
| Média Intel Core i7-8565U, NVIDIA Quadro P520 (3313 - 3840, n=2) | |
| HP ZBook 15u G6 6TP54EA | |
| Lenovo ThinkPad P52S-20LB001FUS | |
| Work Score Accelerated v2 | |
| Fujitsu Celsius H780 | |
| Lenovo ThinkPad T590-20N4002VGE | |
| Lenovo ThinkPad P53s-20N6001NGE | |
| Média Intel Core i7-8565U, NVIDIA Quadro P520 (4918 - 5140, n=2) | |
| Dell Precision 5530 Xeon E-2176M | |
| Lenovo ThinkPad P52S-20LB001FUS | |
| HP ZBook 15u G6 6TP54EA | |
| PCMark 8 Home Score Accelerated v2 | 3840 pontos | |
| PCMark 8 Work Score Accelerated v2 | 5140 pontos | |
| PCMark 10 Score | 4374 pontos | |
Ajuda | ||
| Lenovo ThinkPad P53s-20N6001NGE Intel SSD 760p SSDPEKKW256G8 | HP ZBook 15u G6 6TP54EA Samsung SSD PM981 MZVLB512HAJQ | Lenovo ThinkPad T590-20N4002VGE Toshiba XG6 KXG60ZNV512G | Lenovo ThinkPad P52S-20LB001FUS Samsung SSD PM981 MZVLB1T0HALR | Dell Precision 5530 Xeon E-2176M SK hynix PC400 512 GB | Fujitsu Celsius H780 Samsung SSD PM981 MZVLB512HAJQ | Média Intel SSD 760p SSDPEKKW256G8 | |
|---|---|---|---|---|---|---|---|
| CrystalDiskMark 5.2 / 6 | -10% | -0% | -20% | -16% | -17% | ||
| Write 4K (MB/s) | 195.9 | 156 -20% | 126.2 -36% | 97.8 -50% | 98.3 -50% | 148.8 ? -24% | |
| Read 4K (MB/s) | 74.9 | 45.73 -39% | 48.93 -35% | 41.21 -45% | 40.18 -46% | 64.8 ? -13% | |
| Write Seq (MB/s) | 1194 | 1158 -3% | 1345 13% | 1312 10% | 1777 49% | 956 ? -20% | |
| Read Seq (MB/s) | 2309 | 1132 -51% | 1373 -41% | 1667 -28% | 1247 -46% | 2325 ? 1% | |
| Write 4K Q32T1 (MB/s) | 507 | 369.2 -27% | 383.8 -24% | 449.5 -11% | 344.7 -32% | 381 ? -25% | |
| Read 4K Q32T1 (MB/s) | 624 | 573 -8% | 434.8 -30% | 327.4 -48% | 383.1 -39% | 462 ? -26% | |
| Write Seq Q32T1 (MB/s) | 1206 | 1969 63% | 2966 146% | 1385 15% | 2019 67% | 954 ? -21% | |
| Read Seq Q32T1 (MB/s) | 3091 | 3138 2% | 3230 4% | 2948 -5% | 2076 -33% | 2848 ? -8% | |
| AS SSD | 30% | 39% | 14% | -17% | 25% | -18% | |
| Seq Read (MB/s) | 2283 | 2083 -9% | 2551 12% | 1351 -41% | 2169 -5% | 1049 -54% | 2472 ? 8% |
| Seq Write (MB/s) | 1042 | 1715 65% | 2376 128% | 1220 17% | 1022 -2% | 1882 81% | 1176 ? 13% |
| 4K Read (MB/s) | 46.62 | 55.3 19% | 52.7 13% | 44.33 -5% | 38.43 -18% | 48.35 4% | 46.1 ? -1% |
| 4K Write (MB/s) | 172.6 | 137.6 -20% | 153 -11% | 100.5 -42% | 92.8 -46% | 102.5 -41% | 135.3 ? -22% |
| 4K-64 Read (MB/s) | 759 | 1211 60% | 1406 85% | 1524 101% | 970 28% | 1395 84% | 677 ? -11% |
| 4K-64 Write (MB/s) | 916 | 1446 58% | 1439 57% | 1245 36% | 926 1% | 1789 95% | 750 ? -18% |
| Access Time Read * (ms) | 0.06 | 0.039 35% | 0.067 -12% | 0.04 33% | 0.073 -22% | 0.066 -10% | 0.06567 ? -9% |
| Access Time Write * (ms) | 0.022 | 0.026 -18% | 0.027 -23% | 0.04 -82% | 0.053 -141% | 0.037 -68% | 0.05067 ? -130% |
| Score Read (Points) | 1034 | 1474 43% | 1714 66% | 1703 65% | 1226 19% | 1549 50% | 970 ? -6% |
| Score Write (Points) | 1192 | 1755 47% | 1829 53% | 1468 23% | 1121 -6% | 2080 74% | 1003 ? -16% |
| Score Total (Points) | 2705 | 3976 47% | 4418 63% | 4038 49% | 2922 8% | 4469 65% | 2416 ? -11% |
| Média Total (Programa/Configurações) | 10% /
13% | 20% /
23% | 14% /
14% | -19% /
-18% | 5% /
8% | -18% /
-18% |
* ... menor é melhor

| 3DMark 11 - 1280x720 Performance GPU | |
| Média da turma Workstation (10888 - 69594, n=25, últimos 2 anos) | |
| Fujitsu Celsius H780 | |
| Dell Precision 5530 Xeon E-2176M | |
| Lenovo ThinkPad P53s-20N6001NGE | |
| HP ZBook 15u G6 6TP54EA | |
| Média NVIDIA Quadro P520 (3870 - 4277, n=6) | |
| Lenovo ThinkPad T590-20N4002VGE | |
| 3DMark 06 Standard Score | 22756 pontos | |
| 3DMark Vantage P Result | 15720 pontos | |
| 3DMark 11 Performance | 4604 pontos | |
| 3DMark Cloud Gate Standard Score | 14006 pontos | |
| 3DMark Fire Strike Score | 3113 pontos | |
| 3DMark Time Spy Score | 1171 pontos | |
Ajuda | ||
| The Witcher 3 | |
| 1920x1080 High Graphics & Postprocessing (Nvidia HairWorks Off) | |
| Fujitsu Celsius H780 | |
| Lenovo ThinkPad P53s-20N6001NGE | |
| Dell Precision 5530 Xeon E-2176M | |
| Média NVIDIA Quadro P520 (18.7 - 33.5, n=5) | |
| Lenovo ThinkPad T590-20N4002VGE | |
| Lenovo ThinkPad P52S-20LB001FUS | |
| HP ZBook 15u G6 6TP54EA | |
| 1920x1080 Ultra Graphics & Postprocessing (HBAO+) | |
| Dell Precision 5530 Xeon E-2176M | |
| Fujitsu Celsius H780 | |
| Lenovo ThinkPad T590-20N4002VGE | |
| Lenovo ThinkPad P53s-20N6001NGE | |
| Média NVIDIA Quadro P520 (8.4 - 11.1, n=4) | |
| HP ZBook 15u G6 6TP54EA | |
| Lenovo ThinkPad P52S-20LB001FUS | |
| Thief | |
| 1366x768 High Preset AA:FXAA & Low SS AF:4x | |
| Dell Precision 5530 Xeon E-2176M | |
| Lenovo ThinkPad P53s-20N6001NGE | |
| Média NVIDIA Quadro P520 (n=1) | |
| HP ZBook 15u G6 6TP54EA | |
| 1920x1080 Very High Preset AA:FXAA & High SS AF:8x | |
| Dell Precision 5530 Xeon E-2176M | |
| Lenovo ThinkPad P53s-20N6001NGE | |
| Média NVIDIA Quadro P520 (n=1) | |
| HP ZBook 15u G6 6TP54EA | |
| Rise of the Tomb Raider | |
| 1920x1080 High Preset AA:FX AF:4x | |
| Dell Precision 5530 Xeon E-2176M | |
| Lenovo ThinkPad P53s-20N6001NGE | |
| Média NVIDIA Quadro P520 (20.2 - 21.1, n=2) | |
| HP ZBook 15u G6 6TP54EA | |
| Lenovo ThinkPad P52S-20LB001FUS | |
| 1920x1080 Very High Preset AA:FX AF:16x | |
| Dell Precision 5530 Xeon E-2176M | |
| Lenovo ThinkPad P53s-20N6001NGE | |
| Média NVIDIA Quadro P520 (17.2 - 18.3, n=2) | |
| Lenovo ThinkPad P52S-20LB001FUS | |
| BioShock Infinite | |
| 1366x768 High Preset | |
| Dell Precision 5530 Xeon E-2176M | |
| Lenovo ThinkPad T590-20N4002VGE | |
| Lenovo ThinkPad P53s-20N6001NGE | |
| Média NVIDIA Quadro P520 (78.4 - 89.7, n=2) | |
| HP ZBook 15u G6 6TP54EA | |
| 1920x1080 Ultra Preset, DX11 (DDOF) | |
| Dell Precision 5530 Xeon E-2176M | |
| Lenovo ThinkPad T590-20N4002VGE | |
| Lenovo ThinkPad P53s-20N6001NGE | |
| Média NVIDIA Quadro P520 (31.2 - 34, n=2) | |
| HP ZBook 15u G6 6TP54EA | |
| baixo | média | alto | ultra | 4K | |
|---|---|---|---|---|---|
| BioShock Infinite (2013) | 194.7 | 107.1 | 89.7 | 34.01 | |
| Thief (2014) | 80.4 | 49.4 | 39.3 | 22.1 | |
| The Witcher 3 (2015) | 59.4 | 51.8 | 33.53 | 11.08 | |
| Dota 2 Reborn (2015) | 125 | 115 | 70 | 61 | 22.7 |
| Rise of the Tomb Raider (2016) | 64.5 | 41.58 | 21.07 | 18.28 | |
| X-Plane 11.11 (2018) | 70 | 52 | 37.6 | ||
| Far Cry 5 (2018) | 42 | 20 | 18 | 16 | |
| Anno 1800 (2019) | 62.8 | 24.57 | 14.79 | 7.39 |
Barulho
| Ocioso |
| 29.2 / 29.2 / 30.8 dB |
| Carga |
| 32.6 / 33.8 dB |
 | ||
30 dB silencioso 40 dB(A) audível 50 dB(A) ruidosamente alto |
||
min: | ||
(±) A temperatura máxima no lado superior é 42.6 °C / 109 F, em comparação com a média de 38.2 °C / 101 F , variando de 22.2 a 69.8 °C para a classe Workstation.
(-) A parte inferior aquece até um máximo de 55.6 °C / 132 F, em comparação com a média de 41.1 °C / 106 F
(+) Em uso inativo, a temperatura média para o lado superior é 22.8 °C / 73 F, em comparação com a média do dispositivo de 32 °C / ### class_avg_f### F.
(+) Os apoios para as mãos e o touchpad são mais frios que a temperatura da pele, com um máximo de 30.3 °C / 86.5 F e, portanto, são frios ao toque.
(-) A temperatura média da área do apoio para as mãos de dispositivos semelhantes foi 27.8 °C / 82 F (-2.5 °C / -4.5 F).
Lenovo ThinkPad P53s-20N6001NGE análise de áudio
(-) | alto-falantes não muito altos (###valor### dB)
Graves 100 - 315Hz
(±) | graves reduzidos - em média 11.8% menor que a mediana
(±) | a linearidade dos graves é média (12.1% delta para a frequência anterior)
Médios 400 - 2.000 Hz
(±) | médios mais altos - em média 6% maior que a mediana
(+) | médios são lineares (5.4% delta para frequência anterior)
Altos 2 - 16 kHz
(+) | agudos equilibrados - apenas 4.8% longe da mediana
(±) | a linearidade dos máximos é média (8.8% delta para frequência anterior)
Geral 100 - 16.000 Hz
(±) | a linearidade do som geral é média (25.3% diferença em relação à mediana)
Comparado com a mesma classe
» 87% de todos os dispositivos testados nesta classe foram melhores, 5% semelhantes, 9% piores
» O melhor teve um delta de 7%, a média foi 17%, o pior foi 35%
Comparado com todos os dispositivos testados
» 78% de todos os dispositivos testados foram melhores, 5% semelhantes, 18% piores
» O melhor teve um delta de 4%, a média foi 24%, o pior foi 134%
HP ZBook 15u G6 6TP54EA análise de áudio
(±) | o volume do alto-falante é médio, mas bom (###valor### dB)
Graves 100 - 315Hz
(-) | quase nenhum baixo - em média 17.7% menor que a mediana
(±) | a linearidade dos graves é média (12.6% delta para a frequência anterior)
Médios 400 - 2.000 Hz
(+) | médios equilibrados - apenas 3.2% longe da mediana
(+) | médios são lineares (5.9% delta para frequência anterior)
Altos 2 - 16 kHz
(+) | agudos equilibrados - apenas 2.6% longe da mediana
(+) | os máximos são lineares (6.3% delta da frequência anterior)
Geral 100 - 16.000 Hz
(±) | a linearidade do som geral é média (18.7% diferença em relação à mediana)
Comparado com a mesma classe
» 63% de todos os dispositivos testados nesta classe foram melhores, 8% semelhantes, 29% piores
» O melhor teve um delta de 7%, a média foi 17%, o pior foi 35%
Comparado com todos os dispositivos testados
» 43% de todos os dispositivos testados foram melhores, 8% semelhantes, 50% piores
» O melhor teve um delta de 4%, a média foi 24%, o pior foi 134%
| desligado | |
| Ocioso | |
| Carga |
|
Key:
min: | |
| Lenovo ThinkPad P53s-20N6001NGE i7-8565U, Quadro P520, Intel SSD 760p SSDPEKKW256G8, IPS, 1920x1080, 15.6" | HP ZBook 15u G6 6TP54EA i7-8565U, Radeon Pro WX 3200, Samsung SSD PM981 MZVLB512HAJQ, IPS, 3840x2160, 15.6" | Lenovo ThinkPad T590-20N4002VGE i7-8565U, GeForce MX250, Toshiba XG6 KXG60ZNV512G, aSi IPS LED, 1920x1080, 15.6" | Lenovo ThinkPad P52S-20LB001FUS i7-8650U, Quadro P500, Samsung SSD PM981 MZVLB1T0HALR, IPS, 3840x2160, 15.6" | Dell Precision 5530 Xeon E-2176M E-2176M, Quadro P2000, SK hynix PC400 512 GB, IGZO, 3840x2160, 15.6" | Fujitsu Celsius H780 i7-8850H, Quadro P2000, Samsung SSD PM981 MZVLB512HAJQ, IPS LED, 1920x1080, 15.6" | Média NVIDIA Quadro P520 | Média da turma Workstation | |
|---|---|---|---|---|---|---|---|---|
| Power Consumption | -37% | -23% | -53% | -129% | -115% | -9% | -129% | |
| Idle Minimum * (Watt) | 2.74 | 5.5 -101% | 4.1 -50% | 5.9 -115% | 9.8 -258% | 9.1 -232% | 3.14 ? -15% | 8.94 ? -226% |
| Idle Average * (Watt) | 6.4 | 9.8 -53% | 8.3 -30% | 11.7 -83% | 16.8 -163% | 13.2 -106% | 7.3 ? -14% | 13.8 ? -116% |
| Idle Maximum * (Watt) | 9.7 | 12 -24% | 11.8 -22% | 15.6 -61% | 16.9 -74% | 14.04 -45% | 10.4 ? -7% | 17.5 ? -80% |
| Load Average * (Watt) | 55.2 | 59 -7% | 61.6 -12% | 63 -14% | 102.3 -85% | 78.8 -43% | 60.7 ? -10% | 95 ? -72% |
| Load Maximum * (Watt) | 69.4 | 70 -1% | 69.4 -0% | 63.1 9% | 114.5 -65% | 172.5 -149% | 68.9 ? 1% | 175.2 ? -152% |
| Witcher 3 ultra * (Watt) | 51 | 54.4 | 48.4 | 76.5 |
* ... menor é melhor
| Lenovo ThinkPad P53s-20N6001NGE i7-8565U, Quadro P520, 57 Wh | HP ZBook 15u G6 6TP54EA i7-8565U, Radeon Pro WX 3200, 56 Wh | Lenovo ThinkPad T590-20N4002VGE i7-8565U, GeForce MX250, 57 Wh | Lenovo ThinkPad P52S-20LB001FUS i7-8650U, Quadro P500, 80 Wh | Dell Precision 5530 Xeon E-2176M E-2176M, Quadro P2000, 97 Wh | Fujitsu Celsius H780 i7-8850H, Quadro P2000, 96 Wh | Lenovo ThinkPad T590-20N40009GE i7-8565U, GeForce MX250, 57 Wh | Média da turma Workstation | |
|---|---|---|---|---|---|---|---|---|
| Duração da bateria | -26% | 31% | -2% | -22% | -13% | -31% | -13% | |
| Reader / Idle (h) | 25.2 | 12.4 -51% | 17.2 -32% | 16.5 -35% | 26.1 ? 4% | |||
| WiFi v1.3 (h) | 8.6 | 6.9 -20% | 10.5 22% | 11.1 29% | 8.4 -2% | 7.5 -13% | 6.1 -29% | 8.53 ? -1% |
| Load (h) | 2.5 | 2.3 -8% | 3.5 40% | 2.4 -4% | 1.8 -28% | 1.7 -32% | 1.429 ? -43% |
Pro
Contra
Verdict - Price and performance go hand in hand
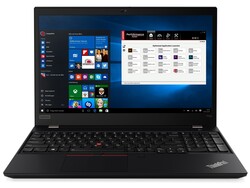

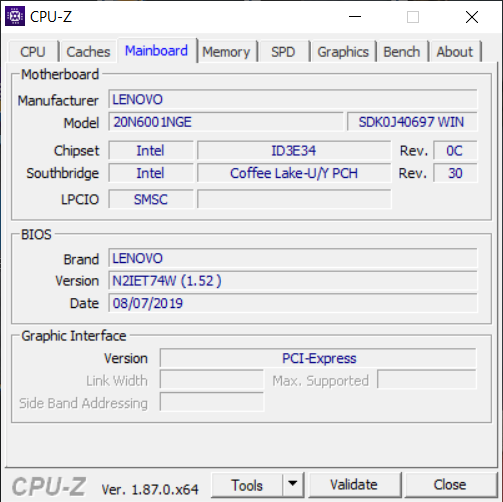
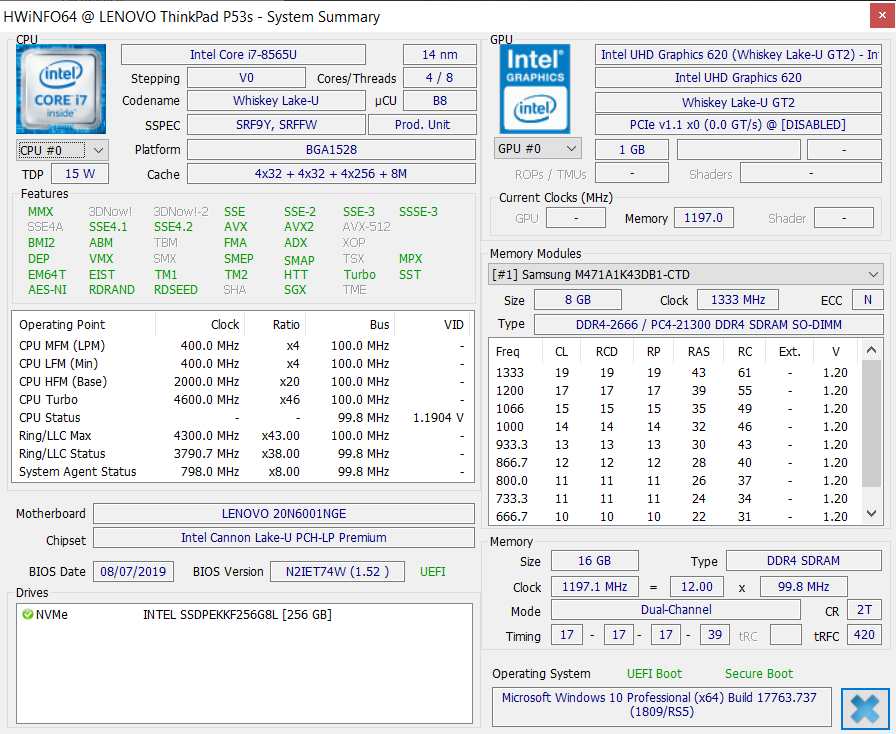
Em nosso teste, o ThinkPad P53s mostra o que é: Um workstation barato. A carcaça é estável e de alta qualidade, mas o hardware, exceto pela Nvidia Quadro P520, também se encontra em muitos outros portáteis concorrentes atuais. Além disso, existem opções de manutenção aceitáveis e bom desempenho do sistema.
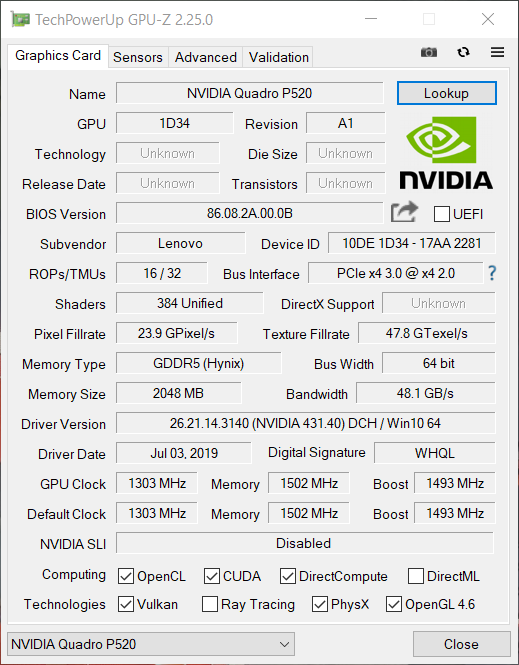
O ThinkPad P53s é uma alternativa barata para usuários que procuram uma GPU especializada, mas não exigem uma configuração de gama alta.
No entanto, a Lenovo deveria ter feito um pouco mais com a tela. Esta tela reproduz cores com uma cobertura bastante baixa e o brilho também deixa muito a desejar. Já conhecemos esse problema do ThinkPad T590 que foi construído de forma similar. Opcionalmente, a Lenovo também oferece omuito bom painel 4K para o P53s, com a única falha verdadeira sendo o maior consumo de energia.
Lenovo ThinkPad P53s-20N6001NGE
- 10/28/2019 v7 (old)
Mike Wobker