Breve Análise do Portátil Lenovo ThinkPad P52s (i7-8650U, Quadro P500, 4K)
| SD Card Reader | |
| average JPG Copy Test (av. of 3 runs) | |
| Dell Precision 3520 (Toshiba Exceria Pro SDXC 64 GB UHS-II) | |
| Dell Precision 5520 UHD (Toshiba Exceria Pro SDXC 64 GB UHS-II) | |
| MSI WS63VR 7RL-023US | |
| Média da turma Workstation (49.6 - 681, n=14, últimos 2 anos) | |
| Lenovo ThinkPad P52S-20LB001FUS (Toshiba Exceria Pro SDXC 64 GB UHS-II) | |
| Lenovo ThinkPad P51s 20HB000SGE (Toshiba Exceria Pro SDXC 64 GB UHS-II) | |
| maximum AS SSD Seq Read Test (1GB) | |
| Dell Precision 5520 UHD (Toshiba Exceria Pro SDXC 64 GB UHS-II) | |
| Média da turma Workstation (87.6 - 1455, n=14, últimos 2 anos) | |
| MSI WS63VR 7RL-023US | |
| Dell Precision 3520 (Toshiba Exceria Pro SDXC 64 GB UHS-II) | |
| Lenovo ThinkPad P51s 20HB000SGE (Toshiba Exceria Pro SDXC 64 GB UHS-II) | |
| Lenovo ThinkPad P52S-20LB001FUS (Toshiba Exceria Pro SDXC 64 GB UHS-II) | |
| |||||||||||||||||||||||||
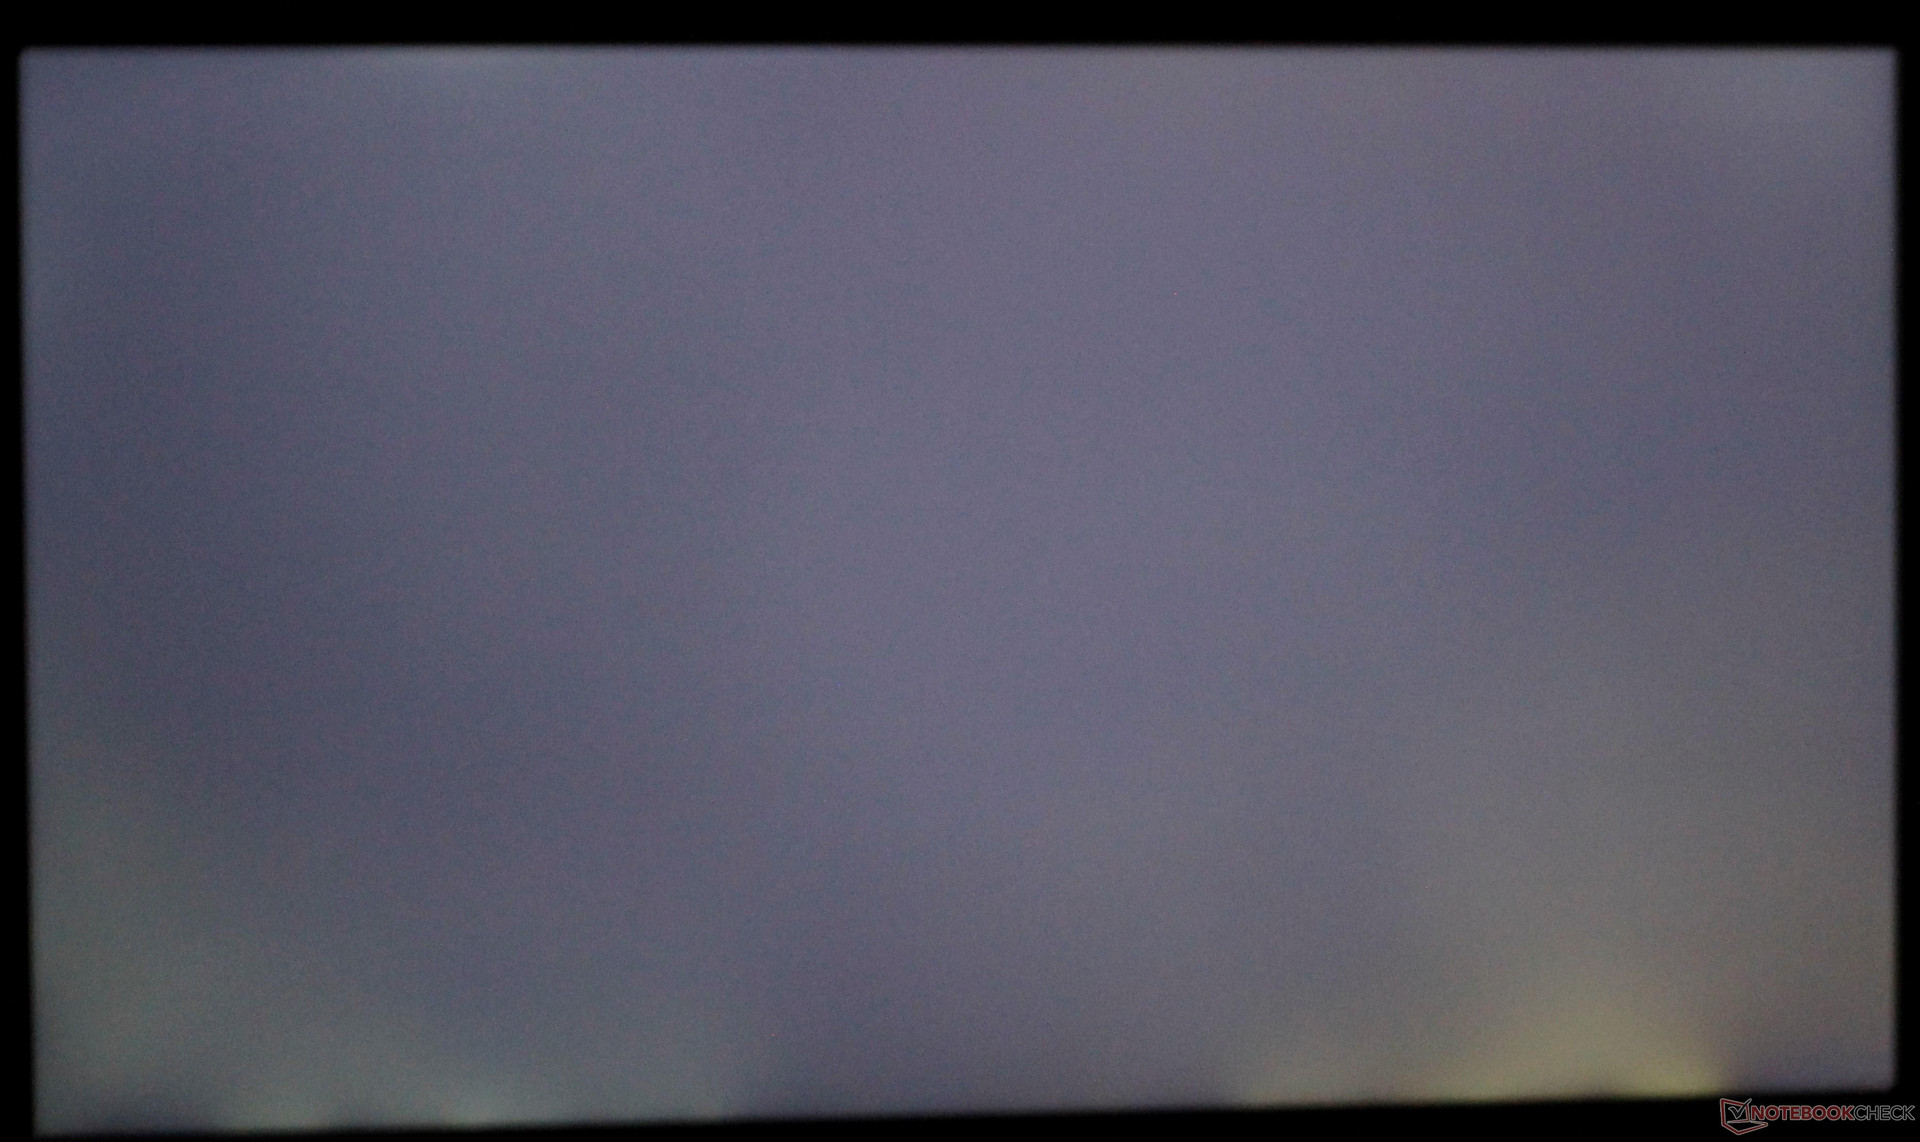
iluminação: 78 %
iluminação com acumulador: 305.5 cd/m²
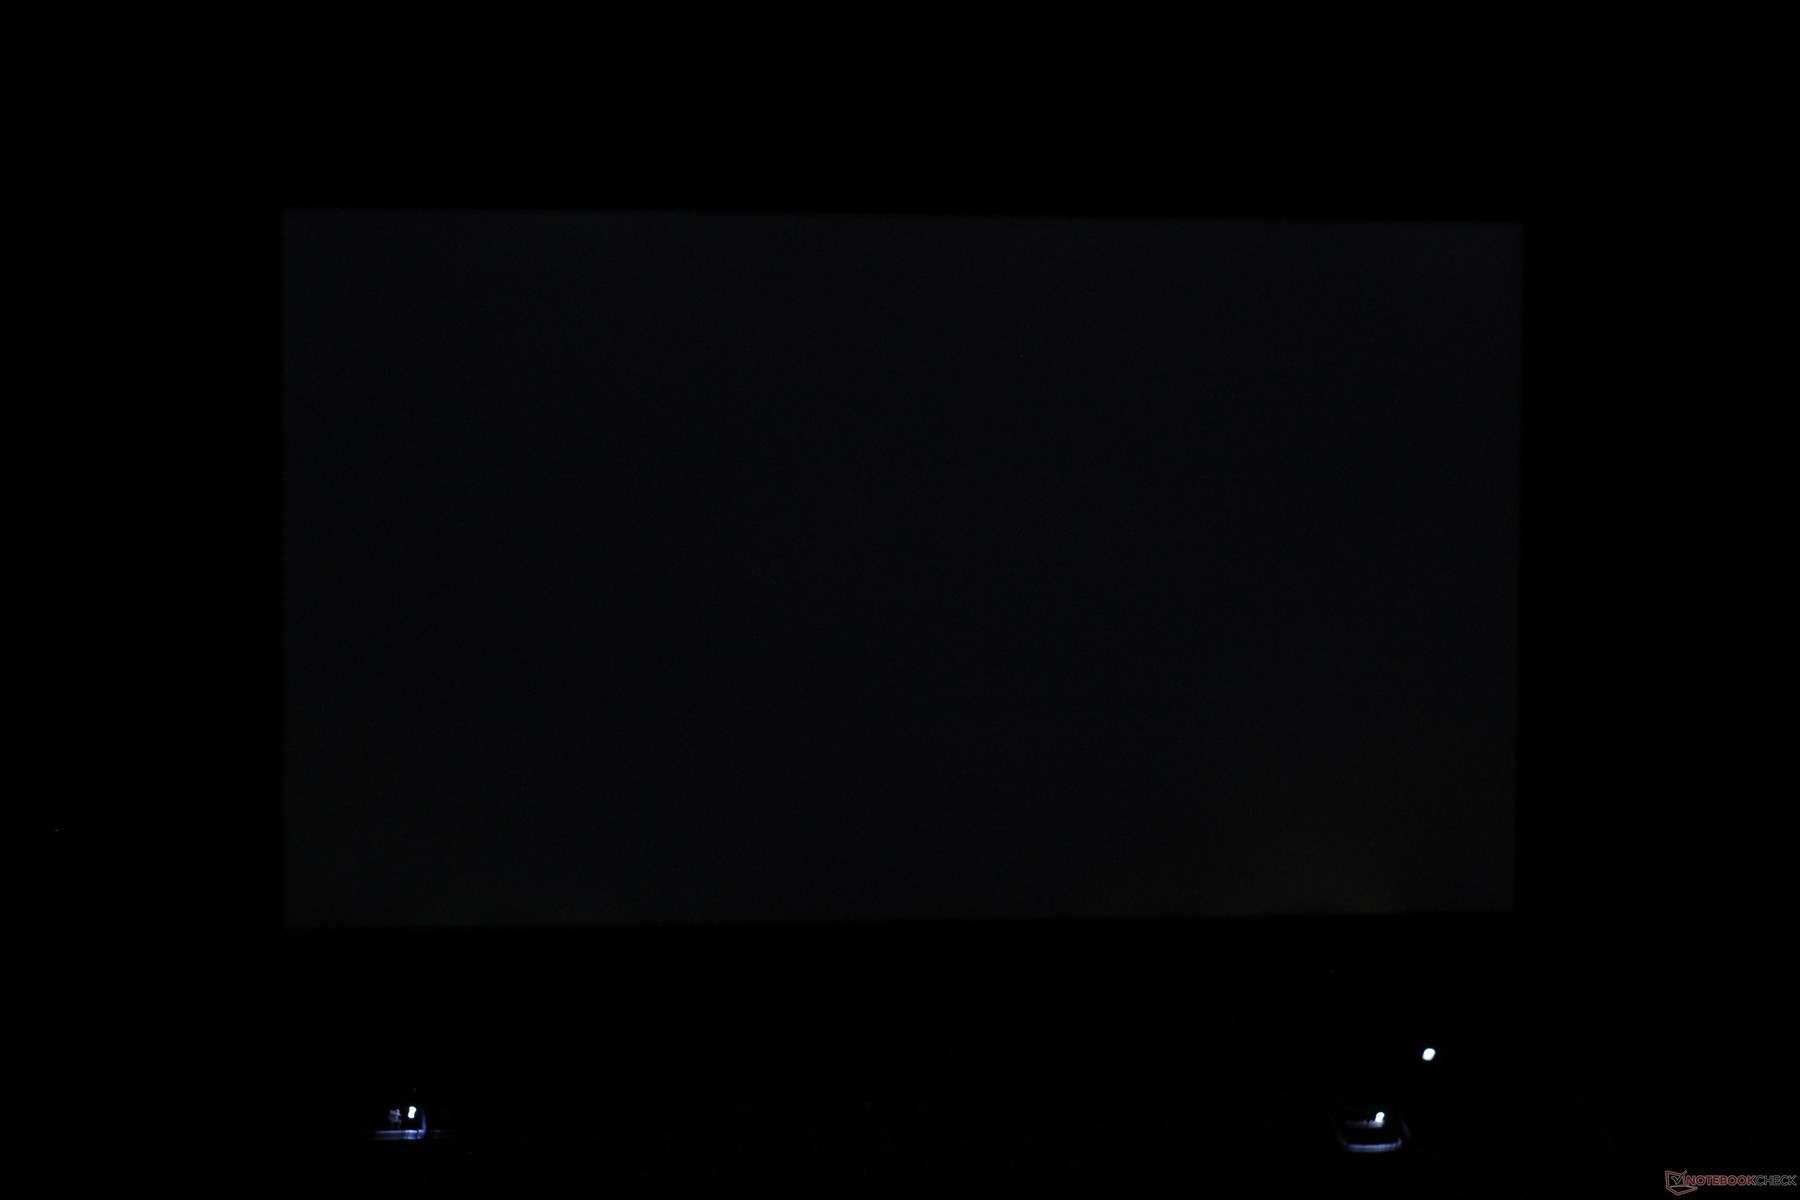
Contraste: 1273:1 (Preto: 0.24 cd/m²)
ΔE ColorChecker Calman: 3.51 | ∀{0.5-29.43 Ø4.71}
calibrated: 3.15
ΔE Greyscale Calman: 4 | ∀{0.09-98 Ø4.96}
89% sRGB (Argyll 1.6.3 3D)
58% AdobeRGB 1998 (Argyll 1.6.3 3D)
65.4% AdobeRGB 1998 (Argyll 3D)
89.4% sRGB (Argyll 3D)
67.3% Display P3 (Argyll 3D)
Gamma: 2.18
CCT: 7291 K
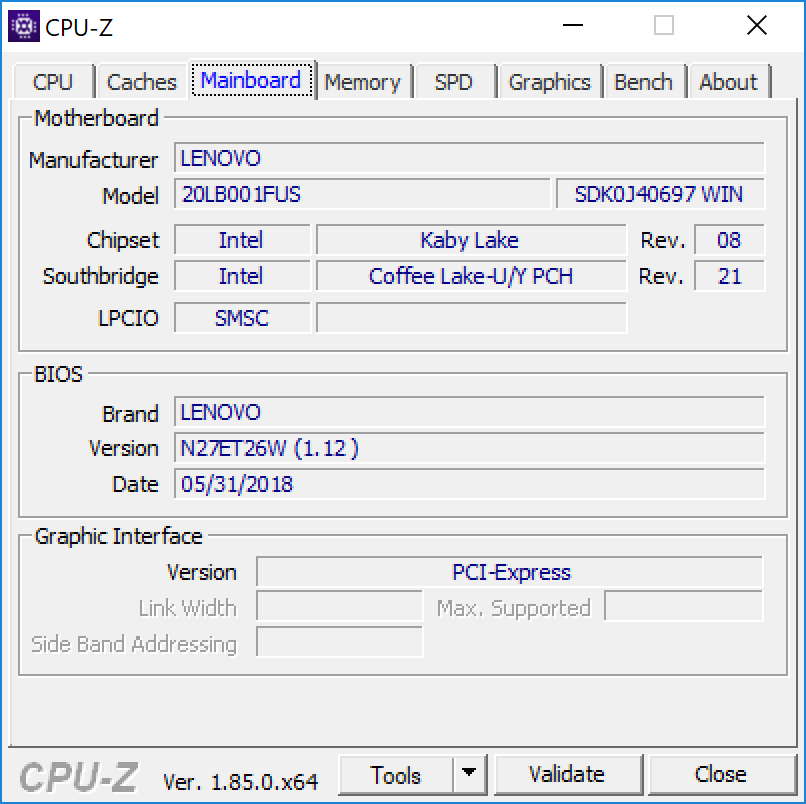
| Lenovo ThinkPad P52S-20LB001FUS Lenovo LEN40BD, IPS, 15.6", 3840x2160 | HP ZBook 15u G5 2ZC05EA CMN15E7, IPS LED, 15.6", 1920x1080 | Lenovo ThinkPad P51s 20HB000SGE BOE NV156QUM-N44, IPS, 15.6", 3840x2160 | Lenovo ThinkPad P52s-20LB000HGE NV156FHM-N47, IPS LED, 15.6", 1920x1080 | Dell Precision 3520 IPS LED, 15.6", 1920x1080 | Dell Precision 5520 UHD SHP1476, IPS, 15.6", 3840x2160 | MSI WS63VR 7RL-023US SAMSUNG LƒFL156FL02-101 , IPS, 15.6", 3840x2160 | |
|---|---|---|---|---|---|---|---|
| Display | -32% | 3% | -34% | 7% | 5% | -25% | |
| Display P3 Coverage (%) | 67.3 | 43.05 -36% | 69.7 4% | 41.83 -38% | 72.7 8% | 67.4 0% | 47.43 -30% |
| sRGB Coverage (%) | 89.4 | 64.7 -28% | 91.2 2% | 62.1 -31% | 94.8 6% | 98.5 10% | 71.4 -20% |
| AdobeRGB 1998 Coverage (%) | 65.4 | 44.5 -32% | 66.8 2% | 43.22 -34% | 69.3 6% | 68.9 5% | 49 -25% |
| Response Times | -28% | -14% | -61% | -51% | -84% | -22% | |
| Response Time Grey 50% / Grey 80% * (ms) | 43.2 ? | 41.6 ? 4% | 38.4 ? 11% | 47.2 ? -9% | 48 ? -11% | 59.2 ? -37% | 36.8 ? 15% |
| Response Time Black / White * (ms) | 18 ? | 28.8 ? -60% | 24.8 ? -38% | 38.4 ? -113% | 34.4 ? -91% | 41.6 ? -131% | 28.4 ? -58% |
| PWM Frequency (Hz) | 980 | 25770 ? | 980 ? | 21550 ? | 1064 ? | 1351 ? | |
| Screen | -24% | -3% | -19% | -13% | 0% | -31% | |
| Brightness middle (cd/m²) | 305.5 | 229 -25% | 317 4% | 291 -5% | 345 13% | 372.4 22% | 259.4 -15% |
| Brightness (cd/m²) | 282 | 212 -25% | 290 3% | 284 1% | 329 17% | 368 30% | 247 -12% |
| Brightness Distribution (%) | 78 | 88 13% | 85 9% | 91 17% | 88 13% | 90 15% | 85 9% |
| Black Level * (cd/m²) | 0.24 | 0.23 4% | 0.32 -33% | 0.11 54% | 0.37 -54% | 0.48 -100% | 0.43 -79% |
| Contrast (:1) | 1273 | 996 -22% | 991 -22% | 2645 108% | 932 -27% | 776 -39% | 603 -53% |
| Colorchecker dE 2000 * | 3.51 | 4.2 -20% | 3.6 -3% | 6.7 -91% | 5 -42% | 2.6 26% | 5.5 -57% |
| Colorchecker dE 2000 max. * | 7.28 | 18 -147% | 6.6 9% | 20.2 -177% | 8 -10% | 5.6 23% | 12.7 -74% |
| Colorchecker dE 2000 calibrated * | 3.15 | 4.2 -33% | 4.5 -43% | ||||
| Greyscale dE 2000 * | 4 | 2 50% | 4.2 -5% | 4.5 -13% | 6.2 -55% | 3.7 7% | 3.6 10% |
| Gamma | 2.18 101% | 2.23 99% | 2.24 98% | 2.28 96% | 2.35 94% | 2.14 103% | 2.24 98% |
| CCT | 7291 89% | 6292 103% | 6740 96% | 7503 87% | 6702 97% | 7096 92% | 7163 91% |
| Color Space (Percent of AdobeRGB 1998) (%) | 58 | 41 -29% | 59.5 3% | 39.6 -32% | 61.8 7% | 63 9% | 45 -22% |
| Color Space (Percent of sRGB) (%) | 89 | 64.5 -28% | 91.1 2% | 61.7 -31% | 94.7 6% | 99 11% | 71 -20% |
| Média Total (Programa/Configurações) | -28% /
-26% | -5% /
-3% | -38% /
-27% | -19% /
-14% | -26% /
-10% | -26% /
-29% |
* ... menor é melhor
Exibir tempos de resposta
| ↔ Tempo de resposta preto para branco | ||
|---|---|---|
| 18 ms ... ascensão ↗ e queda ↘ combinadas | ↗ 13.2 ms ascensão | 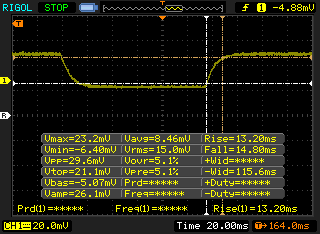 |
| ↘ 14.8 ms queda | ||
| A tela mostra boas taxas de resposta em nossos testes, mas pode ser muito lenta para jogadores competitivos. Em comparação, todos os dispositivos testados variam de 0.1 (mínimo) a 240 (máximo) ms. » 40 % de todos os dispositivos são melhores. Isso significa que o tempo de resposta medido é semelhante à média de todos os dispositivos testados (19.8 ms). | ||
| ↔ Tempo de resposta 50% cinza a 80% cinza | ||
| 43.2 ms ... ascensão ↗ e queda ↘ combinadas | ↗ 24.4 ms ascensão | 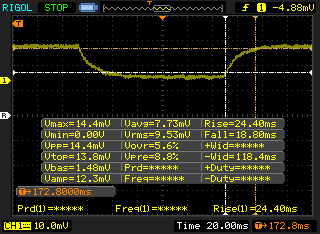 |
| ↘ 18.8 ms queda | ||
| A tela mostra taxas de resposta lentas em nossos testes e será insatisfatória para os jogadores. Em comparação, todos os dispositivos testados variam de 0.165 (mínimo) a 636 (máximo) ms. » 72 % de todos os dispositivos são melhores. Isso significa que o tempo de resposta medido é pior que a média de todos os dispositivos testados (31 ms). | ||
Cintilação da tela / PWM (modulação por largura de pulso)
| Tela tremeluzindo/PWM detectado | 980 Hz | 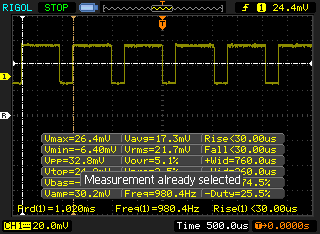 | |
A luz de fundo da tela pisca em 980 Hz (pior caso, por exemplo, utilizando PWM) . A frequência de 980 Hz é bastante alta, então a maioria dos usuários sensíveis ao PWM não deve notar nenhuma oscilação. [pwm_comparison] Em comparação: 52 % de todos os dispositivos testados não usam PWM para escurecer a tela. Se PWM foi detectado, uma média de 7754 (mínimo: 5 - máximo: 343500) Hz foi medida. | |||

| wPrime 2.10 - 1024m | |
| Dell Precision 5520 UHD | |
| Média Intel Core i7-8650U (268 - 335, n=3) | |
| Média da turma Workstation (n=1últimos 2 anos) | |
| MSI WS63VR 7RL-023US | |
* ... menor é melhor
| PCMark 8 Home Score Accelerated v2 | 3178 pontos | |
| PCMark 8 Work Score Accelerated v2 | 4196 pontos | |
| PCMark 10 Score | 3281 pontos | |
Ajuda | ||
| Lenovo ThinkPad P52S-20LB001FUS Samsung SSD PM981 MZVLB1T0HALR | Lenovo ThinkPad P52s-20LB000HGE Samsung PM961 MZVLW256HEHP | Lenovo ThinkPad P51s 20HB000SGE Samsung SSD PM961 1TB M.2 PCIe 3.0 x4 NVMe (MZVLW1T0) | HP ZBook 15u G5 2ZC05EA Toshiba XG5 KXG50ZNV256G | Dell Precision 3520 Toshiba XG4 NVMe (THNSN5512GPUK) | Dell Precision 5520 UHD Samsung SM961 MZVKW512HMJP m.2 PCI-e | MSI WS63VR 7RL-023US Toshiba NVMe THNSN5512GPU7 | Média Samsung SSD PM981 MZVLB1T0HALR | |
|---|---|---|---|---|---|---|---|---|
| AS SSD | -11% | -15% | -49% | -57% | 19% | -38% | 13% | |
| Copy Game MB/s (MB/s) | 721 | 742 | 747 | 921 | 1302 ? | |||
| Copy Program MB/s (MB/s) | 411.5 | 324.8 | 340.4 | 372.8 | 558 ? | |||
| Copy ISO MB/s (MB/s) | 1200 | 1146 | 1053 | 1659 | 2280 ? | |||
| Score Total (Points) | 4038 | 3131 -22% | 2771 -31% | 1697 -58% | 1646 -59% | 3681 -9% | 1979 -51% | 4588 ? 14% |
| Score Write (Points) | 1468 | 868 -41% | 1271 -13% | 710 -52% | 248 -83% | 1379 -6% | 557 -62% | 1942 ? 32% |
| Score Read (Points) | 1703 | 1504 -12% | 990 -42% | 689 -60% | 961 -44% | 1554 -9% | 962 -44% | 1747 ? 3% |
| Access Time Write * (ms) | 0.04 | 0.026 35% | 0.027 32% | 0.051 -27% | 0.034 15% | 0.023 43% | 0.033 17% | 0.05581 ? -40% |
| Access Time Read * (ms) | 0.04 | 0.065 -63% | 0.082 -105% | 0.103 -158% | 0.123 -208% | 0.038 5% | 0.128 -220% | 0.05158 ? -29% |
| 4K-64 Write (MB/s) | 1245 | 612 -51% | 1018 -18% | 564 -55% | 134.5 -89% | 1055 -15% | 314 -75% | 1625 ? 31% |
| 4K-64 Read (MB/s) | 1524 | 1312 -14% | 792 -48% | 488.4 -68% | 788 -48% | 1223 -20% | 710 -53% | 1502 ? -1% |
| 4K Write (MB/s) | 100.5 | 140 39% | 130.8 30% | 101.5 1% | 93.8 -7% | 155.3 55% | 114.6 14% | 109.7 ? 9% |
| 4K Read (MB/s) | 44.33 | 44.98 1% | 52.8 19% | 31.28 -29% | 32.58 -27% | 51.5 16% | 40.2 -9% | 46.4 ? 5% |
| Seq Write (MB/s) | 1220 | 1164 -5% | 1217 0% | 441 -64% | 201.9 -83% | 1694 39% | 1287 5% | 2036 ? 67% |
| Seq Read (MB/s) | 1351 | 1463 8% | 1450 7% | 1696 26% | 1406 4% | 2799 107% | 2133 58% | 1993 ? 48% |
* ... menor é melhor

| 3DMark Cloud Gate Standard Score | 9301 pontos | |
| 3DMark Fire Strike Score | 2093 pontos | |
Ajuda | ||
| Far Cry 5 | |
| 1280x720 Low Preset AA:T | |
| Média da turma Workstation (75 - 168, n=7, últimos 2 anos) | |
| Média NVIDIA Quadro P500 (30 - 32, n=2) | |
| Lenovo ThinkPad P52S-20LB001FUS | |
| 1920x1080 Medium Preset AA:T | |
| Média da turma Workstation (42 - 148, n=9, últimos 2 anos) | |
| Média NVIDIA Quadro P500 (12 - 15, n=2) | |
| Lenovo ThinkPad P52S-20LB001FUS | |
| Kingdom Come: Deliverance | |
| 1280x720 Low Preset | |
| Lenovo ThinkPad P52S-20LB001FUS | |
| Média NVIDIA Quadro P500 (n=1) | |
| 1920x1080 Medium Preset | |
| Lenovo ThinkPad P52S-20LB001FUS | |
| Média NVIDIA Quadro P500 (n=1) | |
| baixo | média | alto | ultra | |
|---|---|---|---|---|
| The Witcher 3 (2015) | 38 | 23 | 13 | 8 |
| Rise of the Tomb Raider (2016) | 42 | 26 | 12 | 11 |
| Kingdom Come: Deliverance (2018) | 39 | 15 | 14 | 8 |
| Far Cry 5 (2018) | 30 | 12 | 10 | 8 |
Barulho
| Ocioso |
| 28.3 / 28.3 / 29.8 dB |
| Carga |
| 40.6 / 40.6 dB |
 | ||
30 dB silencioso 40 dB(A) audível 50 dB(A) ruidosamente alto |
||
min: | ||
| Lenovo ThinkPad P52S-20LB001FUS Quadro P500, i7-8650U, Samsung SSD PM981 MZVLB1T0HALR | Lenovo ThinkPad P52s-20LB000HGE Quadro P500, i5-8550U, Samsung PM961 MZVLW256HEHP | Lenovo ThinkPad P51s 20HB000SGE Quadro M520, i7-7600U, Samsung SSD PM961 1TB M.2 PCIe 3.0 x4 NVMe (MZVLW1T0) | HP ZBook 15u G5 2ZC05EA Radeon Pro WX 3100, i5-8550U, Toshiba XG5 KXG50ZNV256G | Dell Precision 3520 Quadro M620, i7-7820HQ, Toshiba XG4 NVMe (THNSN5512GPUK) | Dell Precision 5520 UHD Quadro M1200, E3-1505M v6, Samsung SM961 MZVKW512HMJP m.2 PCI-e | MSI WS63VR 7RL-023US Quadro P4000 Max-Q, i7-7700HQ, Toshiba NVMe THNSN5512GPU7 | |
|---|---|---|---|---|---|---|---|
| Noise | 5% | 0% | 3% | -7% | -7% | -7% | |
| desligado / ambiente * (dB) | 28.3 | 29 -2% | 29.2 -3% | 29.8 -5% | 29.6 -5% | 28.7 -1% | 28 1% |
| Idle Minimum * (dB) | 28.3 | 29 -2% | 29.2 -3% | 29.8 -5% | 29.6 -5% | 28.7 -1% | 33.2 -17% |
| Idle Average * (dB) | 28.3 | 29 -2% | 29.2 -3% | 29.8 -5% | 29.6 -5% | 32.1 -13% | 33.2 -17% |
| Idle Maximum * (dB) | 29.8 | 31.2 -5% | 31.1 -4% | 30.8 -3% | 31.2 -5% | 32.1 -8% | 33.2 -11% |
| Load Average * (dB) | 40.6 | 32.5 20% | 36.7 10% | 32.9 19% | 43 -6% | 41.3 -2% | 41.4 -2% |
| Witcher 3 ultra * (dB) | 40.6 | 32.5 20% | 36.5 10% | 45.5 -12% | 38.4 5% | ||
| Load Maximum * (dB) | 40.6 | 37.5 8% | 39.4 3% | 36.5 10% | 46.9 -16% | 45.5 -12% | 43.5 -7% |
* ... menor é melhor
(±) A temperatura máxima no lado superior é 41.4 °C / 107 F, em comparação com a média de 38.2 °C / 101 F , variando de 22.2 a 69.8 °C para a classe Workstation.
(-) A parte inferior aquece até um máximo de 57 °C / 135 F, em comparação com a média de 41.1 °C / 106 F
(+) Em uso inativo, a temperatura média para o lado superior é 26.6 °C / 80 F, em comparação com a média do dispositivo de 32 °C / ### class_avg_f### F.
(+) Os apoios para as mãos e o touchpad estão atingindo a temperatura máxima da pele (34 °C / 93.2 F) e, portanto, não estão quentes.
(-) A temperatura média da área do apoio para as mãos de dispositivos semelhantes foi 27.8 °C / 82 F (-6.2 °C / -11.2 F).
Lenovo ThinkPad P52S-20LB001FUS análise de áudio
(±) | o volume do alto-falante é médio, mas bom (###valor### dB)
Graves 100 - 315Hz
(-) | quase nenhum baixo - em média 17.7% menor que a mediana
(-) | graves não são lineares (15.4% delta para frequência anterior)
Médios 400 - 2.000 Hz
(+) | médios equilibrados - apenas 2.9% longe da mediana
(+) | médios são lineares (5.6% delta para frequência anterior)
Altos 2 - 16 kHz
(+) | agudos equilibrados - apenas 1.8% longe da mediana
(+) | os máximos são lineares (6.7% delta da frequência anterior)
Geral 100 - 16.000 Hz
(±) | a linearidade do som geral é média (17.4% diferença em relação à mediana)
Comparado com a mesma classe
» 53% de todos os dispositivos testados nesta classe foram melhores, 10% semelhantes, 37% piores
» O melhor teve um delta de 7%, a média foi 17%, o pior foi 35%
Comparado com todos os dispositivos testados
» 33% de todos os dispositivos testados foram melhores, 8% semelhantes, 58% piores
» O melhor teve um delta de 4%, a média foi 23%, o pior foi 134%
Dell Precision 5520 UHD análise de áudio
(±) | o volume do alto-falante é médio, mas bom (###valor### dB)
Graves 100 - 315Hz
(±) | graves reduzidos - em média 12.8% menor que a mediana
(±) | a linearidade dos graves é média (14.2% delta para a frequência anterior)
Médios 400 - 2.000 Hz
(+) | médios equilibrados - apenas 4% longe da mediana
(±) | a linearidade dos médios é média (9.9% delta para frequência anterior)
Altos 2 - 16 kHz
(+) | agudos equilibrados - apenas 3.3% longe da mediana
(±) | a linearidade dos máximos é média (12% delta para frequência anterior)
Geral 100 - 16.000 Hz
(±) | a linearidade do som geral é média (16.7% diferença em relação à mediana)
Comparado com a mesma classe
» 46% de todos os dispositivos testados nesta classe foram melhores, 9% semelhantes, 45% piores
» O melhor teve um delta de 7%, a média foi 17%, o pior foi 35%
Comparado com todos os dispositivos testados
» 29% de todos os dispositivos testados foram melhores, 7% semelhantes, 64% piores
» O melhor teve um delta de 4%, a média foi 23%, o pior foi 134%
| desligado | |
| Ocioso | |
| Carga |
|
Key:
min: | |
| Lenovo ThinkPad P52S-20LB001FUS i7-8650U, Quadro P500, Samsung SSD PM981 MZVLB1T0HALR, IPS, 3840x2160, 15.6" | Lenovo ThinkPad P52s-20LB000HGE i5-8550U, Quadro P500, Samsung PM961 MZVLW256HEHP, IPS LED, 1920x1080, 15.6" | Lenovo ThinkPad P51s 20HB000SGE i7-7600U, Quadro M520, Samsung SSD PM961 1TB M.2 PCIe 3.0 x4 NVMe (MZVLW1T0), IPS, 3840x2160, 15.6" | HP ZBook 15u G5 2ZC05EA i5-8550U, Radeon Pro WX 3100, Toshiba XG5 KXG50ZNV256G, IPS LED, 1920x1080, 15.6" | Dell Precision 3520 i7-7820HQ, Quadro M620, Toshiba XG4 NVMe (THNSN5512GPUK), IPS LED, 1920x1080, 15.6" | Dell Precision 5520 UHD E3-1505M v6, Quadro M1200, Samsung SM961 MZVKW512HMJP m.2 PCI-e, IPS, 3840x2160, 15.6" | MSI WS63VR 7RL-023US i7-7700HQ, Quadro P4000 Max-Q, Toshiba NVMe THNSN5512GPU7, IPS, 3840x2160, 15.6" | |
|---|---|---|---|---|---|---|---|
| Power Consumption | 22% | 2% | 20% | -17% | -54% | -69% | |
| Idle Minimum * (Watt) | 5.9 | 4.1 31% | 5.8 2% | 3.2 46% | 5.8 2% | 8.9 -51% | 13.3 -125% |
| Idle Average * (Watt) | 11.7 | 7.7 34% | 10.4 11% | 6.1 48% | 10.7 9% | 13.6 -16% | 17.2 -47% |
| Idle Maximum * (Watt) | 15.6 | 10.7 31% | 13.5 13% | 9.7 38% | 13.3 15% | 14.1 10% | 17.9 -15% |
| Load Average * (Watt) | 63 | 52 17% | 62.4 1% | 62 2% | 78.2 -24% | 100.3 -59% | 83.7 -33% |
| Witcher 3 ultra * (Watt) | 48.4 | 38.8 20% | 48 1% | 58.8 -21% | 100.2 -107% | 101.9 -111% | |
| Load Maximum * (Watt) | 63.1 | 65 -3% | 73.1 -16% | 71 -13% | 116 -84% | 126.3 -100% | 114.3 -81% |
* ... menor é melhor
| Lenovo ThinkPad P52S-20LB001FUS i7-8650U, Quadro P500, 80 Wh | Lenovo ThinkPad P52s-20LB000HGE i5-8550U, Quadro P500, 104 Wh | Lenovo ThinkPad P51s 20HB000SGE i7-7600U, Quadro M520, 104 Wh | HP ZBook 15u G5 2ZC05EA i5-8550U, Radeon Pro WX 3100, 56 Wh | Dell Precision 3520 i7-7820HQ, Quadro M620, 68 Wh | Dell Precision 5520 UHD E3-1505M v6, Quadro M1200, 97 Wh | MSI WS63VR 7RL-023US i7-7700HQ, Quadro P4000 Max-Q, 48 Wh | |
|---|---|---|---|---|---|---|---|
| Duração da bateria | 76% | 62% | 14% | -27% | -50% | -71% | |
| Reader / Idle (h) | 17.2 | 39.3 128% | 26.4 53% | 21.7 26% | 16.6 -3% | 12.1 -30% | 3.9 -77% |
| WiFi v1.3 (h) | 11.1 | 16.2 46% | 11.9 7% | 8.6 -23% | 7.6 -32% | 4.2 -62% | 2.9 -74% |
| Load (h) | 2.4 | 3.7 54% | 5.4 125% | 3.3 38% | 1.3 -46% | 1 -58% | 0.9 -62% |
Pro
Contra
O Lenovo P52s se posiciona em um lugar peculiar. A tentativa da Lenovo de casar componentes energeticamente eficientes com um dispositivo de classe de estação de trabalho é uma história de compromissos. Embora a meta de um workstation impulsionado com ULV esteja mais próxima do que nunca graças à série de CPUs Kaby Lake R da Intel, ainda há muito espaço para melhorias.
O ponto mais fraco está no poder gráfico. Considerando que o P52s é colocado como um workstation portátil, o fraco desempenho gráfico é desanimador. A maioria dos profissionais faria melhor em comprar um portátil de escritório com uma Nvidia MX150 ou GTX 1050, pois ofereceria melhor desempenho gráfico sem sacrificar muito a eficiência energética ou a duração da bateria. Em comparação com outros workstations finos e leves, o P52s não oferece tanto poder, mas compensa essa falha com uma duração de bateria muito superior.
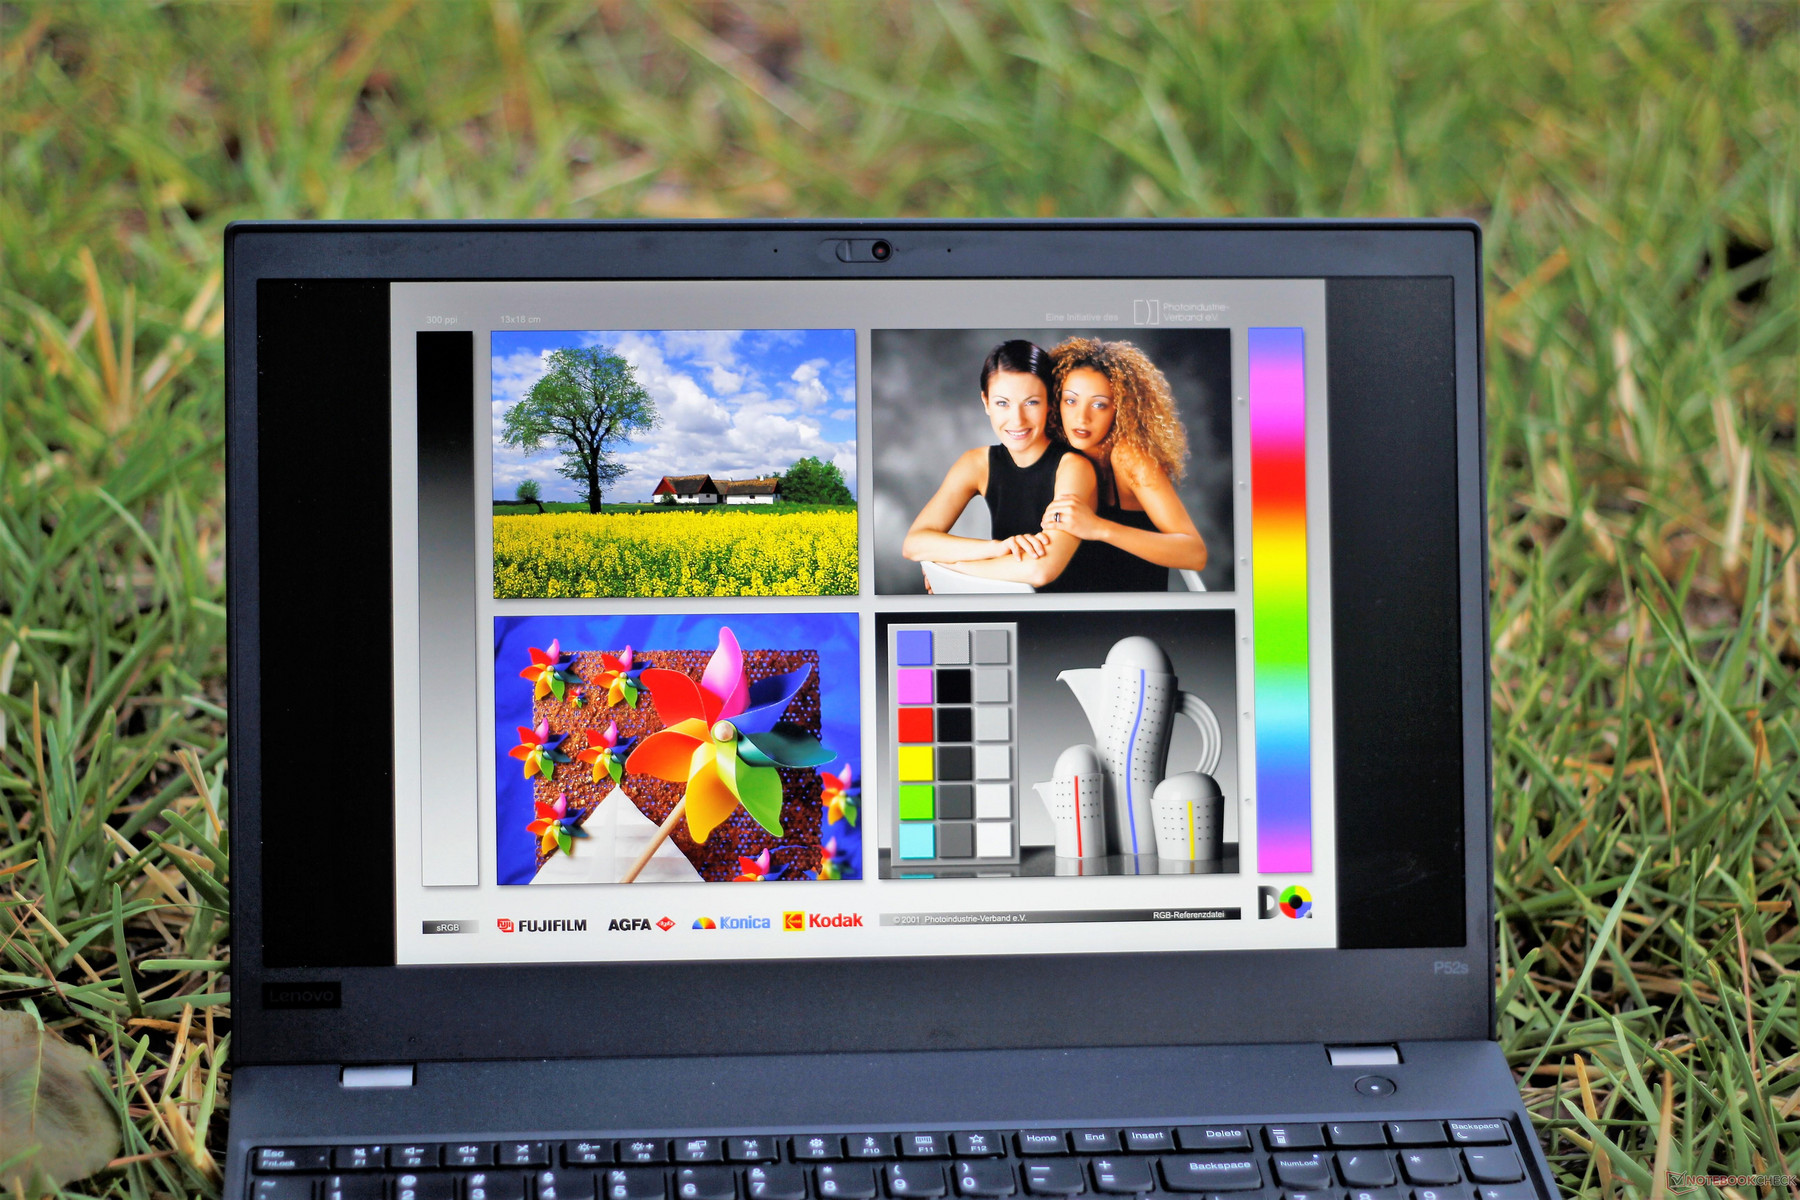
E o que há sobre esta variante em particular? Será que a tela 4K vale o custo extra? Considerando o fraco Quadro P500, a atualização não vale a pena. A maioria dos aplicativos será forçada a rodar em Full HD devido à falta de potência gráfica, negando o benefício de um painel de resolução mais alta. Além disso, alguns aplicativos experimentam falhas ou problemas de renderização na resolução 4K nativa da tela.
Tudo dito, a variante 4K do P52s mantém as mesmas decepções do modelo Full HD. Pior ainda, algumas das reclamações que tivemos sobre essa máquina são ampliadas aqui devido à fraca GPU, aos controladores com bugs e ao desempenho geral fraco do workstation.
Aqueles que precisam de um workstation compacto devem procurar Dell ou MSI para ver suas ofertas. Todos os demais devem tolerar o leve aumento de espessura e comprar um workstation completo como o ThinkPad P51.
Lenovo ThinkPad P52S-20LB001FUS
- 07/07/2018 v6 (old)
Sam Medley
Price comparison
