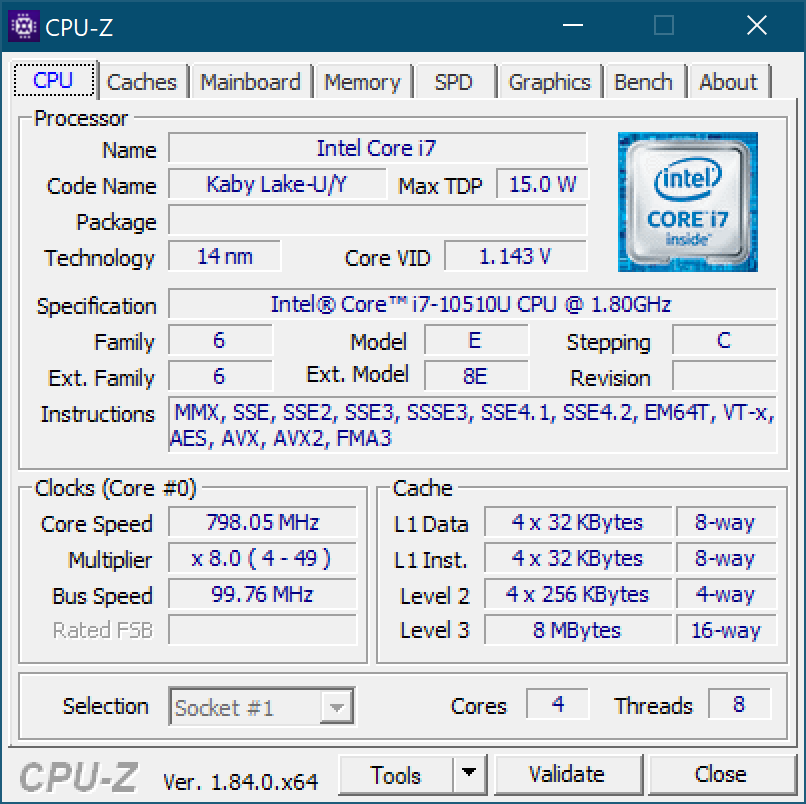
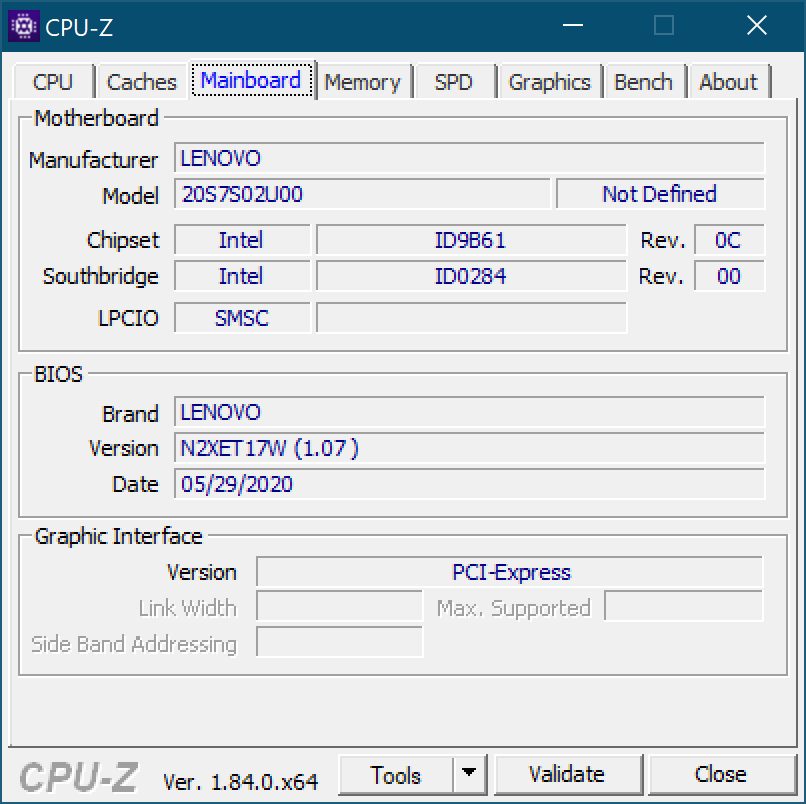
Breve Análise do Portátil Lenovo ThinkPad T15 Gen 1: Prejudicado pela falta de uma opção AMD
Avaliação | Data | Modelo | Peso | Altura | Size | Resolução | Preço |
|---|---|---|---|---|---|---|---|
| 87.2 % v7 (old) | 07/2020 | Lenovo ThinkPad T15 Gen1-20S7S02U00 i7-10510U, GeForce MX330 | 1.8 kg | 19.95 mm | 15.60" | 3840x2160 | |
| 87.2 % v7 (old) | Lenovo ThinkPad T590-20N40009GE i7-8565U, GeForce MX250 | 1.8 kg | 19.95 mm | 15.60" | 3840x2160 | ||
| 82.1 % v7 (old) | 03/2020 | Lenovo ThinkPad E15 20RD0011GE i7-10510U, Radeon RX 640 | 1.8 kg | 18.9 mm | 15.60" | 1920x1080 | |
| 82.6 % v7 (old) | 07/2020 | HP ProBook 455 G7-175W8EA R7 4700U, Vega 7 | 1.8 kg | 19 mm | 15.60" | 1920x1080 |
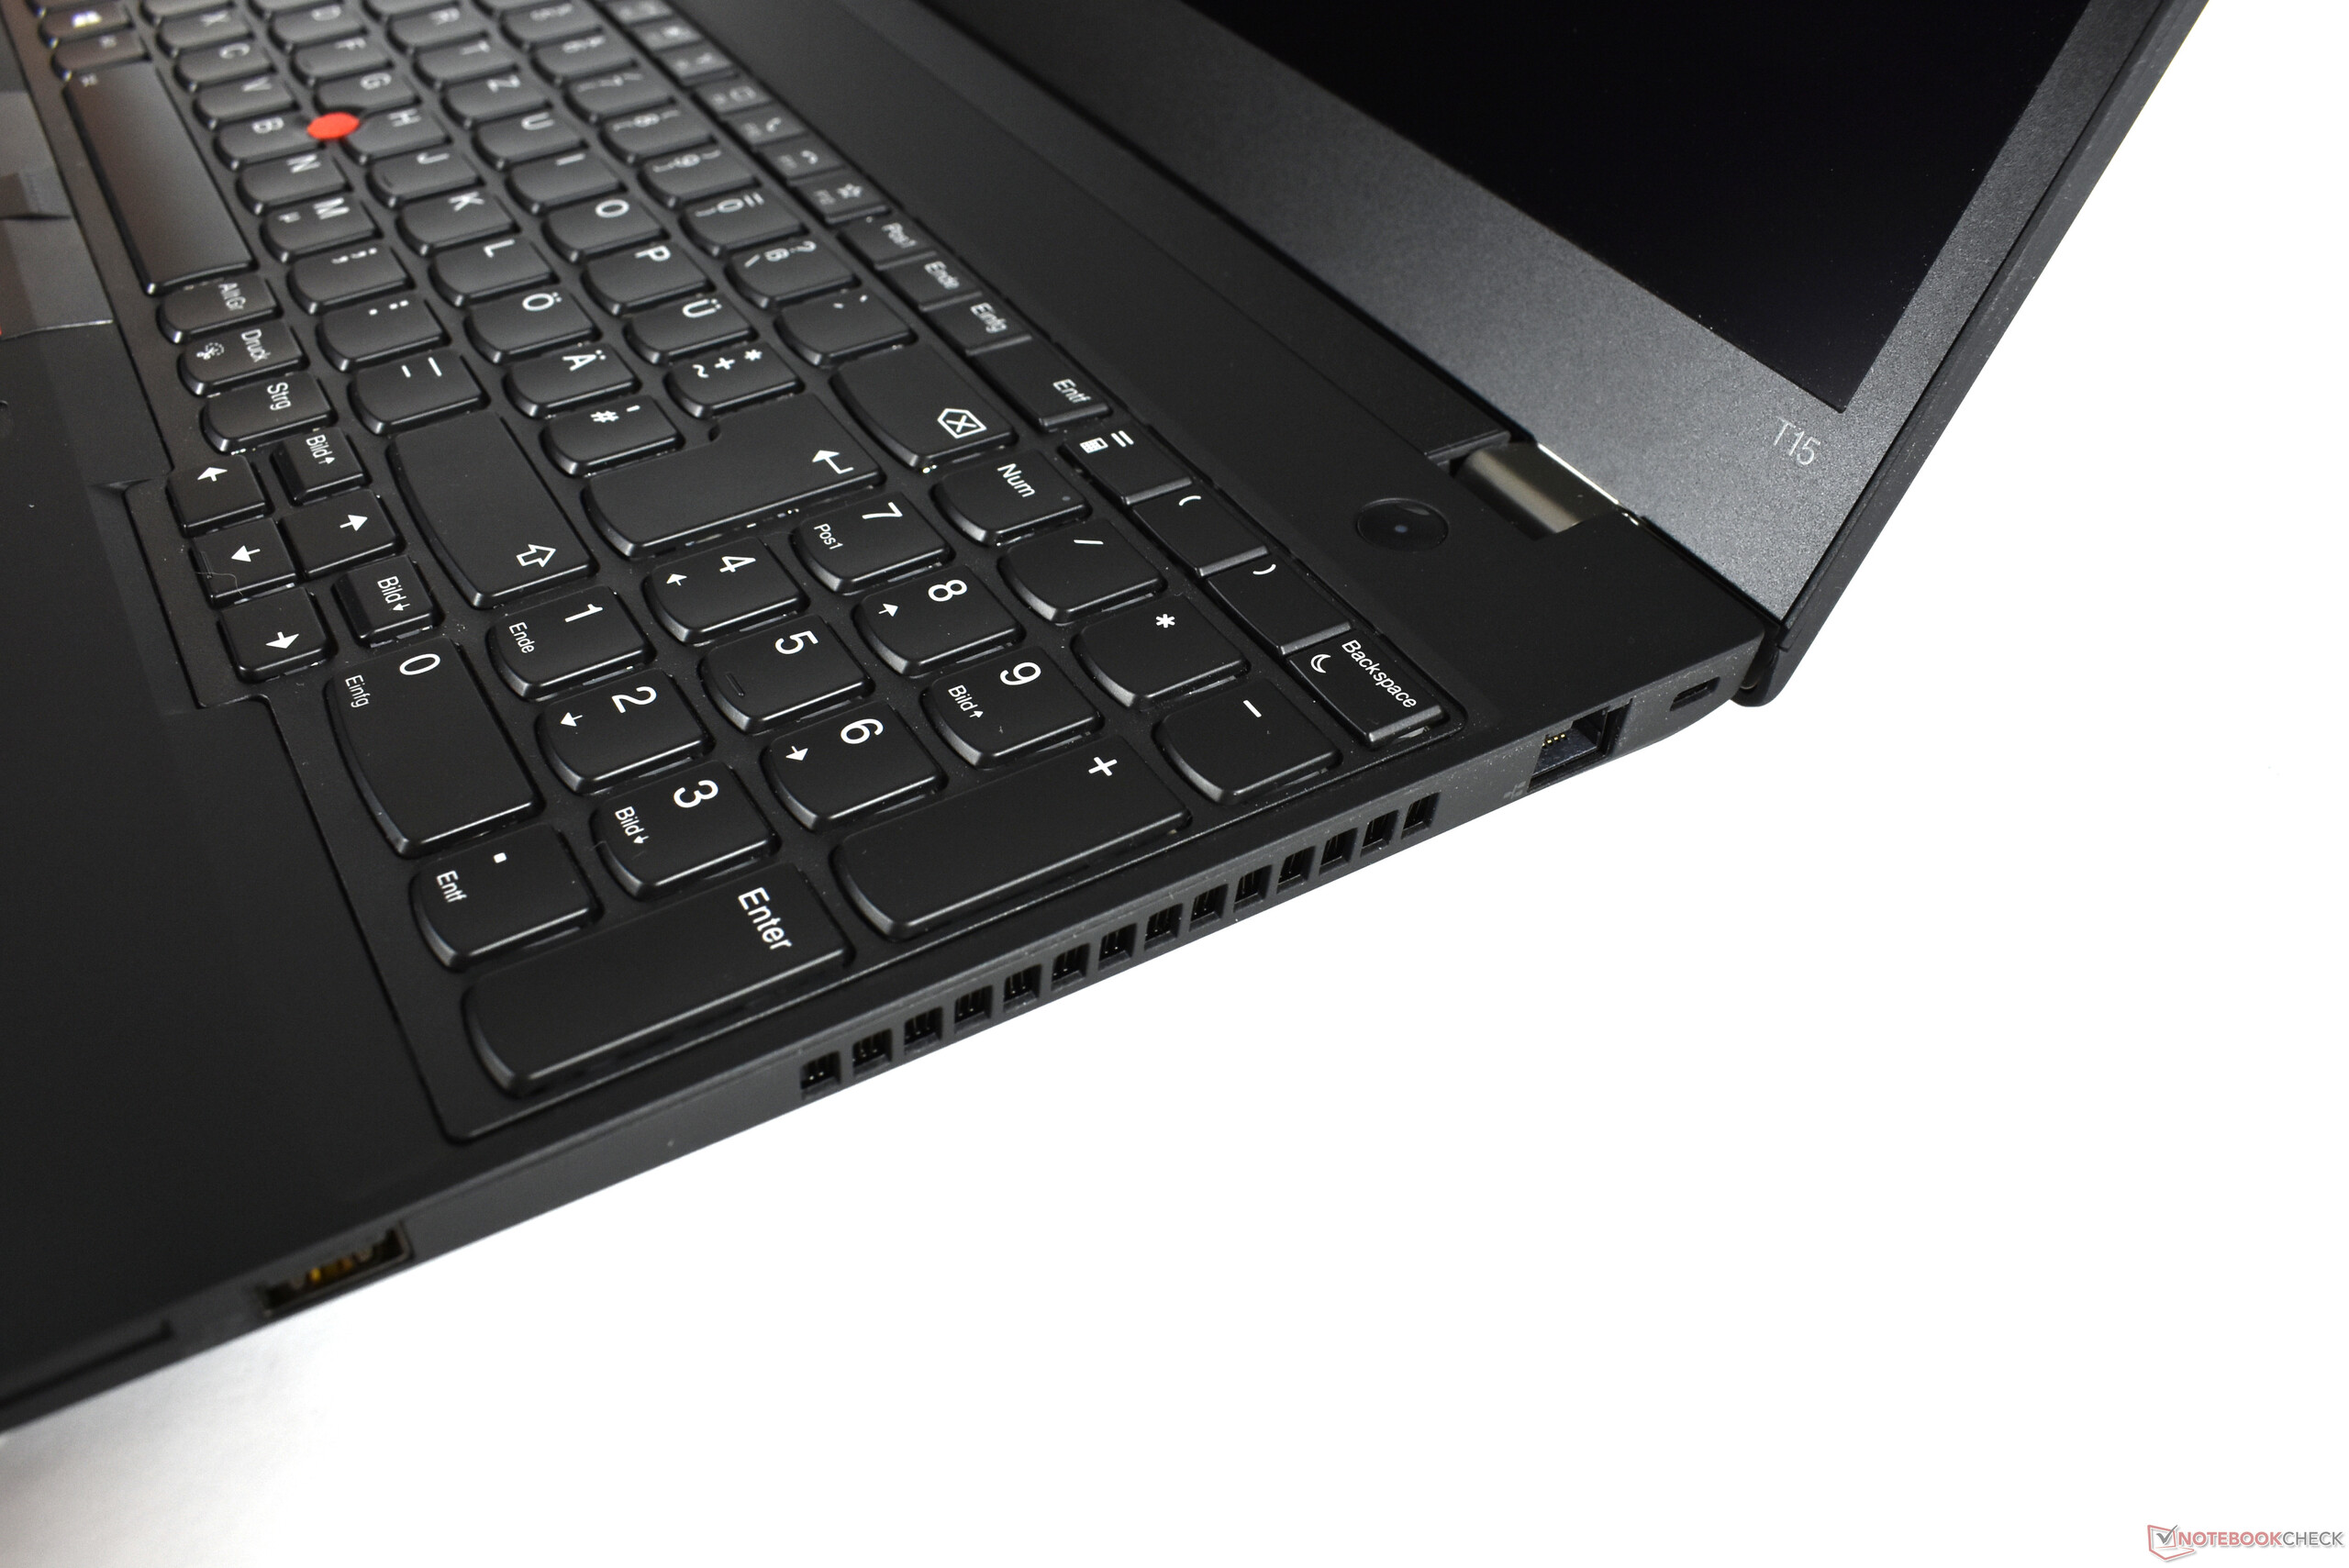
| SD Card Reader | |
| average JPG Copy Test (av. of 3 runs) | |
| Lenovo ThinkPad T15 Gen1-20S7S02U00 (Toshiba Exceria Pro M501 64 GB UHS-II) | |
| HP ProBook 455 G7-175W8EA (Toshiba Exceria Pro SDXC 64 GB UHS-II) | |
| Média da turma Office (22.4 - 198.5, n=22, últimos 2 anos) | |
| maximum AS SSD Seq Read Test (1GB) | |
| Lenovo ThinkPad T15 Gen1-20S7S02U00 (Toshiba Exceria Pro M501 64 GB UHS-II) | |
| HP ProBook 455 G7-175W8EA (Toshiba Exceria Pro SDXC 64 GB UHS-II) | |
| Média da turma Office (27.4 - 249, n=20, últimos 2 anos) | |


| |||||||||||||||||||||||||
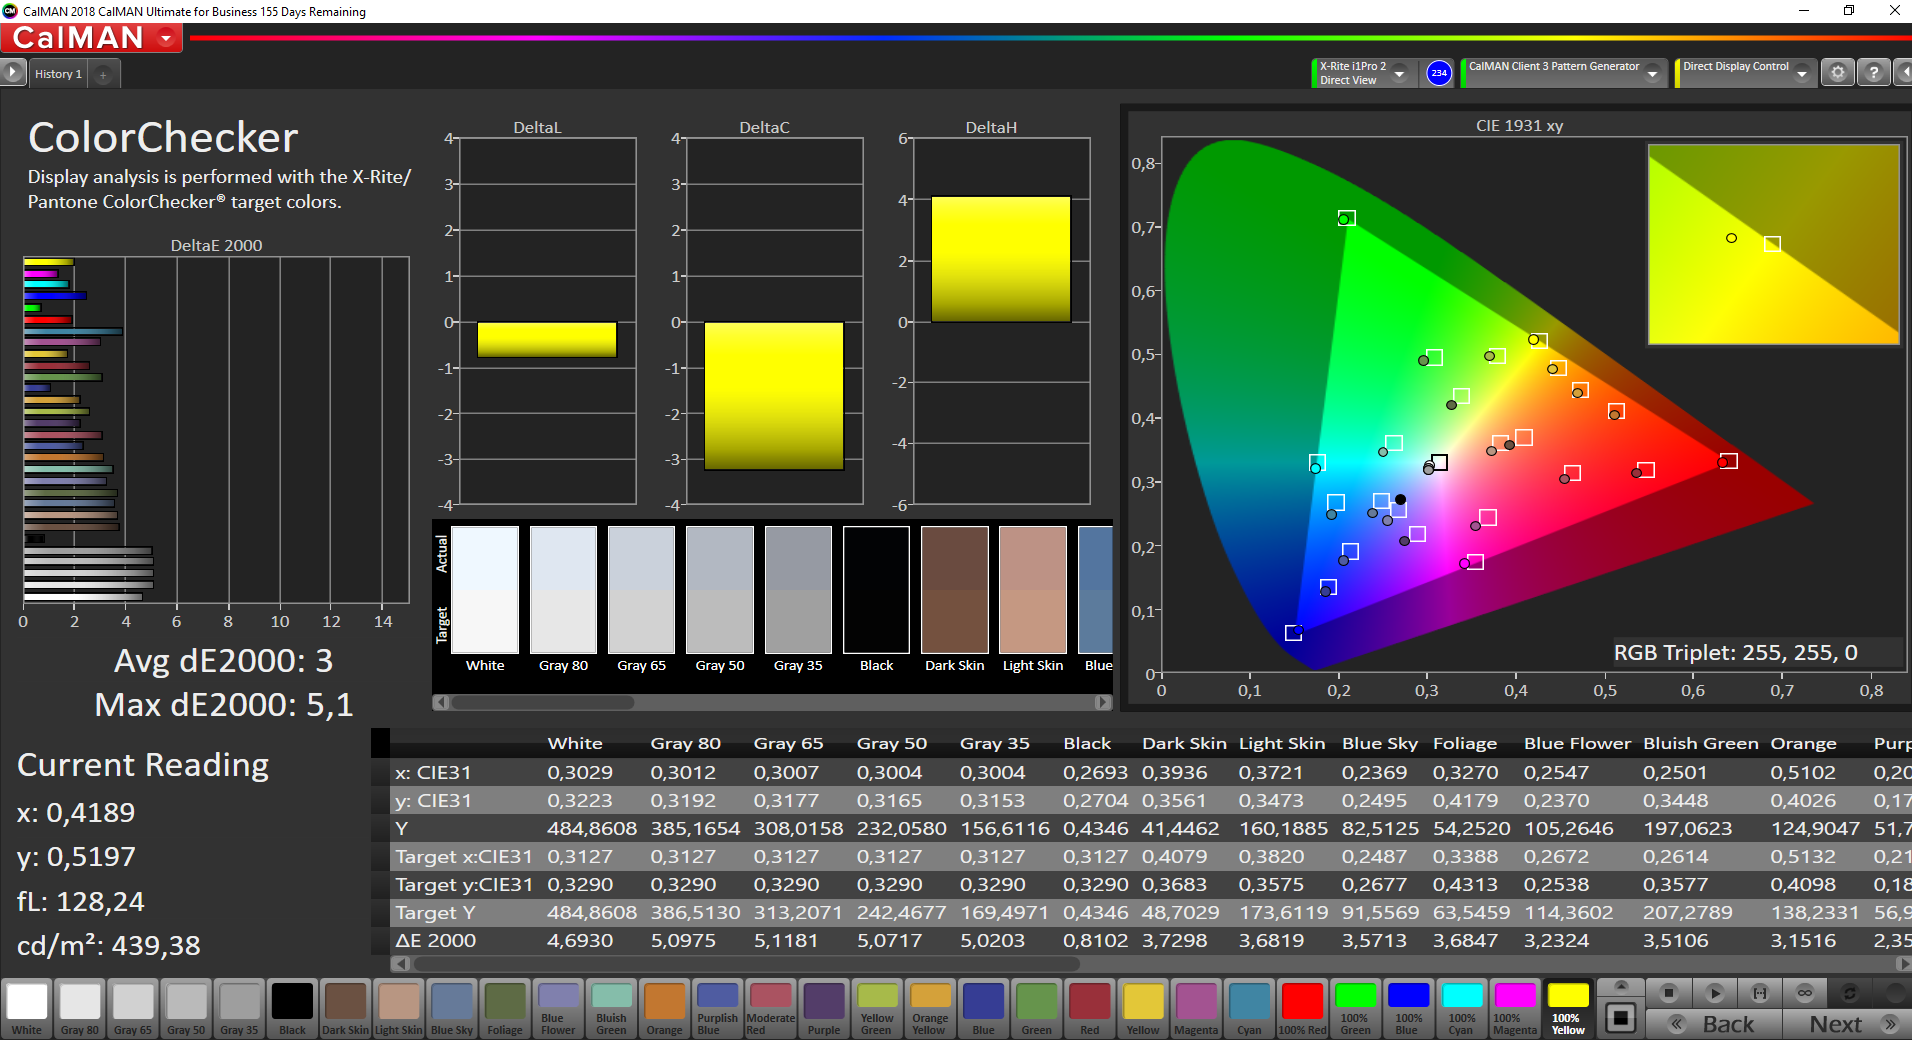
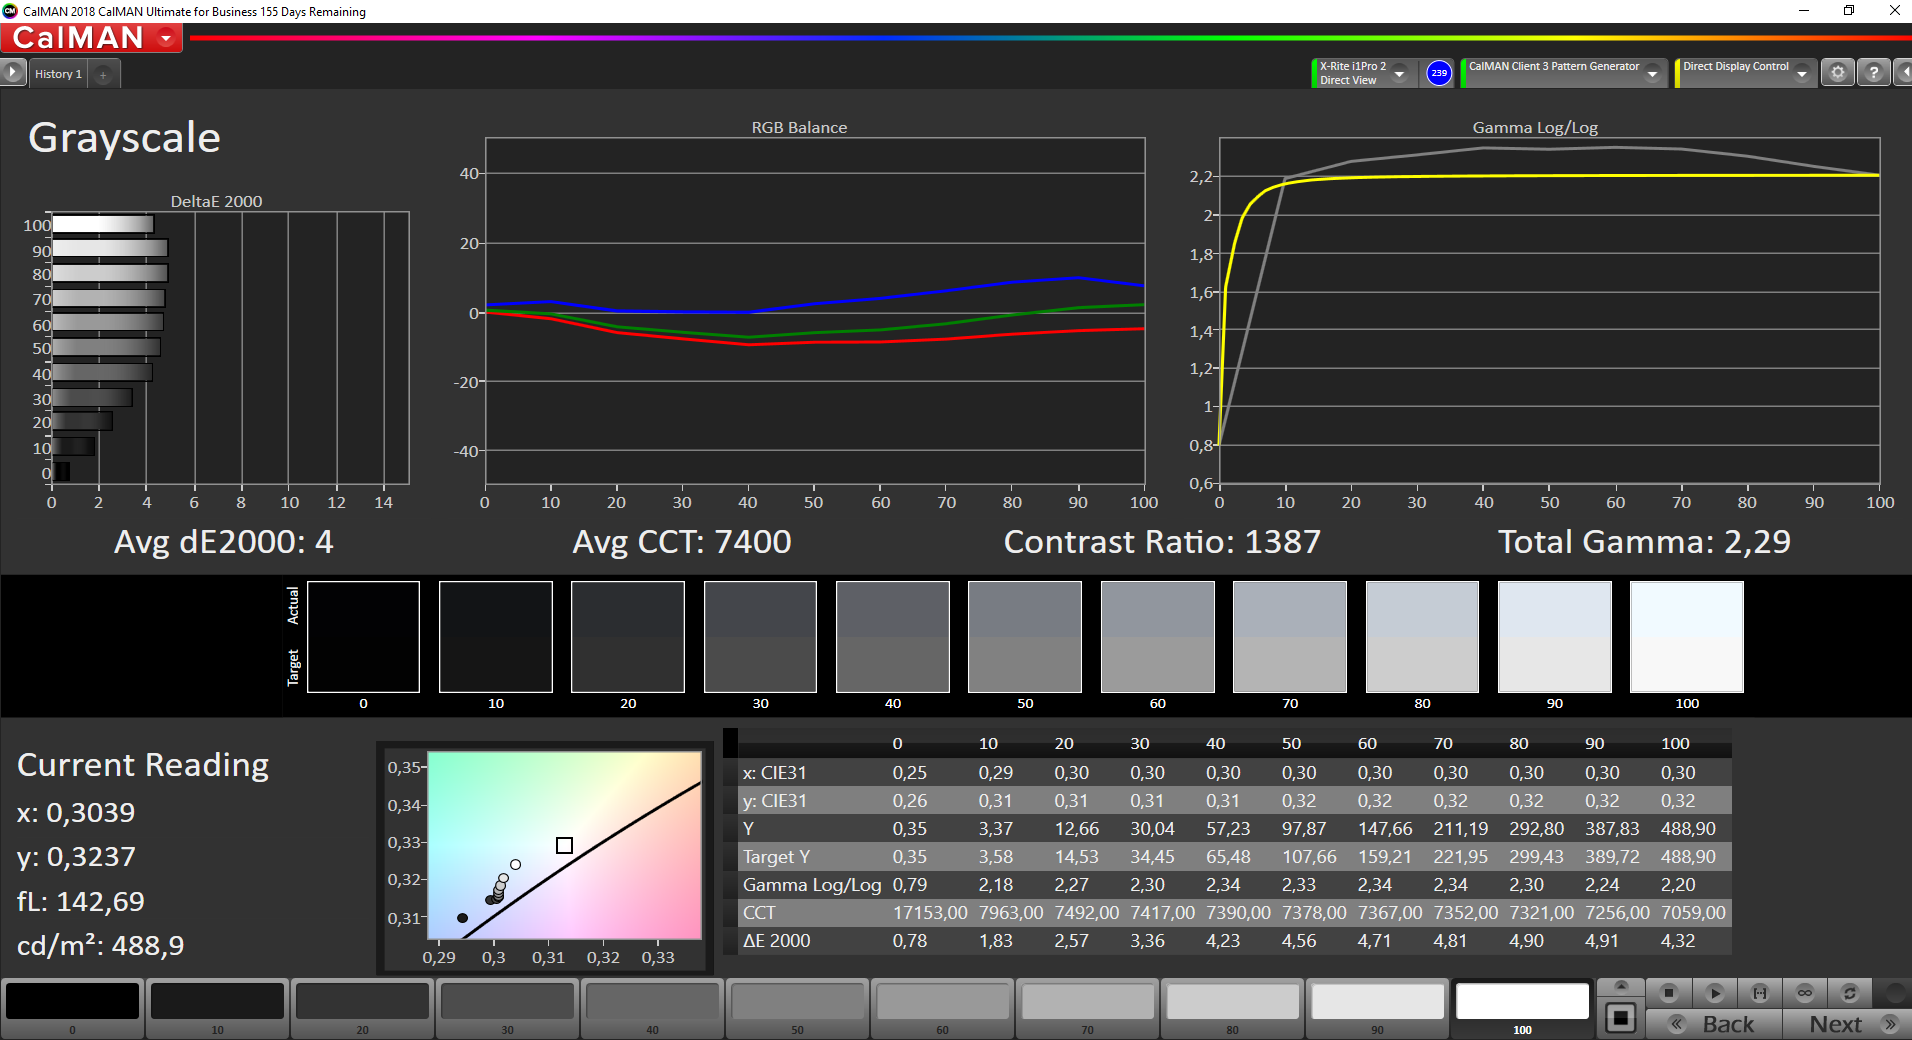
iluminação: 91 %
iluminação com acumulador: 494 cd/m²
Contraste: 1397:1 (Preto: 0.35 cd/m²)
ΔE ColorChecker Calman: 3 | ∀{0.5-29.43 Ø4.73}
calibrated: 0.8
ΔE Greyscale Calman: 4 | ∀{0.09-98 Ø4.97}
98.1% sRGB (Argyll 1.6.3 3D)
84.7% AdobeRGB 1998 (Argyll 1.6.3 3D)
95.5% AdobeRGB 1998 (Argyll 3D)
98.1% sRGB (Argyll 3D)
80.7% Display P3 (Argyll 3D)
Gamma: 2.24
CCT: 7400 K
| Lenovo ThinkPad T15 Gen1-20S7S02U00 NE156QUM-N66, IPS LED, 3840x2160, 15.6" | Lenovo ThinkPad T590-20N40009GE NE156QUM-N66, IPS, 3840x2160, 15.6" | Lenovo ThinkPad E15 20RD0011GE NV156FHM-N48, IPS LED, 1920x1080, 15.6" | HP ProBook 455 G7-175W8EA AUO, B156HW02, IPS, 1920x1080, 15.6" | |
|---|---|---|---|---|
| Display | -1% | -49% | -51% | |
| Display P3 Coverage (%) | 80.7 | 80.2 -1% | 40.25 -50% | 37.92 -53% |
| sRGB Coverage (%) | 98.1 | 97.8 0% | 57.7 -41% | 57.1 -42% |
| AdobeRGB 1998 Coverage (%) | 95.5 | 95 -1% | 41.59 -56% | 39.18 -59% |
| Response Times | -21% | -43% | -9% | |
| Response Time Grey 50% / Grey 80% * (ms) | 42 ? | 48.4 ? -15% | 49.6 ? -18% | 41 ? 2% |
| Response Time Black / White * (ms) | 21.6 ? | 27.2 ? -26% | 36 ? -67% | 26 ? -20% |
| PWM Frequency (Hz) | 1250 ? | |||
| Screen | 3% | -126% | -86% | |
| Brightness middle (cd/m²) | 489 | 531 9% | 283 -42% | 282 -42% |
| Brightness (cd/m²) | 501 | 523 4% | 258 -49% | 264 -47% |
| Brightness Distribution (%) | 91 | 96 5% | 81 -11% | 88 -3% |
| Black Level * (cd/m²) | 0.35 | 0.37 -6% | 0.22 37% | 0.19 46% |
| Contrast (:1) | 1397 | 1435 3% | 1286 -8% | 1484 6% |
| Colorchecker dE 2000 * | 3 | 2.5 17% | 7.9 -163% | 5.56 -85% |
| Colorchecker dE 2000 max. * | 5.1 | 4.4 14% | 23.6 -363% | 19.07 -274% |
| Colorchecker dE 2000 calibrated * | 0.8 | 1 -25% | 5.8 -625% | 4.5 -463% |
| Greyscale dE 2000 * | 4 | 3.5 12% | 6.6 -65% | 3.57 11% |
| Gamma | 2.24 98% | 2.31 95% | 2.18 101% | 2.61 84% |
| CCT | 7400 88% | 7189 90% | 5735 113% | 6895 94% |
| Color Space (Percent of AdobeRGB 1998) (%) | 84.7 | 84.3 0% | 37 -56% | 36 -57% |
| Color Space (Percent of sRGB) (%) | 98.1 | 97.7 0% | 57.1 -42% | 57 -42% |
| Média Total (Programa/Configurações) | -6% /
-1% | -73% /
-101% | -49% /
-70% |
* ... menor é melhor
Exibir tempos de resposta
| ↔ Tempo de resposta preto para branco | ||
|---|---|---|
| 21.6 ms ... ascensão ↗ e queda ↘ combinadas | ↗ 10 ms ascensão | 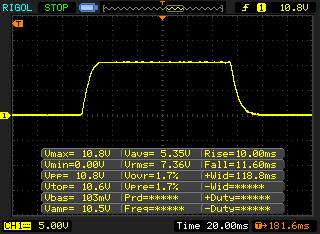 |
| ↘ 11.6 ms queda | ||
| A tela mostra boas taxas de resposta em nossos testes, mas pode ser muito lenta para jogadores competitivos. Em comparação, todos os dispositivos testados variam de 0.1 (mínimo) a 240 (máximo) ms. » 48 % de todos os dispositivos são melhores. Isso significa que o tempo de resposta medido é semelhante à média de todos os dispositivos testados (19.9 ms). | ||
| ↔ Tempo de resposta 50% cinza a 80% cinza | ||
| 42 ms ... ascensão ↗ e queda ↘ combinadas | ↗ 21.2 ms ascensão | 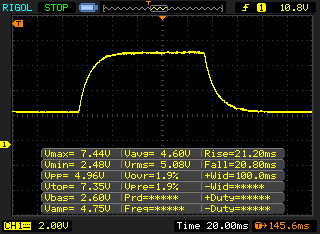 |
| ↘ 20.8 ms queda | ||
| A tela mostra taxas de resposta lentas em nossos testes e será insatisfatória para os jogadores. Em comparação, todos os dispositivos testados variam de 0.165 (mínimo) a 636 (máximo) ms. » 67 % de todos os dispositivos são melhores. Isso significa que o tempo de resposta medido é pior que a média de todos os dispositivos testados (31.1 ms). | ||
Cintilação da tela / PWM (modulação por largura de pulso)
| Tela tremeluzindo / PWM não detectado | 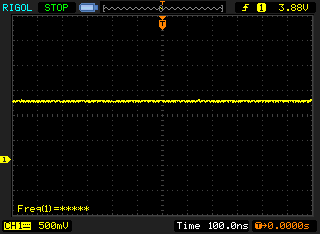 | ||
[pwm_comparison] Em comparação: 52 % de todos os dispositivos testados não usam PWM para escurecer a tela. Se PWM foi detectado, uma média de 7798 (mínimo: 5 - máximo: 343500) Hz foi medida. | |||
Cinebench R20: CPU (Multi Core) | CPU (Single Core)
Blender: v2.79 BMW27 CPU
7-Zip 18.03: 7z b 4 -mmt1 | 7z b 4
Geekbench 5.5: Single-Core | Multi-Core
HWBOT x265 Benchmark v2.2: 4k Preset
LibreOffice : 20 Documents To PDF
R Benchmark 2.5: Overall mean
| Cinebench R15 / CPU Multi 64Bit | |
| Média da turma Office (250 - 3380, n=74, últimos 2 anos) | |
| HP ProBook 455 G7-175W8EA | |
| Lenovo ThinkPad T15 Gen1-20S7S02U00 | |
| Lenovo ThinkPad T590-20N4002VGE | |
| Média Intel Core i7-10510U (482 - 856, n=45) | |
| Lenovo ThinkPad E15 20RD0011GE | |
| Cinebench R15 / CPU Single 64Bit | |
| Média da turma Office (99.5 - 312, n=74, últimos 2 anos) | |
| Lenovo ThinkPad T590-20N4002VGE | |
| Lenovo ThinkPad T15 Gen1-20S7S02U00 | |
| HP ProBook 455 G7-175W8EA | |
| Média Intel Core i7-10510U (113 - 202, n=42) | |
| Lenovo ThinkPad E15 20RD0011GE | |
| Cinebench R20 / CPU (Multi Core) | |
| Média da turma Office (648 - 8840, n=72, últimos 2 anos) | |
| HP ProBook 455 G7-175W8EA | |
| Lenovo ThinkPad T15 Gen1-20S7S02U00 | |
| Lenovo ThinkPad T590-20N4002VGE | |
| Média Intel Core i7-10510U (1015 - 1897, n=38) | |
| Lenovo ThinkPad E15 20RD0011GE | |
| Cinebench R20 / CPU (Single Core) | |
| Média da turma Office (345 - 816, n=72, últimos 2 anos) | |
| Lenovo ThinkPad T15 Gen1-20S7S02U00 | |
| Lenovo ThinkPad T590-20N4002VGE | |
| HP ProBook 455 G7-175W8EA | |
| Lenovo ThinkPad E15 20RD0011GE | |
| Média Intel Core i7-10510U (362 - 497, n=37) | |
| Blender / v2.79 BMW27 CPU | |
| Lenovo ThinkPad E15 20RD0011GE | |
| Média Intel Core i7-10510U (628 - 1051, n=31) | |
| Lenovo ThinkPad T590-20N4002VGE | |
| Lenovo ThinkPad T15 Gen1-20S7S02U00 | |
| HP ProBook 455 G7-175W8EA | |
| Média da turma Office (158 - 1940, n=73, últimos 2 anos) | |
| 7-Zip 18.03 / 7z b 4 -mmt1 | |
| Média da turma Office (3387 - 6469, n=74, últimos 2 anos) | |
| Lenovo ThinkPad T590-20N4002VGE | |
| Lenovo ThinkPad T15 Gen1-20S7S02U00 | |
| Lenovo ThinkPad E15 20RD0011GE | |
| Média Intel Core i7-10510U (3747 - 4981, n=31) | |
| HP ProBook 455 G7-175W8EA | |
| 7-Zip 18.03 / 7z b 4 | |
| Média da turma Office (7098 - 76886, n=75, últimos 2 anos) | |
| HP ProBook 455 G7-175W8EA | |
| Lenovo ThinkPad T590-20N4002VGE | |
| Lenovo ThinkPad T15 Gen1-20S7S02U00 | |
| Média Intel Core i7-10510U (12196 - 21298, n=31) | |
| Lenovo ThinkPad E15 20RD0011GE | |
| Geekbench 5.5 / Single-Core | |
| Média da turma Office (811 - 2128, n=71, últimos 2 anos) | |
| Lenovo ThinkPad T15 Gen1-20S7S02U00 | |
| Lenovo ThinkPad E15 20RD0011GE | |
| Média Intel Core i7-10510U (977 - 1287, n=31) | |
| HP ProBook 455 G7-175W8EA | |
| Geekbench 5.5 / Multi-Core | |
| Média da turma Office (1483 - 16999, n=71, últimos 2 anos) | |
| HP ProBook 455 G7-175W8EA | |
| Lenovo ThinkPad T15 Gen1-20S7S02U00 | |
| Média Intel Core i7-10510U (2474 - 4484, n=31) | |
| Lenovo ThinkPad E15 20RD0011GE | |
| HWBOT x265 Benchmark v2.2 / 4k Preset | |
| Média da turma Office (2.21 - 26, n=73, últimos 2 anos) | |
| HP ProBook 455 G7-175W8EA | |
| Lenovo ThinkPad T590-20N4002VGE | |
| Lenovo ThinkPad T15 Gen1-20S7S02U00 | |
| Média Intel Core i7-10510U (3.41 - 6.04, n=31) | |
| Lenovo ThinkPad E15 20RD0011GE | |
| LibreOffice / 20 Documents To PDF | |
| HP ProBook 455 G7-175W8EA | |
| Média Intel Core i7-10510U (50.7 - 77.8, n=27) | |
| Média da turma Office (41.5 - 102.3, n=73, últimos 2 anos) | |
| Lenovo ThinkPad T15 Gen1-20S7S02U00 | |
| R Benchmark 2.5 / Overall mean | |
| Média Intel Core i7-10510U (0.637 - 0.81, n=28) | |
| Lenovo ThinkPad E15 20RD0011GE | |
| HP ProBook 455 G7-175W8EA | |
| Lenovo ThinkPad T15 Gen1-20S7S02U00 | |
| Média da turma Office (0.4098 - 0.888, n=73, últimos 2 anos) | |
* ... menor é melhor
| PCMark 8 Home Score Accelerated v2 | 2971 pontos | |
| PCMark 8 Work Score Accelerated v2 | 4456 pontos | |
| PCMark 10 Score | 3861 pontos | |
Ajuda | ||
| DPC Latencies / LatencyMon - interrupt to process latency (max), Web, Youtube, Prime95 | |
| Lenovo ThinkPad T15 Gen1-20S7S02U00 | |
* ... menor é melhor
| Lenovo ThinkPad T15 Gen1-20S7S02U00 Toshiba XG6 KXG6AZNV1T02 | Lenovo ThinkPad E15 20RD0011GE Samsung PM991 MZALQ512HALU | HP ProBook 455 G7-175W8EA Samsung PM991 MZVLQ512HALU | Lenovo ThinkPad T590-20N4002VGE Toshiba XG6 KXG60ZNV512G | Média Toshiba XG6 KXG6AZNV1T02 | |
|---|---|---|---|---|---|
| CrystalDiskMark 5.2 / 6 | -15% | -26% | -8% | 9% | |
| Write 4K (MB/s) | 159.1 | 144.4 -9% | 141.9 -11% | 126.2 -21% | 162.2 ? 2% |
| Read 4K (MB/s) | 55.6 | 52.3 -6% | 37.25 -33% | 48.93 -12% | 54.8 ? -1% |
| Write Seq (MB/s) | 1435 | 946 -34% | 998 -30% | 1345 -6% | 1745 ? 22% |
| Read Seq (MB/s) | 1435 | 1608 12% | 1233 -14% | 1373 -4% | 1941 ? 35% |
| Write 4K Q32T1 (MB/s) | 512 | 592 16% | 338.4 -34% | 383.8 -25% | 493 ? -4% |
| Read 4K Q32T1 (MB/s) | 541 | 397.7 -26% | 431.1 -20% | 434.8 -20% | 542 ? 0% |
| Write Seq Q32T1 (MB/s) | 2682 | 1364 -49% | 1367 -49% | 2966 11% | 2961 ? 10% |
| Read Seq Q32T1 (MB/s) | 2902 | 2301 -21% | 2355 -19% | 3230 11% | 3190 ? 10% |

Sustained Read Performance: DiskSpd Read Loop, Queue Depth 8
| 3DMark 11 Performance | 4898 pontos | |
| 3DMark Cloud Gate Standard Score | 12137 pontos | |
| 3DMark Fire Strike Score | 3308 pontos | |
| 3DMark Time Spy Score | 1178 pontos | |
Ajuda | ||
| The Witcher 3 - 1366x768 Medium Graphics & Postprocessing | |
| Média da turma Office (44.7 - 63.9, n=4, últimos 2 anos) | |
| Lenovo ThinkPad E15 20RD0011GE | |
| Lenovo ThinkPad T590-20N4002VGE | |
| Média NVIDIA GeForce MX330 (34.2 - 37, n=2) | |
| Lenovo ThinkPad T15 Gen1-20S7S02U00 | |
| baixo | média | alto | ultra | 4K | |
|---|---|---|---|---|---|
| The Witcher 3 (2015) | 64.7 | 34.2 | 19.9 | 12 | |
| Dota 2 Reborn (2015) | 116 | 107 | 53.9 | 38.2 | 21.9 |
| X-Plane 11.11 (2018) | 33.4 | 47.3 | 35.9 | 18.1 | |
| Shadow of the Tomb Raider (2018) | 52.4 | 17.1 | |||
| Total War: Three Kingdoms (2019) | 52.9 | 16.1 |
Barulho
| Ocioso |
| 29.4 / 29.4 / 29.4 dB |
| Carga |
| 34.2 / 34.2 dB |
 | ||
30 dB silencioso 40 dB(A) audível 50 dB(A) ruidosamente alto |
||
min: | ||
(±) A temperatura máxima no lado superior é 42.6 °C / 109 F, em comparação com a média de 34.3 °C / 94 F , variando de 21.2 a 62.5 °C para a classe Office.
(-) A parte inferior aquece até um máximo de 59.2 °C / 139 F, em comparação com a média de 36.8 °C / 98 F
(+) Em uso inativo, a temperatura média para o lado superior é 23.7 °C / 75 F, em comparação com a média do dispositivo de 29.5 °C / ### class_avg_f### F.
(±) Jogando The Witcher 3, a temperatura média para o lado superior é 36.4 °C / 98 F, em comparação com a média do dispositivo de 29.5 °C / ## #class_avg_f### F.
(+) Os apoios para as mãos e o touchpad são mais frios que a temperatura da pele, com um máximo de 31.2 °C / 88.2 F e, portanto, são frios ao toque.
(-) A temperatura média da área do apoio para as mãos de dispositivos semelhantes foi 27.5 °C / 81.5 F (-3.7 °C / -6.7 F).
Lenovo ThinkPad T15 Gen1-20S7S02U00 análise de áudio
(-) | alto-falantes não muito altos (###valor### dB)
Graves 100 - 315Hz
(-) | quase nenhum baixo - em média 16% menor que a mediana
(±) | a linearidade dos graves é média (11.7% delta para a frequência anterior)
Médios 400 - 2.000 Hz
(±) | médios mais altos - em média 5.4% maior que a mediana
(+) | médios são lineares (6.8% delta para frequência anterior)
Altos 2 - 16 kHz
(+) | agudos equilibrados - apenas 3% longe da mediana
(+) | os máximos são lineares (3.9% delta da frequência anterior)
Geral 100 - 16.000 Hz
(±) | a linearidade do som geral é média (24.9% diferença em relação à mediana)
Comparado com a mesma classe
» 73% de todos os dispositivos testados nesta classe foram melhores, 7% semelhantes, 19% piores
» O melhor teve um delta de 7%, a média foi 21%, o pior foi 53%
Comparado com todos os dispositivos testados
» 76% de todos os dispositivos testados foram melhores, 5% semelhantes, 19% piores
» O melhor teve um delta de 4%, a média foi 24%, o pior foi 134%
Lenovo ThinkPad T590-20N4002VGE análise de áudio
(-) | alto-falantes não muito altos (###valor### dB)
Graves 100 - 315Hz
(-) | quase nenhum baixo - em média 16% menor que a mediana
(±) | a linearidade dos graves é média (7.9% delta para a frequência anterior)
Médios 400 - 2.000 Hz
(+) | médios equilibrados - apenas 4.3% longe da mediana
(±) | a linearidade dos médios é média (8.7% delta para frequência anterior)
Altos 2 - 16 kHz
(+) | agudos equilibrados - apenas 4.4% longe da mediana
(+) | os máximos são lineares (6.5% delta da frequência anterior)
Geral 100 - 16.000 Hz
(±) | a linearidade do som geral é média (25.5% diferença em relação à mediana)
Comparado com a mesma classe
» 78% de todos os dispositivos testados nesta classe foram melhores, 6% semelhantes, 16% piores
» O melhor teve um delta de 7%, a média foi 21%, o pior foi 53%
Comparado com todos os dispositivos testados
» 78% de todos os dispositivos testados foram melhores, 4% semelhantes, 17% piores
» O melhor teve um delta de 4%, a média foi 24%, o pior foi 134%
| desligado | |
| Ocioso | |
| Carga |
|
Key:
min: | |
| Lenovo ThinkPad T15 Gen1-20S7S02U00 i7-10510U, GeForce MX330, Toshiba XG6 KXG6AZNV1T02, IPS LED, 3840x2160, 15.6" | Lenovo ThinkPad T590-20N40009GE i7-8565U, GeForce MX250, WDC PC SN720 SDAQNTW-512G, IPS, 3840x2160, 15.6" | Lenovo ThinkPad E15 20RD0011GE i7-10510U, Radeon RX 640, Samsung PM991 MZALQ512HALU, IPS LED, 1920x1080, 15.6" | HP ProBook 455 G7-175W8EA R7 4700U, Vega 7, Samsung PM991 MZVLQ512HALU, IPS, 1920x1080, 15.6" | Média NVIDIA GeForce MX330 | Média da turma Office | |
|---|---|---|---|---|---|---|
| Power Consumption | 2% | 30% | 35% | -7% | 27% | |
| Idle Minimum * (Watt) | 4.3 | 4.3 -0% | 3.2 26% | 3.8 12% | 5.2 ? -21% | 4.4 ? -2% |
| Idle Average * (Watt) | 13.8 | 12.4 10% | 6.8 51% | 7.7 44% | 13.4 ? 3% | 7.32 ? 47% |
| Idle Maximum * (Watt) | 16.2 | 16.2 -0% | 9.5 41% | 10.5 35% | 14.9 ? 8% | 8.56 ? 47% |
| Load Average * (Watt) | 66 | 65.6 1% | 44 33% | 32 52% | 69.4 ? -5% | 42.5 ? 36% |
| Witcher 3 ultra * (Watt) | 53 | |||||
| Load Maximum * (Watt) | 67.4 | 69.5 -3% | 66.4 1% | 45.4 33% | 82.3 ? -22% | 64.1 ? 5% |
* ... menor é melhor
| Lenovo ThinkPad T15 Gen1-20S7S02U00 i7-10510U, GeForce MX330, 57 Wh | Lenovo ThinkPad T590-20N40009GE i7-8565U, GeForce MX250, 57 Wh | Lenovo ThinkPad E15 20RD0011GE i7-10510U, Radeon RX 640, 45 Wh | HP ProBook 455 G7-175W8EA R7 4700U, Vega 7, 45 Wh | Média da turma Office | |
|---|---|---|---|---|---|
| Duração da bateria | 14% | 31% | 13% | 73% | |
| H.264 (h) | 8.1 | 10.4 28% | 6.7 -17% | 15 ? 85% | |
| WiFi v1.3 (h) | 7.1 | 6.1 -14% | 7.5 6% | 7.6 7% | 12.9 ? 82% |
| Load (h) | 1.2 | 1.7 42% | 1.9 58% | 1.8 50% | 1.807 ? 51% |
Pro
Contra

O Lenovo ThinkPad T15 Gen 1 é o único ThinkPad da geração 2020 que não pode ser equipado com a CPU da série Ryzen 4000 da AMD. Consequentemente, estamos tendo dificuldades para recomendar este modelo em particular, considerando que o ThinkPad E15 e o ThinkPad L15 com AMD Renoir mais acessíveis têm um desempenho muito melhor.
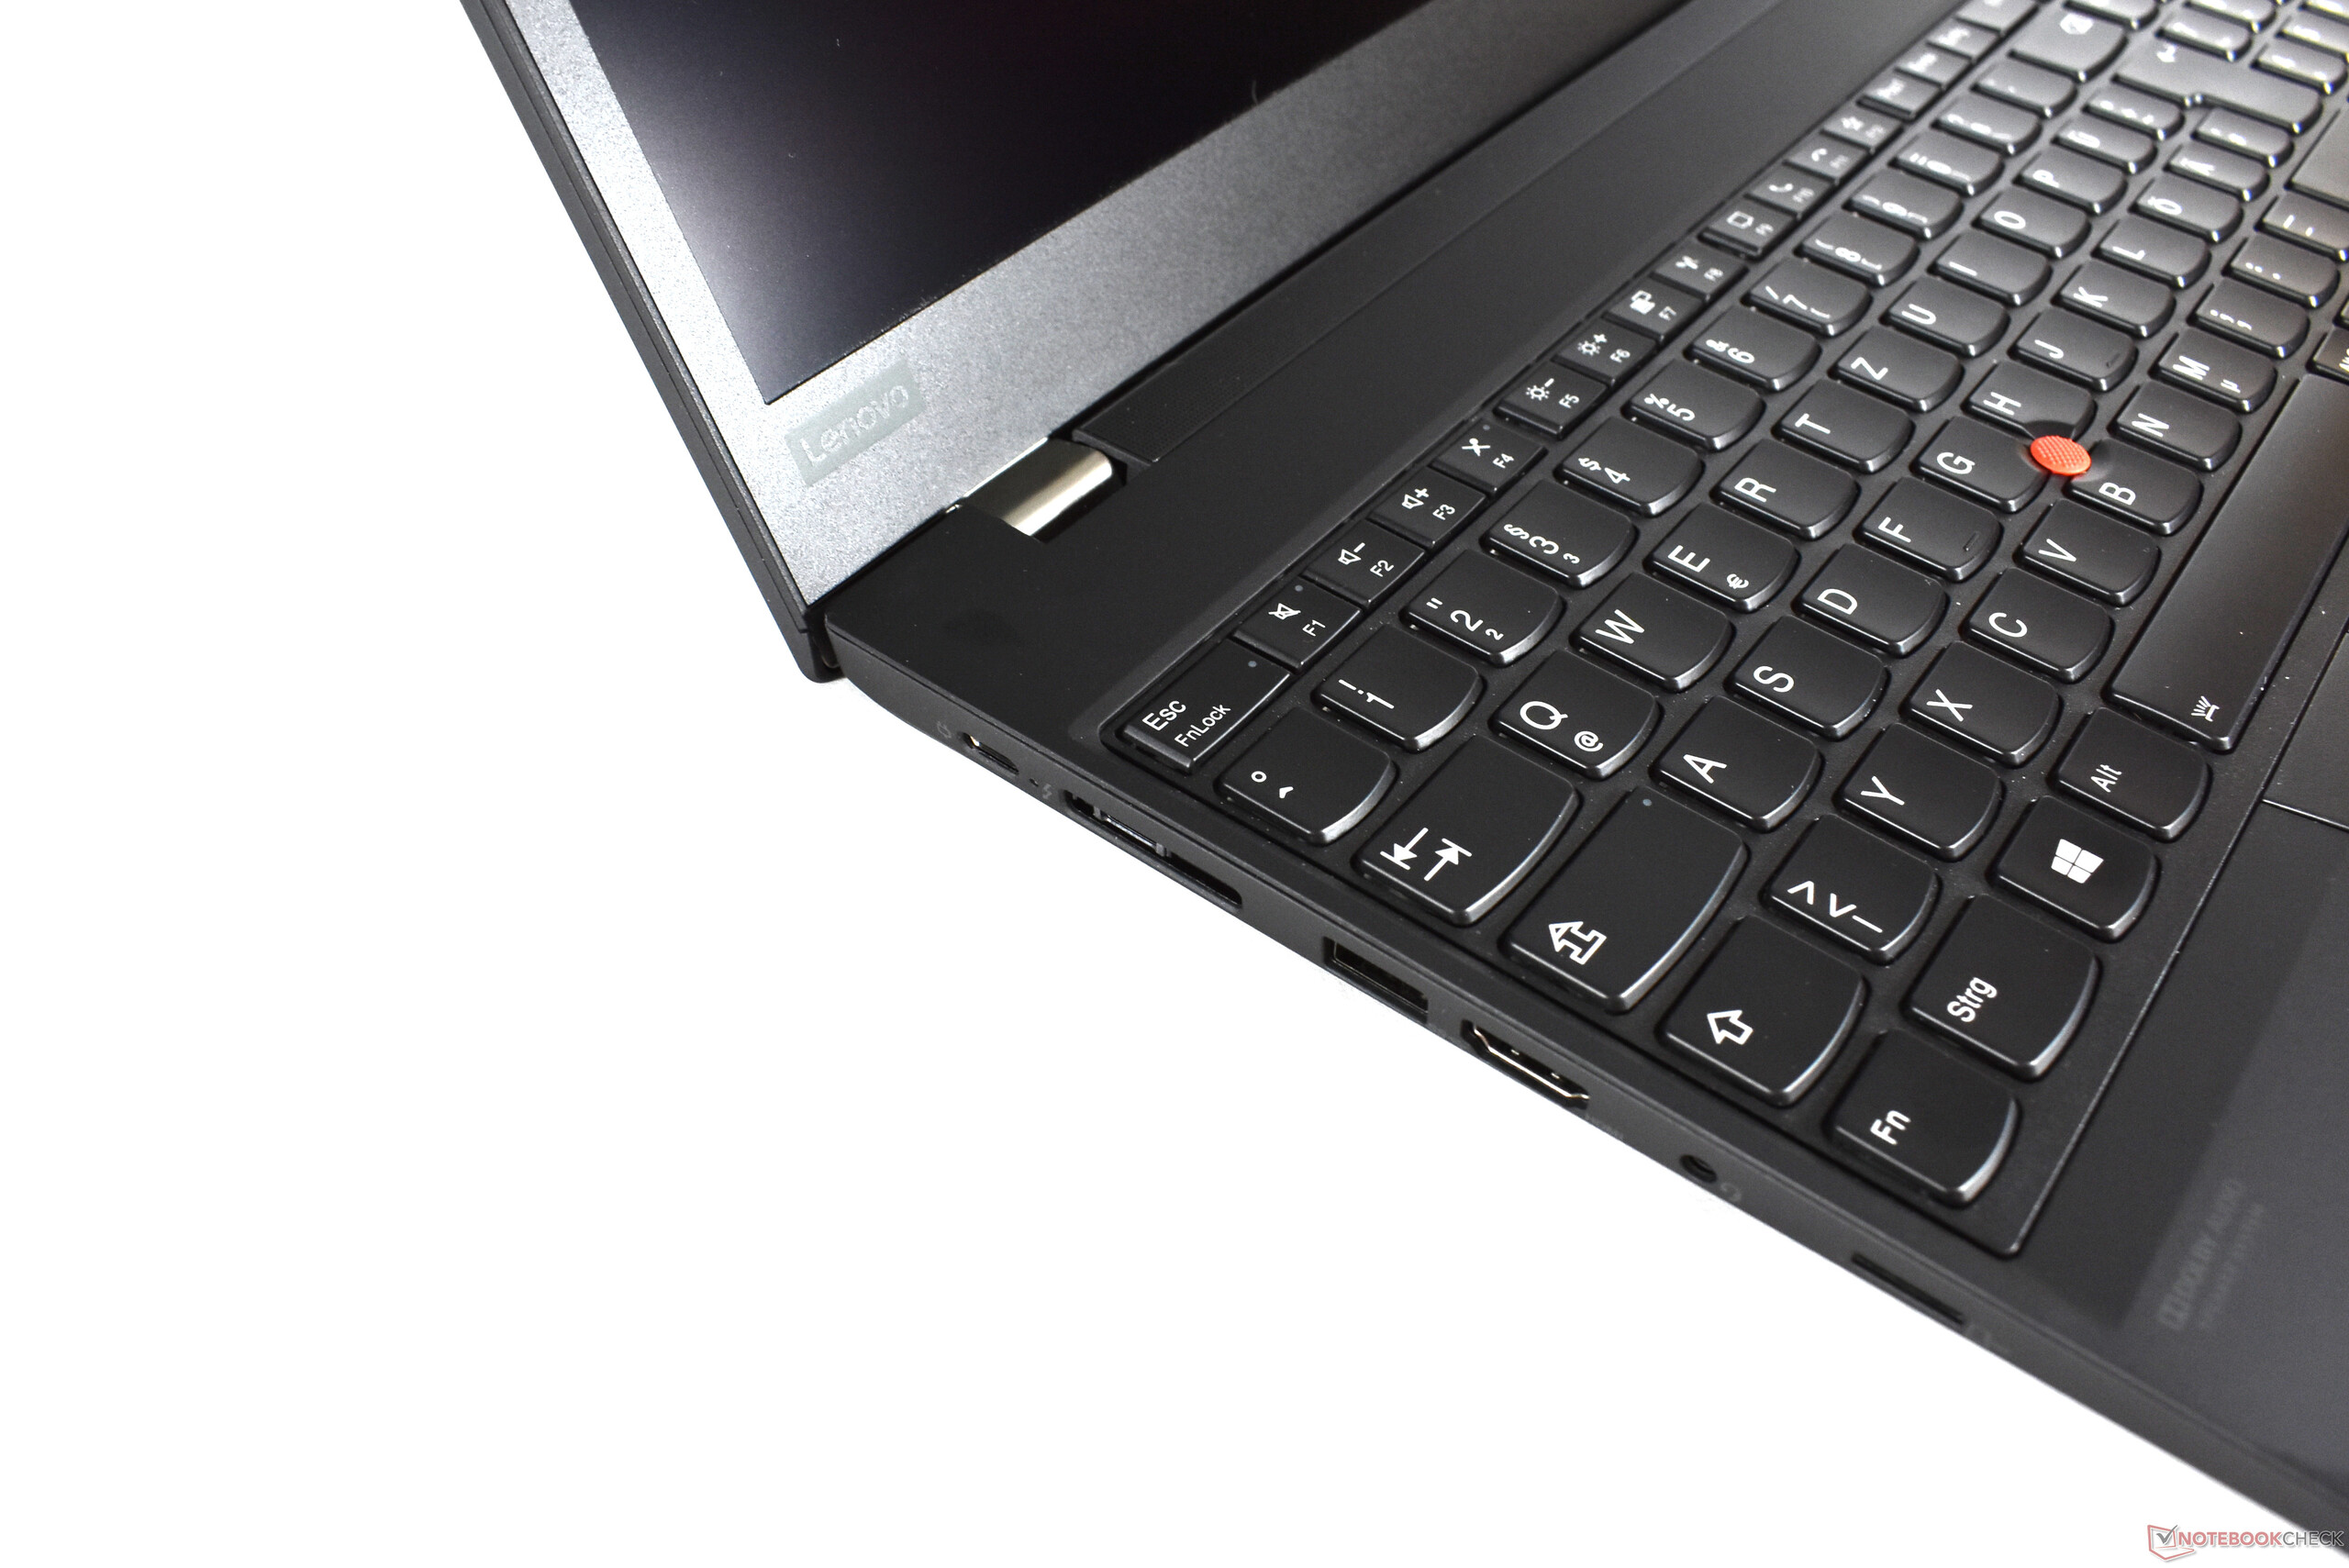
É verdade que o ThinkPad T15 possui excelentes dispositivos de entrada e uma grande variedade de portas, mas seus irmãos mais acessíveis também. Exceto, é claro, o Thunderbolt 3, que não está disponível nesses modelos. Outro recurso exclusivo do T15 é a tela 4K/UHD, um painel de alta qualidade em quase todos os aspectos.
Sua única desvantagem, se você preferir, é seu alto consumo de energia, resultando em uma duração abaixo da média da bateria. Além disso, as temperaturas eram razoavelmente altas nesse SKU em particular, mas, em compensação o ventilador foi muito silencioso. O suporte para Wi-Fi 6 é frustrado pelas altas latências do DPC. Caso contrário, os pontos fortes e fracos do T15 são idênticos aos do ThinkPad T590.
O Lenovo ThinkPad T15 Gen 1 está um pouco perdido no espaço indefinido entre a relação preço-desempenho e qualidade. A falta de uma opção AMD fará desta uma alternativa muito menos desejável.
Por si só, o T15, sem dúvida é um ótimo portátil empresarial. No entanto, portáteis mais acessíveis, equipados com o Ryzen 4000, oferecerão um nível de desempenho muito mais alto. Se você insistir em um painel 4K/UHD e Thunderbolt 3, poderá querer dar uma olhada no Lenovo ThinkPad X1 Extreme Gen 2.
Lenovo ThinkPad T15 Gen1-20S7S02U00
- 07/16/2020 v7 (old)
Benjamin Herzig
Price comparison
