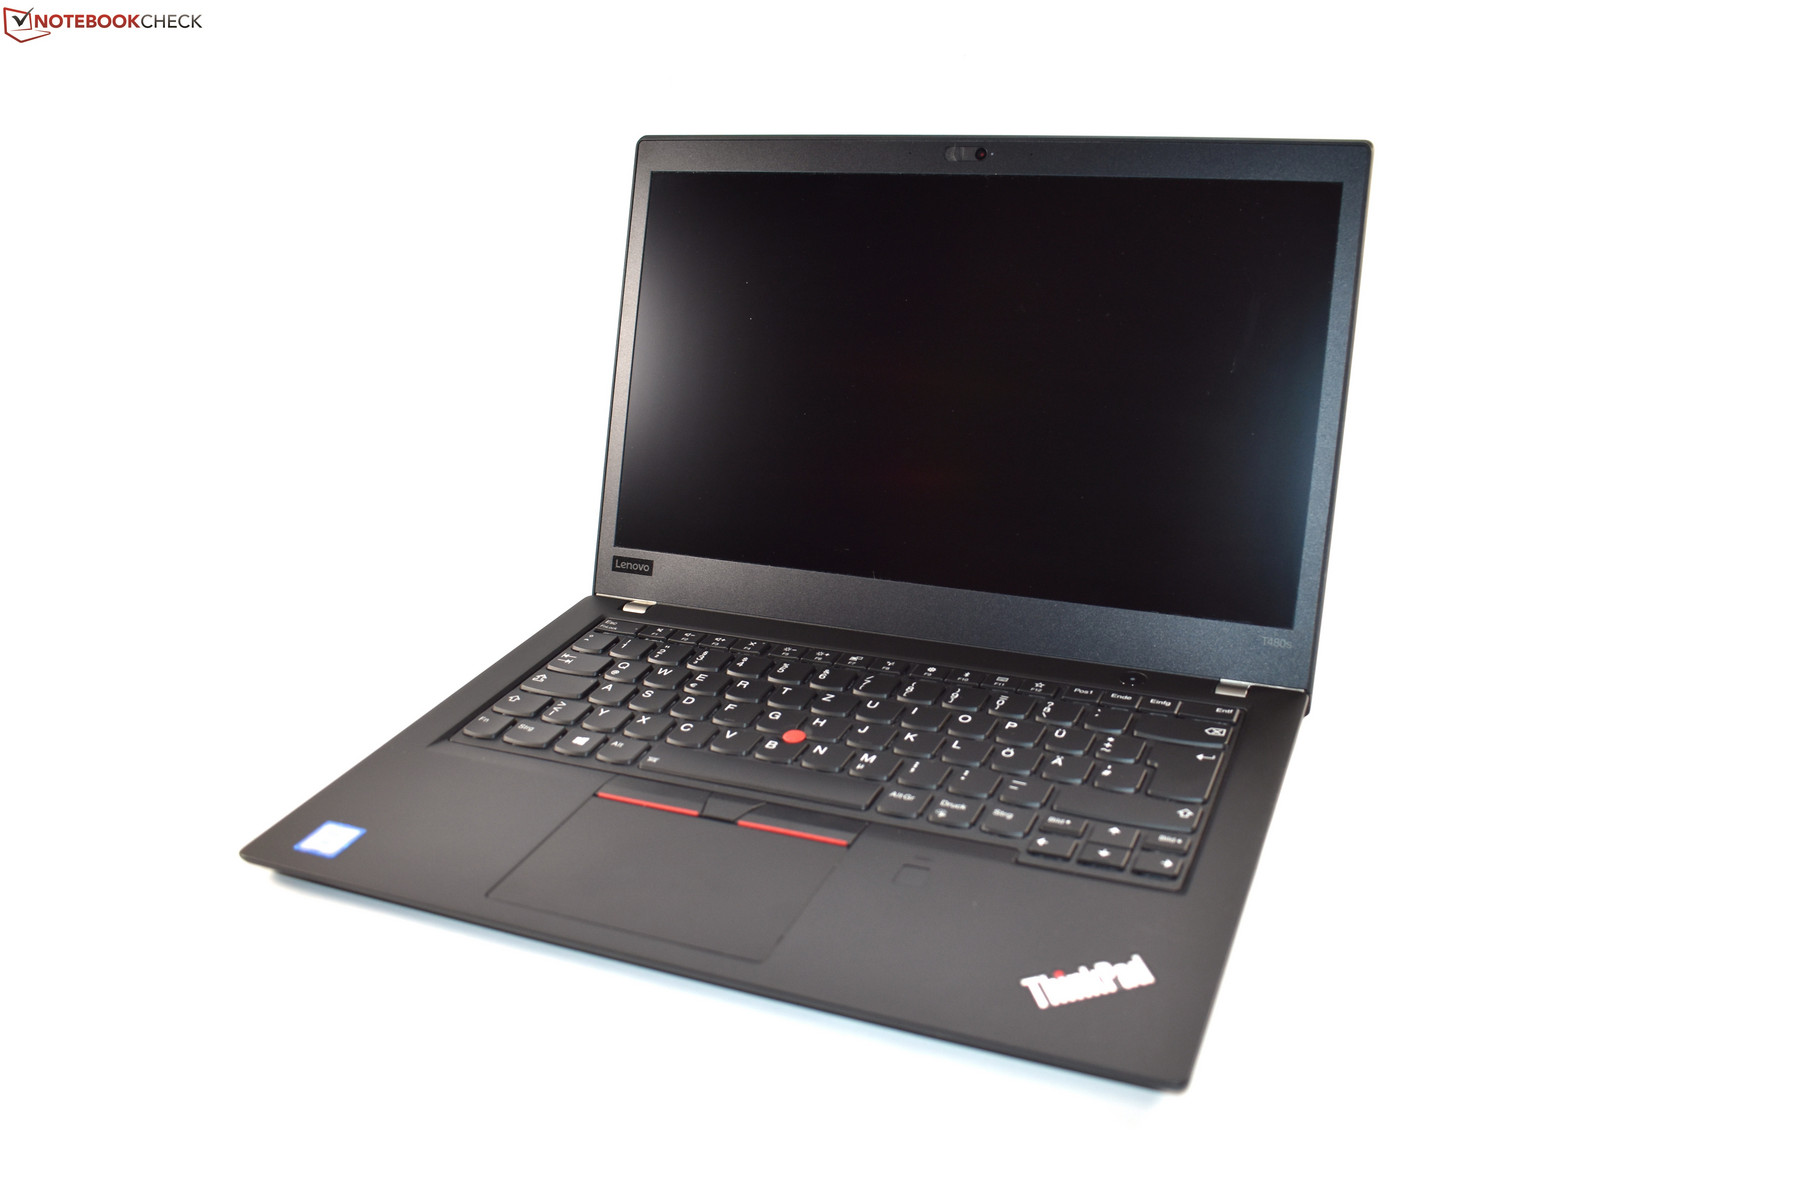
Breve Análise do Portátil Lenovo ThinkPad T480s (i7-8550U, MX150 Max-Q)

| SD Card Reader | |
| average JPG Copy Test (av. of 3 runs) | |
| Lenovo ThinkPad X1 Carbon 2018-20KGS03900 (Toshiba Exceria Pro M501) | |
| Lenovo ThinkPad T470s-20HGS00V00 (Toshiba Exceria Pro SDXC 64 GB UHS-II) | |
| Dell Latitude 7480 (Toshiba (Exceria Pro SDXC UHS-II 64 GB) | |
| Lenovo ThinkPad T480s-20L8S02E00 (Toshiba Exceria Pro SDXC 64 GB UHS-II) | |
| Média da turma Office (19.8 - 198.5, n=22, últimos 2 anos) | |
| maximum AS SSD Seq Read Test (1GB) | |
| Lenovo ThinkPad X1 Carbon 2018-20KGS03900 (Toshiba Exceria Pro M501) | |
| Dell Latitude 7480 (Toshiba (Exceria Pro SDXC UHS-II 64 GB) | |
| Lenovo ThinkPad T470s-20HGS00V00 (Toshiba Exceria Pro SDXC 64 GB UHS-II) | |
| Lenovo ThinkPad T480s-20L8S02E00 (Toshiba Exceria Pro SDXC 64 GB UHS-II) | |
| Média da turma Office (27.4 - 249, n=21, últimos 2 anos) | |
| |||||||||||||||||||||||||
iluminação: 91 %
iluminação com acumulador: 313 cd/m²
Contraste: 864:1 (Preto: 0.36 cd/m²)
ΔE ColorChecker Calman: 3 | ∀{0.5-29.43 Ø4.71}
calibrated: 1.7
ΔE Greyscale Calman: 4 | ∀{0.09-98 Ø4.96}
96.7% sRGB (Argyll 1.6.3 3D)
66.7% AdobeRGB 1998 (Argyll 1.6.3 3D)
72.1% AdobeRGB 1998 (Argyll 3D)
96.6% sRGB (Argyll 3D)
71.4% Display P3 (Argyll 3D)
Gamma: 2.17
CCT: 6961 K
| Lenovo ThinkPad T480s-20L8S02E00 LP140QH2-SPB1, , 2560x1440, 14" | Lenovo ThinkPad T480s-20L8S02D00 LP140QH2-SPB1, , 2560x1440, 14" | Lenovo ThinkPad T470s-20HGS00V00 B140QAN01.5, , 2560x1440, 14" | Lenovo ThinkPad X1 Carbon 2018-20KGS03900 B140QAN02.0, , 2560x1440, 14" | HP EliteBook 840 G4-Z2V22ES ABD AUO133D, , 1920x1080, 14" | Dell Latitude 7480 LG Philips LGD0557, , 1920x1080, 14" | |
|---|---|---|---|---|---|---|
| Display | 2% | -3% | 22% | -5% | -7% | |
| Display P3 Coverage (%) | 71.4 | 72.8 2% | 69 -3% | 87.7 23% | 67.5 -5% | 65.4 -8% |
| sRGB Coverage (%) | 96.6 | 97.9 1% | 95.1 -2% | 100 4% | 92.5 -4% | 92.3 -4% |
| AdobeRGB 1998 Coverage (%) | 72.1 | 74.1 3% | 69.6 -3% | 99.9 39% | 67.7 -6% | 65.8 -9% |
| Response Times | -4% | -16% | -44% | 12% | -12% | |
| Response Time Grey 50% / Grey 80% * (ms) | 36 ? | 38.4 ? -7% | 46.4 ? -29% | 59.2 ? -64% | 33.6 ? 7% | 40.8 ? -13% |
| Response Time Black / White * (ms) | 28 ? | 28.4 ? -1% | 28.8 ? -3% | 34.4 ? -23% | 23.2 ? 17% | 31.2 ? -11% |
| PWM Frequency (Hz) | ||||||
| Screen | -7% | -25% | 38% | -5% | 6% | |
| Brightness middle (cd/m²) | 311 | 352 13% | 327 5% | 578 86% | 289 -7% | 344 11% |
| Brightness (cd/m²) | 302 | 343 14% | 311 3% | 533 76% | 274 -9% | 321 6% |
| Brightness Distribution (%) | 91 | 91 0% | 88 -3% | 84 -8% | 82 -10% | 85 -7% |
| Black Level * (cd/m²) | 0.36 | 0.46 -28% | 0.25 31% | 0.38 -6% | 0.17 53% | 0.32 11% |
| Contrast (:1) | 864 | 765 -11% | 1308 51% | 1521 76% | 1700 97% | 1075 24% |
| Colorchecker dE 2000 * | 3 | 3.3 -10% | 6.1 -103% | 1.9 37% | 4.7 -57% | 2.6 13% |
| Colorchecker dE 2000 max. * | 6.1 | 7.3 -20% | 12.2 -100% | 3.8 38% | 8.6 -41% | 7.8 -28% |
| Colorchecker dE 2000 calibrated * | 1.7 | 0.8 53% | ||||
| Greyscale dE 2000 * | 4 | 5.3 -33% | 8.8 -120% | 3 25% | 6.4 -60% | 2.6 35% |
| Gamma | 2.17 101% | 2.22 99% | 2.18 101% | 2.14 103% | 2.22 99% | 2.28 96% |
| CCT | 6961 93% | 6452 101% | 6172 105% | 6377 102% | 6454 101% | 7050 92% |
| Color Space (Percent of AdobeRGB 1998) (%) | 66.7 | 68.4 3% | 61.56 -8% | 88.8 33% | 60.3 -10% | 65.82 -1% |
| Color Space (Percent of sRGB) (%) | 96.7 | 98 1% | 94.88 -2% | 100 3% | 92.3 -5% | 92.27 -5% |
| Média Total (Programa/Configurações) | -3% /
-5% | -15% /
-19% | 5% /
25% | 1% /
-3% | -4% /
1% |
* ... menor é melhor
Exibir tempos de resposta
| ↔ Tempo de resposta preto para branco | ||
|---|---|---|
| 28 ms ... ascensão ↗ e queda ↘ combinadas | ↗ 15.6 ms ascensão | 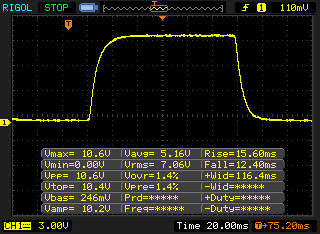 |
| ↘ 12.4 ms queda | ||
| A tela mostra taxas de resposta relativamente lentas em nossos testes e pode ser muito lenta para os jogadores. Em comparação, todos os dispositivos testados variam de 0.1 (mínimo) a 240 (máximo) ms. » 71 % de todos os dispositivos são melhores. Isso significa que o tempo de resposta medido é pior que a média de todos os dispositivos testados (19.8 ms). | ||
| ↔ Tempo de resposta 50% cinza a 80% cinza | ||
| 36 ms ... ascensão ↗ e queda ↘ combinadas | ↗ 17.6 ms ascensão | 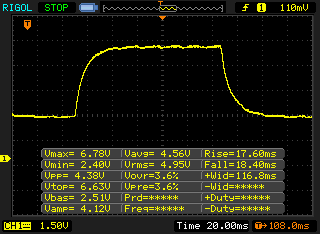 |
| ↘ 18.4 ms queda | ||
| A tela mostra taxas de resposta lentas em nossos testes e será insatisfatória para os jogadores. Em comparação, todos os dispositivos testados variam de 0.165 (mínimo) a 636 (máximo) ms. » 51 % de todos os dispositivos são melhores. Isso significa que o tempo de resposta medido é pior que a média de todos os dispositivos testados (31 ms). | ||
Cintilação da tela / PWM (modulação por largura de pulso)
| Tela tremeluzindo / PWM não detectado | 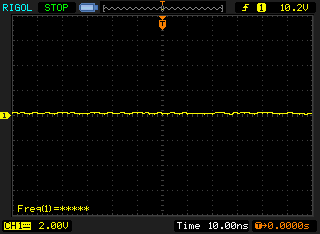 | ||
[pwm_comparison] Em comparação: 52 % de todos os dispositivos testados não usam PWM para escurecer a tela. Se PWM foi detectado, uma média de 7757 (mínimo: 5 - máximo: 343500) Hz foi medida. | |||
| PCMark 8 Home Score Accelerated v2 | 3540 pontos | |
| PCMark 8 Work Score Accelerated v2 | 4909 pontos | |
| PCMark 10 Score | 3960 pontos | |
Ajuda | ||
| Lenovo ThinkPad T480s-20L8S02E00 Samsung SSD PM981 MZVLB512HAJQ | Lenovo ThinkPad T470s-20HGS00V00 Samsung SSD PM961 1TB M.2 PCIe 3.0 x4 NVMe (MZVLW1T0) | Lenovo ThinkPad X1 Carbon 2018-20KGS03900 Samsung SSD PM981 MZVLB512HAJQ | Dell Latitude 7480 Intel SSDSCKKF256H6 | Média Samsung SSD PM981 MZVLB512HAJQ | |
|---|---|---|---|---|---|
| CrystalDiskMark 3.0 | -16% | -25% | -64% | -18% | |
| Read Seq (MB/s) | 2588 | 1760 -32% | 2327 -10% | 486.5 -81% | 2002 ? -23% |
| Write Seq (MB/s) | 1858 | 1666 -10% | 1808 -3% | 418.6 -77% | 1656 ? -11% |
| Read 512 (MB/s) | 1799 | 832 -54% | 419.3 -77% | 354.3 -80% | 1213 ? -33% |
| Write 512 (MB/s) | 1863 | 1064 -43% | 1272 -32% | 306.8 -84% | 1641 ? -12% |
| Read 4k (MB/s) | 62.7 | 53.2 -15% | 60.6 -3% | 29.25 -53% | 61.4 ? -2% |
| Write 4k (MB/s) | 146.8 | 167.4 14% | 132.9 -9% | 90.5 -38% | 131.3 ? -11% |
| Read 4k QD32 (MB/s) | 446.6 | 630 41% | 340.7 -24% | 280.2 -37% | 407 ? -9% |
| Write 4k QD32 (MB/s) | 706 | 533 -25% | 439.7 -38% | 252.8 -64% | 402 ? -43% |

| 3DMark 06 Standard Score | 12796 pontos | |
| 3DMark Vantage P Result | 7839 pontos | |
| 3DMark 11 Performance | 3922 pontos | |
| 3DMark Ice Storm Standard Score | 65886 pontos | |
| 3DMark Cloud Gate Standard Score | 12049 pontos | |
| 3DMark Fire Strike Score | 2584 pontos | |
Ajuda | ||
| BioShock Infinite - 1366x768 High Preset | |
| Asus VivoBook Pro 17 N705UD-EH76 | |
| Média NVIDIA GeForce MX150 (59.7 - 98, n=33) | |
| Lenovo ThinkPad T480s-20L8S02E00 | |
| Lenovo ThinkPad E480-20KQS00000 | |
| Lenovo ThinkPad E480-20KQS00000 | |
| Lenovo ThinkPad X280-20KES01S00 | |
| baixo | média | alto | ultra | |
|---|---|---|---|---|
| BioShock Infinite (2013) | 158.3 | 87 | 77 | 28.89 |
| The Witcher 3 (2015) | 53 | 31.47 | 17.06 | |
| Star Wars Battlefront (2015) | 78.4 | 53.8 | 24.5 | 21.4 |
| Rise of the Tomb Raider (2016) | 54.6 | 32.6 | 16.5 | |
| Doom (2016) | 60.5 | 49.6 | 17.1 | |
| Civilization 6 (2016) | 75.5 | 42.87 | 19.47 | |
| Warhammer 40.000: Dawn of War III (2017) | 62.5 | 23.7 | ||
| FIFA 18 (2017) | 133.9 | 83.6 | 78.1 | 73 |
| Call of Duty WWII (2017) | 87.9 | 54.6 | 24.5 | |
| Star Wars Battlefront 2 (2017) | 59.3 | 26.4 | 22.5 | 14.6 |
Barulho
| Ocioso |
| 29 / 29 / 29 dB |
| Carga |
| 36.5 / 38.2 dB |
 | ||
30 dB silencioso 40 dB(A) audível 50 dB(A) ruidosamente alto |
||
min: | ||
(-) A temperatura máxima no lado superior é 49.2 °C / 121 F, em comparação com a média de 34.3 °C / 94 F , variando de 21.2 a 62.5 °C para a classe Office.
(-) A parte inferior aquece até um máximo de 48.2 °C / 119 F, em comparação com a média de 36.8 °C / 98 F
(+) Em uso inativo, a temperatura média para o lado superior é 22.6 °C / 73 F, em comparação com a média do dispositivo de 29.5 °C / ### class_avg_f### F.
(±) Jogando The Witcher 3, a temperatura média para o lado superior é 36.9 °C / 98 F, em comparação com a média do dispositivo de 29.5 °C / ## #class_avg_f### F.
(+) Os apoios para as mãos e o touchpad estão atingindo a temperatura máxima da pele (35.2 °C / 95.4 F) e, portanto, não estão quentes.
(-) A temperatura média da área do apoio para as mãos de dispositivos semelhantes foi 27.5 °C / 81.5 F (-7.7 °C / -13.9 F).
Lenovo ThinkPad T480s-20L8S02E00 análise de áudio
(±) | o volume do alto-falante é médio, mas bom (###valor### dB)
Graves 100 - 315Hz
(-) | quase nenhum baixo - em média 19.4% menor que a mediana
(±) | a linearidade dos graves é média (12.1% delta para a frequência anterior)
Médios 400 - 2.000 Hz
(±) | médios mais altos - em média 6.5% maior que a mediana
(±) | a linearidade dos médios é média (9.6% delta para frequência anterior)
Altos 2 - 16 kHz
(+) | agudos equilibrados - apenas 3.5% longe da mediana
(±) | a linearidade dos máximos é média (7.6% delta para frequência anterior)
Geral 100 - 16.000 Hz
(±) | a linearidade do som geral é média (22.1% diferença em relação à mediana)
Comparado com a mesma classe
» 58% de todos os dispositivos testados nesta classe foram melhores, 8% semelhantes, 34% piores
» O melhor teve um delta de 7%, a média foi 21%, o pior foi 53%
Comparado com todos os dispositivos testados
» 64% de todos os dispositivos testados foram melhores, 6% semelhantes, 30% piores
» O melhor teve um delta de 4%, a média foi 23%, o pior foi 134%
Dell Latitude 7480 análise de áudio
(±) | o volume do alto-falante é médio, mas bom (###valor### dB)
Graves 100 - 315Hz
(±) | graves reduzidos - em média 11.9% menor que a mediana
(±) | a linearidade dos graves é média (10.6% delta para a frequência anterior)
Médios 400 - 2.000 Hz
(+) | médios equilibrados - apenas 3.8% longe da mediana
(±) | a linearidade dos médios é média (7.8% delta para frequência anterior)
Altos 2 - 16 kHz
(±) | máximos mais altos - em média 6.6% maior que a mediana
(+) | os máximos são lineares (6.3% delta da frequência anterior)
Geral 100 - 16.000 Hz
(±) | a linearidade do som geral é média (23.2% diferença em relação à mediana)
Comparado com a mesma classe
» 65% de todos os dispositivos testados nesta classe foram melhores, 8% semelhantes, 27% piores
» O melhor teve um delta de 7%, a média foi 21%, o pior foi 53%
Comparado com todos os dispositivos testados
» 70% de todos os dispositivos testados foram melhores, 5% semelhantes, 25% piores
» O melhor teve um delta de 4%, a média foi 23%, o pior foi 134%
Lenovo ThinkPad X1 Carbon 2018-20KGS03900 análise de áudio
(+) | os alto-falantes podem tocar relativamente alto (###valor### dB)
Graves 100 - 315Hz
(-) | quase nenhum baixo - em média 25.9% menor que a mediana
(±) | a linearidade dos graves é média (9.8% delta para a frequência anterior)
Médios 400 - 2.000 Hz
(+) | médios equilibrados - apenas 3.8% longe da mediana
(±) | a linearidade dos médios é média (9% delta para frequência anterior)
Altos 2 - 16 kHz
(+) | agudos equilibrados - apenas 2.1% longe da mediana
(+) | os máximos são lineares (4% delta da frequência anterior)
Geral 100 - 16.000 Hz
(±) | a linearidade do som geral é média (18.7% diferença em relação à mediana)
Comparado com a mesma classe
» 35% de todos os dispositivos testados nesta classe foram melhores, 6% semelhantes, 59% piores
» O melhor teve um delta de 7%, a média foi 21%, o pior foi 53%
Comparado com todos os dispositivos testados
» 43% de todos os dispositivos testados foram melhores, 8% semelhantes, 49% piores
» O melhor teve um delta de 4%, a média foi 23%, o pior foi 134%
| desligado | |
| Ocioso | |
| Carga |
|
Key:
min: | |
| Lenovo ThinkPad T480s-20L8S02E00 i5-8550U, GeForce MX150, Samsung SSD PM981 MZVLB512HAJQ, IPS LED, 2560x1440, 14" | Lenovo ThinkPad T480s-20L8S02D00 i5-8250U, UHD Graphics 620, Samsung SSD PM981 MZVLB512HAJQ, IPS, 2560x1440, 14" | Lenovo ThinkPad T470s-20HGS00V00 i7-7600U, HD Graphics 620, Samsung SSD PM961 1TB M.2 PCIe 3.0 x4 NVMe (MZVLW1T0), IPS, 2560x1440, 14" | Lenovo ThinkPad X1 Carbon 2018-20KGS03900 i5-8550U, UHD Graphics 620, Samsung SSD PM981 MZVLB512HAJQ, IPS, 2560x1440, 14" | Dell Latitude 7480 i7-7600U, HD Graphics 620, Intel SSDSCKKF256H6, IPS, 1920x1080, 14" | |
|---|---|---|---|---|---|
| Power Consumption | 8% | 4% | -0% | 26% | |
| Idle Minimum * (Watt) | 3.4 | 3.1 9% | 4.64 -36% | 3.8 -12% | 4.32 -27% |
| Idle Average * (Watt) | 7.5 | 6.8 9% | 8.93 -19% | 8.9 -19% | 6.27 16% |
| Idle Maximum * (Watt) | 10.8 | 10.1 6% | 9.12 16% | 11.9 -10% | 6.35 41% |
| Load Average * (Watt) | 55.4 | 48.4 13% | 42.2 24% | 47.5 14% | 29.82 46% |
| Witcher 3 ultra * (Watt) | 34 | ||||
| Load Maximum * (Watt) | 70.3 | 67.1 5% | 47.3 33% | 52.5 25% | 30.64 56% |
* ... menor é melhor
| Lenovo ThinkPad T480s-20L8S02E00 i5-8550U, GeForce MX150, 57 Wh | Lenovo ThinkPad T480s-20L8S02D00 i5-8250U, UHD Graphics 620, 57 Wh | Lenovo ThinkPad T470s-20HGS00V00 i7-7600U, HD Graphics 620, 51 Wh | Lenovo ThinkPad X1 Carbon 2018-20KGS03900 i5-8550U, UHD Graphics 620, 57 Wh | HP EliteBook 840 G4-Z2V22ES ABD i5-7200U, HD Graphics 620, 51 Wh | Dell Latitude 7480 i7-7600U, HD Graphics 620, 60 Wh | Média da turma Office | |
|---|---|---|---|---|---|---|---|
| Duração da bateria | 31% | -14% | 9% | 9% | 60% | 41% | |
| Reader / Idle (h) | 22.8 | 13.1 -43% | 22.1 -3% | 27.7 21% | 24.5 ? 7% | ||
| H.264 (h) | 9.2 | 12 30% | 7.6 -17% | 9.4 2% | 15.5 ? 68% | ||
| WiFi v1.3 (h) | 8.8 | 9 2% | 7 -20% | 8.7 -1% | 9.6 9% | 12 36% | 13.2 ? 50% |
| Load (h) | 1.3 | 2.1 62% | 1.6 23% | 1.8 38% | 2.9 123% | 1.808 ? 39% |
Pro
Contra
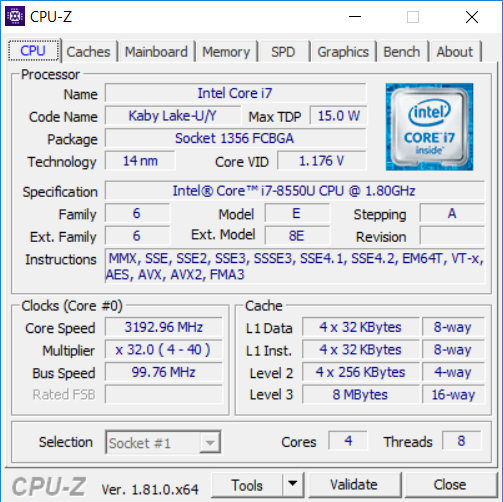
O desempenho da CPU, por exemplo, é excelente com o i7, mas o teste mostra que o limite do desempenho foi alcançado com este sistema de resfriamento – isto provoca que o i7, supostamente mais rápido, seja mais lento sob uso intenso contínuo que o i5 dentro do T480s mais barato. Além disso, como com o ThinkPad X280 menor, o desempenho imaturo do gerenciador da CPU faz com que o processador fique adormecido durante o teste de estresse. Outra similaridade com o X ThinkPad: A CPU é afogada no modo bateria. Sua crítica adicional é compartilhada com o T480s testado anteriormente: a temperatura no exterior é comparativamente alta (embora o MX150 não aumente ainda mais), os alto-falantes são ruins e a tampa da câmera ThinkShutter não está disponível em combinação com a câmera infravermelha para Windows Hello.
A Lenovo a quase conseguiu marcar todas as caixas de verificação com o T480s. Os pontos positivos superam por muito os negativos, motivo pelo qual também recomendamos o T480s com MX150.
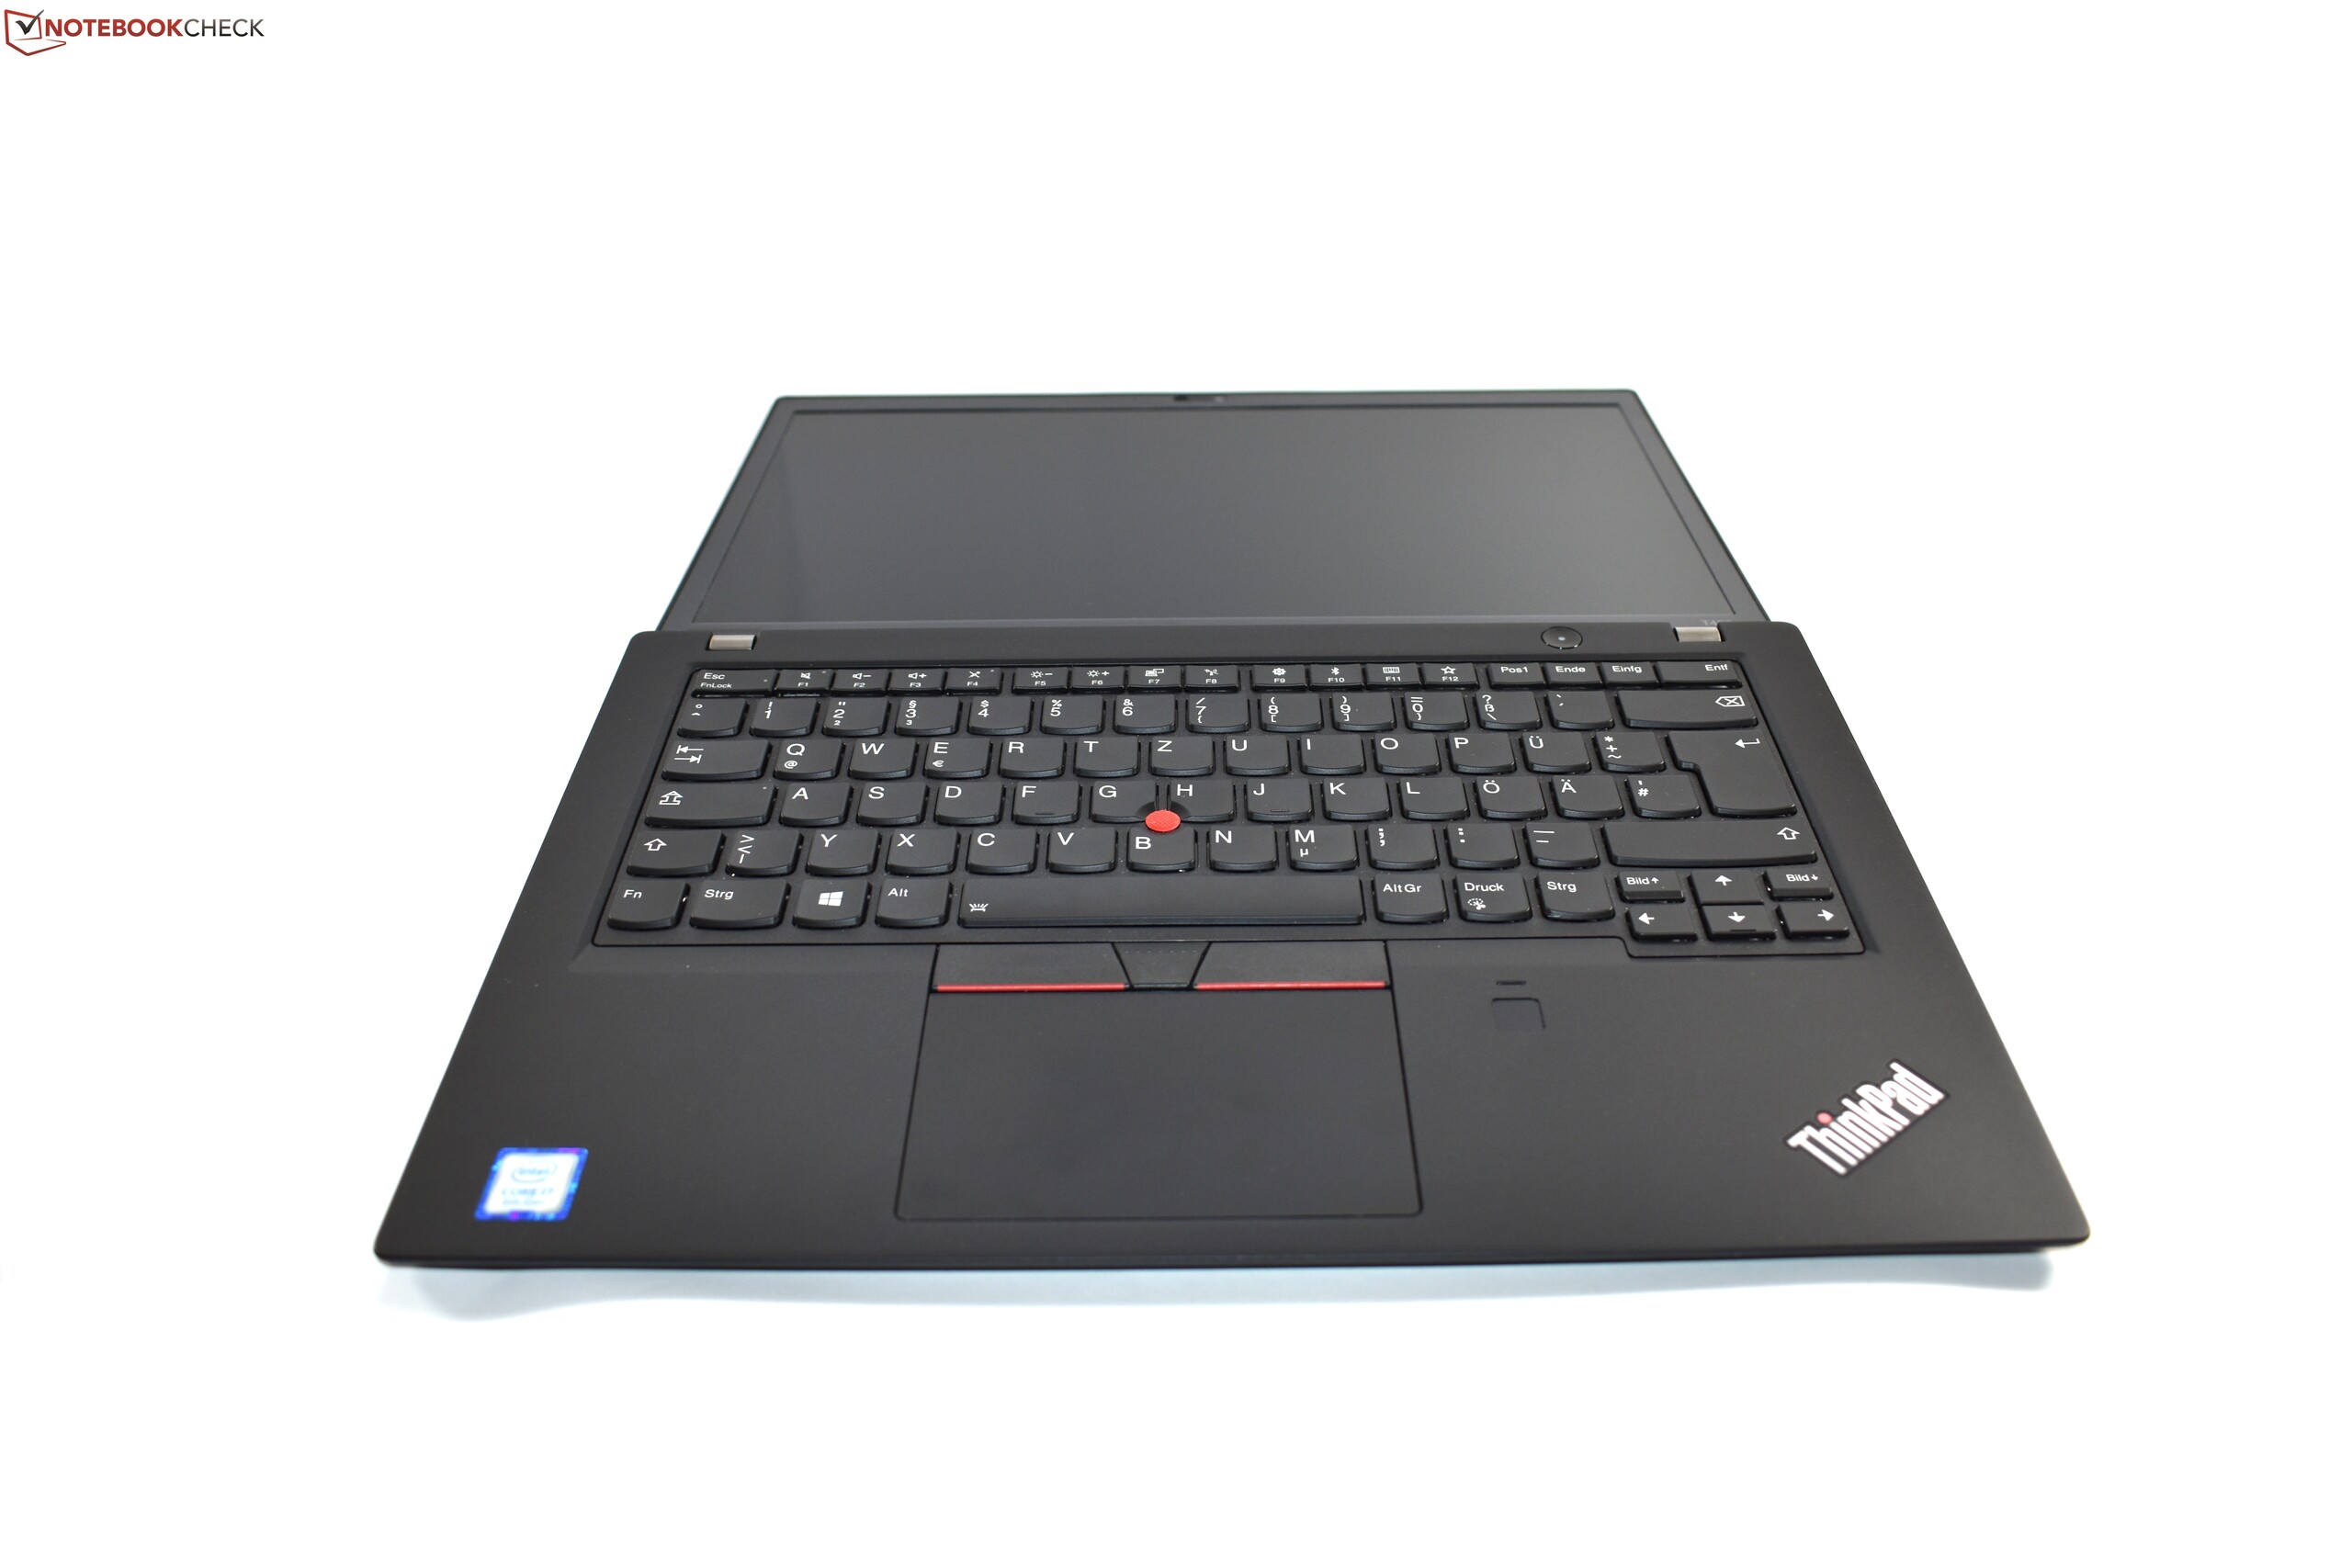
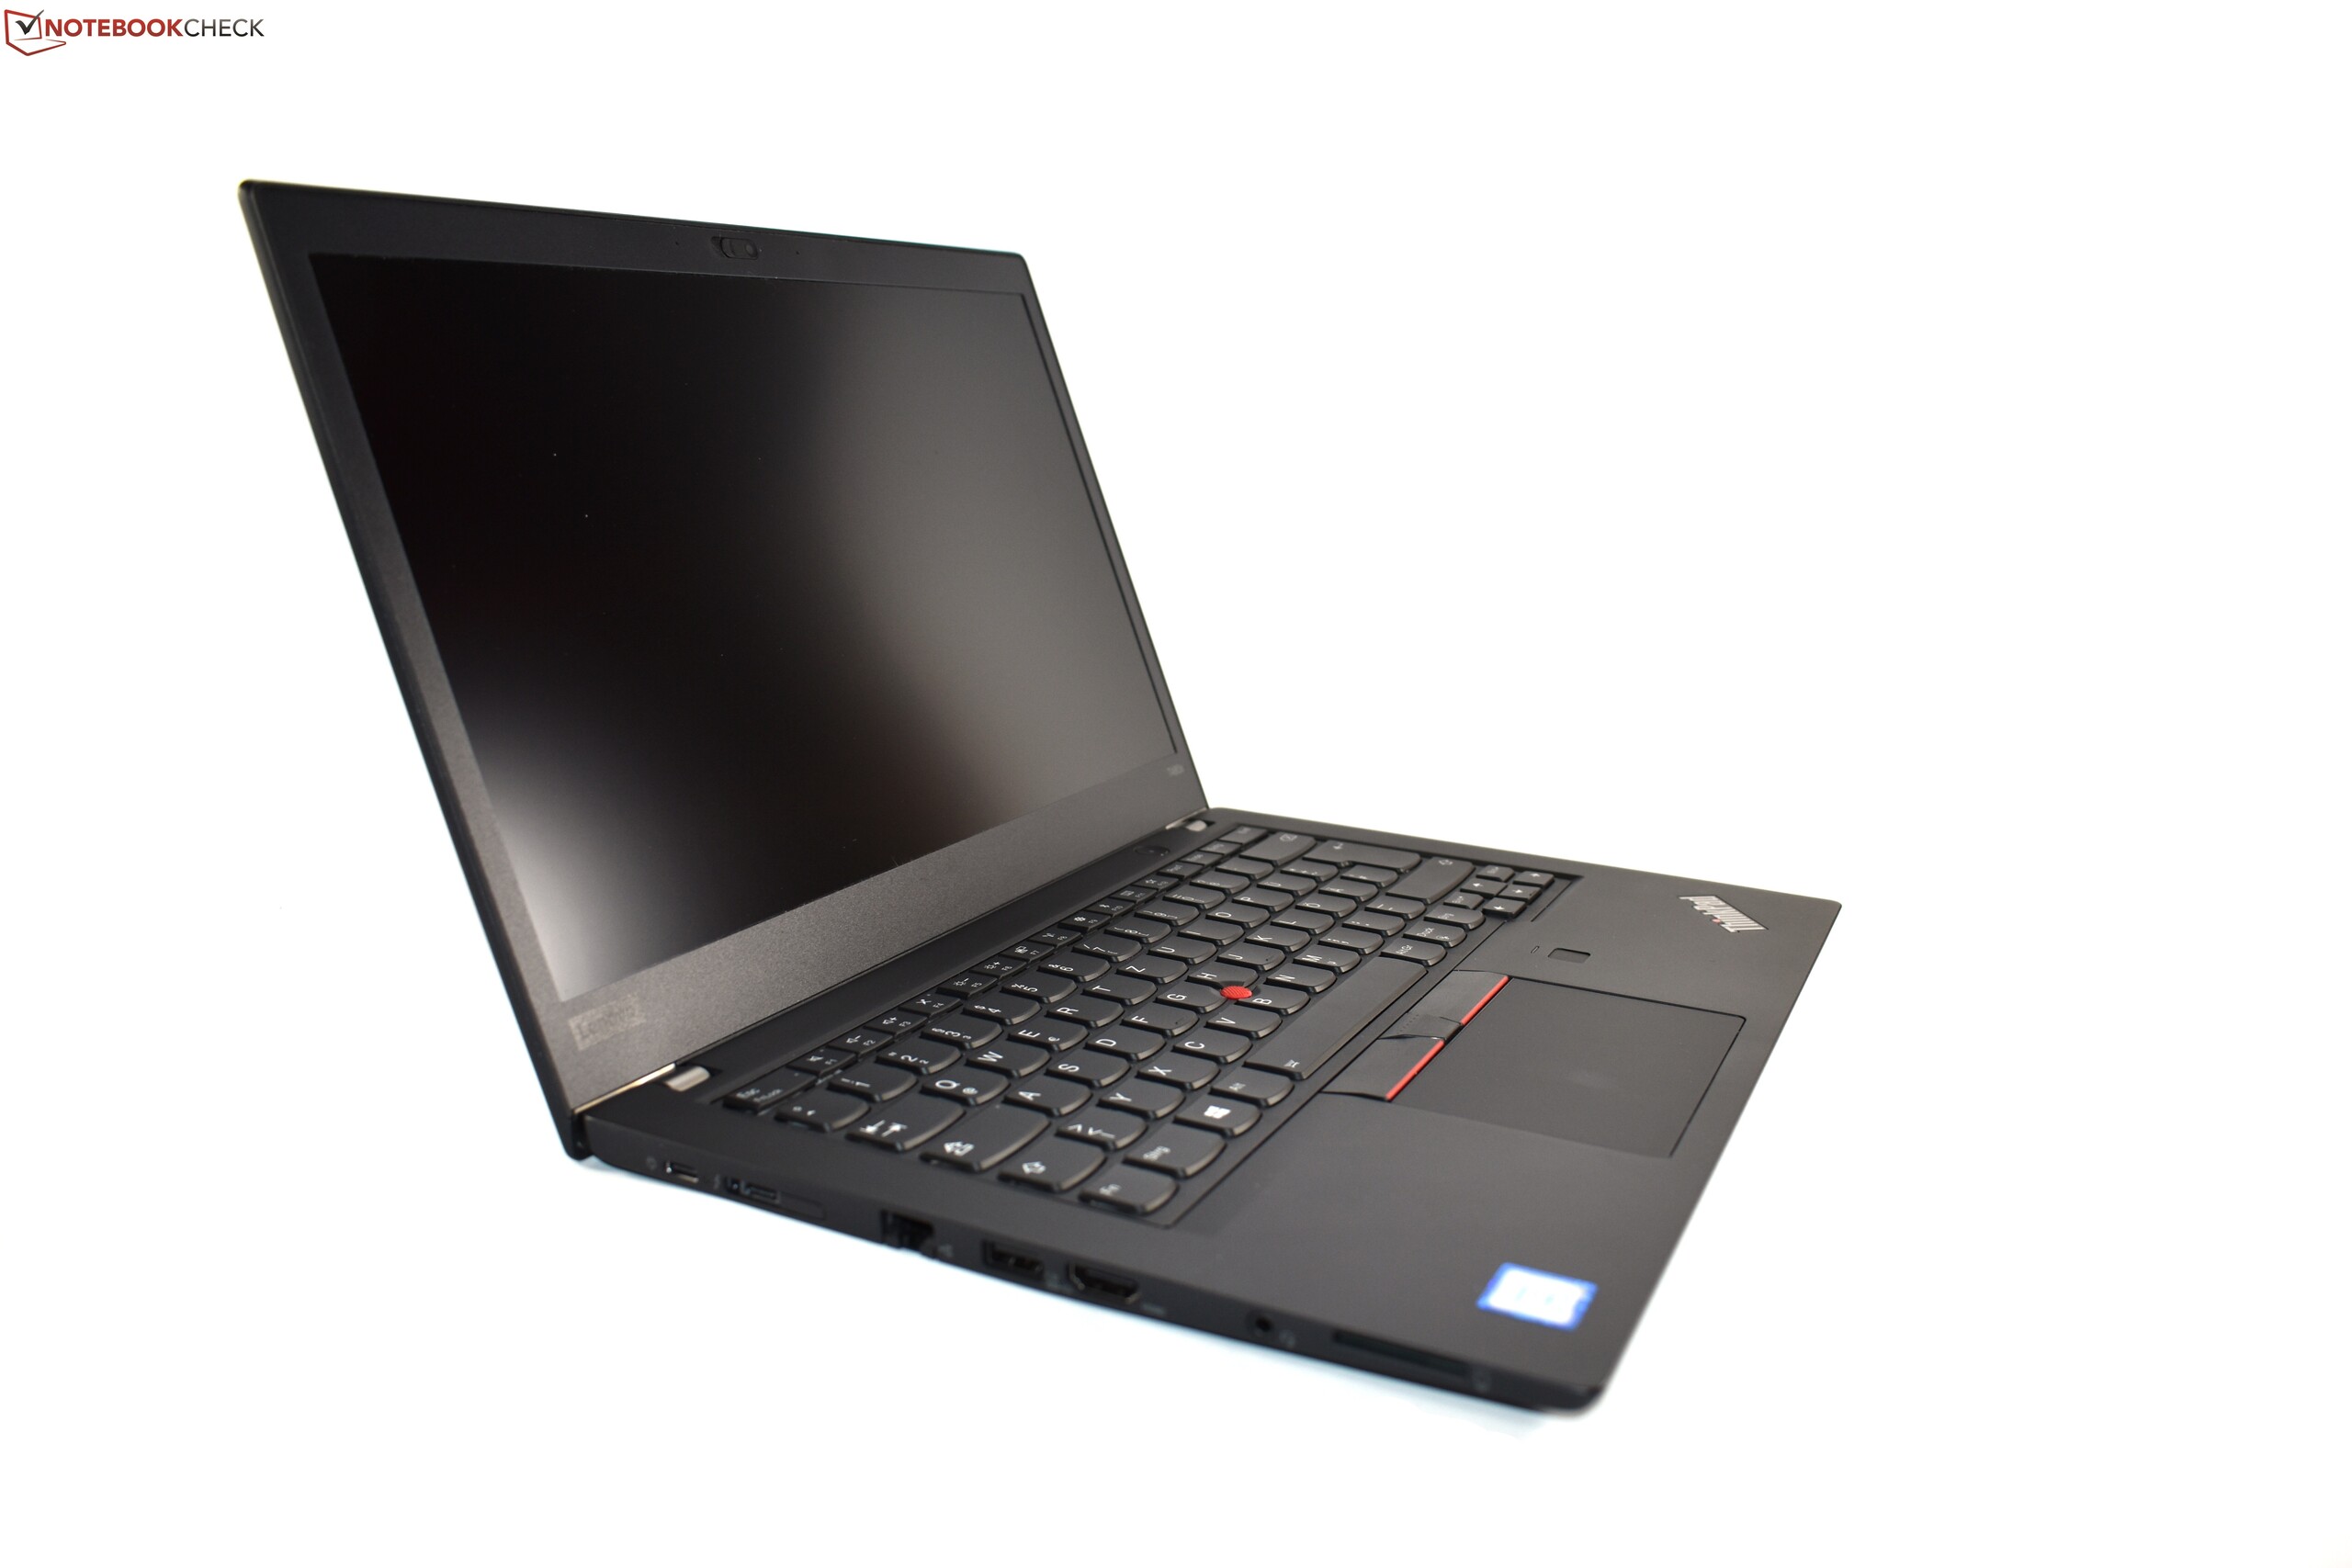
Esta é uma crítica válida, embora seja confrontada com uma longa lista de pontos positivos do T480s, como os seus confortáveis dispositivos de entrada, o chassis premium, a boa selecção de portas, a boa duração da bateria e a tela IPS WQHD mate, brilhante e precisa. Com tudo isso em mente, podemos recomendar de todo o coração o T480s com MX150.
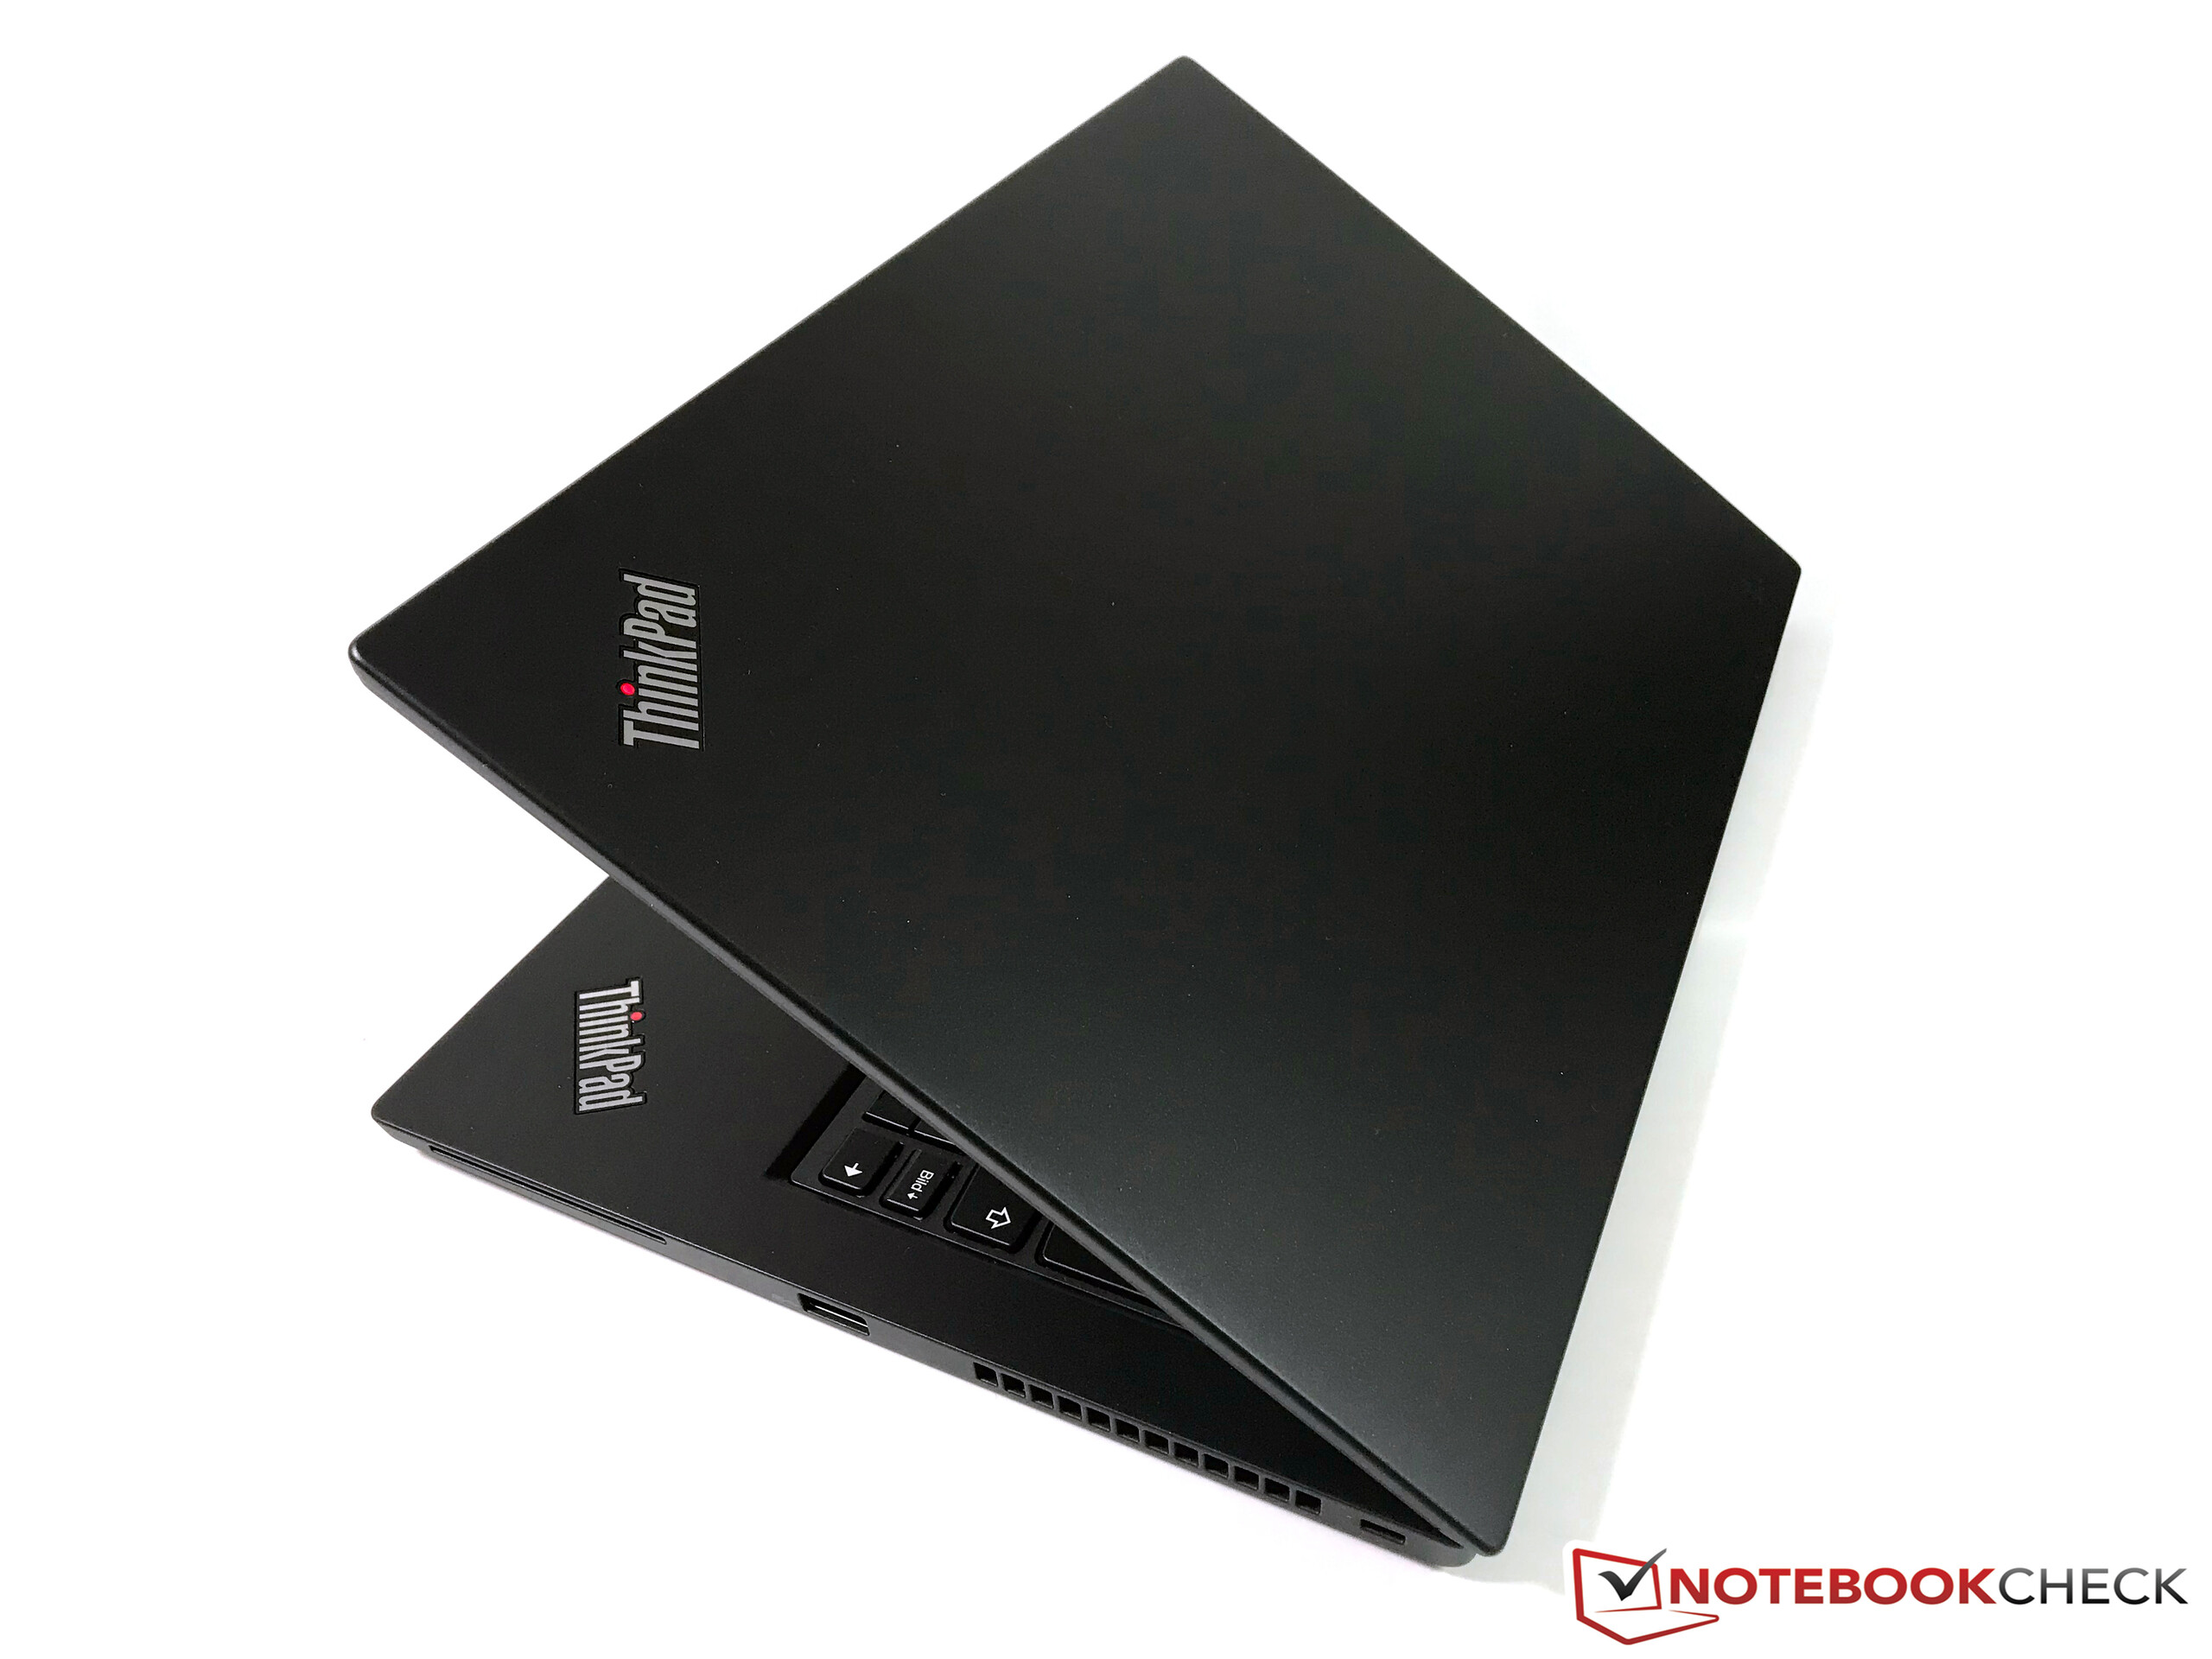
Seus principais concorrentes são o Dell Latitude 7490, o HP EliteBook 840 G5 e o ThinkPad X1 Carbon 2018 mais caro como concorrente interno – vamos testar o Latitude e o EliteBook no futuro próximo também. Todos os três vêm com suas próprias vantagens em comparação com o T480s, o Latitude poderia, por exemplo, oferecer uma duração de bateria mais longa com sua tela IPS de baixa potência, enquanto o EliteBook tem opções de tela significativamente mais brilhantes. O X1 Carbon, por outro lado, é consideravelmente mais leve e compacto e vem com uma opção de tela HDR. Dito isso, o T480s realmente não precisa se esconder de seus concorrentes, a Lenovo criou um ótimo mix de recursos.
Atualização 24.03.2018: A nova versão do Bios 1.11 resolve o adormecimento do prcecessador.
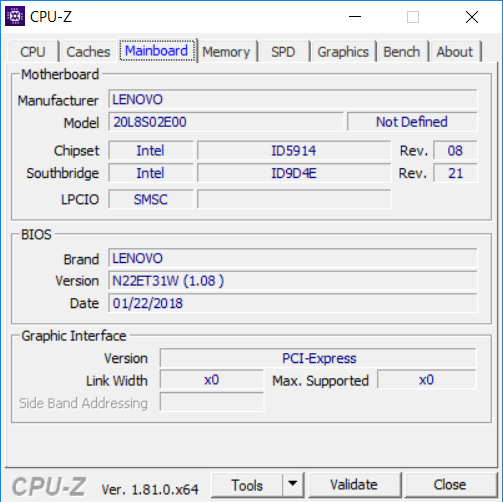
Lenovo ThinkPad T480s-20L8S02E00
- 03/19/2018 v6 (old)
Benjamin Herzig