Breve Análise do Portátil Dell Latitude 13 7380 (i7-7600U, FHD)

| SD Card Reader | |
| average JPG Copy Test (av. of 3 runs) | |
| Dell Latitude 13 7380 | |
| HP EliteBook 840 G4-Z2V49ET ABD | |
| Lenovo ThinkPad X1 Carbon 2017-20HR0021GE | |
| Toshiba Portege X30-D (PT274U-01N001) | |
| Lenovo ThinkPad 13-20J2S00G00 | |
| maximum AS SSD Seq Read Test (1GB) | |
| Toshiba Portege X30-D (PT274U-01N001) | |
| Dell Latitude 13 7380 | |
| Lenovo ThinkPad X1 Carbon 2017-20HR0021GE | |
| HP EliteBook 840 G4-Z2V49ET ABD | |
| Lenovo ThinkPad 13-20J2S00G00 | |
| |||||||||||||||||||||||||
iluminação: 87 %
iluminação com acumulador: 317 cd/m²
Contraste: 1057:1 (Preto: 0.3 cd/m²)
ΔE ColorChecker Calman: 6.3 | ∀{0.5-29.43 Ø4.71}
ΔE Greyscale Calman: 7.8 | ∀{0.09-98 Ø4.96}
92% sRGB (Argyll 1.6.3 3D)
61% AdobeRGB 1998 (Argyll 1.6.3 3D)
65.8% AdobeRGB 1998 (Argyll 3D)
91.8% sRGB (Argyll 3D)
65.5% Display P3 (Argyll 3D)
Gamma: 1.81
CCT: 7120 K
| Dell Latitude 13 7380 LGD0589, IPS, 13.3", 1920x1080 | Toshiba Portege X30-D (PT274U-01N001) Toshiba TOS508F, IPS, 13.3", 1920x1080 | Lenovo ThinkPad 13-20J2S00G00 LP133WF2-SPL78, IPS, LED, 13.3", 1920x1080 | Lenovo ThinkPad X1 Carbon 2017-20HR0021GE B140HAN03_1, IPS, 14", 1920x1080 | HP EliteBook 840 G4-Z2V49ET ABD AUO123D, TN, 14", 1920x1080 | |
|---|---|---|---|---|---|
| Display | 1% | -37% | -5% | -13% | |
| Display P3 Coverage (%) | 65.5 | 66.4 1% | 40.16 -39% | 61.6 -6% | 55.8 -15% |
| sRGB Coverage (%) | 91.8 | 93.5 2% | 60 -35% | 87.6 -5% | 80.7 -12% |
| AdobeRGB 1998 Coverage (%) | 65.8 | 66.6 1% | 41.54 -37% | 62.6 -5% | 57.7 -12% |
| Response Times | -4% | -7% | -22% | 4% | |
| Response Time Grey 50% / Grey 80% * (ms) | 34 ? | 36.8 ? -8% | 43.6 ? -28% | 48 ? -41% | 39 ? -15% |
| Response Time Black / White * (ms) | 29.6 ? | 29.6 ? -0% | 25.2 ? 15% | 30.4 ? -3% | 23 ? 22% |
| PWM Frequency (Hz) | 30860 ? | ||||
| Screen | 20% | -7% | 19% | -37% | |
| Brightness middle (cd/m²) | 317 | 332.6 5% | 306 -3% | 278 -12% | 346 9% |
| Brightness (cd/m²) | 295 | 323 9% | 307 4% | 271 -8% | 317 7% |
| Brightness Distribution (%) | 87 | 86 -1% | 89 2% | 91 5% | 86 -1% |
| Black Level * (cd/m²) | 0.3 | 0.28 7% | 0.36 -20% | 0.16 47% | 0.86 -187% |
| Contrast (:1) | 1057 | 1188 12% | 850 -20% | 1738 64% | 402 -62% |
| Colorchecker dE 2000 * | 6.3 | 2.6 59% | 5.1 19% | 4.5 29% | 8.64 -37% |
| Colorchecker dE 2000 max. * | 10.4 | 6.7 36% | 13.3 -28% | 8.4 19% | 13.58 -31% |
| Greyscale dE 2000 * | 7.8 | 2.5 68% | 3.9 50% | 3.2 59% | 11.24 -44% |
| Gamma | 1.81 122% | 2.12 104% | 2.17 101% | 2.02 109% | 2.62 84% |
| CCT | 7120 91% | 6720 97% | 6829 95% | 7042 92% | 12530 52% |
| Color Space (Percent of AdobeRGB 1998) (%) | 61 | 62 2% | 38.24 -37% | 57 -7% | 52 -15% |
| Color Space (Percent of sRGB) (%) | 92 | 94 2% | 59.75 -35% | 87.5 -5% | 80 -13% |
| Média Total (Programa/Configurações) | 6% /
13% | -17% /
-13% | -3% /
9% | -15% /
-27% |
* ... menor é melhor
Exibir tempos de resposta
| ↔ Tempo de resposta preto para branco | ||
|---|---|---|
| 29.6 ms ... ascensão ↗ e queda ↘ combinadas | ↗ 17.2 ms ascensão | 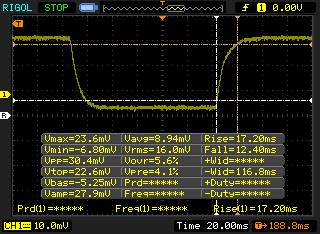 |
| ↘ 12.4 ms queda | ||
| A tela mostra taxas de resposta relativamente lentas em nossos testes e pode ser muito lenta para os jogadores. Em comparação, todos os dispositivos testados variam de 0.1 (mínimo) a 240 (máximo) ms. » 79 % de todos os dispositivos são melhores. Isso significa que o tempo de resposta medido é pior que a média de todos os dispositivos testados (19.8 ms). | ||
| ↔ Tempo de resposta 50% cinza a 80% cinza | ||
| 34 ms ... ascensão ↗ e queda ↘ combinadas | ↗ 17.2 ms ascensão | 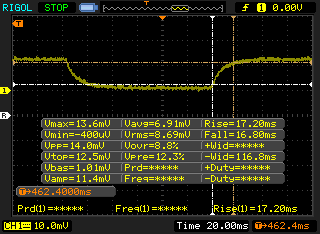 |
| ↘ 16.8 ms queda | ||
| A tela mostra taxas de resposta lentas em nossos testes e será insatisfatória para os jogadores. Em comparação, todos os dispositivos testados variam de 0.165 (mínimo) a 636 (máximo) ms. » 47 % de todos os dispositivos são melhores. Isso significa que o tempo de resposta medido é semelhante à média de todos os dispositivos testados (31 ms). | ||
Cintilação da tela / PWM (modulação por largura de pulso)
| Tela tremeluzindo / PWM não detectado |  | ||
[pwm_comparison] Em comparação: 52 % de todos os dispositivos testados não usam PWM para escurecer a tela. Se PWM foi detectado, uma média de 7754 (mínimo: 5 - máximo: 343500) Hz foi medida. | |||
| wPrime 2.10 - 1024m | |
| Dell Latitude 13 7370 | |
| Toshiba Portege X30-D (PT274U-01N001) | |
| Dell Latitude 13 7380 | |
* ... menor é melhor
| PCMark 8 Home Score Accelerated v2 | 3872 pontos | |
| PCMark 8 Creative Score Accelerated v2 | 4958 pontos | |
| PCMark 8 Work Score Accelerated v2 | 5060 pontos | |
| PCMark 10 Score | 3711 pontos | |
Ajuda | ||
| Dell Latitude 13 7380 Samsung PM961 MZVLW256HEHP | Toshiba Portege X30-D (PT274U-01N001) Samsung PM961 MZVLW256HEHP | Lenovo ThinkPad 13-20J2S00G00 Toshiba NVMe THNSF5512GPUK | Lenovo ThinkPad X1 Carbon 2017-20HR0021GE Toshiba THNSF5256GPUK | HP EliteBook 840 G4-Z2V49ET ABD Samsung PM961 MZVLW256HEHP | |
|---|---|---|---|---|---|
| AS SSD | -676% | -35% | -48% | -3% | |
| Copy Game MB/s (MB/s) | 664 | 447.8 -33% | 229 -66% | 355.1 -47% | |
| Copy Program MB/s (MB/s) | 451 | 316.3 -30% | 172.4 -62% | 269.7 -40% | |
| Copy ISO MB/s (MB/s) | 1250 | 382.9 -69% | 623 -50% | 735 -41% | |
| Score Total (Points) | 4063 | 2687 -34% | 1256 -69% | 1398 -66% | 3006 -26% |
| Score Write (Points) | 690 | 162 -77% | 557 -19% | 337 -51% | 767 11% |
| Score Read (Points) | 2251 | 1723 -23% | 481 -79% | 726 -68% | 1524 -32% |
| Access Time Write * (ms) | 0.028 | 2.01 -7079% | 0.033 -18% | 0.034 -21% | 0.027 4% |
| Access Time Read * (ms) | 0.045 | 0.05 -11% | 0.076 -69% | 0.102 -127% | 0.044 2% |
| 4K-64 Write (MB/s) | 484.5 | 125.8 -74% | 361.5 -25% | 149.6 -69% | 510 5% |
| 4K-64 Read (MB/s) | 2072 | 1483 -28% | 264.7 -87% | 526 -75% | 1215 -41% |
| 4K Write (MB/s) | 125.1 | 1.2 -99% | 101.9 -19% | 109.4 -13% | 140.2 12% |
| 4K Read (MB/s) | 45.59 | 42.8 -6% | 38.7 -15% | 34.34 -25% | 49.21 8% |
| Seq Write (MB/s) | 805 | 352.7 -56% | 935 16% | 775 -4% | 1167 45% |
| Seq Read (MB/s) | 1330 | 1972 48% | 1775 33% | 1649 24% | 2603 96% |
* ... menor é melhor

| 3DMark | |
| 1280x720 Cloud Gate Standard Graphics | |
| Dell Latitude 13 7380 | |
| Lenovo ThinkPad X1 Carbon 2017-20HR0021GE | |
| Toshiba Portege X30-D (PT274U-01N001) | |
| HP EliteBook 840 G4-Z2V49ET ABD | |
| Dell Latitude 13 7370 | |
| 1920x1080 Fire Strike Graphics | |
| Lenovo ThinkPad X1 Carbon 2017-20HR0021GE | |
| Dell Latitude 13 7380 | |
| Toshiba Portege X30-D (PT274U-01N001) | |
| HP EliteBook 840 G4-Z2V49ET ABD | |
| Dell Latitude 13 7370 | |
| 1920x1080 Ice Storm Extreme Graphics | |
| Lenovo ThinkPad X1 Carbon 2017-20HR0021GE | |
| Dell Latitude 13 7380 | |
| Toshiba Portege X30-D (PT274U-01N001) | |
| Dell Latitude 13 7370 | |
| 3DMark 06 Standard Score | 8937 pontos | |
| 3DMark 11 Performance | 1762 pontos | |
| 3DMark Ice Storm Standard Score | 46459 pontos | |
| 3DMark Cloud Gate Standard Score | 6363 pontos | |
| 3DMark Fire Strike Score | 853 pontos | |
| 3DMark Fire Strike Extreme Score | 388 pontos | |
Ajuda | ||
| baixo | média | alto | ultra | |
|---|---|---|---|---|
| BioShock Infinite (2013) | 44 | 27 | 22 | 7 |
Barulho
| Ocioso |
| 28 / 28 / 29.6 dB |
| Carga |
| 30.6 / 35.4 dB |
 | ||
30 dB silencioso 40 dB(A) audível 50 dB(A) ruidosamente alto |
||
min: | ||
| Dell Latitude 13 7380 HD Graphics 620, i7-7600U, Samsung PM961 MZVLW256HEHP | Toshiba Portege X30-D (PT274U-01N001) HD Graphics 620, i7-7600U, Samsung PM961 MZVLW256HEHP | Lenovo ThinkPad 13-20J2S00G00 HD Graphics 620, i7-7500U, Toshiba NVMe THNSF5512GPUK | Lenovo ThinkPad X1 Carbon 2017-20HR0021GE HD Graphics 620, i5-7200U, Toshiba THNSF5256GPUK | HP EliteBook 840 G4-Z2V49ET ABD HD Graphics 620, i5-7200U, Samsung PM961 MZVLW256HEHP | |
|---|---|---|---|---|---|
| Noise | -2% | -1% | -7% | -7% | |
| desligado / ambiente * (dB) | 28 | 28.4 -1% | 29.1 -4% | 29.6 -6% | 31 -11% |
| Idle Minimum * (dB) | 28 | 28.4 -1% | 29.1 -4% | 29.6 -6% | 31 -11% |
| Idle Average * (dB) | 28 | 28.4 -1% | 29.1 -4% | 29.6 -6% | 31 -11% |
| Idle Maximum * (dB) | 29.6 | 28.4 4% | 29.1 2% | 32.2 -9% | 31 -5% |
| Load Average * (dB) | 30.6 | 33.2 -8% | 31.9 -4% | 34.2 -12% | 33.5 -9% |
| Load Maximum * (dB) | 35.4 | 37.9 -7% | 31.9 10% | 36.1 -2% | 33.7 5% |
* ... menor é melhor
(±) A temperatura máxima no lado superior é 41 °C / 106 F, em comparação com a média de 34.3 °C / 94 F , variando de 21.2 a 62.5 °C para a classe Office.
(-) A parte inferior aquece até um máximo de 45.6 °C / 114 F, em comparação com a média de 36.8 °C / 98 F
(+) Em uso inativo, a temperatura média para o lado superior é 24.2 °C / 76 F, em comparação com a média do dispositivo de 29.5 °C / ### class_avg_f### F.
(+) Os apoios para as mãos e o touchpad são mais frios que a temperatura da pele, com um máximo de 28.6 °C / 83.5 F e, portanto, são frios ao toque.
(±) A temperatura média da área do apoio para as mãos de dispositivos semelhantes foi 27.5 °C / 81.5 F (-1.1 °C / -2 F).
Dell Latitude 13 7380 análise de áudio
(-) | alto-falantes não muito altos (###valor### dB)
Graves 100 - 315Hz
(±) | graves reduzidos - em média 12.8% menor que a mediana
(±) | a linearidade dos graves é média (12.8% delta para a frequência anterior)
Médios 400 - 2.000 Hz
(+) | médios equilibrados - apenas 1.9% longe da mediana
(±) | a linearidade dos médios é média (7.2% delta para frequência anterior)
Altos 2 - 16 kHz
(+) | agudos equilibrados - apenas 4.5% longe da mediana
(±) | a linearidade dos máximos é média (12.1% delta para frequência anterior)
Geral 100 - 16.000 Hz
(±) | a linearidade do som geral é média (22.8% diferença em relação à mediana)
Comparado com a mesma classe
» 63% de todos os dispositivos testados nesta classe foram melhores, 8% semelhantes, 29% piores
» O melhor teve um delta de 7%, a média foi 21%, o pior foi 53%
Comparado com todos os dispositivos testados
» 68% de todos os dispositivos testados foram melhores, 5% semelhantes, 27% piores
» O melhor teve um delta de 4%, a média foi 23%, o pior foi 134%
HP EliteBook 840 G4-Z2V49ET ABD análise de áudio
(-) | alto-falantes não muito altos (###valor### dB)
Graves 100 - 315Hz
(±) | graves reduzidos - em média 14.6% menor que a mediana
(±) | a linearidade dos graves é média (7.8% delta para a frequência anterior)
Médios 400 - 2.000 Hz
(+) | médios equilibrados - apenas 0.7% longe da mediana
(+) | médios são lineares (3.4% delta para frequência anterior)
Altos 2 - 16 kHz
(+) | agudos equilibrados - apenas 3.9% longe da mediana
(+) | os máximos são lineares (5.4% delta da frequência anterior)
Geral 100 - 16.000 Hz
(±) | a linearidade do som geral é média (16.2% diferença em relação à mediana)
Comparado com a mesma classe
» 19% de todos os dispositivos testados nesta classe foram melhores, 6% semelhantes, 74% piores
» O melhor teve um delta de 7%, a média foi 21%, o pior foi 53%
Comparado com todos os dispositivos testados
» 26% de todos os dispositivos testados foram melhores, 6% semelhantes, 68% piores
» O melhor teve um delta de 4%, a média foi 23%, o pior foi 134%
| desligado | |
| Ocioso | |
| Carga |
|
Key:
min: | |
| Dell Latitude 13 7380 i7-7600U, HD Graphics 620, Samsung PM961 MZVLW256HEHP, IPS, 1920x1080, 13.3" | Toshiba Portege X30-D (PT274U-01N001) i7-7600U, HD Graphics 620, Samsung PM961 MZVLW256HEHP, IPS, 1920x1080, 13.3" | Lenovo ThinkPad 13-20J2S00G00 i7-7500U, HD Graphics 620, Toshiba NVMe THNSF5512GPUK, IPS, LED, 1920x1080, 13.3" | Lenovo ThinkPad X1 Carbon 2017-20HR0021GE i5-7200U, HD Graphics 620, Toshiba THNSF5256GPUK, IPS, 1920x1080, 14" | HP EliteBook 840 G4-Z2V49ET ABD i5-7200U, HD Graphics 620, Samsung PM961 MZVLW256HEHP, TN, 1920x1080, 14" | |
|---|---|---|---|---|---|
| Power Consumption | -17% | -6% | -27% | -6% | |
| Idle Minimum * (Watt) | 3.2 | 4.6 -44% | 3.16 1% | 3.8 -19% | 2.9 9% |
| Idle Average * (Watt) | 5.5 | 7.6 -38% | 5.9 -7% | 7.1 -29% | 5.6 -2% |
| Idle Maximum * (Watt) | 6.1 | 8.2 -34% | 6.5 -7% | 8.3 -36% | 8.15 -34% |
| Load Average * (Watt) | 29.5 | 23.8 19% | 30.6 -4% | 34.2 -16% | 30.6 -4% |
| Load Maximum * (Watt) | 32 | 28 12% | 35.8 -12% | 43.3 -35% | 31 3% |
* ... menor é melhor
| Dell Latitude 13 7380 i7-7600U, HD Graphics 620, 60 Wh | Toshiba Portege X30-D (PT274U-01N001) i7-7600U, HD Graphics 620, 48 Wh | Lenovo ThinkPad 13-20J2S00G00 i7-7500U, HD Graphics 620, 42 Wh | Lenovo ThinkPad X1 Carbon 2017-20HR0021GE i5-7200U, HD Graphics 620, 57 Wh | HP EliteBook 840 G4-Z2V49ET ABD i5-7200U, HD Graphics 620, 51 Wh | Dell Latitude 13 7370 6Y57, HD Graphics 515, 34 Wh | |
|---|---|---|---|---|---|---|
| Duração da bateria | -31% | -37% | -26% | -3% | -28% | |
| Reader / Idle (h) | 26.6 | 15 -44% | 15.1 -43% | 13.7 -48% | 19.3 -27% | 9.8 -63% |
| WiFi v1.3 (h) | 10.5 | 7.2 -31% | 7.9 -25% | 9.1 -13% | 9.5 -10% | 6.1 -42% |
| Load (h) | 2.4 | 2 -17% | 1.4 -42% | 2 -17% | 3.1 29% | 2.9 21% |
Pro
Contra
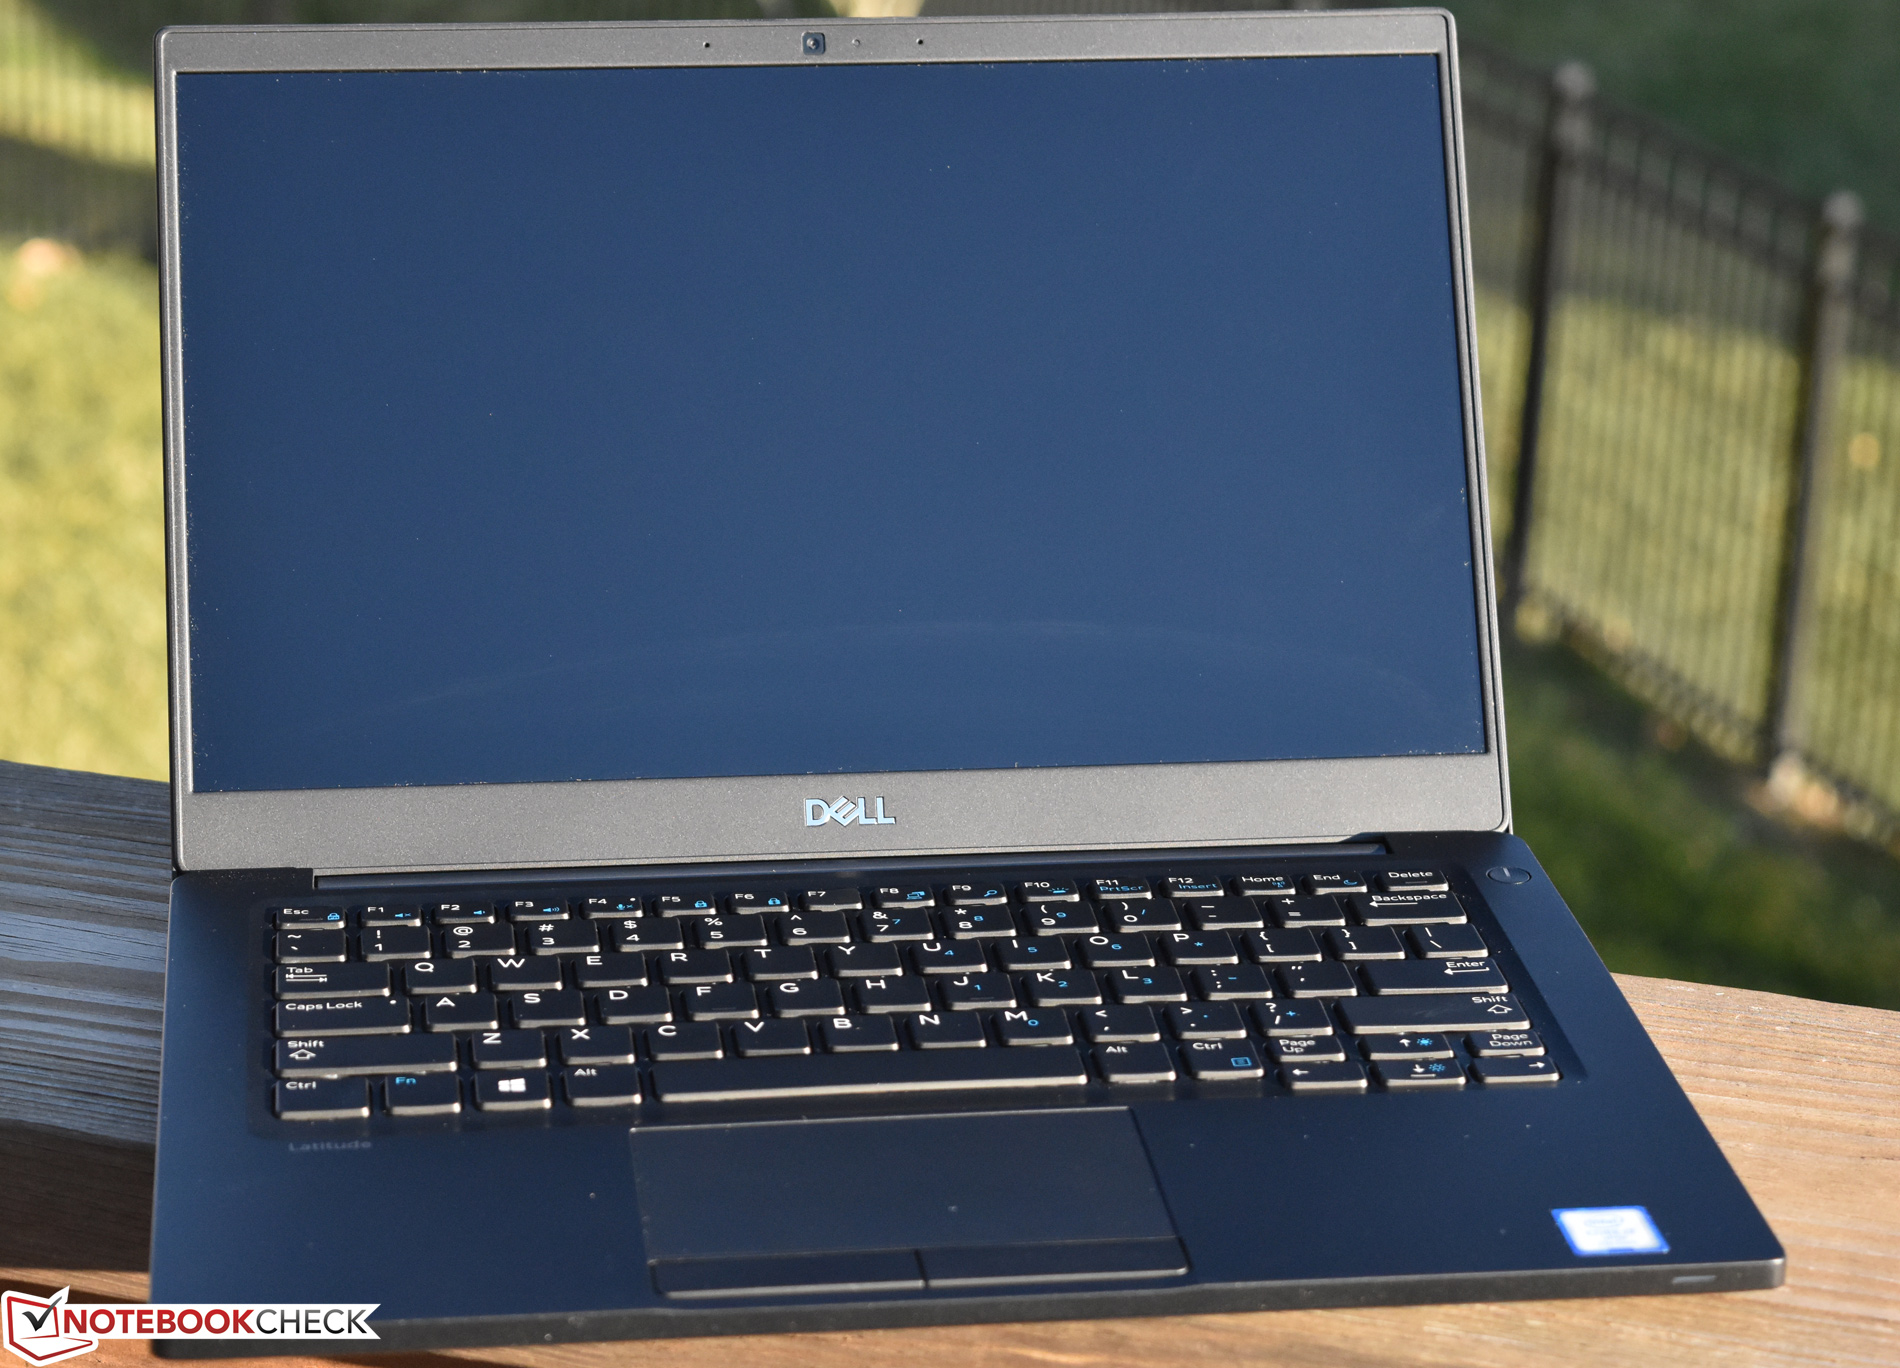
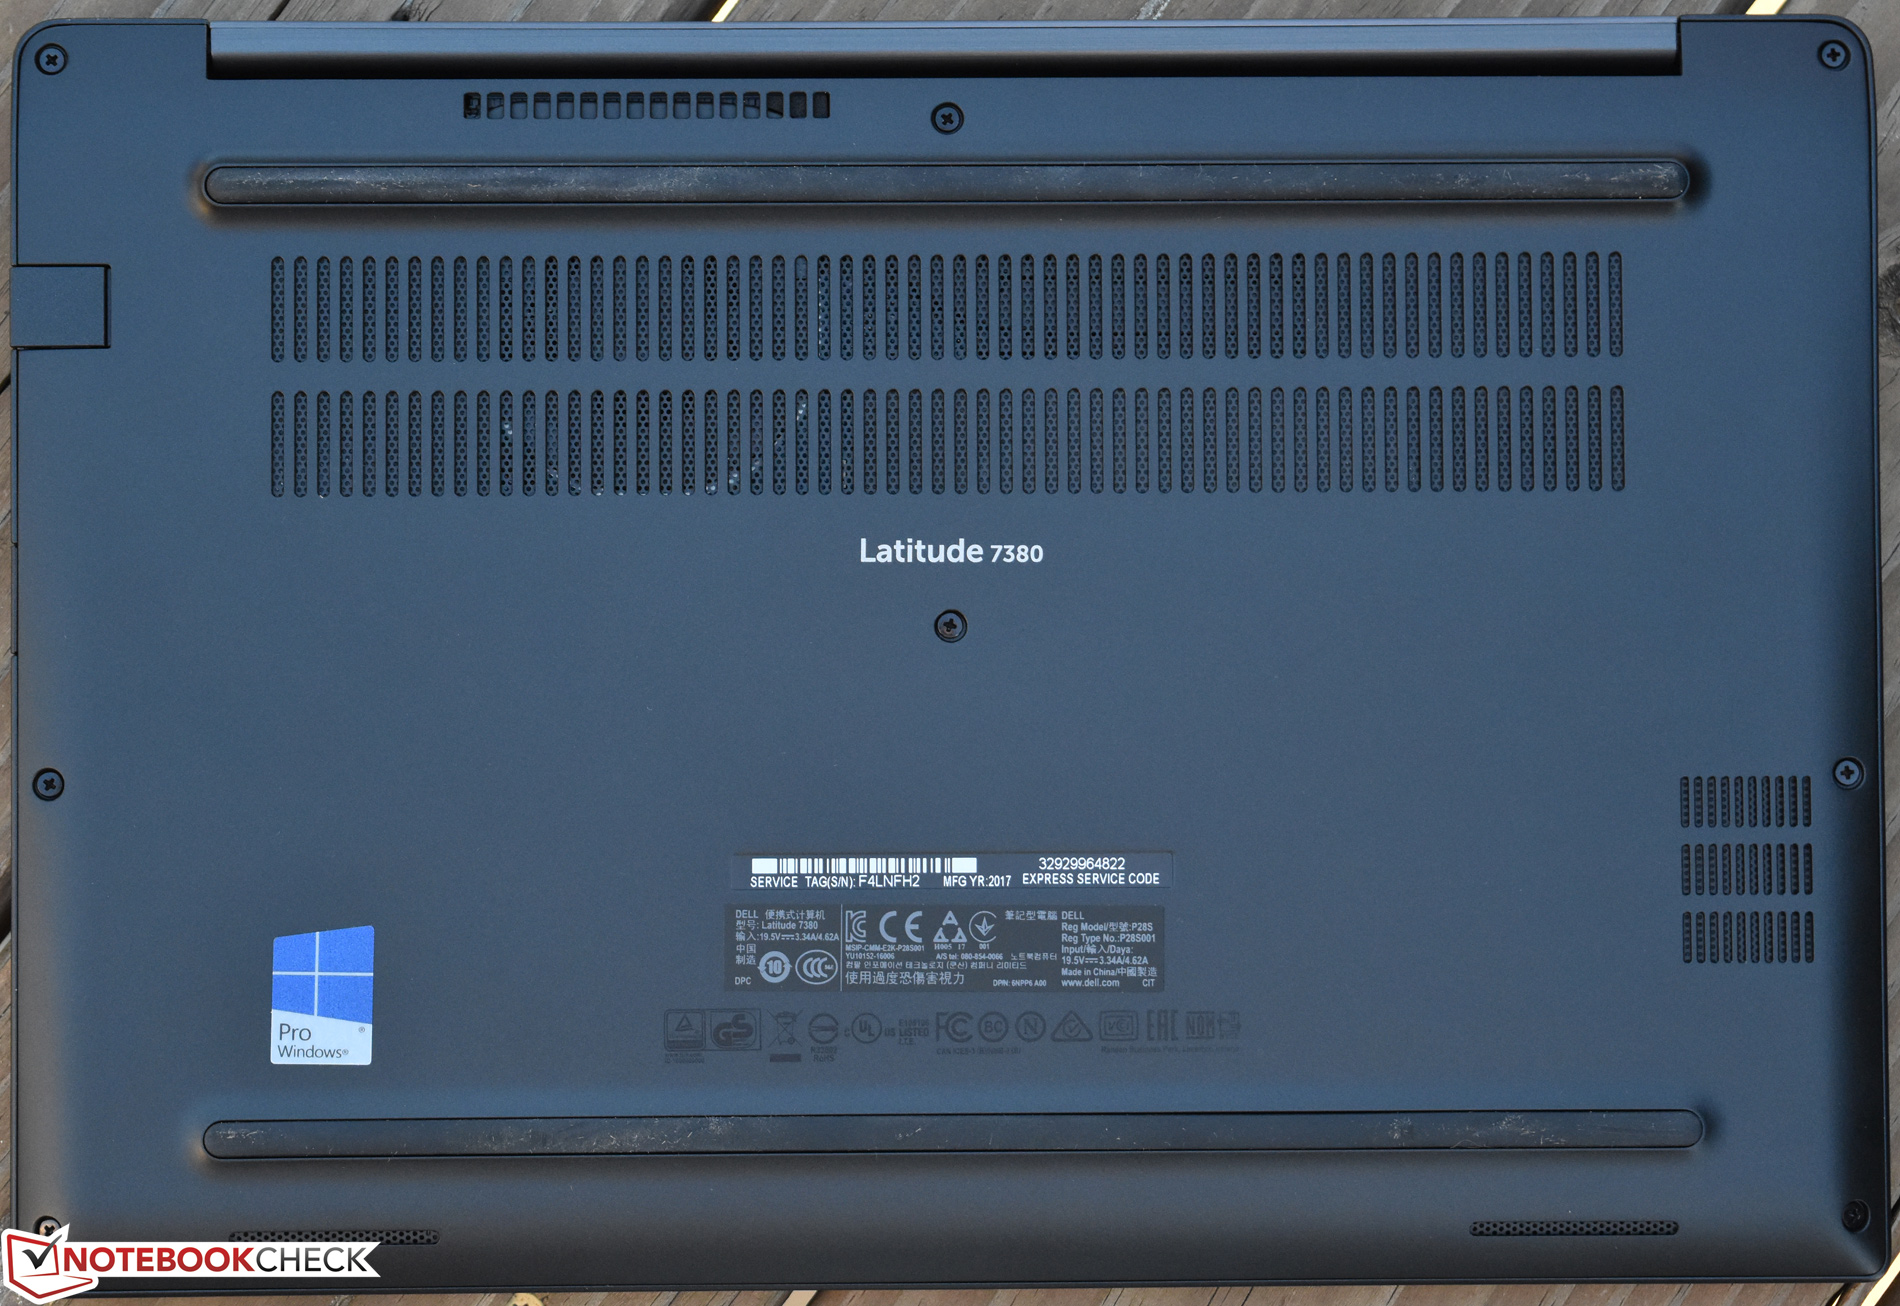
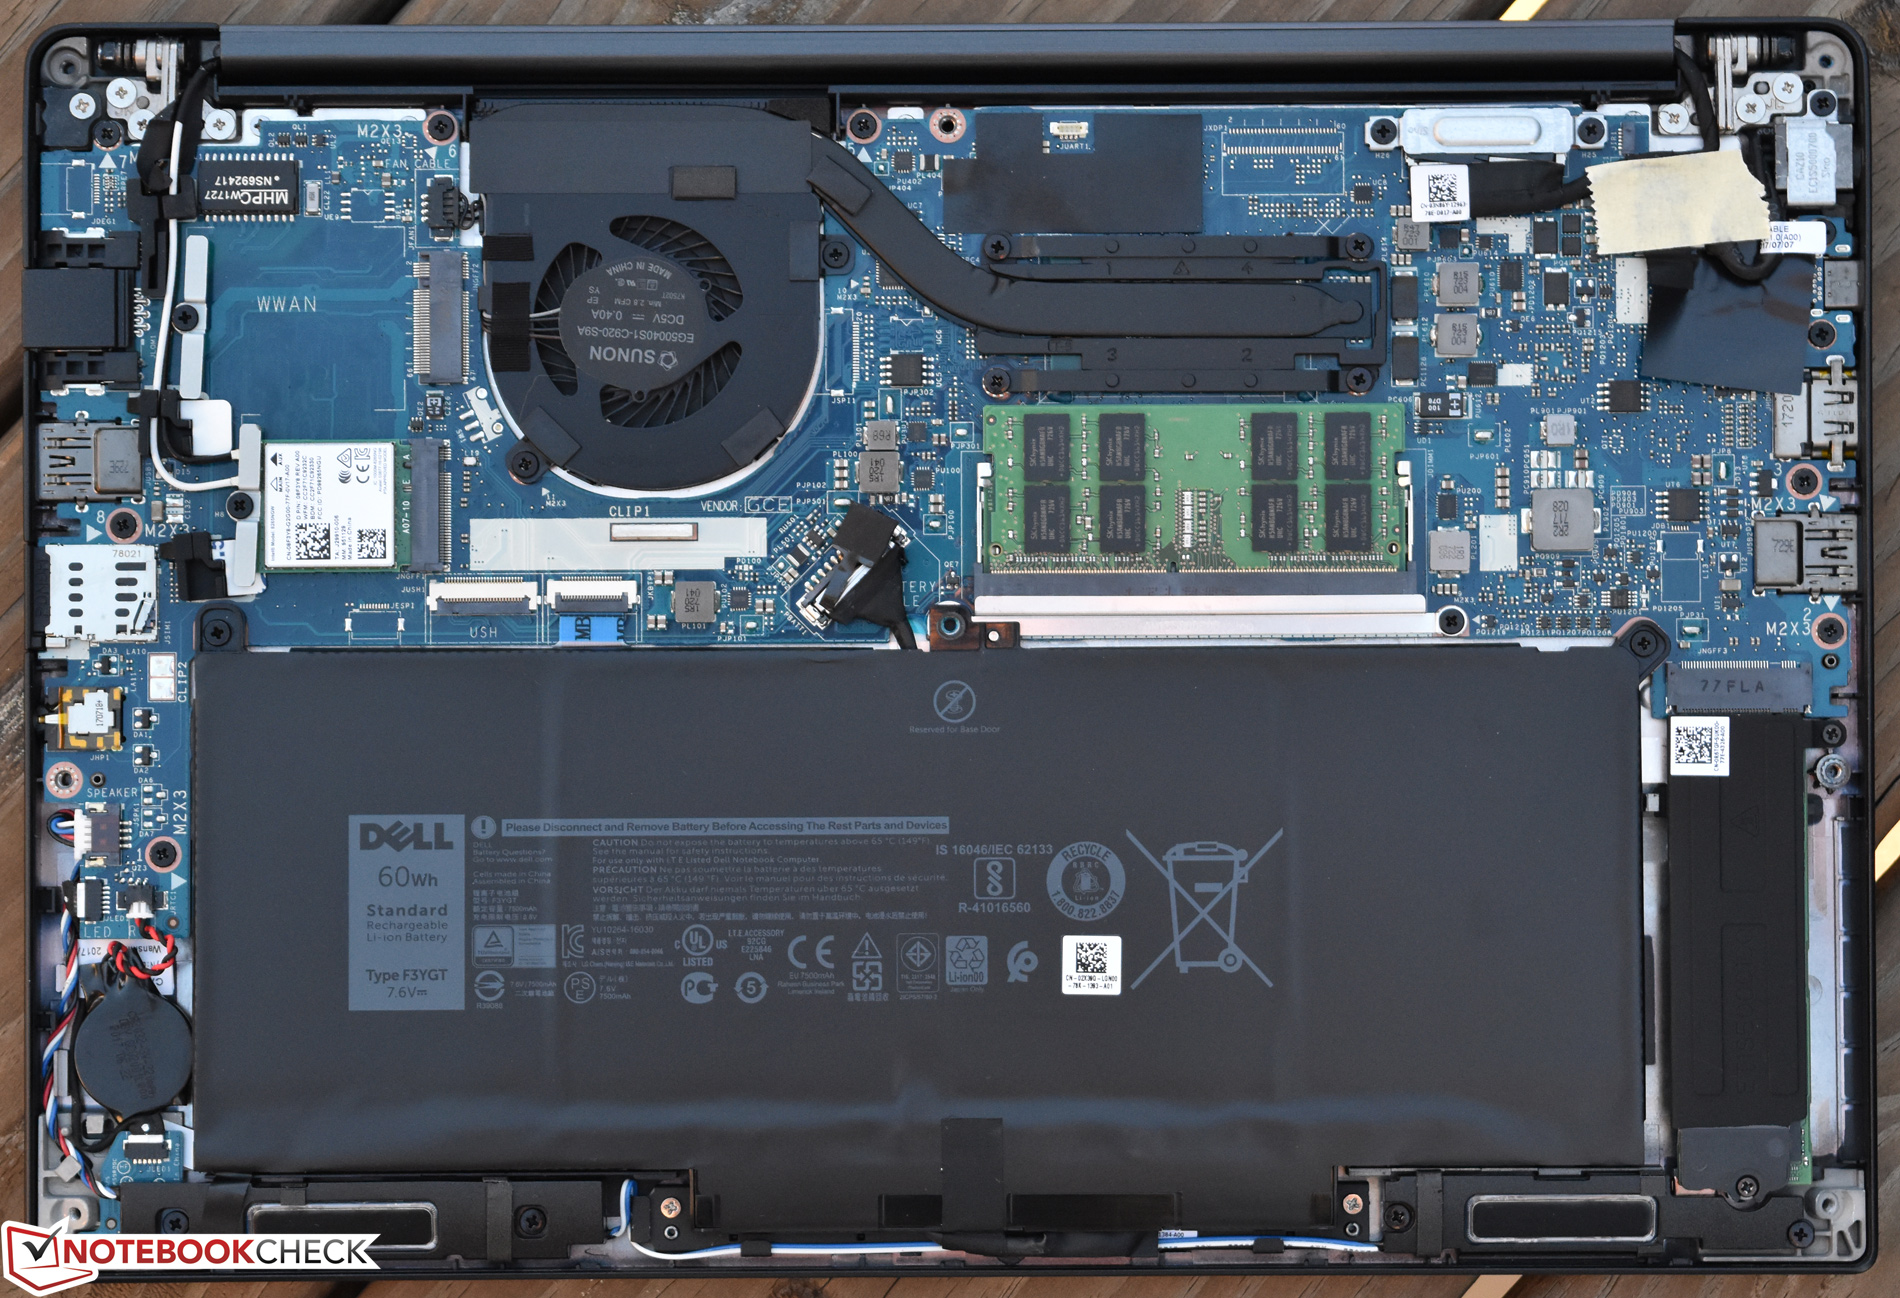
O Dell Latitude 7380 divide a diferença no tamanho da tela entre os carros-chefes existentes da série Latitude 7000, o 7280 e 7480—mas, em muitos aspectos, é menos um compromisso e mais uma evolução intra geracional. Arrancando uma página do livro do XPS 13, o 7380 coloca uma tela de 13,3 polegadas (e, em sua maior parte, todo o corpo) do existente 7280 de 12,5 polegadas—por isso, de muitas maneiras, o substitui. O melhor de tudo, realmente não há grandes pontos negativos para esta abordagem: a estabilidade da carcaça ainda é muito boa em geral e, embora a tampa da tela não possa igualar a rigidez da estrutura de alumínio do XPS 13, a construção de magnésio do Latitude não é nada frágil.
O Dell Latitude 7380 divide a diferença no tamanho da tela - mas de muitas maneiras, é menos um compromisso e mais uma evolução intra geracional. Começa com a base estabelecida pelo XPS 13 de nível consumidor, mas fornece todas as sensibilidades empresariais implicadas pela marca Latitude.
Também ficamos satisfeitos com o excelente desempenho do sistema do 7380 e as velocidades da CPU na maior parte consistentes sob carga; junto com as baixas temperaturas da superfície e o ruído do ventilador bastante discreto, os resultados são impressionantes para uma máquina desse tamanho. Ainda mais impressionantes foram nossos testes de bateria, onde conseguimos mais de dez horas de navegação na web com uma única carga. Além disso, a tela IPS de 1080p também está acima da média, embora exija uma calibração profissional para ter algum grau de precisão de cores.
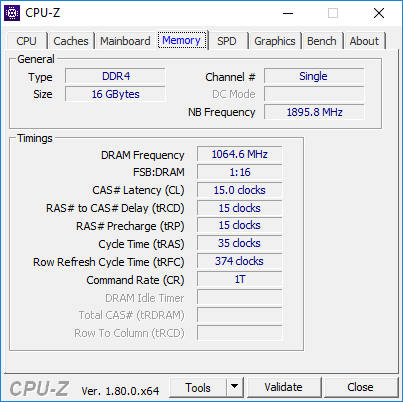
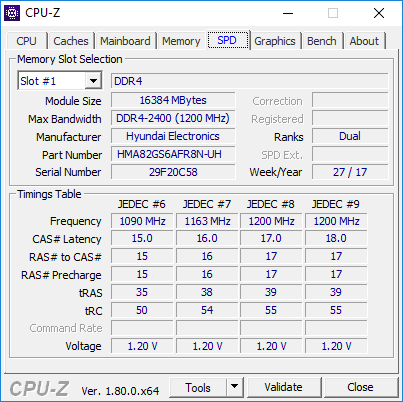
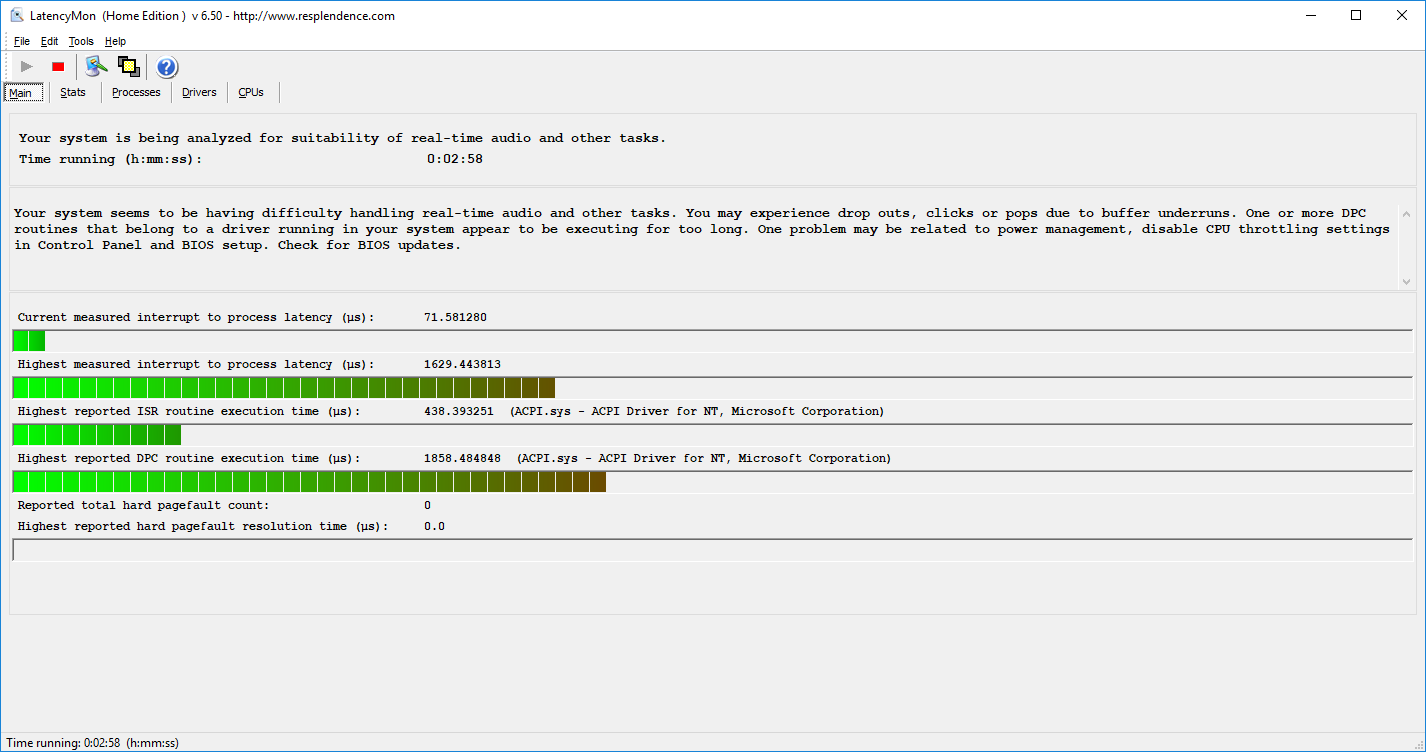
Nossas únicas queixas são o ruído eletrônico/de bobina moderadamente perceptível, a imprecisão da tla no estado de fábrica e o alto preço acima mencionado de $2.178. Também é um pouco decepcionante que apenas a memória de um canal seja suportada, embora a capacidade total de 16 GB seja mais que suficiente para esta classe de portátil. Os concorrentes interessantes de outros fabricantes incluem o Lenovo ThinkPad X1 Carbon, HP EliteBook 840 G4 e Toshiba Portege X30-D, alguns dos quais são mais econômicos que o Latitude, mas todos os quais são acompanhados por seus próprios conjuntos de prós e contras.
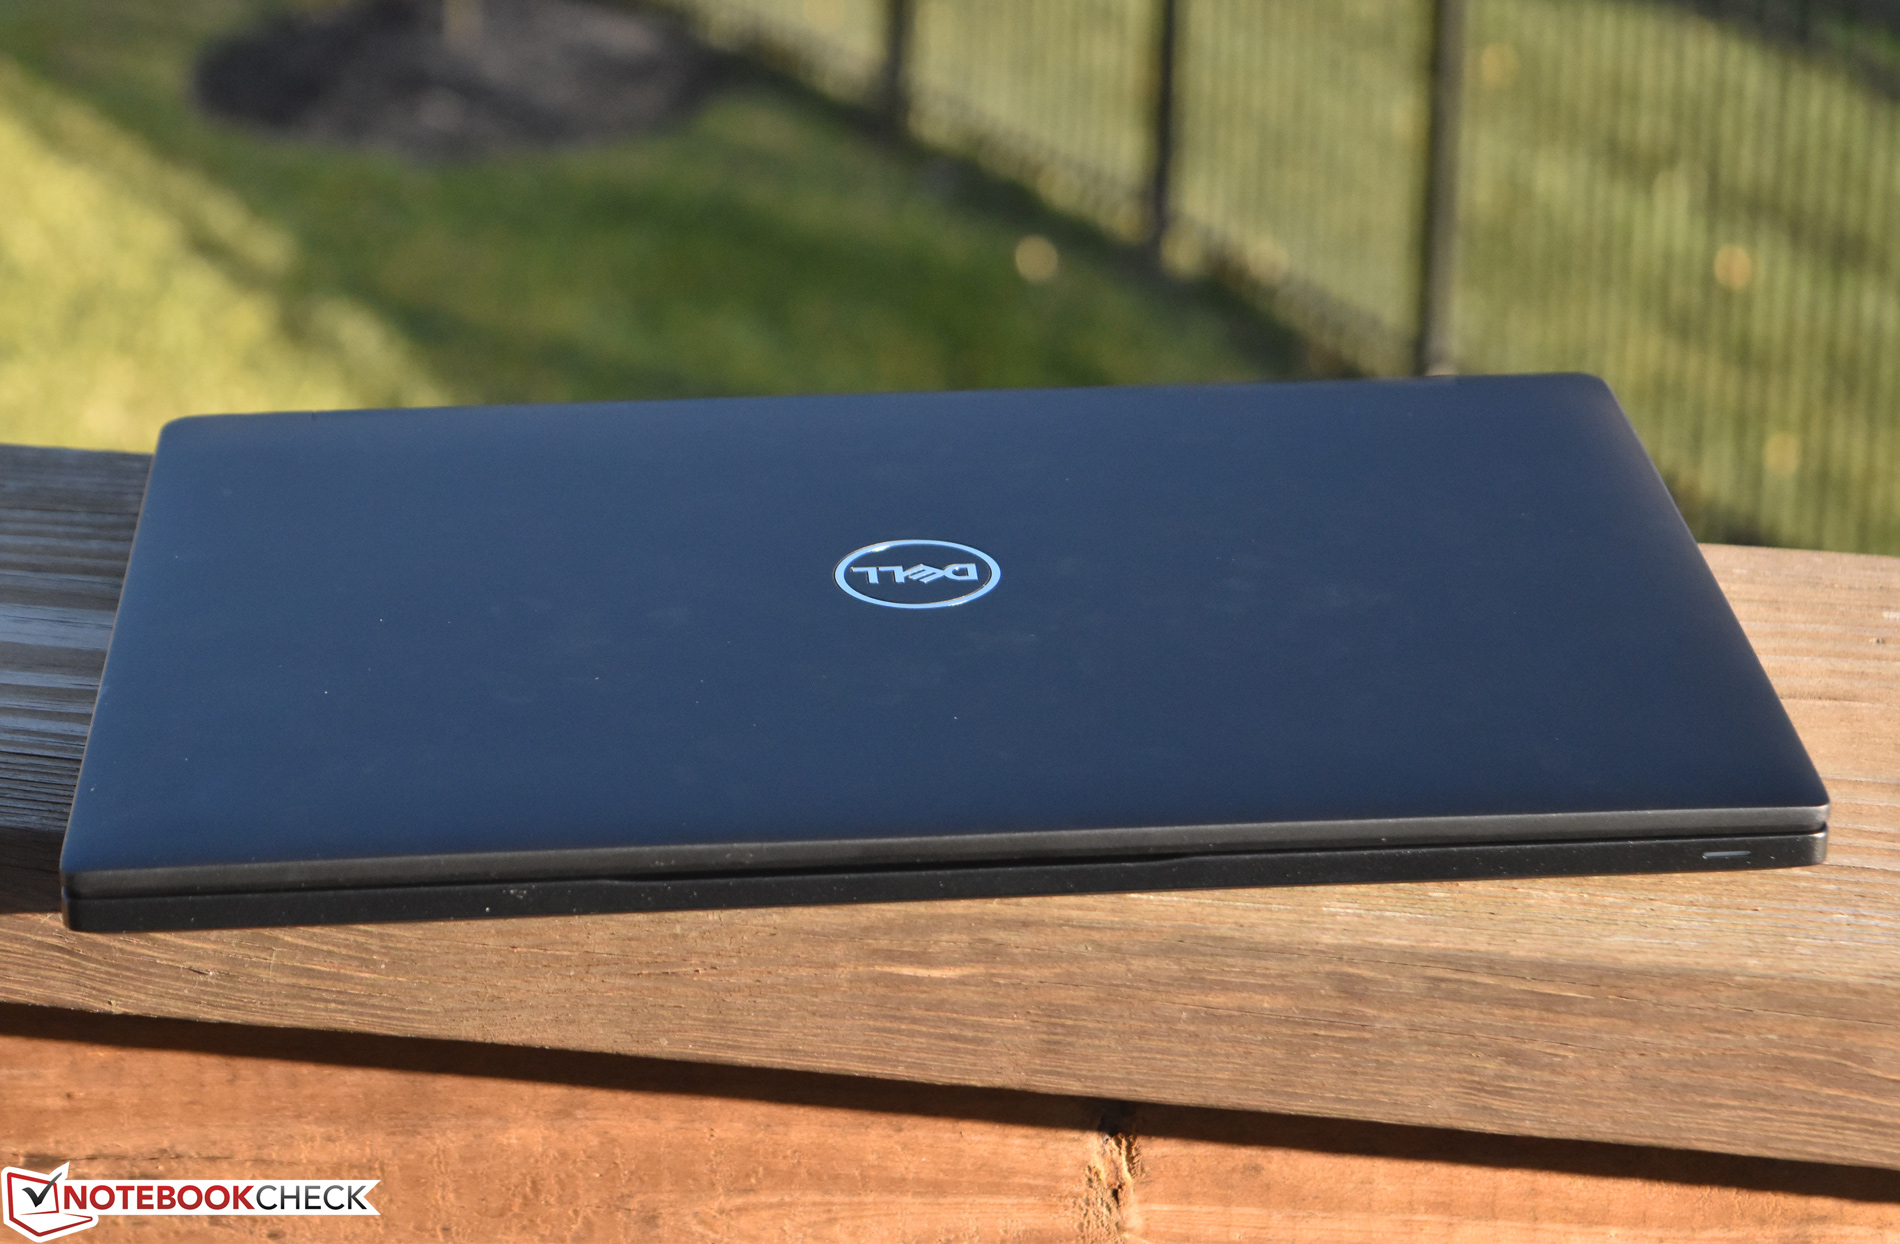
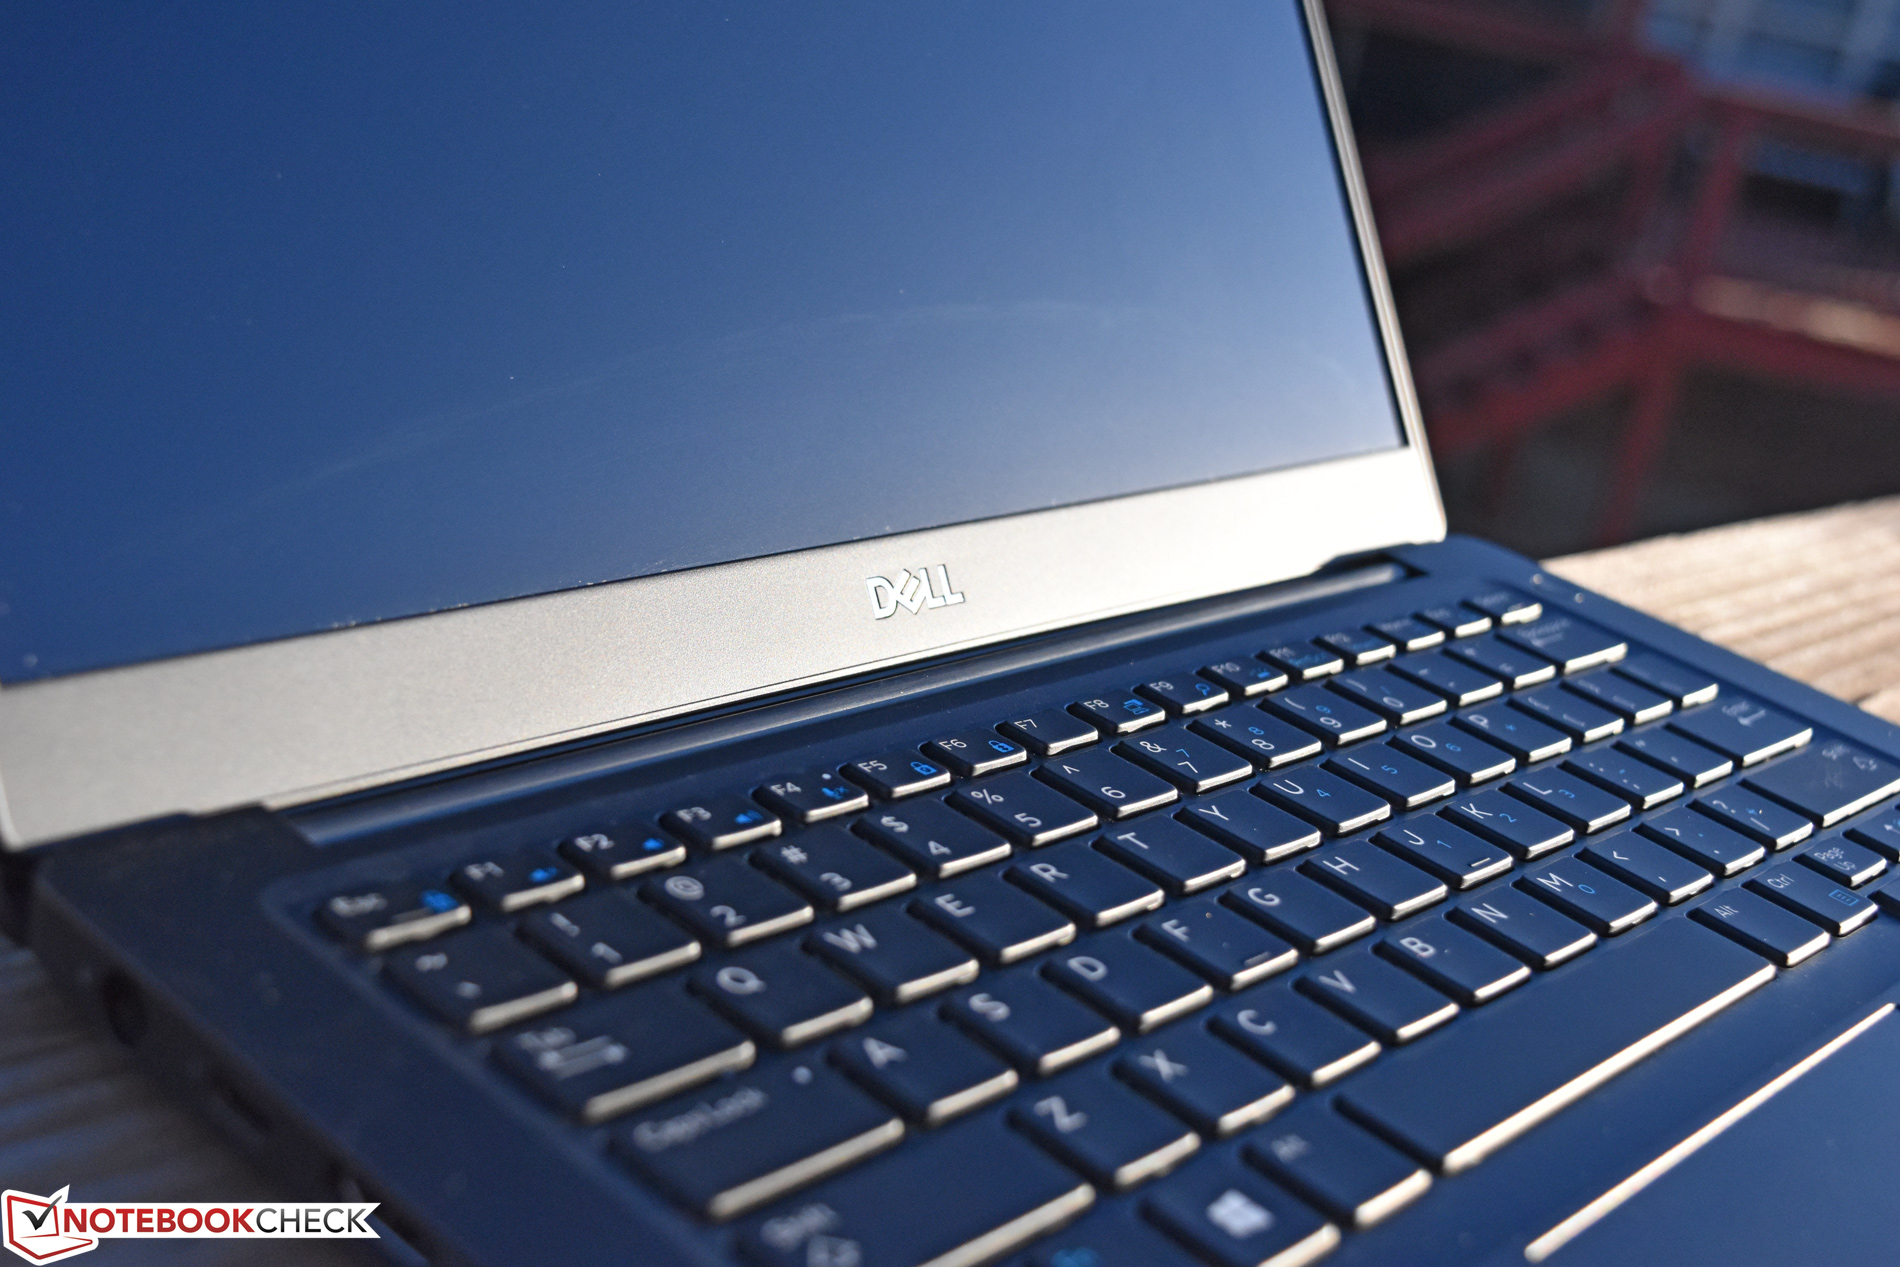
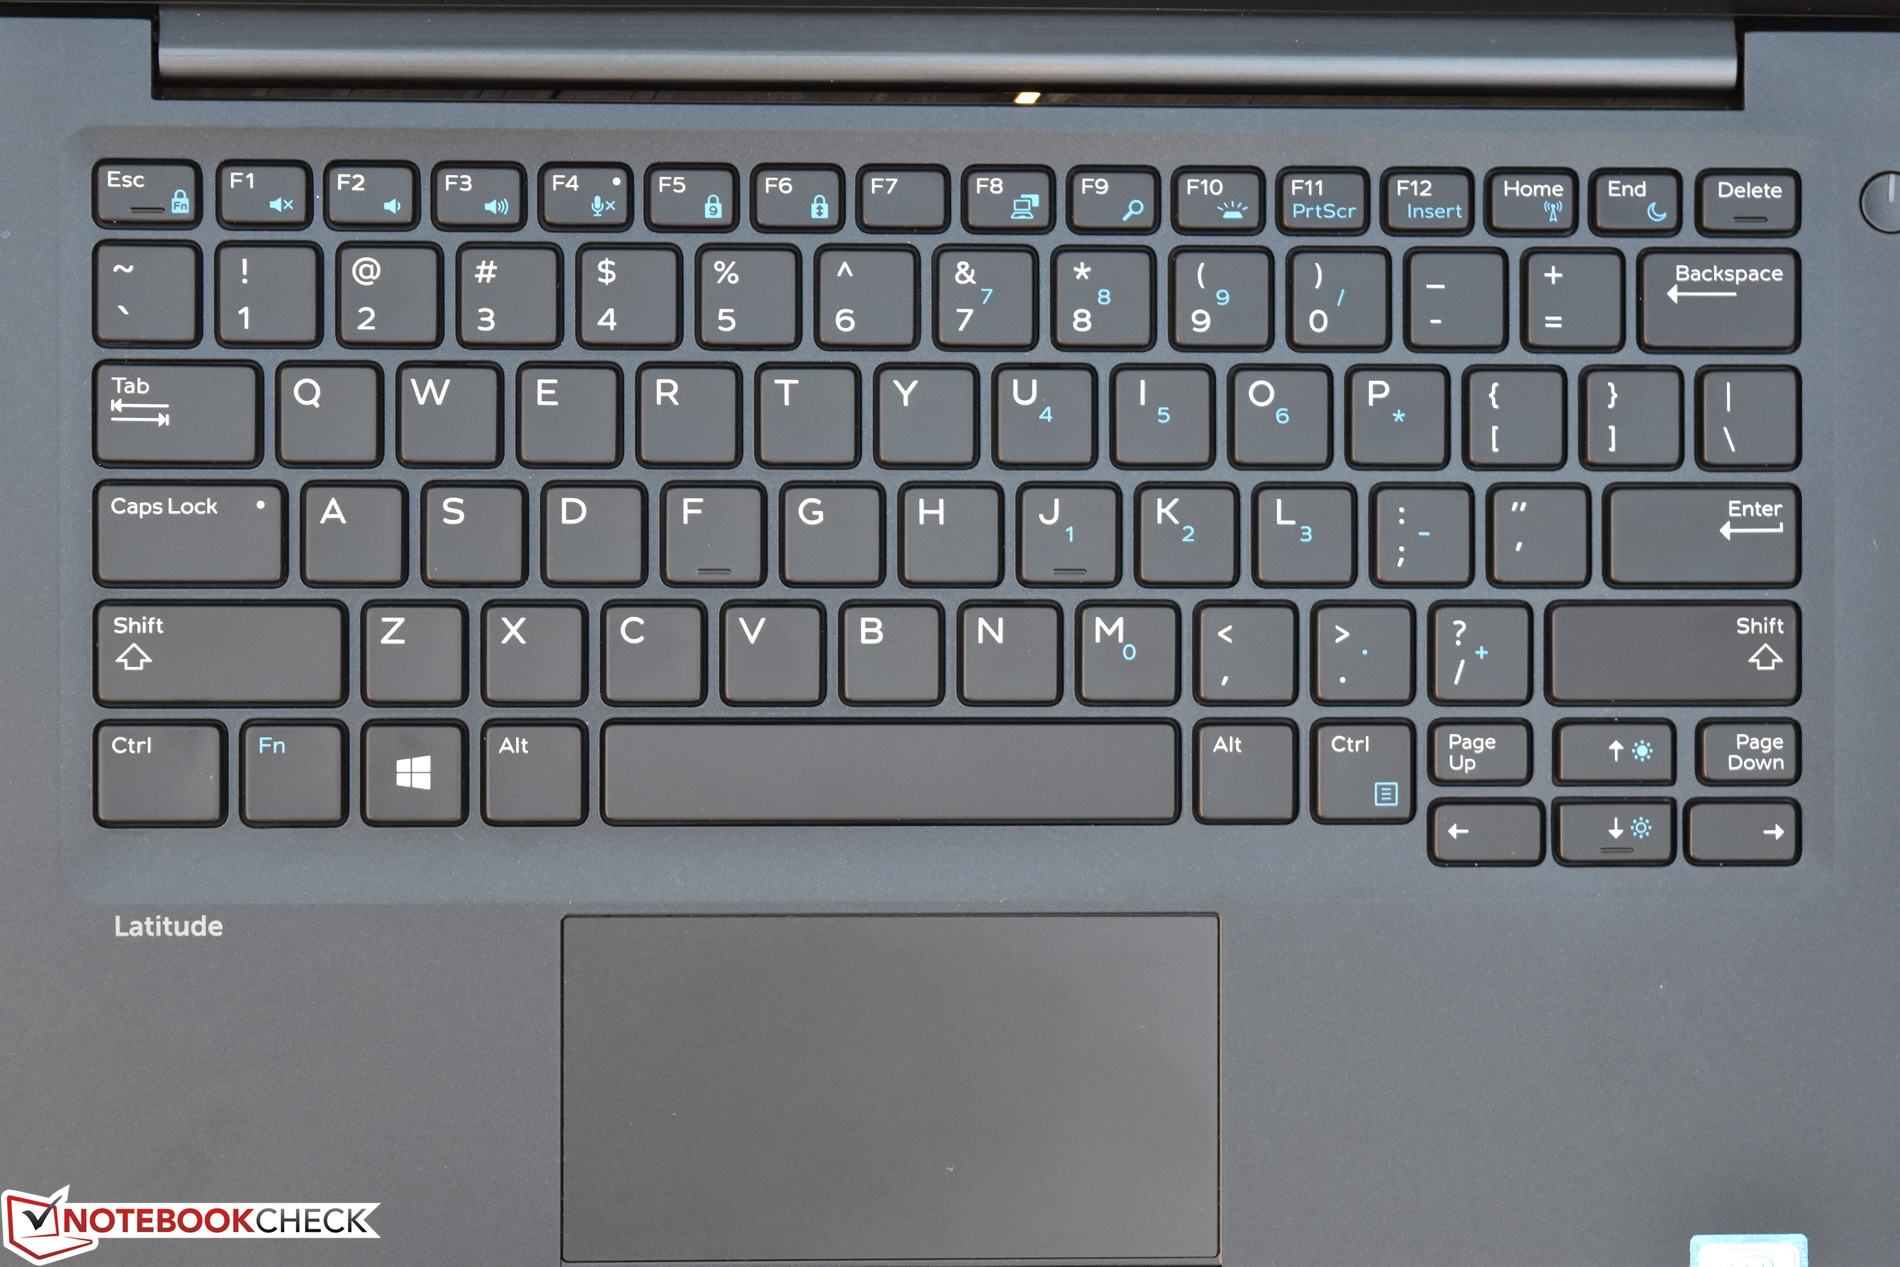
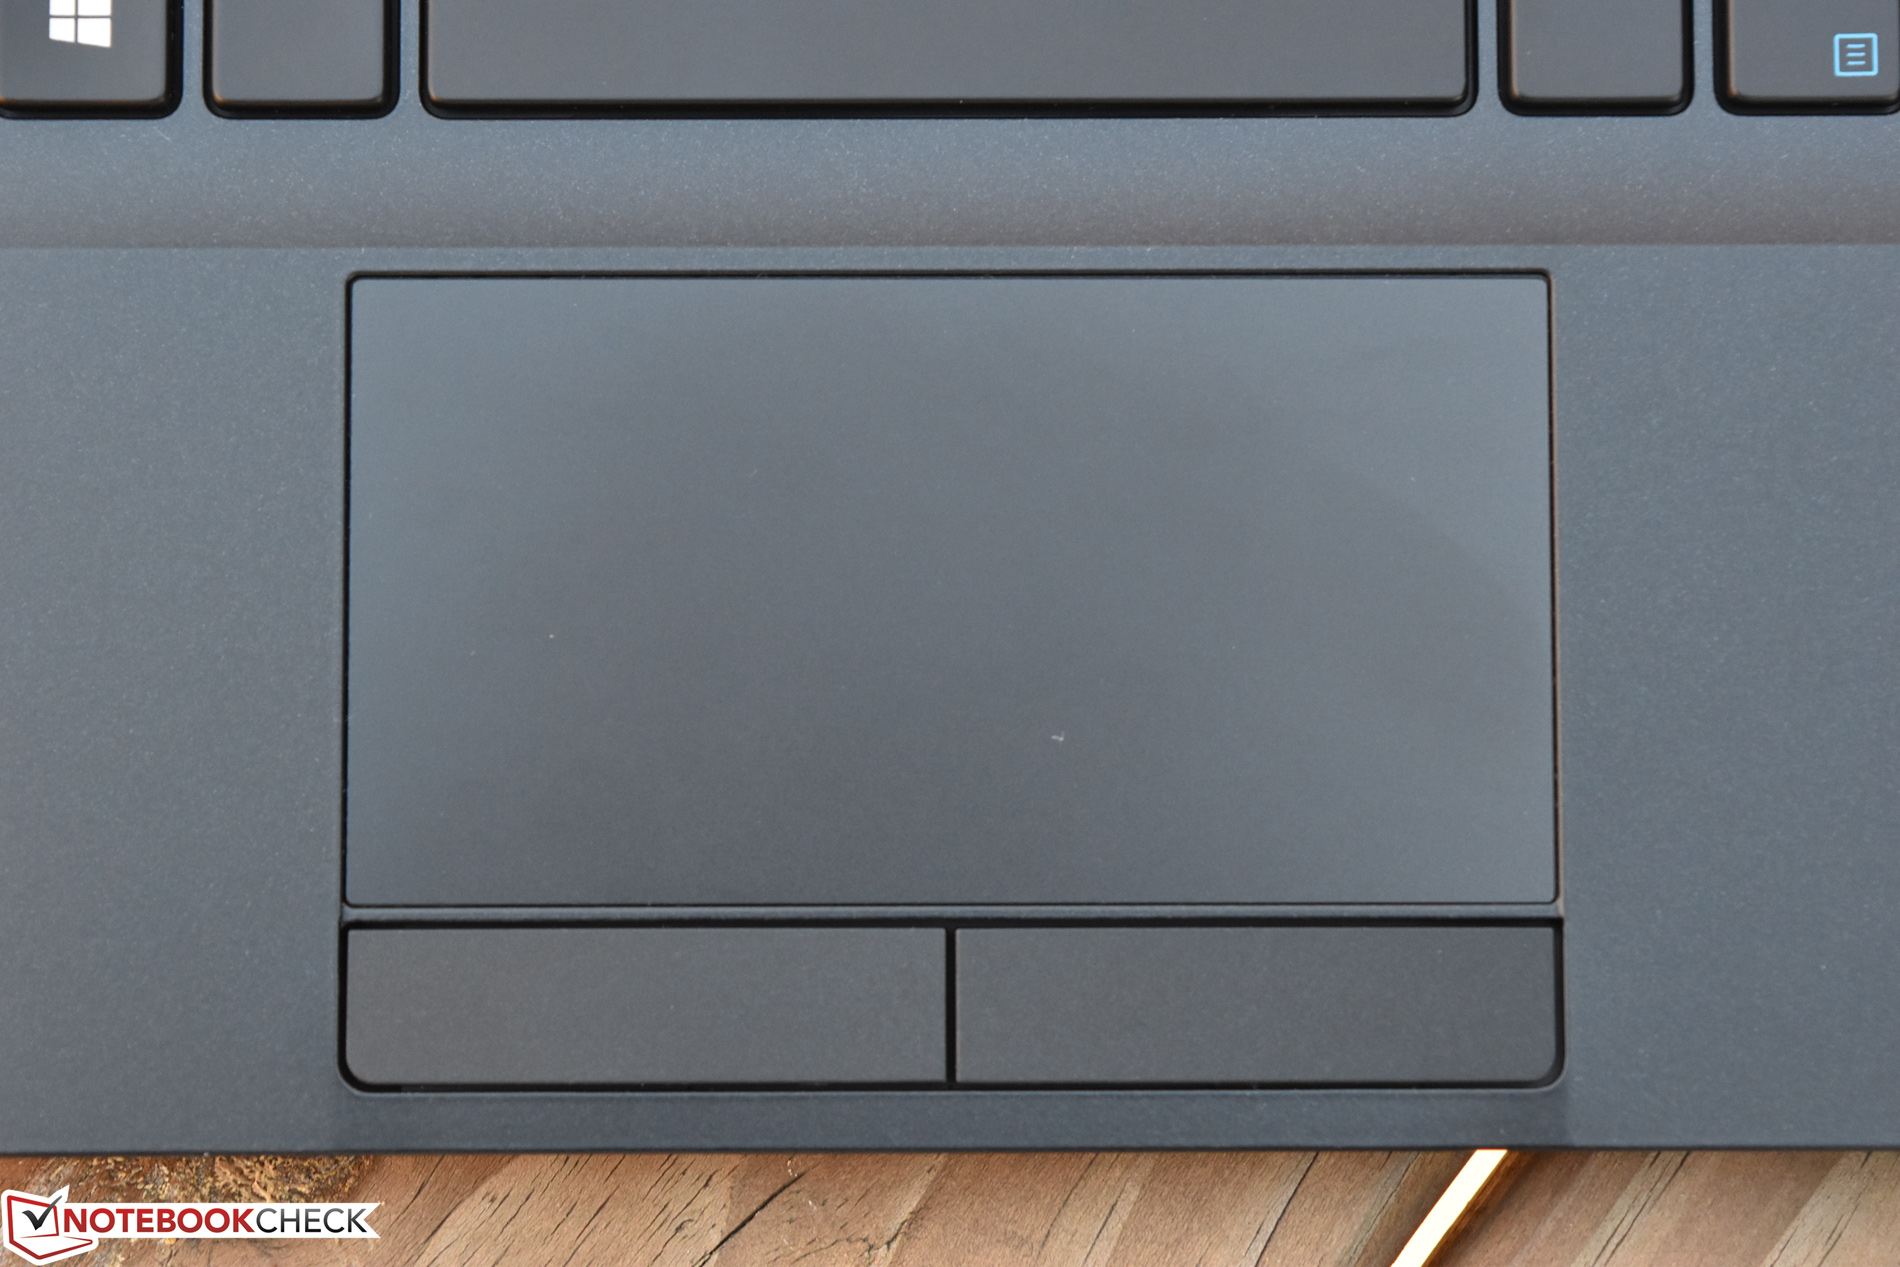
Por que escolher o Latitude 7380 quando a Dell já produz um portátil ultraportátil de excelente qualidade com o seu XPS 13? Principalmente devido às sensibilidades de negócio que são implicadas pela marca Latitude. Além do seu estilo preto, elegante e discreto, o 7380 oferece um teclado superior, um touchpad com botões físicos separados, uma porta Ethernet, uma garantia mais longa e opções de manutenção muito mais flexíveis. Custa um pouco mais do que o XPS, mas é um pequeno preço a pagar se o trabalho for feito.
Dell Latitude 13 7380
- 12/06/2017 v6 (old)
Steve Schardein
Price comparison
