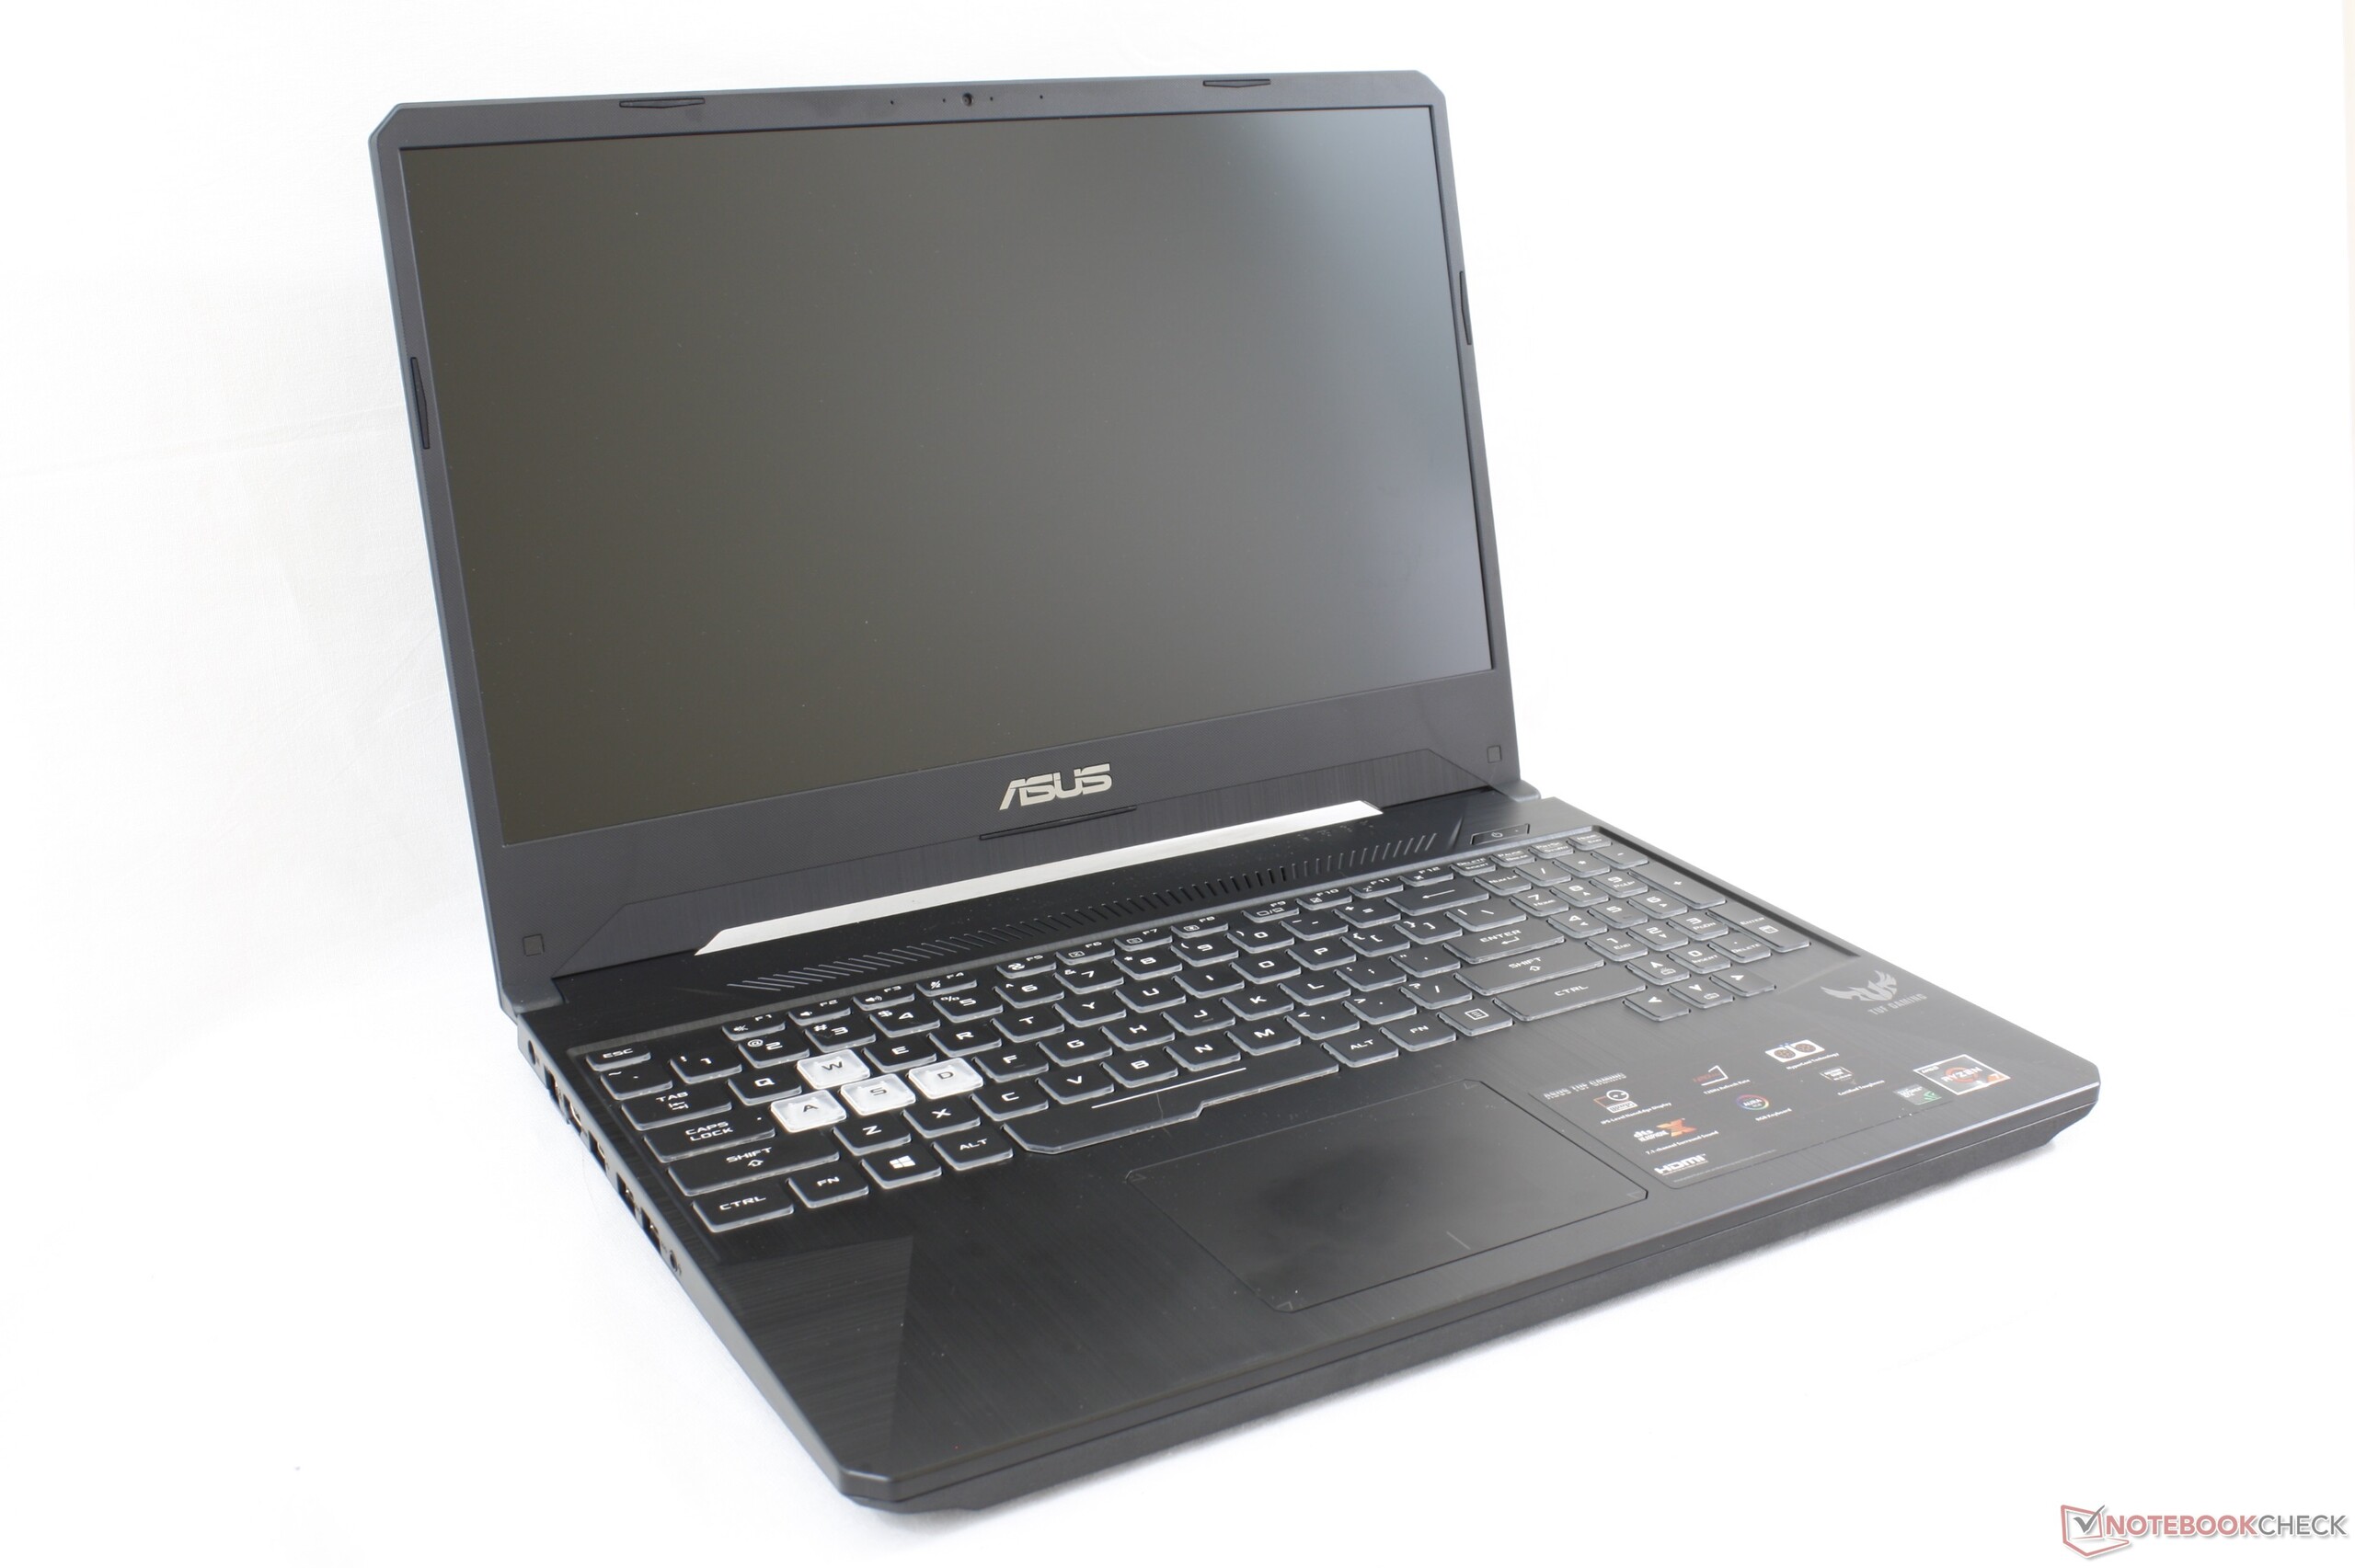
Não requer Intel: Breve Análise do Portátil Asus TUF FX505DT com Ryzen 7 e GeForce GTX 1650
| |||||||||||||||||||||||||
iluminação: 84 %
iluminação com acumulador: 286.2 cd/m²
Contraste: 867:1 (Preto: 0.33 cd/m²)
ΔE ColorChecker Calman: 5.45 | ∀{0.5-29.43 Ø4.71}
calibrated: 4.47
ΔE Greyscale Calman: 5.3 | ∀{0.09-98 Ø4.96}
59.1% sRGB (Argyll 1.6.3 3D)
37.6% AdobeRGB 1998 (Argyll 1.6.3 3D)
40.91% AdobeRGB 1998 (Argyll 3D)
59.5% sRGB (Argyll 3D)
39.56% Display P3 (Argyll 3D)
Gamma: 2.1
CCT: 7679 K
| Asus TUF FX505DT-EB73 Panda LM156LF-GL, IPS, 15.6", 1920x1080 | Asus Zephyrus S GX502GW AU Optronics B156HAN08.2 (AUO82ED), IPS, 15.6", 1920x1080 | Asus FX504GD AU Optronics B156HTN03.8, TN LED, 15.6", 1920x1080 | Acer Aspire Nitro 5 AN515-54-53Z2 LG LP156WFC-SPD1 (LGD0563), IPS, 15.6", 1920x1080 | Asus TUF FX505DY Panda LM156LF-CL03, IPS, 15.6", 1920x1080 | MSI GF63 8RC AU Optronics B156HAN02.1, IPS, 15.6", 1920x1080 | |
|---|---|---|---|---|---|---|
| Display | 59% | -6% | -4% | 1% | 0% | |
| Display P3 Coverage (%) | 39.56 | 64.9 64% | 37.09 -6% | 37.97 -4% | 40.04 1% | 39.43 0% |
| sRGB Coverage (%) | 59.5 | 91 53% | 55.8 -6% | 57 -4% | 60.2 1% | 59.3 0% |
| AdobeRGB 1998 Coverage (%) | 40.91 | 65.9 61% | 38.34 -6% | 39.23 -4% | 41.4 1% | 40.73 0% |
| Response Times | 72% | 4% | -18% | -30% | -4% | |
| Response Time Grey 50% / Grey 80% * (ms) | 30.4 ? | 7.2 ? 76% | 41.6 ? -37% | 42 ? -38% | 44.8 ? -47% | 33.2 ? -9% |
| Response Time Black / White * (ms) | 27.6 ? | 8.8 ? 68% | 15.2 ? 45% | 26.8 ? 3% | 30.8 ? -12% | 27.2 ? 1% |
| PWM Frequency (Hz) | 20830 ? | |||||
| Screen | 31% | -20% | 13% | 6% | 0% | |
| Brightness middle (cd/m²) | 286.2 | 286 0% | 260 -9% | 238 -17% | 211.5 -26% | 266.6 -7% |
| Brightness (cd/m²) | 267 | 275 3% | 241 -10% | 226 -15% | 200 -25% | 257 -4% |
| Brightness Distribution (%) | 84 | 90 7% | 85 1% | 83 -1% | 82 -2% | 89 6% |
| Black Level * (cd/m²) | 0.33 | 0.37 -12% | 0.55 -67% | 0.27 18% | 0.23 30% | 0.29 12% |
| Contrast (:1) | 867 | 773 -11% | 473 -45% | 881 2% | 920 6% | 919 6% |
| Colorchecker dE 2000 * | 5.45 | 2.19 60% | 7 -28% | 4.11 25% | 3.92 28% | 5.93 -9% |
| Colorchecker dE 2000 max. * | 18.08 | 4.4 76% | 22.52 -25% | 6.89 62% | 17.63 2% | 16.28 10% |
| Colorchecker dE 2000 calibrated * | 4.47 | 2.27 49% | 5.27 -18% | 3.76 16% | 4.16 7% | 3.6 19% |
| Greyscale dE 2000 * | 5.3 | 2.2 58% | 6.1 -15% | 1.78 66% | 3.1 42% | 6.8 -28% |
| Gamma | 2.1 105% | 2.41 91% | 1.97 112% | 2.41 91% | 2.23 99% | 2.43 91% |
| CCT | 7679 85% | 6405 101% | 7894 82% | 6311 103% | 6578 99% | 7192 90% |
| Color Space (Percent of AdobeRGB 1998) (%) | 37.6 | 59 57% | 35.5 -6% | 36 -4% | 38.1 1% | 37.6 0% |
| Color Space (Percent of sRGB) (%) | 59.1 | 91 54% | 61 3% | 57 -4% | 60 2% | 59.3 0% |
| Média Total (Programa/Configurações) | 54% /
41% | -7% /
-14% | -3% /
6% | -8% /
1% | -1% /
-0% |
* ... menor é melhor
Exibir tempos de resposta
| ↔ Tempo de resposta preto para branco | ||
|---|---|---|
| 27.6 ms ... ascensão ↗ e queda ↘ combinadas | ↗ 17.6 ms ascensão | 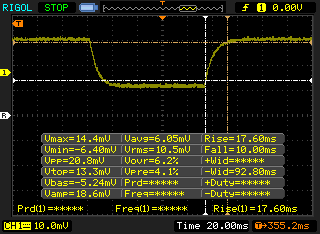 |
| ↘ 10 ms queda | ||
| A tela mostra taxas de resposta relativamente lentas em nossos testes e pode ser muito lenta para os jogadores. Em comparação, todos os dispositivos testados variam de 0.1 (mínimo) a 240 (máximo) ms. » 70 % de todos os dispositivos são melhores. Isso significa que o tempo de resposta medido é pior que a média de todos os dispositivos testados (19.8 ms). | ||
| ↔ Tempo de resposta 50% cinza a 80% cinza | ||
| 30.4 ms ... ascensão ↗ e queda ↘ combinadas | ↗ 14 ms ascensão | 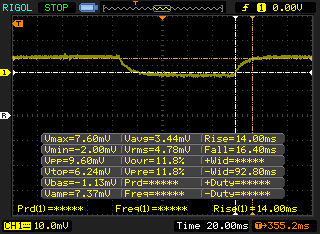 |
| ↘ 16.4 ms queda | ||
| A tela mostra taxas de resposta lentas em nossos testes e será insatisfatória para os jogadores. Em comparação, todos os dispositivos testados variam de 0.165 (mínimo) a 636 (máximo) ms. » 41 % de todos os dispositivos são melhores. Isso significa que o tempo de resposta medido é semelhante à média de todos os dispositivos testados (31 ms). | ||
Cintilação da tela / PWM (modulação por largura de pulso)
| Tela tremeluzindo / PWM não detectado | 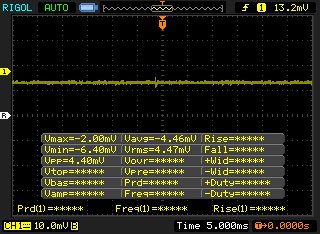 | ||
[pwm_comparison] Em comparação: 52 % de todos os dispositivos testados não usam PWM para escurecer a tela. Se PWM foi detectado, uma média de 7757 (mínimo: 5 - máximo: 343500) Hz foi medida. | |||
| PCMark 8 | |
| Home Score Accelerated v2 | |
| Média da turma Gaming (n=1últimos 2 anos) | |
| Asus TUF FX505DY | |
| Lenovo Legion Y730-15ICH i5-8300H | |
| Asus TUF FX505DT-EB73 | |
| Asus FX504GD | |
| Work Score Accelerated v2 | |
| Asus TUF FX505DY | |
| Lenovo Legion Y730-15ICH i5-8300H | |
| Asus FX504GD | |
| Asus TUF FX505DT-EB73 | |
| Média da turma Gaming (n=1últimos 2 anos) | |
| PCMark 8 Home Score Accelerated v2 | 3917 pontos | |
| PCMark 8 Work Score Accelerated v2 | 4701 pontos | |
| PCMark 10 Score | 4732 pontos | |
Ajuda | ||
| Asus TUF FX505DT-EB73 Intel SSD 660p SSDPEKNW512G8 | Asus TUF FX505DY WDC PC SN520 SDAPNUW-256G | Lenovo Legion Y530-15ICH Samsung SSD PM981 MZVLB256HAHQ | Acer Aspire 5 A515-52G-53PU Micron 1100 MTFDDAV256TBN | Razer Blade Stealth i7-8565U Lite-On CA3-8D256-Q11 | |
|---|---|---|---|---|---|
| AS SSD | 7% | 11% | -53% | 5% | |
| Seq Read (MB/s) | 1019 | 1059 4% | 1808 77% | 490.6 -52% | 1617 59% |
| Seq Write (MB/s) | 889 | 1180 33% | 1429 61% | 390.2 -56% | 1017 14% |
| 4K Read (MB/s) | 48.22 | 37.55 -22% | 46.1 -4% | 19.47 -60% | 40.03 -17% |
| 4K Write (MB/s) | 115.5 | 110.6 -4% | 97 -16% | 72.2 -37% | 103.4 -10% |
| 4K-64 Read (MB/s) | 321.5 | 619 93% | 536 67% | 236.2 -27% | 477.3 48% |
| 4K-64 Write (MB/s) | 787 | 502 -36% | 273.6 -65% | 276.7 -65% | 281.5 -64% |
| Access Time Read * (ms) | 0.065 | 0.087 -34% | 0.085 -31% | 0.069 -6% | |
| Access Time Write * (ms) | 0.047 | 0.034 28% | 0.038 19% | 0.063 -34% | 0.063 -34% |
| Score Read (Points) | 472 | 762 61% | 763 62% | 305 -35% | 679 44% |
| Score Write (Points) | 992 | 730 -26% | 514 -48% | 388 -61% | 487 -51% |
| Score Total (Points) | 1717 | 1899 11% | 1663 -3% | 850 -50% | 1495 -13% |
| Copy ISO MB/s (MB/s) | 942 | 1166 24% | 321.3 -66% | 1595 69% | |
| Copy Program MB/s (MB/s) | 444.5 | 507 14% | 141.7 -68% | 485.8 9% | |
| Copy Game MB/s (MB/s) | 867 | 480.3 -45% | 239.4 -72% | 1029 19% |
* ... menor é melhor

| 3DMark | |
| 1920x1080 Fire Strike Graphics | |
| MSI RTX 2060 Gaming Z 6G | |
| Aorus 15 W9 | |
| Aorus 15-SA | |
| Asus ROG Zephyrus G15 GA502DU | |
| Asus FX503VM-EH73 | |
| Asus TUF FX505DT-EB73 | |
| Gainward GeForce GTX 1650 4 GB | |
| Média NVIDIA GeForce GTX 1650 Mobile (7741 - 9810, n=32) | |
| Asus TUF FX705GE-EW096T | |
| Asus FX504GD | |
| Asus TUF FX505DY | |
| Asus Zenbook 14 UX433FN-A6023T | |
| 2560x1440 Time Spy Graphics | |
| MSI RTX 2060 Gaming Z 6G | |
| Aorus 15 W9 | |
| Aorus 15-SA | |
| Asus ROG Zephyrus G15 GA502DU | |
| Asus FX503VM-EH73 | |
| Asus TUF FX505DT-EB73 | |
| Gainward GeForce GTX 1650 4 GB | |
| Média NVIDIA GeForce GTX 1650 Mobile (2900 - 3700, n=31) | |
| Asus TUF FX705GE-EW096T | |
| Asus TUF FX505DY | |
| Asus FX504GD | |
| Asus Zenbook 14 UX433FN-A6023T | |
| 3DMark 11 | |
| 1280x720 Performance GPU | |
| MSI RTX 2060 Gaming Z 6G | |
| Aorus 15-SA | |
| Aorus 15 W9 | |
| Asus ROG Zephyrus G15 GA502DU | |
| Asus FX503VM-EH73 | |
| Gainward GeForce GTX 1650 4 GB | |
| Asus TUF FX505DT-EB73 | |
| Média NVIDIA GeForce GTX 1650 Mobile (10885 - 13575, n=30) | |
| Asus TUF FX705GE-EW096T | |
| Asus TUF FX505DY | |
| Asus FX504GD | |
| Asus Zenbook 14 UX433FN-A6023T | |
| 1280x720 Performance Combined | |
| MSI RTX 2060 Gaming Z 6G | |
| Aorus 15-SA | |
| Gainward GeForce GTX 1650 4 GB | |
| Aorus 15 W9 | |
| Média NVIDIA GeForce GTX 1650 Mobile (5870 - 12662, n=28) | |
| Asus TUF FX705GE-EW096T | |
| Asus FX503VM-EH73 | |
| Asus FX504GD | |
| Asus TUF FX505DT-EB73 | |
| Asus ROG Zephyrus G15 GA502DU | |
| Asus TUF FX505DY | |
| Asus Zenbook 14 UX433FN-A6023T | |
| 3DMark 11 Performance | 10963 pontos | |
| 3DMark Cloud Gate Standard Score | 21151 pontos | |
| 3DMark Fire Strike Score | 8154 pontos | |
| 3DMark Time Spy Score | 3559 pontos | |
Ajuda | ||
| Shadow of the Tomb Raider | |
| 1920x1080 Highest Preset AA:T | |
| MSI RTX 2060 Gaming Z 6G | |
| Alienware 17 R4 | |
| CUK Model Z GK5CQ7Z | |
| Zotac GeForce GTX 1660 Ti 6 GB | |
| MSI GL73 8SE-010US | |
| Asus ROG Zephyrus G15 GA502DU | |
| Acer Aspire Nitro 5 AN515-54-53Z2 | |
| Média NVIDIA GeForce GTX 1650 Mobile (34 - 47, n=15) | |
| Asus TUF FX505DT-EB73 | |
| Asus TUF FX705GE-EW096T | |
| Asus GL753VD | |
| Acer Nitro 5 AN515-42-R6V0 | |
| 1280x720 Lowest Preset | |
| CUK Model Z GK5CQ7Z | |
| MSI RTX 2060 Gaming Z 6G | |
| Zotac GeForce GTX 1660 Ti 6 GB | |
| Alienware 17 R4 | |
| Média NVIDIA GeForce GTX 1650 Mobile (57 - 128, n=13) | |
| MSI GL73 8SE-010US | |
| Asus GL753VD | |
| Asus TUF FX705GE-EW096T | |
| Asus ROG Zephyrus G15 GA502DU | |
| Asus TUF FX505DT-EB73 | |
| Acer Nitro 5 AN515-42-R6V0 | |
| The Witcher 3 - 1920x1080 Ultra Graphics & Postprocessing (HBAO+) | |
| MSI RTX 2060 Gaming Z 6G | |
| CUK Model Z GK5CQ7Z | |
| Zotac GeForce GTX 1660 Ti 6 GB | |
| MSI GL73 8SE-010US | |
| Asus ROG Zephyrus G15 GA502DU | |
| Asus TUF FX505DT-EB73 | |
| Média NVIDIA GeForce GTX 1650 Mobile (29.9 - 40.3, n=31) | |
| Acer Aspire Nitro 5 AN515-54-53Z2 | |
| Asus TUF FX705GE-EW096T | |
| Acer Nitro 5 AN515-42-R6V0 | |
| baixo | média | alto | ultra | |
|---|---|---|---|---|
| BioShock Infinite (2013) | 183.9 | 73.9 | ||
| The Witcher 3 (2015) | 146.4 | 62.7 | 36.2 | |
| Batman: Arkham Knight (2015) | 88 | 67 | 44 | |
| Rise of the Tomb Raider (2016) | 117.8 | 64.4 | 54.4 | |
| Ashes of the Singularity (2016) | 40 | 36 | ||
| Overwatch (2016) | 165.2 | 133.2 | 86.4 | |
| Rocket League (2017) | 213.9 | 162.5 | 127.5 | |
| Shadow of the Tomb Raider (2018) | 62 | 52 | 45 | 41 |
| Asus TUF FX505DT-EB73 GeForce GTX 1650 Mobile, R7 3750H, Intel SSD 660p SSDPEKNW512G8 | Asus Zephyrus S GX502GW GeForce RTX 2070 Mobile, i7-9750H, 2x Intel SSD 660p SSDPEKNW512G8 (RAID 0) | Asus FX504GD GeForce GTX 1050 Mobile, i5-8300H, Seagate Mobile HDD 1TB ST1000LX015-1U7172 | Acer Aspire Nitro 5 AN515-54-53Z2 GeForce GTX 1650 Mobile, i5-9300H, WDC PC SN520 SDAPNUW-512G | MSI GF63 8RC GeForce GTX 1050 Mobile, i5-8300H, Seagate BarraCuda Pro Compute 1TB ST1000LM049 | Asus TUF FX505DY Radeon RX 560X (Laptop), R5 3550H, WDC PC SN520 SDAPNUW-256G | Lenovo Legion Y530-15ICH GeForce GTX 1060 Mobile, i7-8750H, Samsung SSD PM981 MZVLB256HAHQ | |
|---|---|---|---|---|---|---|---|
| Noise | -15% | 1% | -6% | -4% | -1% | -2% | |
| desligado / ambiente * (dB) | 28.2 | 30 -6% | 28.1 -0% | 30 -6% | 28 1% | 28.2 -0% | 30.2 -7% |
| Idle Minimum * (dB) | 28.2 | 31 -10% | 29 -3% | 30 -6% | 33.8 -20% | 28.2 -0% | 30.9 -10% |
| Idle Average * (dB) | 28.2 | 33 -17% | 29.2 -4% | 31 -10% | 34 -21% | 28.2 -0% | 30.9 -10% |
| Idle Maximum * (dB) | 31.4 | 38 -21% | 29.7 5% | 33 -5% | 34.2 -9% | 28.2 10% | 31.6 -1% |
| Load Average * (dB) | 39.8 | 50 -26% | 44.3 -11% | 46 -16% | 37.3 6% | 43.9 -10% | 42.3 -6% |
| Witcher 3 ultra * (dB) | 47 | 53 -13% | 40.7 13% | 46 2% | 43.4 8% | 49 -4% | |
| Load Maximum * (dB) | 50.2 | 56 -12% | 47.7 5% | 49 2% | 46 8% | 50.6 -1% | 40 20% |
* ... menor é melhor
Barulho
| Ocioso |
| 28.2 / 28.2 / 31.4 dB |
| Carga |
| 39.8 / 50.2 dB |
 | ||
30 dB silencioso 40 dB(A) audível 50 dB(A) ruidosamente alto |
||
min: | ||
(±) A temperatura máxima no lado superior é 41.2 °C / 106 F, em comparação com a média de 40.4 °C / 105 F , variando de 21.2 a 68.8 °C para a classe Gaming.
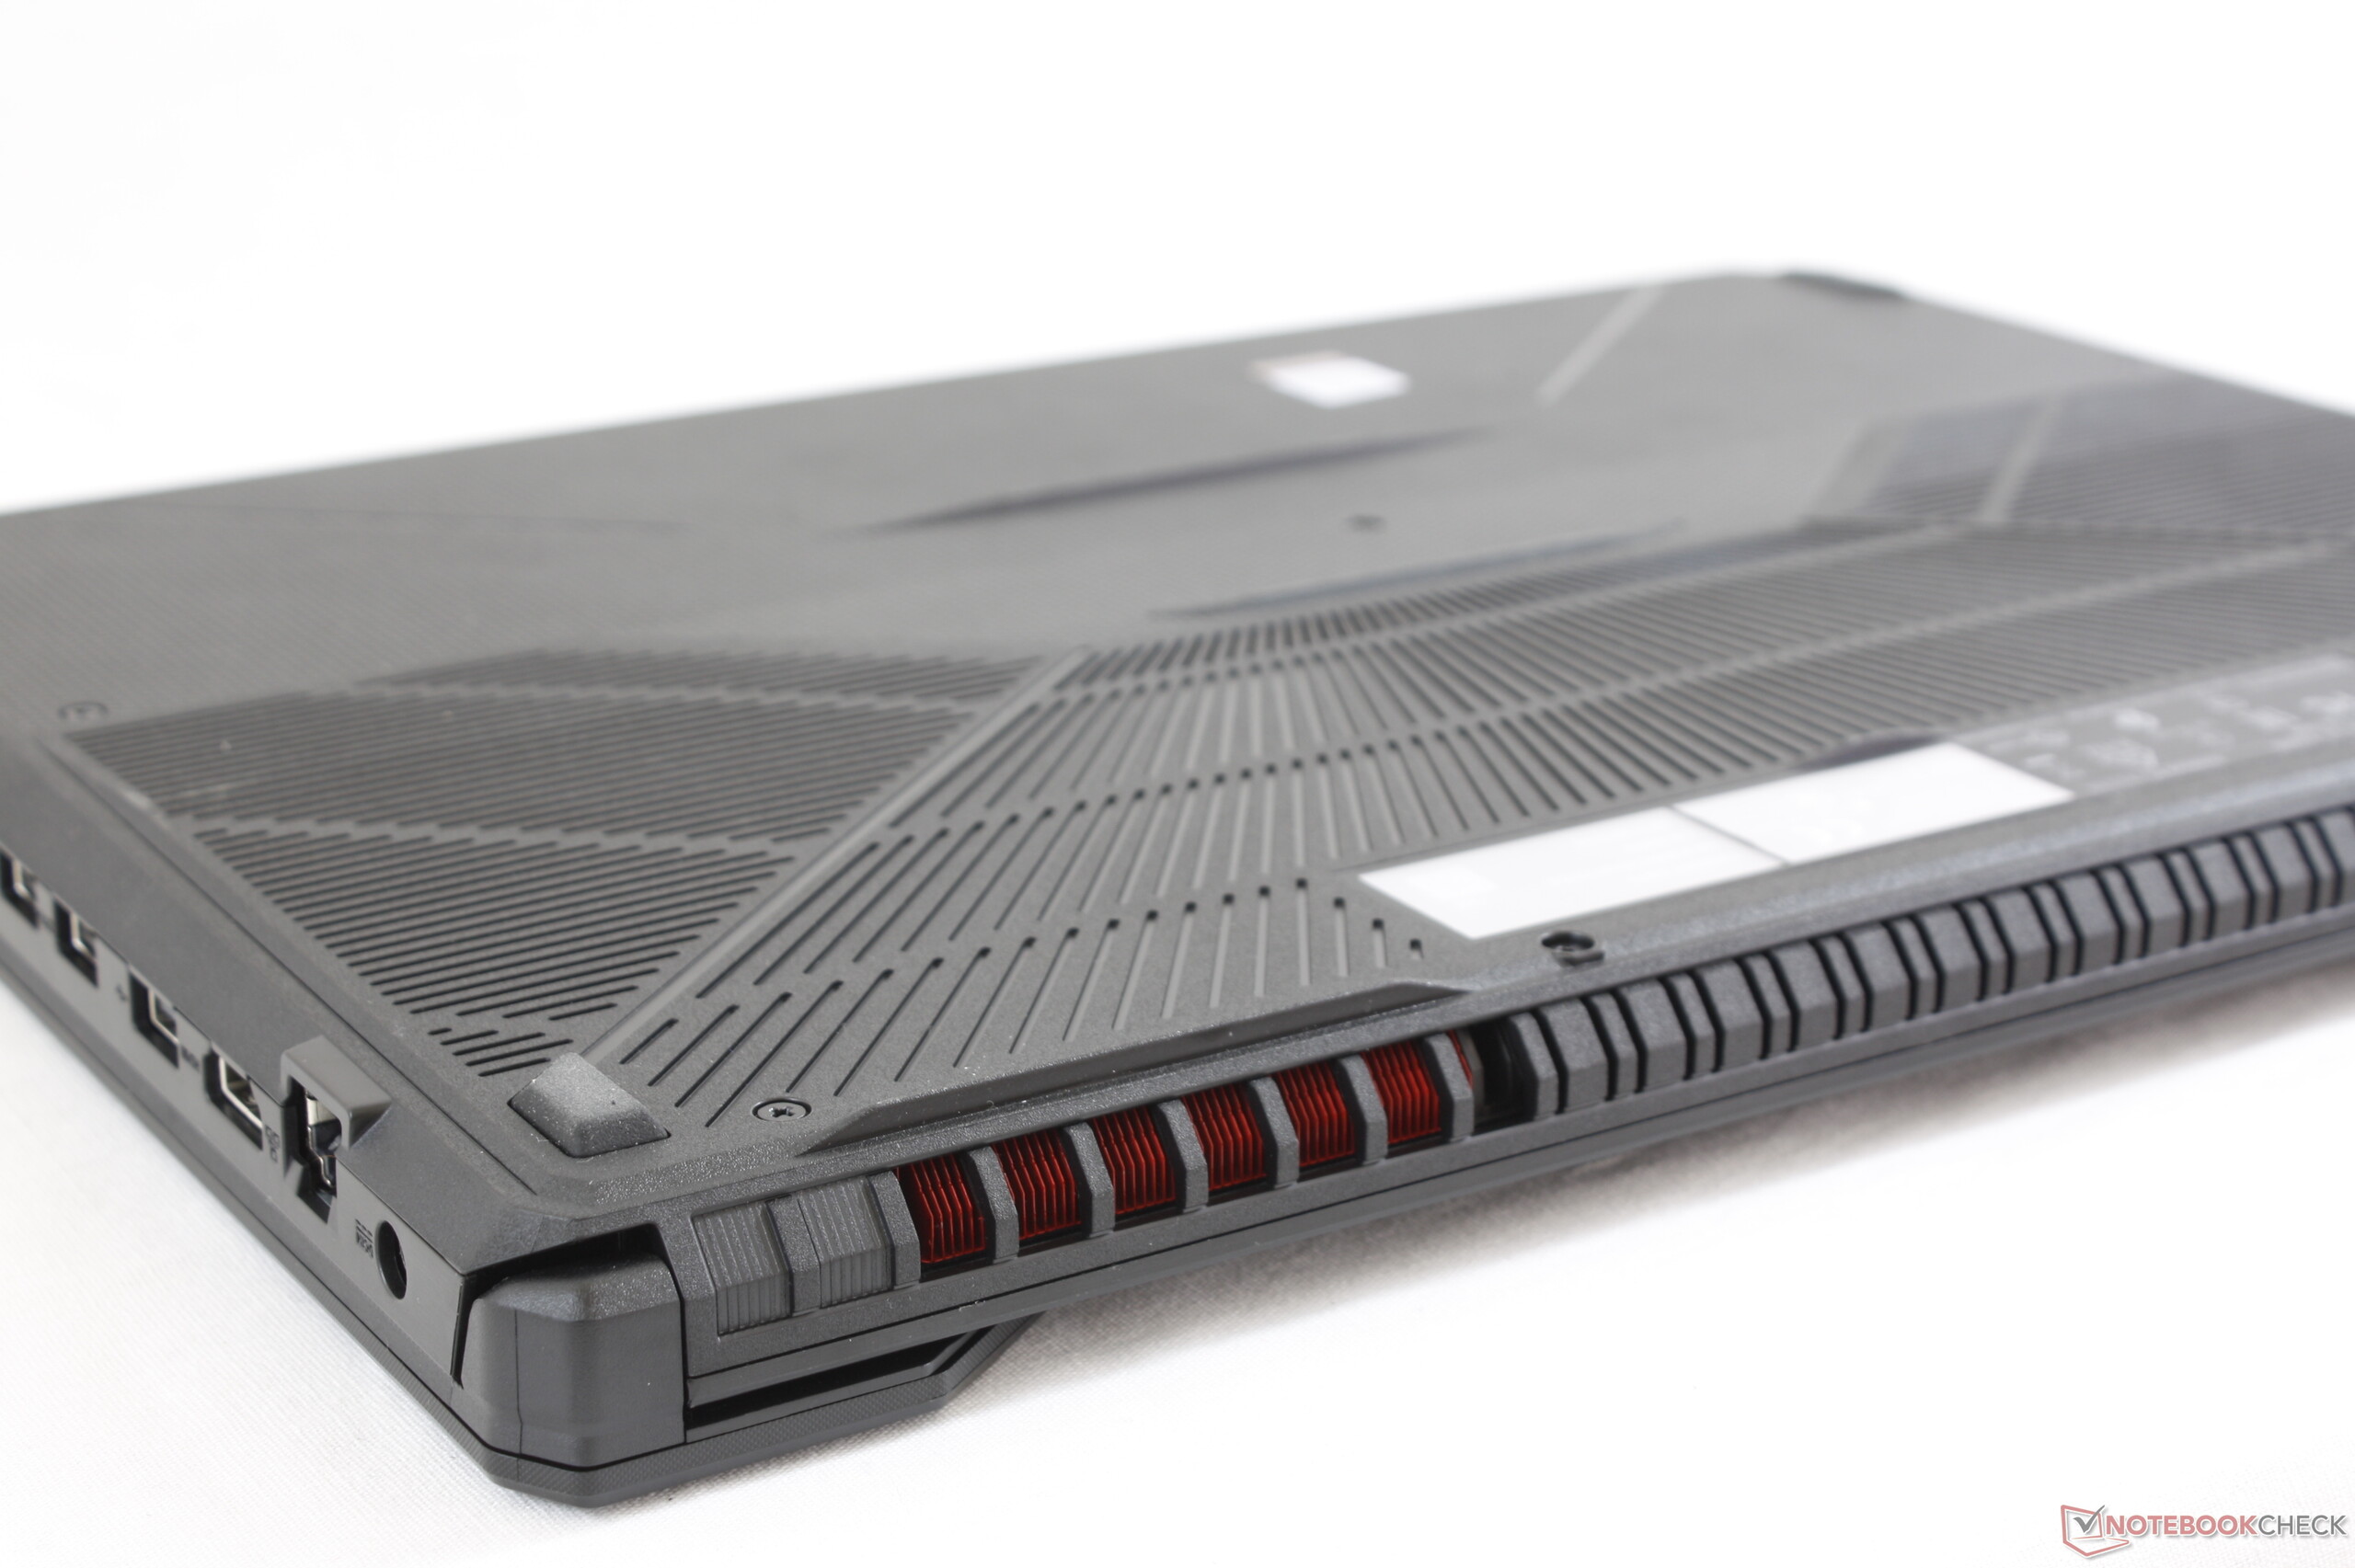
(±) A parte inferior aquece até um máximo de 40 °C / 104 F, em comparação com a média de 43.2 °C / 110 F
(+) Em uso inativo, a temperatura média para o lado superior é 30.7 °C / 87 F, em comparação com a média do dispositivo de 33.9 °C / ### class_avg_f### F.
(±) Jogando The Witcher 3, a temperatura média para o lado superior é 32.4 °C / 90 F, em comparação com a média do dispositivo de 33.9 °C / ## #class_avg_f### F.
(+) Os apoios para as mãos e o touchpad são mais frios que a temperatura da pele, com um máximo de 28.2 °C / 82.8 F e, portanto, são frios ao toque.
(±) A temperatura média da área do apoio para as mãos de dispositivos semelhantes foi 28.8 °C / 83.8 F (+0.6 °C / 1 F).
Asus TUF FX505DT-EB73 análise de áudio
(±) | o volume do alto-falante é médio, mas bom (###valor### dB)
Analysis not possible as minimum curve is missing or too high
Apple MacBook 12 (Early 2016) 1.1 GHz análise de áudio
(+) | os alto-falantes podem tocar relativamente alto (###valor### dB)
Graves 100 - 315Hz
(±) | graves reduzidos - em média 11.3% menor que a mediana
(±) | a linearidade dos graves é média (14.2% delta para a frequência anterior)
Médios 400 - 2.000 Hz
(+) | médios equilibrados - apenas 2.4% longe da mediana
(+) | médios são lineares (5.5% delta para frequência anterior)
Altos 2 - 16 kHz
(+) | agudos equilibrados - apenas 2% longe da mediana
(+) | os máximos são lineares (4.5% delta da frequência anterior)
Geral 100 - 16.000 Hz
(+) | o som geral é linear (10.2% diferença em relação à mediana)
Comparado com a mesma classe
» 7% de todos os dispositivos testados nesta classe foram melhores, 2% semelhantes, 90% piores
» O melhor teve um delta de 5%, a média foi 18%, o pior foi 53%
Comparado com todos os dispositivos testados
» 5% de todos os dispositivos testados foram melhores, 1% semelhantes, 94% piores
» O melhor teve um delta de 4%, a média foi 23%, o pior foi 134%
| desligado | |
| Ocioso | |
| Carga |
|
Key:
min: | |
| Asus TUF FX505DT-EB73 R7 3750H, GeForce GTX 1650 Mobile, Intel SSD 660p SSDPEKNW512G8, IPS, 1920x1080, 15.6" | Asus Zephyrus S GX502GW i7-9750H, GeForce RTX 2070 Mobile, 2x Intel SSD 660p SSDPEKNW512G8 (RAID 0), IPS, 1920x1080, 15.6" | Asus FX504GD i5-8300H, GeForce GTX 1050 Mobile, Seagate Mobile HDD 1TB ST1000LX015-1U7172, TN LED, 1920x1080, 15.6" | Acer Aspire Nitro 5 AN515-54-53Z2 i5-9300H, GeForce GTX 1650 Mobile, WDC PC SN520 SDAPNUW-512G, IPS, 1920x1080, 15.6" | Asus TUF FX505DY R5 3550H, Radeon RX 560X (Laptop), WDC PC SN520 SDAPNUW-256G, IPS, 1920x1080, 15.6" | Lenovo Legion Y7000P-1060 i7-8750H, GeForce GTX 1060 Mobile, Samsung SSD PM981 MZVLB256HAHQ, IPS, 1920x1080, 15.6" | |
|---|---|---|---|---|---|---|
| Power Consumption | -138% | -2% | 7% | 13% | -19% | |
| Idle Minimum * (Watt) | 7 | 24 -243% | 7.2 -3% | 5 29% | 5.2 26% | 4.9 30% |
| Idle Average * (Watt) | 9.9 | 27 -173% | 10.2 -3% | 7 29% | 7.5 24% | 8.1 18% |
| Idle Maximum * (Watt) | 12 | 33 -175% | 10.9 9% | 11 8% | 9.4 22% | 16.5 -38% |
| Load Average * (Watt) | 68.4 | 129 -89% | 93.3 -36% | 89 -30% | 73 -7% | 109.2 -60% |
| Witcher 3 ultra * (Watt) | 94.9 | 176 -85% | 95.8 -1% | 90 5% | 90 5% | 124.6 -31% |
| Load Maximum * (Watt) | 130.9 | 216 -65% | 102.5 22% | 132 -1% | 120.7 8% | 175.2 -34% |
* ... menor é melhor
| Asus TUF FX505DT-EB73 R7 3750H, GeForce GTX 1650 Mobile, 48 Wh | Asus Zephyrus S GX502GW i7-9750H, GeForce RTX 2070 Mobile, 76 Wh | Asus FX504GD i5-8300H, GeForce GTX 1050 Mobile, 48 Wh | Acer Aspire Nitro 5 AN515-54-53Z2 i5-9300H, GeForce GTX 1650 Mobile, 57 Wh | MSI GF63 8RC i5-8300H, GeForce GTX 1050 Mobile, 51 Wh | Asus TUF FX505DY R5 3550H, Radeon RX 560X (Laptop), 48 Wh | |
|---|---|---|---|---|---|---|
| Duração da bateria | -27% | -22% | 64% | -1% | 11% | |
| Reader / Idle (h) | 7.8 | 5.9 -24% | 7.5 -4% | 17.4 123% | 9.5 22% | 8.7 12% |
| WiFi v1.3 (h) | 4.8 | 3.7 -23% | 3.7 -23% | 8.1 69% | 5.5 15% | 5.5 15% |
| Load (h) | 1.5 | 1 -33% | 0.9 -40% | 1.5 0% | 0.9 -40% | 1.6 7% |
Pro
Contra

Como acontece com a maioria dos PCs equipados com AMD, uma grande vantagem do Asus TUF FX505DT é o seu preço. Esse sistema de US $ 900 vem equipado com uma tela de 120 Hz e um SSD NVMe de 512 GB, enquanto uma alternativa com preço similar com uma CPU Core i5-9300H e a mesma GPU GTX 1650 teria apenas uma tela padrão de 60 Hz e metade da capacidade de armazenamento do SSD. Você recebe mais recursos pelo dinheiro sem sacrificar muito o desempenho dos jogos e os benefícios de uma taxa de atualização nativa de 120 Hz são tangíveis, mesmo que a maioria dos jogos não consiga atingir uma velocidade estável de 120 FPS.
O desempenho em resoluções ou configurações gráficas mais baixas pode ser melhor, pois os jogos se tornam muito mais rápidos no Ryzen 7 do que em um Core i5 equivalente. Recomendamos apontar para 30 FPS ou 60 FPS para aproveitar ao máximo da combinação Ryzen 7 e GeForce GTX 1650. Se as taxas de quadros muito altas são uma prioridade, então seria melhor usar um PC Intel Core i7 e GeForce padrão.
Quanto ao chassi em si, a Asus definitivamente poderia melhorar os ventiladores durante os jogos, a duração média da bateria, o clickpad pegajoso ou a tampa flexível. O G-Sync teria sido uma ótima opção aqui, especialmente porque a GTX 1650 tende a rodar jogos mais novos na faixa de 40 a 60 FPS, onde o G-Sync está no seu melhor momento. Mesmo com essas desvantagens em mente, o FX505DT ainda é uma máquina de jogos leve e muito equilibrada para sua categoria de orçamento não muito diferente do file:///D:/i.e/2019/Julio/Jul-05%20-%20NBC/Breve%20An%C3%A1lise%20do%20Port%C3%A1til%20Asus%20ROG%20Zephyrus%20G%20GA502DU%20(Ryzen%20-7%203750H,%20GTX%20-1660%20Ti%20Max-Q). Só não se esqueça de evitar o FX505DY a qualquer custo!
Antes do lançamento do Ryzen, era difícil recomendar qualquer portátil de jogos com processador AMD inclusive para jogadores casuais. O Asus TUF FX505DT e até mesmo o Zephyrus G GA502 tornaram os portáteis da AMD opções reais novamente para os gamers com orçamentos menores.
Asus TUF FX505DT-EB73
- 07/04/2019 v6 (old)
Allen Ngo
Price comparison
