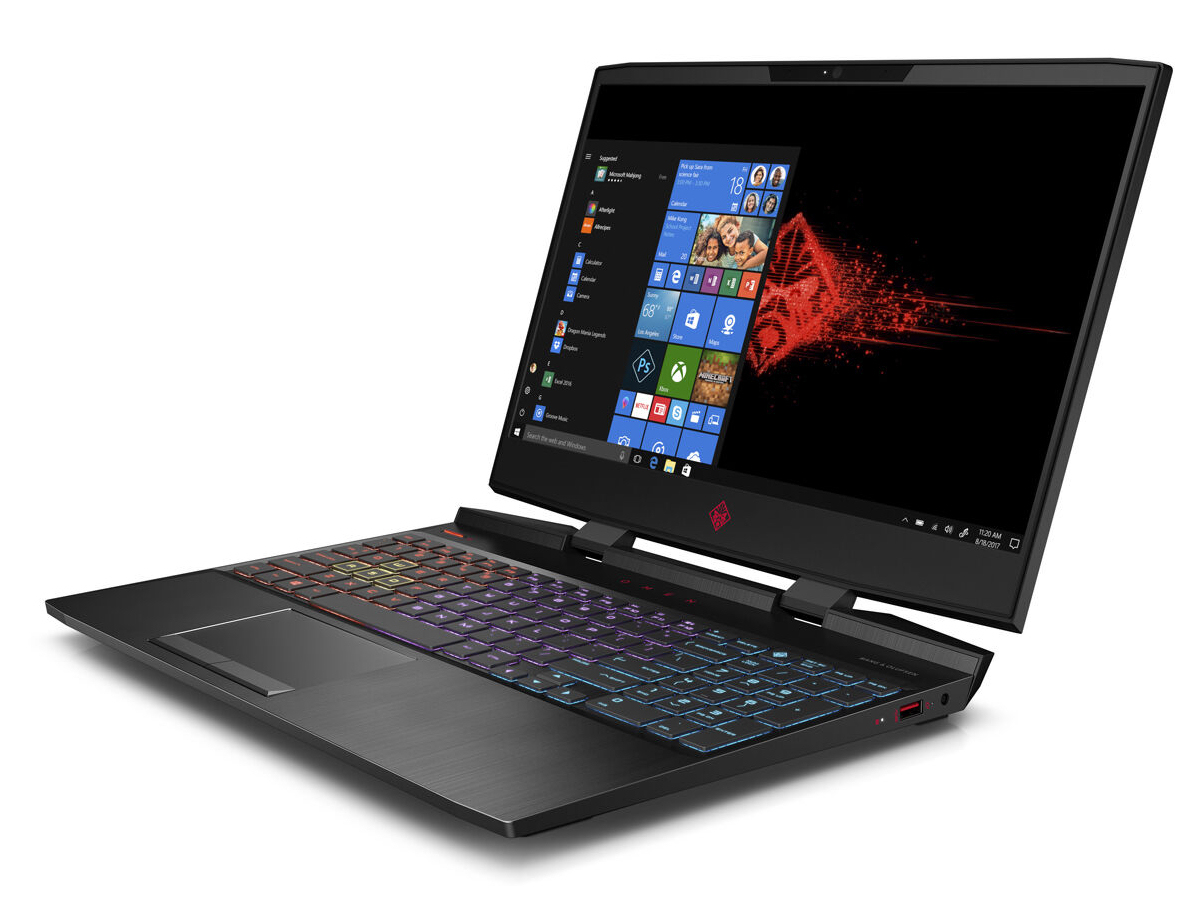
Breve Análise do HP Omen 15: gamer acessível de nível de entrada com uma duração de bateria decente
| SD Card Reader | |
| average JPG Copy Test (av. of 3 runs) | |
| Média da turma Gaming (20.9 - 210, n=54, últimos 2 anos) | |
| HP Omen 15-dc1020ng (Toshiba Exceria Pro SDXC 64 GB UHS-II) | |
| HP Omen 15-dc1303ng (Toshiba Exceria Pro SDXC 64 GB UHS-II) | |
| Dell G5 15 5590 (Toshiba Exceria Pro SDXC 64 GB UHS-II) | |
| maximum AS SSD Seq Read Test (1GB) | |
| Média da turma Gaming (25.5 - 261, n=51, últimos 2 anos) | |
| HP Omen 15-dc1020ng (Toshiba Exceria Pro SDXC 64 GB UHS-II) | |
| HP Omen 15-dc1303ng (Toshiba Exceria Pro SDXC 64 GB UHS-II) | |
| Dell G5 15 5590 (Toshiba Exceria Pro SDXC 64 GB UHS-II) | |
| |||||||||||||||||||||||||
iluminação: 76 %
iluminação com acumulador: 216 cd/m²
Contraste: 1476:1 (Preto: 0.17 cd/m²)
ΔE ColorChecker Calman: 6.2 | ∀{0.5-29.43 Ø4.73}
calibrated: 4.8
ΔE Greyscale Calman: 4.2 | ∀{0.09-98 Ø4.97}
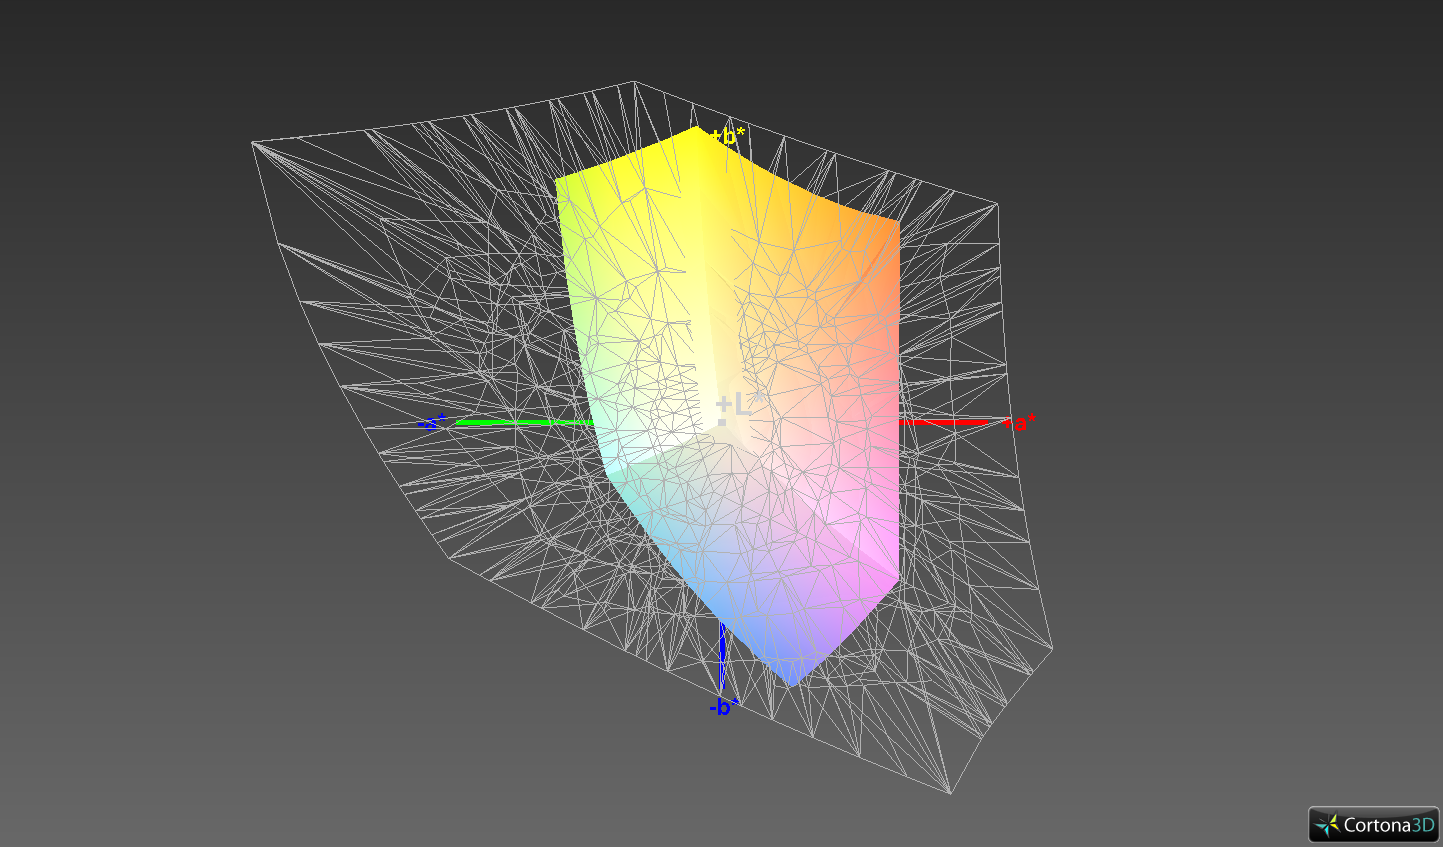
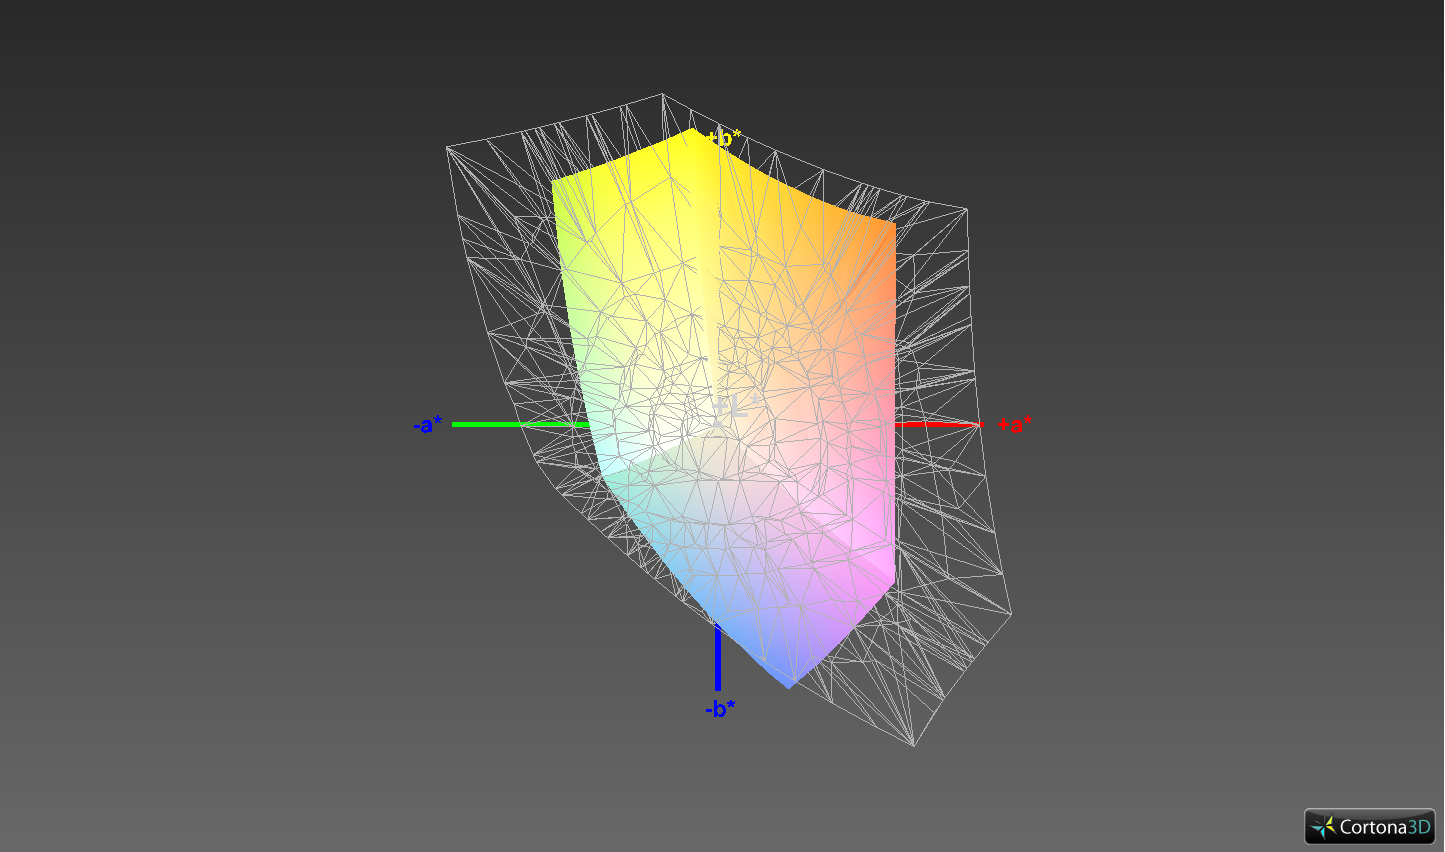
57.4% sRGB (Argyll 1.6.3 3D)
36.5% AdobeRGB 1998 (Argyll 1.6.3 3D)
39.69% AdobeRGB 1998 (Argyll 3D)
57.6% sRGB (Argyll 3D)
38.37% Display P3 (Argyll 3D)
Gamma: 2.32
CCT: 7454 K
| HP Omen 15-dc1020ng IPS, 1920x1080, 15.6" | HP Omen 15-dc1303ng IPS, 1920x1080, 15.6" | Asus TUF FX505DT-EB73 IPS, 1920x1080, 15.6" | Asus ROG Zephyrus G15 GA502DU IPS, 1920x1080, 15.6" | Acer Aspire Nitro 5 AN515-54-53Z2 IPS, 1920x1080, 15.6" | Dell G5 15 5590 IPS, 1920x1080, 15.6" | Asus TUF FX505DY IPS, 1920x1080, 15.6" | |
|---|---|---|---|---|---|---|---|
| Display | 64% | 3% | 5% | -1% | 2% | 4% | |
| Display P3 Coverage (%) | 38.37 | 63.8 66% | 39.56 3% | 40.33 5% | 37.97 -1% | 39.26 2% | 40.04 4% |
| sRGB Coverage (%) | 57.6 | 93.4 62% | 59.5 3% | 60.6 5% | 57 -1% | 59.1 3% | 60.2 5% |
| AdobeRGB 1998 Coverage (%) | 39.69 | 65 64% | 40.91 3% | 41.69 5% | 39.23 -1% | 40.56 2% | 41.4 4% |
| Response Times | 64% | 16% | 10% | 2% | -7% | -8% | |
| Response Time Grey 50% / Grey 80% * (ms) | 40 ? | 14 ? 65% | 30.4 ? 24% | 34 ? 15% | 42 ? -5% | 45 ? -13% | 44.8 ? -12% |
| Response Time Black / White * (ms) | 29.6 ? | 11 ? 63% | 27.6 ? 7% | 28 ? 5% | 26.8 ? 9% | 30 ? -1% | 30.8 ? -4% |
| PWM Frequency (Hz) | 21280 ? | 20830 ? | |||||
| Screen | 21% | -8% | -5% | 7% | -12% | -0% | |
| Brightness middle (cd/m²) | 251 | 316 26% | 286.2 14% | 240.1 -4% | 238 -5% | 234 -7% | 211.5 -16% |
| Brightness (cd/m²) | 232 | 295 27% | 267 15% | 231 0% | 226 -3% | 219 -6% | 200 -14% |
| Brightness Distribution (%) | 76 | 84 11% | 84 11% | 85 12% | 83 9% | 82 8% | 82 8% |
| Black Level * (cd/m²) | 0.17 | 0.42 -147% | 0.33 -94% | 0.34 -100% | 0.27 -59% | 0.17 -0% | 0.23 -35% |
| Contrast (:1) | 1476 | 752 -49% | 867 -41% | 706 -52% | 881 -40% | 1376 -7% | 920 -38% |
| Colorchecker dE 2000 * | 6.2 | 2.7 56% | 5.45 12% | 4.2 32% | 4.11 34% | 8.6 -39% | 3.92 37% |
| Colorchecker dE 2000 max. * | 18.6 | 5.65 70% | 18.08 3% | 17.8 4% | 6.89 63% | 17.49 6% | 17.63 5% |
| Colorchecker dE 2000 calibrated * | 4.8 | 1.58 67% | 4.47 7% | 4.09 15% | 3.76 22% | 4.06 15% | 4.16 13% |
| Greyscale dE 2000 * | 4.2 | 2.35 44% | 5.3 -26% | 2.8 33% | 1.78 58% | 8.55 -104% | 3.1 26% |
| Gamma | 2.32 95% | 2.41 91% | 2.1 105% | 2.2 100% | 2.41 91% | 3.02 73% | 2.23 99% |
| CCT | 7454 87% | 6904 94% | 7679 85% | 6925 94% | 6311 103% | 7802 83% | 6578 99% |
| Color Space (Percent of AdobeRGB 1998) (%) | 36.5 | 60 64% | 37.6 3% | 38.4 5% | 36 -1% | 37 1% | 38.1 4% |
| Color Space (Percent of sRGB) (%) | 57.4 | 93 62% | 59.1 3% | 60.4 5% | 57 -1% | 59 3% | 60 5% |
| Média Total (Programa/Configurações) | 50% /
34% | 4% /
-3% | 3% /
-1% | 3% /
5% | -6% /
-9% | -1% /
-1% |
* ... menor é melhor
Exibir tempos de resposta
| ↔ Tempo de resposta preto para branco | ||
|---|---|---|
| 29.6 ms ... ascensão ↗ e queda ↘ combinadas | ↗ 17.2 ms ascensão | 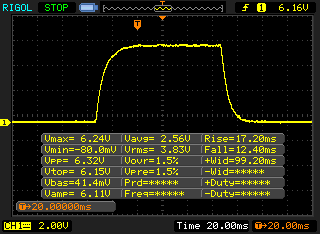 |
| ↘ 12.4 ms queda | ||
| A tela mostra taxas de resposta relativamente lentas em nossos testes e pode ser muito lenta para os jogadores. Em comparação, todos os dispositivos testados variam de 0.1 (mínimo) a 240 (máximo) ms. » 79 % de todos os dispositivos são melhores. Isso significa que o tempo de resposta medido é pior que a média de todos os dispositivos testados (19.9 ms). | ||
| ↔ Tempo de resposta 50% cinza a 80% cinza | ||
| 40 ms ... ascensão ↗ e queda ↘ combinadas | ↗ 21.2 ms ascensão | 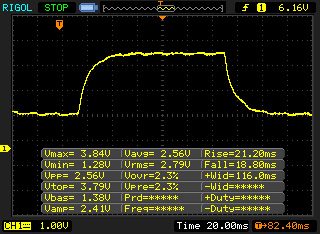 |
| ↘ 18.8 ms queda | ||
| A tela mostra taxas de resposta lentas em nossos testes e será insatisfatória para os jogadores. Em comparação, todos os dispositivos testados variam de 0.165 (mínimo) a 636 (máximo) ms. » 61 % de todos os dispositivos são melhores. Isso significa que o tempo de resposta medido é pior que a média de todos os dispositivos testados (31.1 ms). | ||
Cintilação da tela / PWM (modulação por largura de pulso)
| Tela tremeluzindo / PWM não detectado | 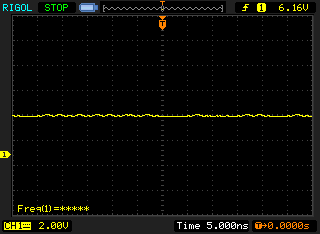 | ||
[pwm_comparison] Em comparação: 52 % de todos os dispositivos testados não usam PWM para escurecer a tela. Se PWM foi detectado, uma média de 7784 (mínimo: 5 - máximo: 343500) Hz foi medida. | |||

| Geekbench 3 | |
| 32 Bit Multi-Core Score | |
| Dell G5 15 5590 | |
| Média Intel Core i5-9300H (14195 - 16101, n=4) | |
| HP Omen 15-dc1020ng | |
| 32 Bit Single-Core Score | |
| Dell G5 15 5590 | |
| Média Intel Core i5-9300H (3596 - 4109, n=4) | |
| HP Omen 15-dc1020ng | |
| Geekbench 4.4 | |
| 64 Bit Multi-Core Score | |
| Média da turma Gaming (89200 - 97490, n=2, últimos 2 anos) | |
| Dell G5 15 5590 | |
| HP Omen 15-dc1020ng (Dual-Channel-Modus) | |
| Média Intel Core i5-9300H (14853 - 17684, n=7) | |
| HP Omen 15-dc1020ng | |
| Asus ROG Zephyrus G15 GA502DU | |
| 64 Bit Single-Core Score | |
| Média da turma Gaming (9335 - 9492, n=2, últimos 2 anos) | |
| HP Omen 15-dc1020ng (Dual-Channel-Modus) | |
| Média Intel Core i5-9300H (4704 - 5089, n=7) | |
| HP Omen 15-dc1020ng | |
| Dell G5 15 5590 | |
| Asus ROG Zephyrus G15 GA502DU | |
| Mozilla Kraken 1.1 - Total | |
| Asus TUF FX505DT-EB73 (Edge 44.17763.1.0) | |
| Média Intel Core i5-9300H (1079 - 1349, n=8) | |
| Dell G5 15 5590 (Edge 44) | |
| HP Omen 15-dc1020ng (Edge 44) | |
| HP Omen 15-dc1303ng | |
| Média da turma Gaming (391 - 590, n=104, últimos 2 anos) | |
| Octane V2 - Total Score | |
| Média da turma Gaming (89353 - 139447, n=29, últimos 2 anos) | |
| HP Omen 15-dc1303ng | |
| HP Omen 15-dc1020ng (Edge 44) | |
| Dell G5 15 5590 (Edge 44) | |
| Média Intel Core i5-9300H (22225 - 34957, n=7) | |
| Asus TUF FX505DT-EB73 (Edge 44.17763.1.0) | |
| Asus ROG Zephyrus G15 GA502DU (Edge 44.17763.1.0) | |
| JetStream 1.1 - 1.1 Total | |
| Média da turma Gaming (533 - 647, n=4, últimos 2 anos) | |
| Dell G5 15 5590 (Edge 44) | |
| HP Omen 15-dc1020ng (Edge 44) | |
| Média Intel Core i5-9300H (150.3 - 254, n=7) | |
| Asus TUF FX505DT-EB73 (Edge 44.17763.1.0) | |
| HP Omen 15-dc1303ng | |
| Asus ROG Zephyrus G15 GA502DU (Edge 44.17763.1.0) | |
* ... menor é melhor
| PCMark 7 Score | 6369 pontos | |
| PCMark 8 Home Score Accelerated v2 | 3691 pontos | |
| PCMark 8 Creative Score Accelerated v2 | 3609 pontos | |
| PCMark 8 Work Score Accelerated v2 | 5107 pontos | |
| PCMark 10 Score | 4873 pontos | |
Ajuda | ||

| HP Omen 15-dc1020ng WDC PC SN720 SDAQNTW-512G | Asus TUF FX505DT-EB73 Intel SSD 660p SSDPEKNW512G8 | Asus ROG Zephyrus G15 GA502DU Intel SSD 660p SSDPEKNW512G8 | Acer Aspire Nitro 5 AN515-54-53Z2 WDC PC SN520 SDAPNUW-512G | Dell G5 15 5590 KBG30ZMS128G | HP Omen 15-dc1303ng Samsung SSD PM981 MZVLB256HAHQ | Média WDC PC SN720 SDAQNTW-512G | |
|---|---|---|---|---|---|---|---|
| CrystalDiskMark 5.2 / 6 | -21% | -26% | -23% | -64% | -14% | 23% | |
| Write 4K (MB/s) | 112.1 | 137.5 23% | 132.2 18% | 109.1 -3% | 64.3 -43% | 50.2 -55% | 183.3 ? 64% |
| Read 4K (MB/s) | 42.01 | 57 36% | 55.5 32% | 42.05 0% | 29.3 -30% | 35.32 -16% | 48.2 ? 15% |
| Write Seq (MB/s) | 1964 | 984 -50% | 986 -50% | 1457 -26% | 131.1 -93% | 991 -50% | 2135 ? 9% |
| Read Seq (MB/s) | 2065 | 1564 -24% | 1318 -36% | 1421 -31% | 776 -62% | 1526 -26% | 2102 ? 2% |
| Write 4K Q32T1 (MB/s) | 318.2 | 237.4 -25% | 220.3 -31% | 287.8 -10% | 96.8 -70% | 445.1 40% | 452 ? 42% |
| Read 4K Q32T1 (MB/s) | 406.7 | 340.7 -16% | 315.5 -22% | 317.9 -22% | 198.6 -51% | 526 29% | 619 ? 52% |
| Write Seq Q32T1 (MB/s) | 2534 | 959 -62% | 987 -61% | 1455 -43% | 127.8 -95% | 1647 -35% | 2537 ? 0% |
| Read Seq Q32T1 (MB/s) | 3438 | 1732 -50% | 1416 -59% | 1739 -49% | 1044 -70% | 3427 0% | 3466 ? 1% |
| 3DMark 06 Standard Score | 32694 pontos | |
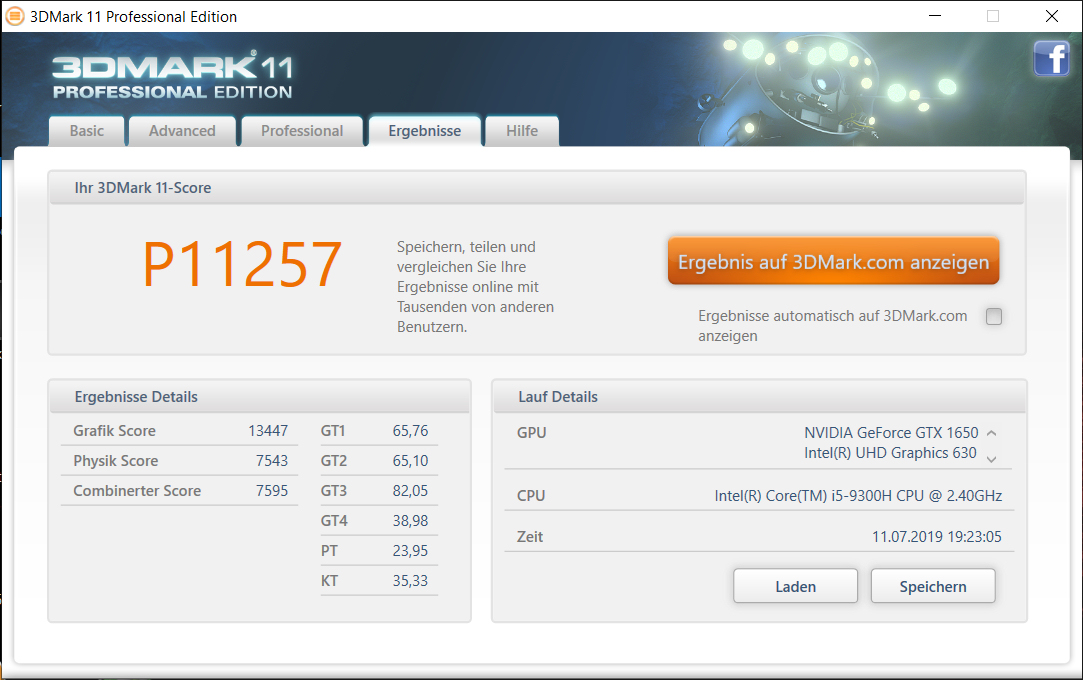
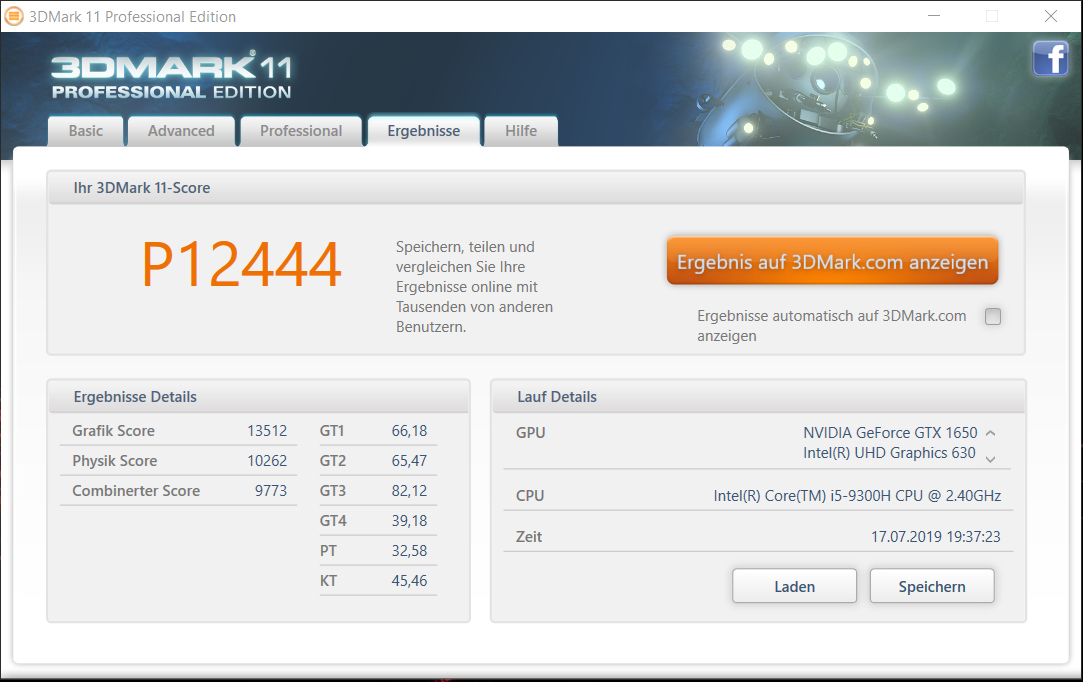
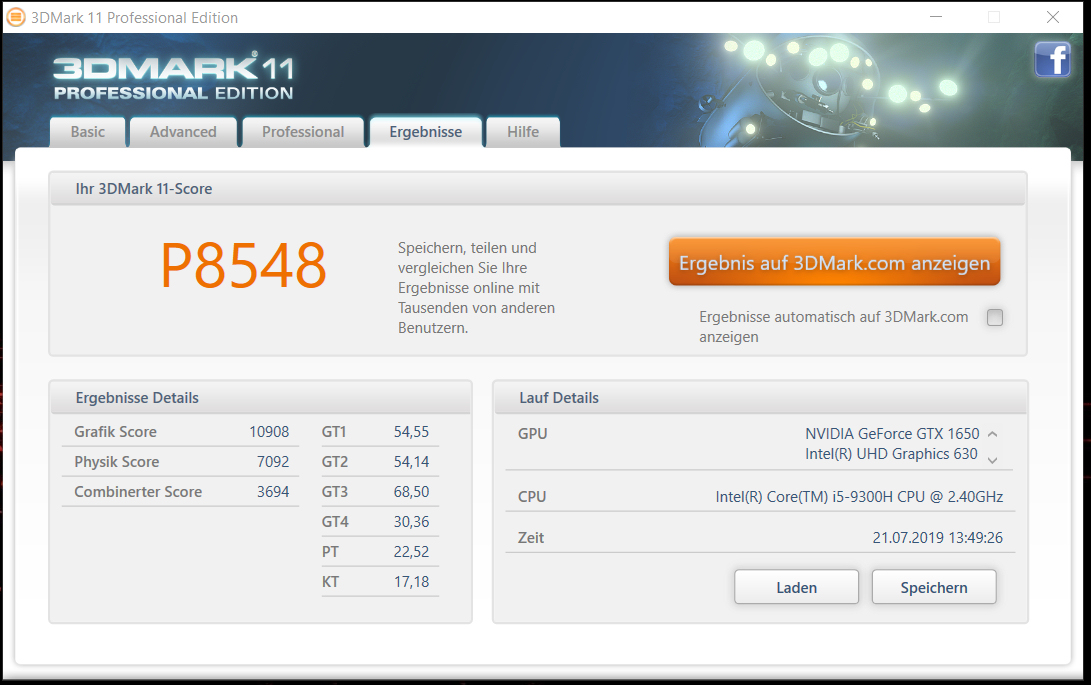
| 3DMark 11 Performance | 11257 pontos | |
| 3DMark Ice Storm Standard Score | 71342 pontos | |
| 3DMark Cloud Gate Standard Score | 22167 pontos | |
| 3DMark Fire Strike Score | 8075 pontos | |
| 3DMark Time Spy Score | 3573 pontos | |
Ajuda | ||
| 3DMark 11 - 1280x720 Performance GPU | |
| Média da turma Gaming (21841 - 80022, n=106, últimos 2 anos) | |
| Dell G5 15 5590 | |
| Asus ROG Zephyrus G15 GA502DU | |
| HP Omen 15-dc1303ng | |
| Asus TUF FX505DT-EB73 | |
| HP Omen 15-dc1020ng (Dual-Channel-Modus) | |
| HP Omen 15-dc1020ng | |
| Acer Aspire Nitro 5 AN515-54-53Z2 | |
| Média NVIDIA GeForce GTX 1650 Mobile (10885 - 13575, n=30) | |
| Asus TUF FX705GE-EW096T | |
| MSI GF75 8RD-001 | |
| Asus TUF FX505DY | |
| BioShock Infinite - 1920x1080 Ultra Preset, DX11 (DDOF) | |
| Dell G5 15 5590 | |
| HP Omen 15-dc1303ng | |
| Asus ROG Zephyrus G15 GA502DU | |
| HP Omen 15-dc1020ng (Dual-Channel-Modus) | |
| HP Omen 15-dc1020ng | |
| Média NVIDIA GeForce GTX 1650 Mobile (68.5 - 99.4, n=18) | |
| Asus TUF FX505DT-EB73 | |
| Asus TUF FX505DY | |
| The Witcher 3 - 1920x1080 High Graphics & Postprocessing (Nvidia HairWorks Off) | |
| Média da turma Gaming (181 - 341, n=3, últimos 2 anos) | |
| Dell G5 15 5590 | |
| Asus ROG Zephyrus G15 GA502DU | |
| Asus TUF FX505DT-EB73 | |
| HP Omen 15-dc1020ng | |
| Média NVIDIA GeForce GTX 1650 Mobile (45 - 70.4, n=29) | |
| Acer Aspire Nitro 5 AN515-54-53Z2 | |
| Asus TUF FX505DY | |
| Far Cry New Dawn - 1920x1080 Ultra Preset | |
| Dell G5 15 5590 | |
| HP Omen 15-dc1020ng (Dual-Channel-Modus) | |
| Acer Aspire Nitro 5 AN515-54-53Z2 | |
| Média NVIDIA GeForce GTX 1650 Mobile (40 - 56, n=6) | |
| HP Omen 15-dc1020ng | |
| X-Plane 11.11 - 1920x1080 high (fps_test=3) | |
| Média da turma Gaming (52.1 - 143.5, n=113, últimos 2 anos) | |
| HP Omen 15-dc1020ng (Dual-Channel-Modus) | |
| Média NVIDIA GeForce GTX 1650 Mobile (44.5 - 77.3, n=18) | |
| HP Omen 15-dc1020ng | |
| Dota 2 Reborn - 1920x1080 ultra (3/3) best looking | |
| Média da turma Gaming (84.8 - 248, n=110, últimos 2 anos) | |
| HP Omen 15-dc1303ng | |
| Média NVIDIA GeForce GTX 1650 Mobile (58.5 - 119, n=20) | |
| HP Omen 15-dc1020ng (Dual-Channel-Modus) | |
| HP Omen 15-dc1020ng | |
| baixo | média | alto | ultra | |
|---|---|---|---|---|
| BioShock Infinite (2013) | 213.6 | 200.3 | 190.4 | 87.7 |
| The Witcher 3 (2015) | 157.1 | 109.6 | 62.2 | 37 |
| Dota 2 Reborn (2015) | 114 | 103 | 89 | 82 |
| X-Plane 11.11 (2018) | 78 | 62 | 55 | |
| Far Cry New Dawn (2019) | 60 | 53 | 52 | 47 |
| Rage 2 (2019) | 117 | 97 | 74 | 60 |
| F1 2019 (2019) | 128 | 97 | 74 | 60 |
Barulho
| Ocioso |
| 28.8 / 29.5 / 31.1 dB |
| Carga |
| 35.2 / 41 dB |
 | ||
30 dB silencioso 40 dB(A) audível 50 dB(A) ruidosamente alto |
||
min: | ||
| HP Omen 15-dc1020ng i5-9300H, GeForce GTX 1650 Mobile | HP Omen 15-dc1303ng i7-8750H, GeForce RTX 2070 Max-Q | Asus TUF FX505DT-EB73 R7 3750H, GeForce GTX 1650 Mobile | Asus ROG Zephyrus G15 GA502DU R7 3750H, GeForce GTX 1660 Ti Max-Q | Acer Aspire Nitro 5 AN515-54-53Z2 i5-9300H, GeForce GTX 1650 Mobile | Dell G5 15 5590 i7-8750H, GeForce RTX 2060 Mobile | Média NVIDIA GeForce GTX 1650 Mobile | Média da turma Gaming | |
|---|---|---|---|---|---|---|---|---|
| Noise | -12% | -9% | -17% | -14% | -10% | -4% | -3% | |
| desligado / ambiente * (dB) | 28.8 | 30.5 -6% | 28.2 2% | 28 3% | 30 -4% | 30.4 -6% | 27.6 ? 4% | 24.1 ? 16% |
| Idle Minimum * (dB) | 28.8 | 32.8 -14% | 28.2 2% | 29.4 -2% | 30 -4% | 30.4 -6% | 28.1 ? 2% | 25.8 ? 10% |
| Idle Average * (dB) | 29.5 | 32.8 -11% | 28.2 4% | 31.9 -8% | 31 -5% | 30.4 -3% | 28.8 ? 2% | 27.4 ? 7% |
| Idle Maximum * (dB) | 31.1 | 32.8 -5% | 31.4 -1% | 33 -6% | 33 -6% | 33.4 -7% | 31 ? -0% | 29.9 ? 4% |
| Load Average * (dB) | 35.2 | 42.5 -21% | 39.8 -13% | 41.2 -17% | 46 -31% | 42 -19% | 41.7 ? -18% | 43 ? -22% |
| Witcher 3 ultra * (dB) | 35.2 | 47 -34% | 53.8 -53% | 46 -31% | ||||
| Load Maximum * (dB) | 41 | 47.5 -16% | 50.2 -22% | 55.7 -36% | 49 -20% | 48.7 -19% | 46.4 ? -13% | 54 ? -32% |
* ... menor é melhor
(±) A temperatura máxima no lado superior é 40.3 °C / 105 F, em comparação com a média de 40.4 °C / 105 F , variando de 21.2 a 68.8 °C para a classe Gaming.
(-) A parte inferior aquece até um máximo de 48.5 °C / 119 F, em comparação com a média de 43.2 °C / 110 F
(+) Em uso inativo, a temperatura média para o lado superior é 23.2 °C / 74 F, em comparação com a média do dispositivo de 33.9 °C / ### class_avg_f### F.
(±) Jogando The Witcher 3, a temperatura média para o lado superior é 34.7 °C / 94 F, em comparação com a média do dispositivo de 33.9 °C / ## #class_avg_f### F.
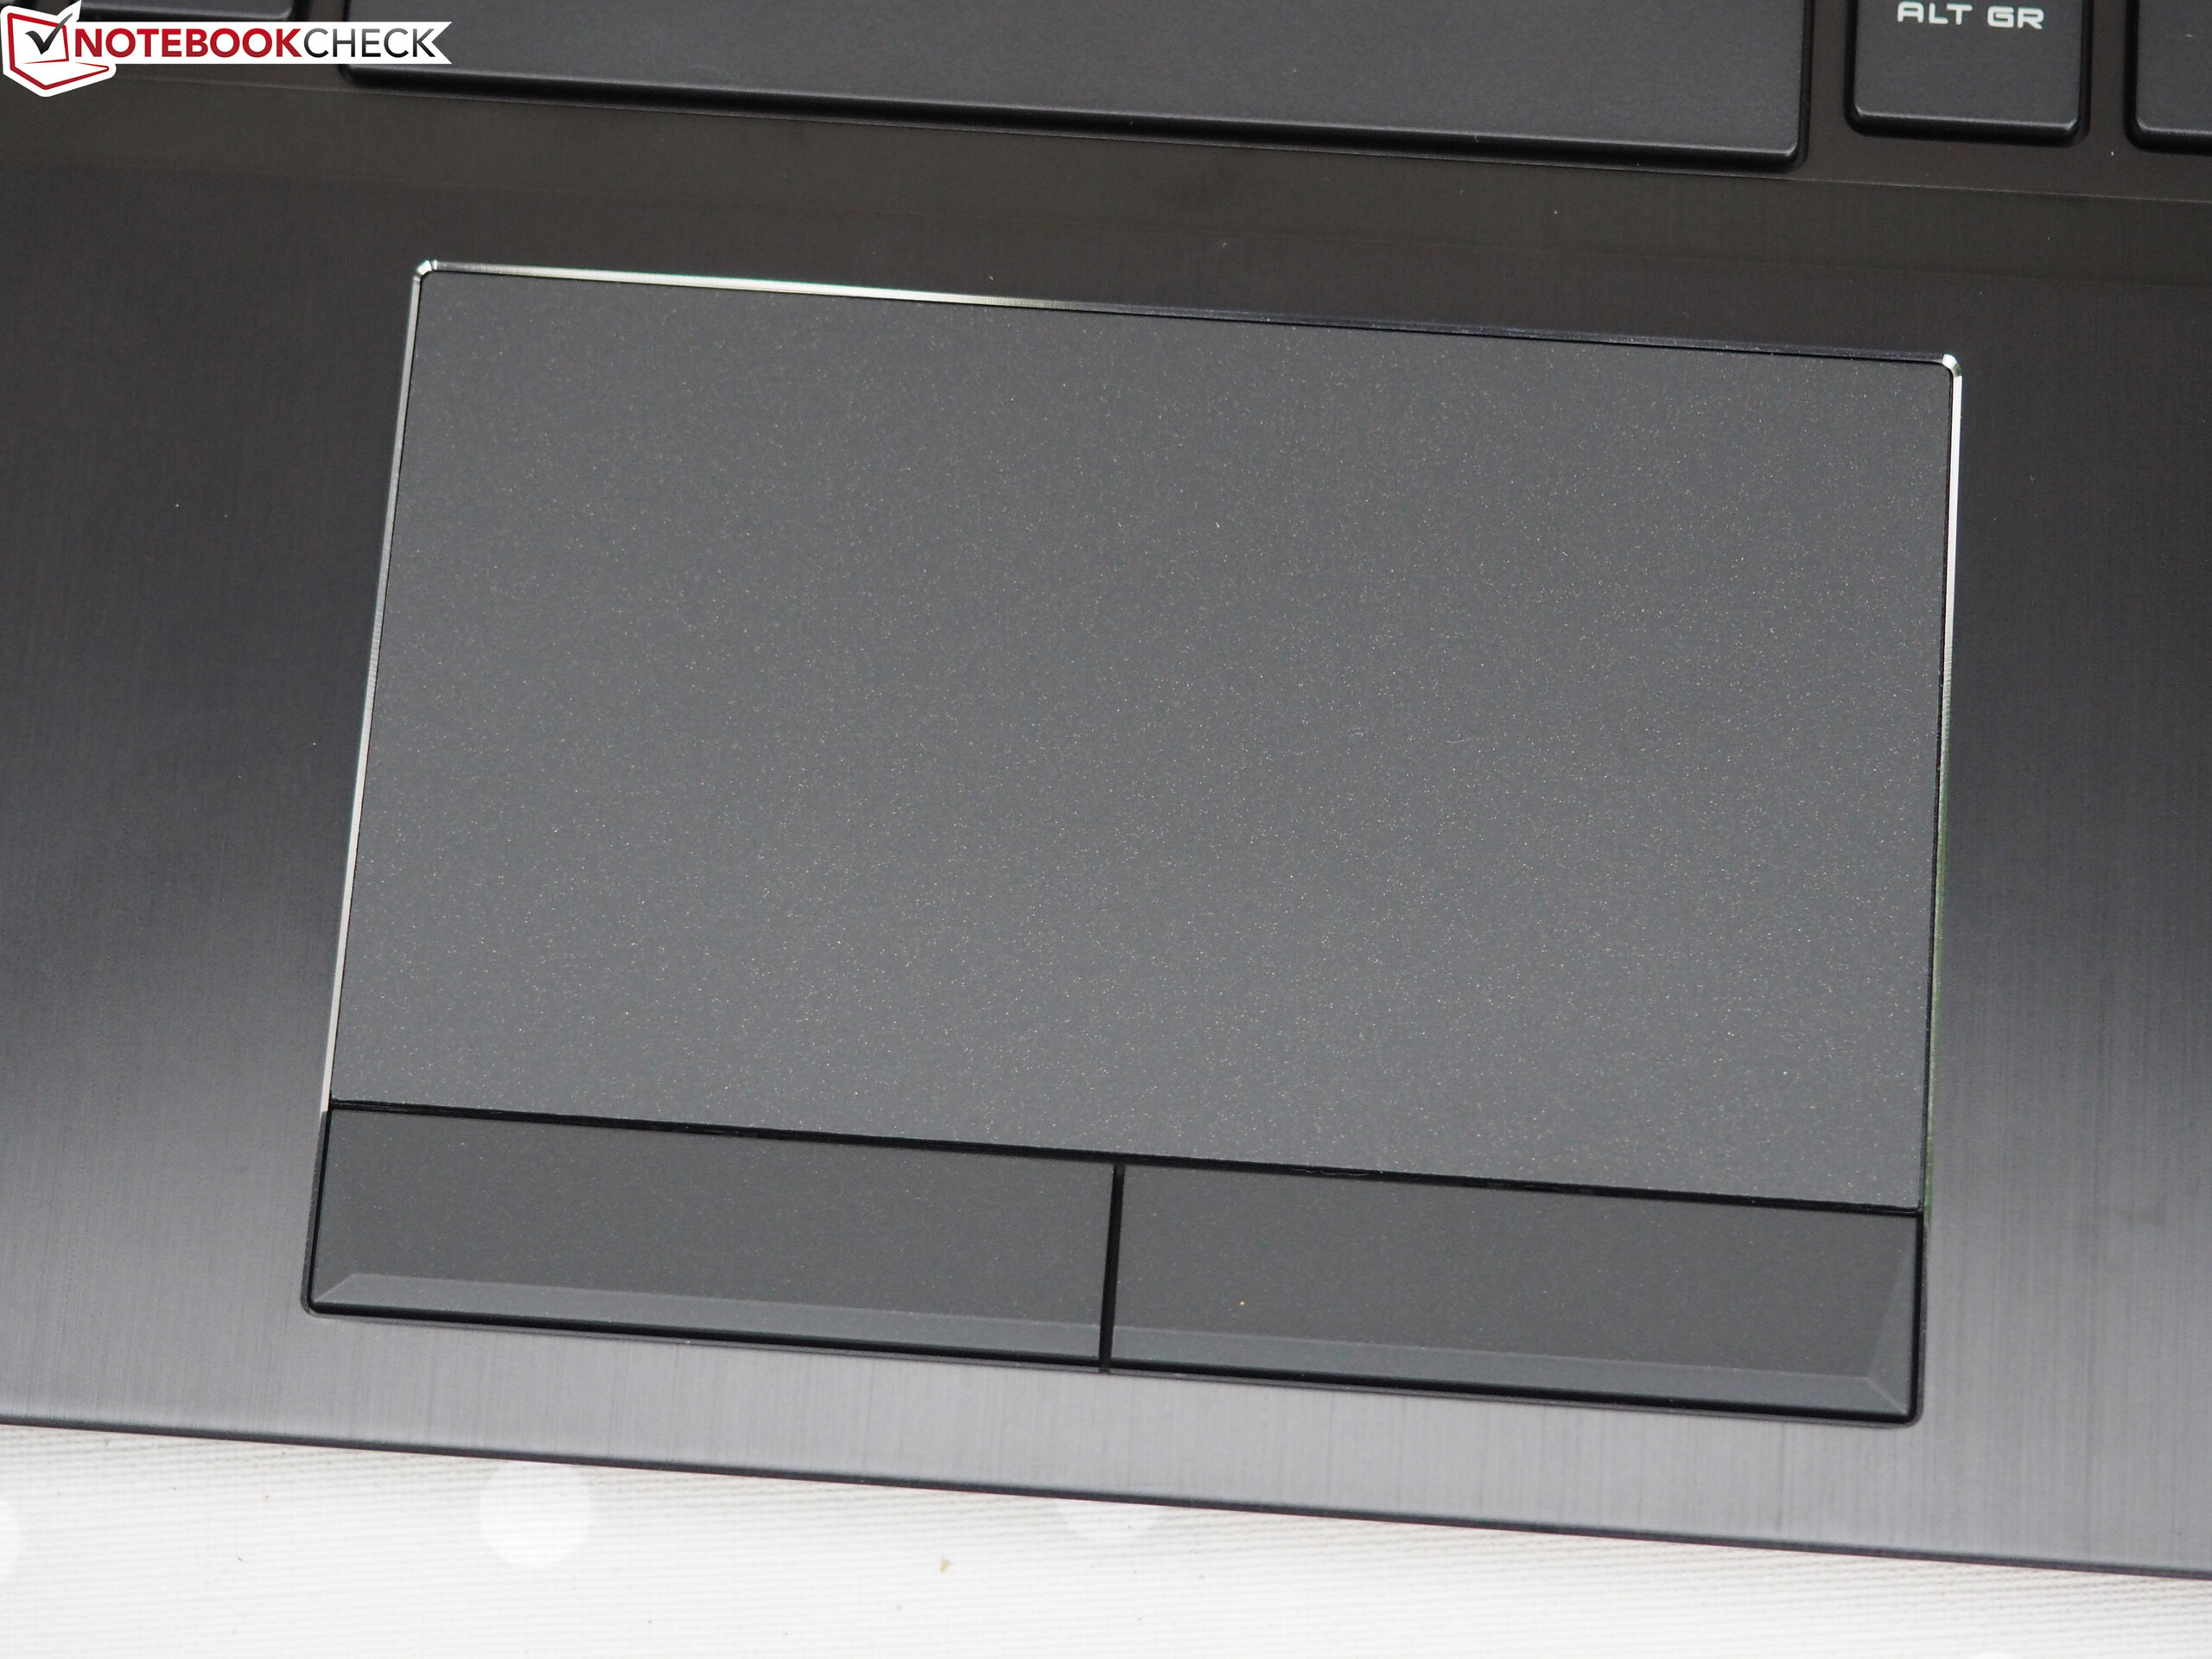
(+) Os apoios para as mãos e o touchpad são mais frios que a temperatura da pele, com um máximo de 28.6 °C / 83.5 F e, portanto, são frios ao toque.
(±) A temperatura média da área do apoio para as mãos de dispositivos semelhantes foi 28.8 °C / 83.8 F (+0.2 °C / 0.3 F).
| HP Omen 15-dc1020ng i5-9300H, GeForce GTX 1650 Mobile | HP Omen 15-dc1303ng i7-8750H, GeForce RTX 2070 Max-Q | Asus TUF FX505DT-EB73 R7 3750H, GeForce GTX 1650 Mobile | Asus ROG Zephyrus G15 GA502DU R7 3750H, GeForce GTX 1660 Ti Max-Q | Acer Aspire Nitro 5 AN515-54-53Z2 i5-9300H, GeForce GTX 1650 Mobile | Dell G5 15 5590 i7-8750H, GeForce RTX 2060 Mobile | Média NVIDIA GeForce GTX 1650 Mobile | Média da turma Gaming | |
|---|---|---|---|---|---|---|---|---|
| Heat | -33% | -17% | -34% | -6% | -13% | -13% | -20% | |
| Maximum Upper Side * (°C) | 40.3 | 47.6 -18% | 41.2 -2% | 55.8 -38% | 47 -17% | 51.5 -28% | 46 ? -14% | 45.2 ? -12% |
| Maximum Bottom * (°C) | 48.5 | 59.6 -23% | 40 18% | 58.2 -20% | 50 -3% | 48.3 -0% | 49.2 ? -1% | 47.9 ? 1% |
| Idle Upper Side * (°C) | 23.9 | 33.8 -41% | 34.6 -45% | 33.4 -40% | 24 -0% | 27.2 -14% | 28.3 ? -18% | 31.1 ? -30% |
| Idle Bottom * (°C) | 24.6 | 36.5 -48% | 34.4 -40% | 33.6 -37% | 25 -2% | 27.4 -11% | 28.9 ? -17% | 34.2 ? -39% |
* ... menor é melhor
HP Omen 15-dc1020ng análise de áudio
(-) | alto-falantes não muito altos (###valor### dB)
Graves 100 - 315Hz
(-) | quase nenhum baixo - em média 21.6% menor que a mediana
(±) | a linearidade dos graves é média (11.3% delta para a frequência anterior)
Médios 400 - 2.000 Hz
(+) | médios equilibrados - apenas 1.8% longe da mediana
(±) | a linearidade dos médios é média (8.8% delta para frequência anterior)
Altos 2 - 16 kHz
(+) | agudos equilibrados - apenas 3.2% longe da mediana
(+) | os máximos são lineares (5.8% delta da frequência anterior)
Geral 100 - 16.000 Hz
(±) | a linearidade do som geral é média (22.2% diferença em relação à mediana)
Comparado com a mesma classe
» 79% de todos os dispositivos testados nesta classe foram melhores, 6% semelhantes, 14% piores
» O melhor teve um delta de 6%, a média foi 18%, o pior foi 132%
Comparado com todos os dispositivos testados
» 64% de todos os dispositivos testados foram melhores, 6% semelhantes, 29% piores
» O melhor teve um delta de 4%, a média foi 24%, o pior foi 134%
Acer Aspire Nitro 5 AN515-54-53Z2 análise de áudio
(±) | o volume do alto-falante é médio, mas bom (###valor### dB)
Graves 100 - 315Hz
(±) | graves reduzidos - em média 14.5% menor que a mediana
(±) | a linearidade dos graves é média (11.9% delta para a frequência anterior)
Médios 400 - 2.000 Hz
(±) | médios mais altos - em média 8.5% maior que a mediana
(±) | a linearidade dos médios é média (7.2% delta para frequência anterior)
Altos 2 - 16 kHz
(+) | agudos equilibrados - apenas 3.4% longe da mediana
(+) | os máximos são lineares (6.7% delta da frequência anterior)
Geral 100 - 16.000 Hz
(±) | a linearidade do som geral é média (20.7% diferença em relação à mediana)
Comparado com a mesma classe
» 74% de todos os dispositivos testados nesta classe foram melhores, 4% semelhantes, 21% piores
» O melhor teve um delta de 6%, a média foi 18%, o pior foi 132%
Comparado com todos os dispositivos testados
» 56% de todos os dispositivos testados foram melhores, 8% semelhantes, 37% piores
» O melhor teve um delta de 4%, a média foi 24%, o pior foi 134%
| desligado | |
| Ocioso | |
| Carga |
|
Key:
min: | |
| HP Omen 15-dc1020ng i5-9300H, GeForce GTX 1650 Mobile | HP Omen 15-dc1303ng i7-8750H, GeForce RTX 2070 Max-Q | Asus TUF FX505DT-EB73 R7 3750H, GeForce GTX 1650 Mobile | Asus ROG Zephyrus G15 GA502DU R7 3750H, GeForce GTX 1660 Ti Max-Q | Acer Aspire Nitro 5 AN515-54-53Z2 i5-9300H, GeForce GTX 1650 Mobile | Dell G5 15 5590 i7-8750H, GeForce RTX 2060 Mobile | Média NVIDIA GeForce GTX 1650 Mobile | Média da turma Gaming | |
|---|---|---|---|---|---|---|---|---|
| Power Consumption | -103% | -16% | -57% | -2% | -8% | -13% | -122% | |
| Idle Minimum * (Watt) | 4.04 | 14.7 -264% | 7 -73% | 7.4 -83% | 5 -24% | 3.5 13% | 4.96 ? -23% | 13.2 ? -227% |
| Idle Average * (Watt) | 7.2 | 18.6 -158% | 9.9 -38% | 8.6 -19% | 7 3% | 6.9 4% | 8.61 ? -20% | 18.9 ? -162% |
| Idle Maximum * (Watt) | 11.4 | 22.6 -98% | 12 -5% | 39.1 -243% | 11 4% | 8.5 25% | 14.8 ? -30% | 24.3 ? -113% |
| Load Average * (Watt) | 80.8 | 90 -11% | 68.4 15% | 65.9 18% | 89 -10% | 127 -57% | 81.7 ? -1% | 108.3 ? -34% |
| Witcher 3 ultra * (Watt) | 93.6 | 94.9 -1% | 106.9 -14% | 90 4% | ||||
| Load Maximum * (Watt) | 144.5 | 120 17% | 130.9 9% | 141.3 2% | 132 9% | 179 -24% | 131.9 ? 9% | 254 ? -76% |
* ... menor é melhor
| HP Omen 15-dc1020ng i5-9300H, GeForce GTX 1650 Mobile, 52.5 Wh | Asus TUF FX505DT-EB73 R7 3750H, GeForce GTX 1650 Mobile, 48 Wh | Asus ROG Zephyrus G15 GA502DU R7 3750H, GeForce GTX 1660 Ti Max-Q, 76 Wh | Acer Aspire Nitro 5 AN515-54-53Z2 i5-9300H, GeForce GTX 1650 Mobile, 57 Wh | Dell G5 15 5590 i7-8750H, GeForce RTX 2060 Mobile, 60 Wh | HP Omen 15-dc1303ng i7-8750H, GeForce RTX 2070 Max-Q, 70 Wh | Média da turma Gaming | |
|---|---|---|---|---|---|---|---|
| Duração da bateria | -17% | 32% | 20% | 38% | -39% | -2% | |
| Reader / Idle (h) | 15.9 | 7.8 -51% | 15.3 -4% | 17.4 9% | 14.8 -7% | 5 -69% | 8.71 ? -45% |
| H.264 (h) | 8 | 8.4 5% | 8.26 ? 3% | ||||
| WiFi v1.3 (h) | 6.4 | 4.8 -25% | 8 25% | 8.1 27% | 7.7 20% | 3.3 -48% | 7.04 ? 10% |
| Witcher 3 ultra (h) | 1 | ||||||
| Load (h) | 1.2 | 1.5 25% | 2.1 75% | 1.5 25% | 2.8 133% | 1.2 0% | 1.47 ? 23% |
Pro
Contra
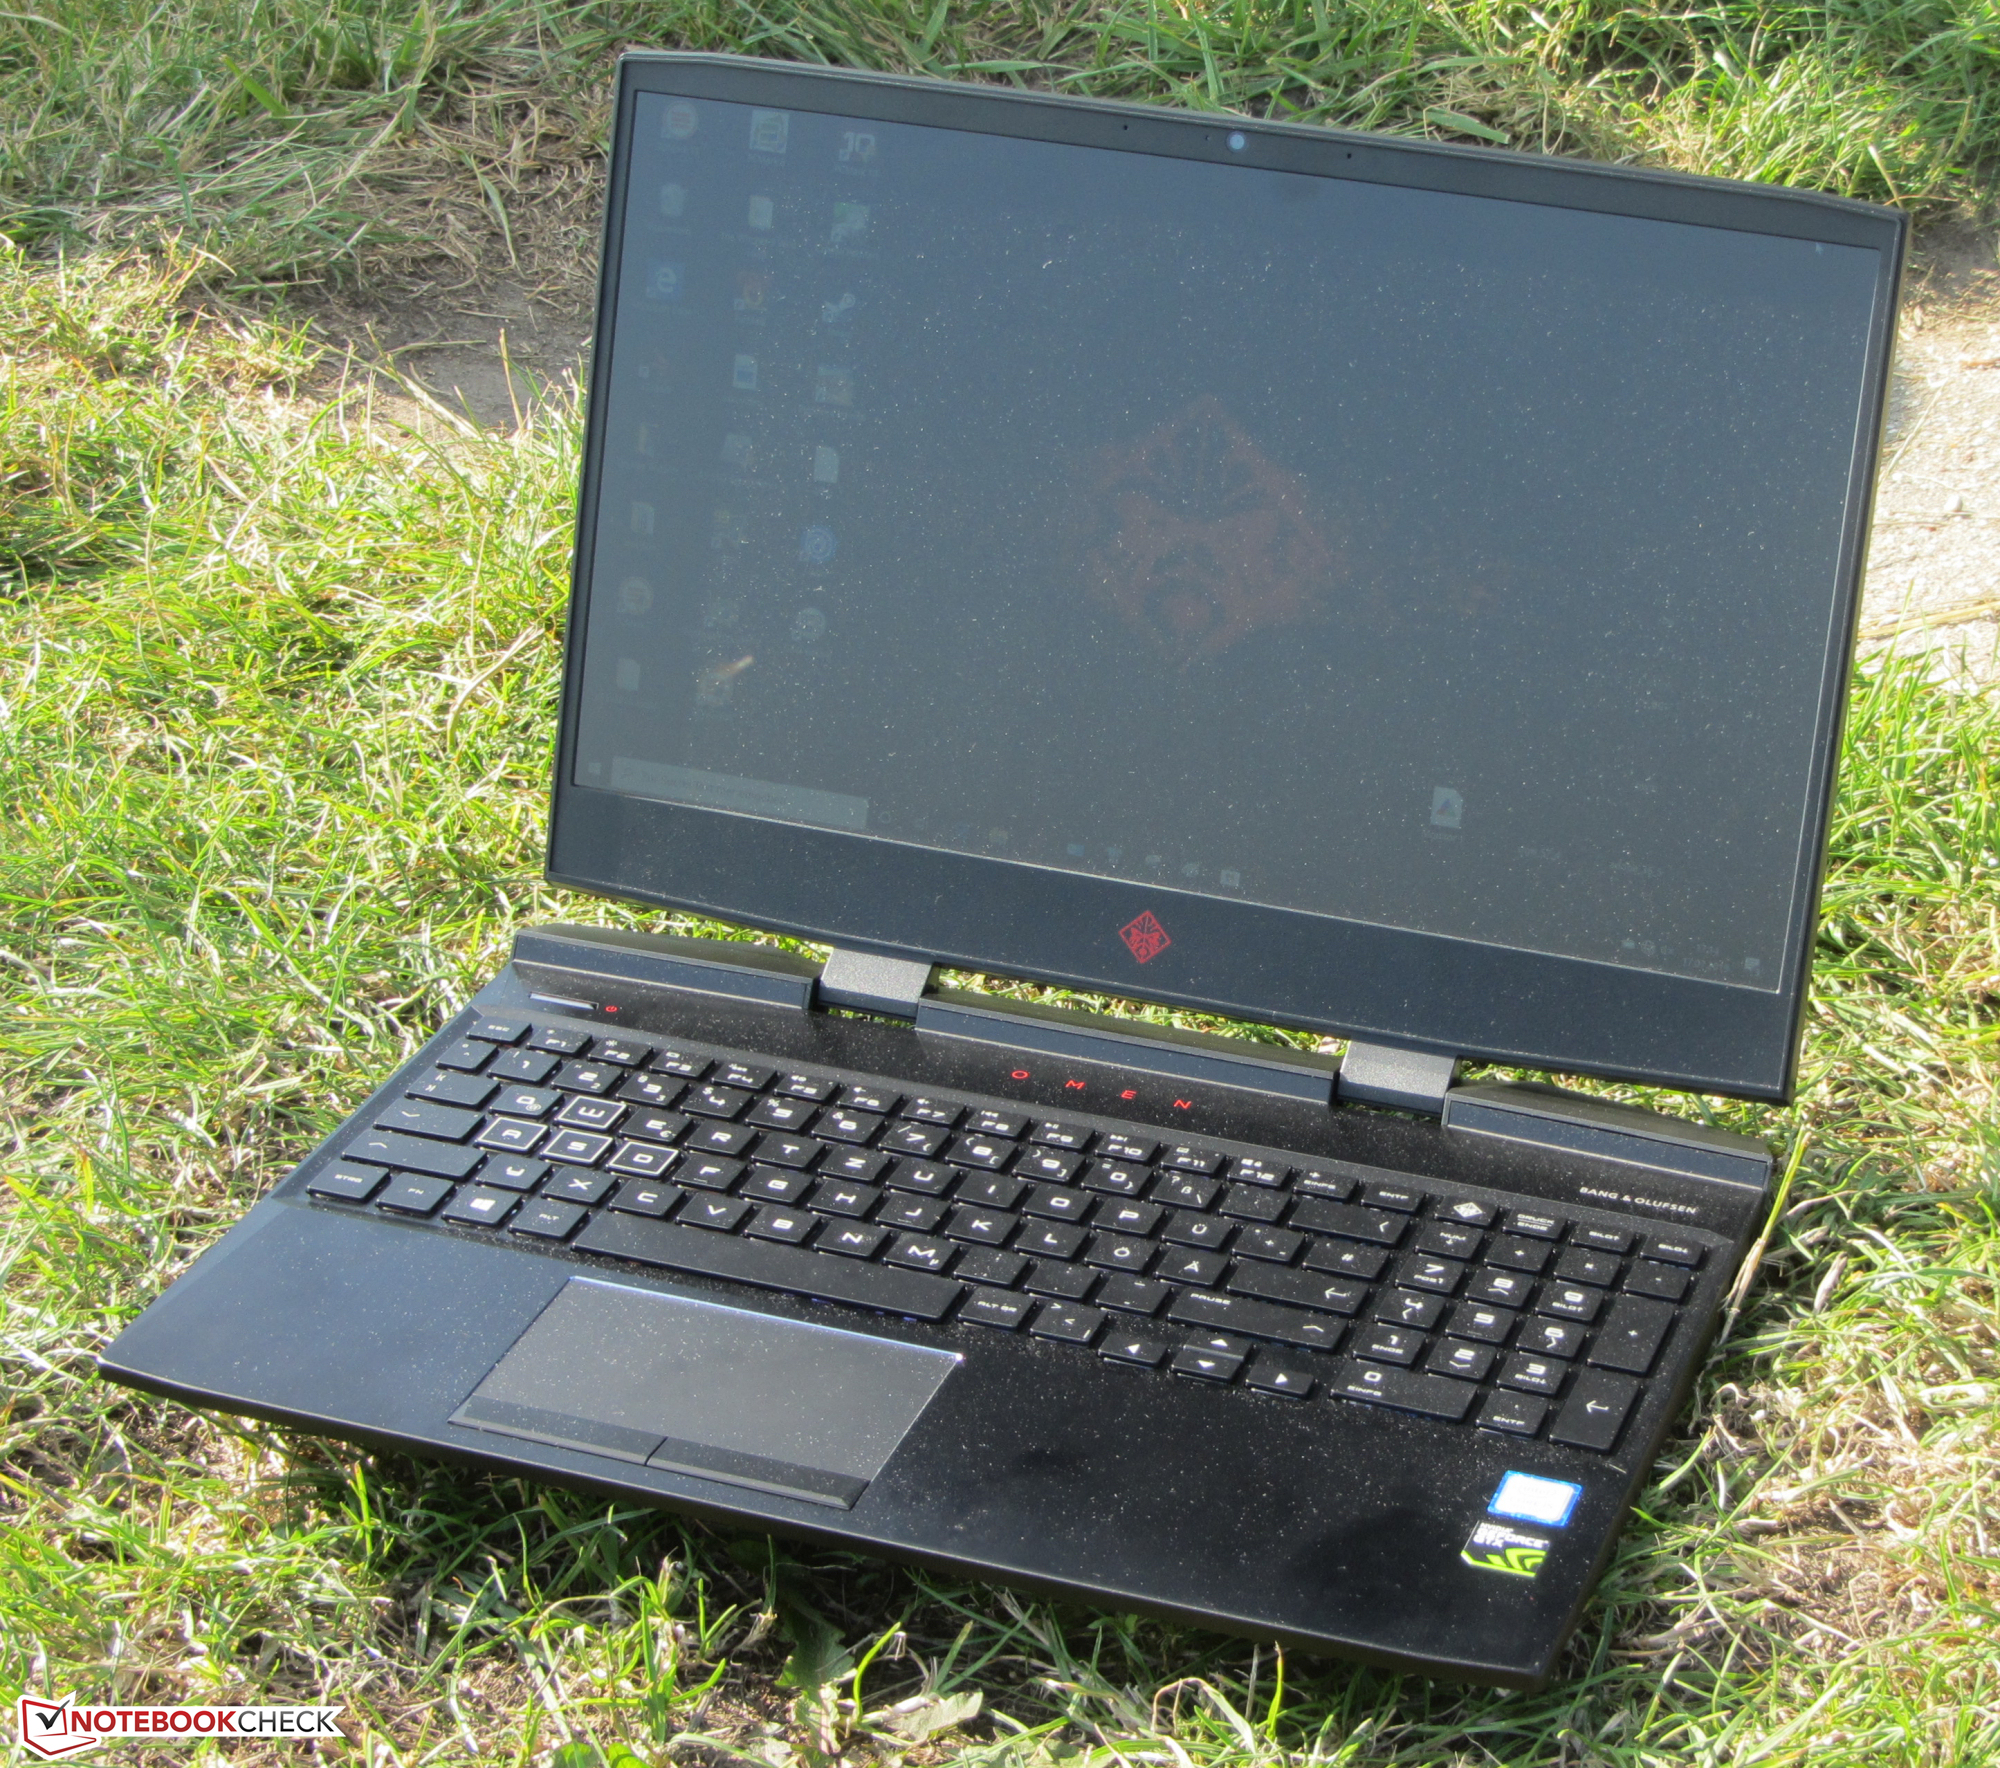
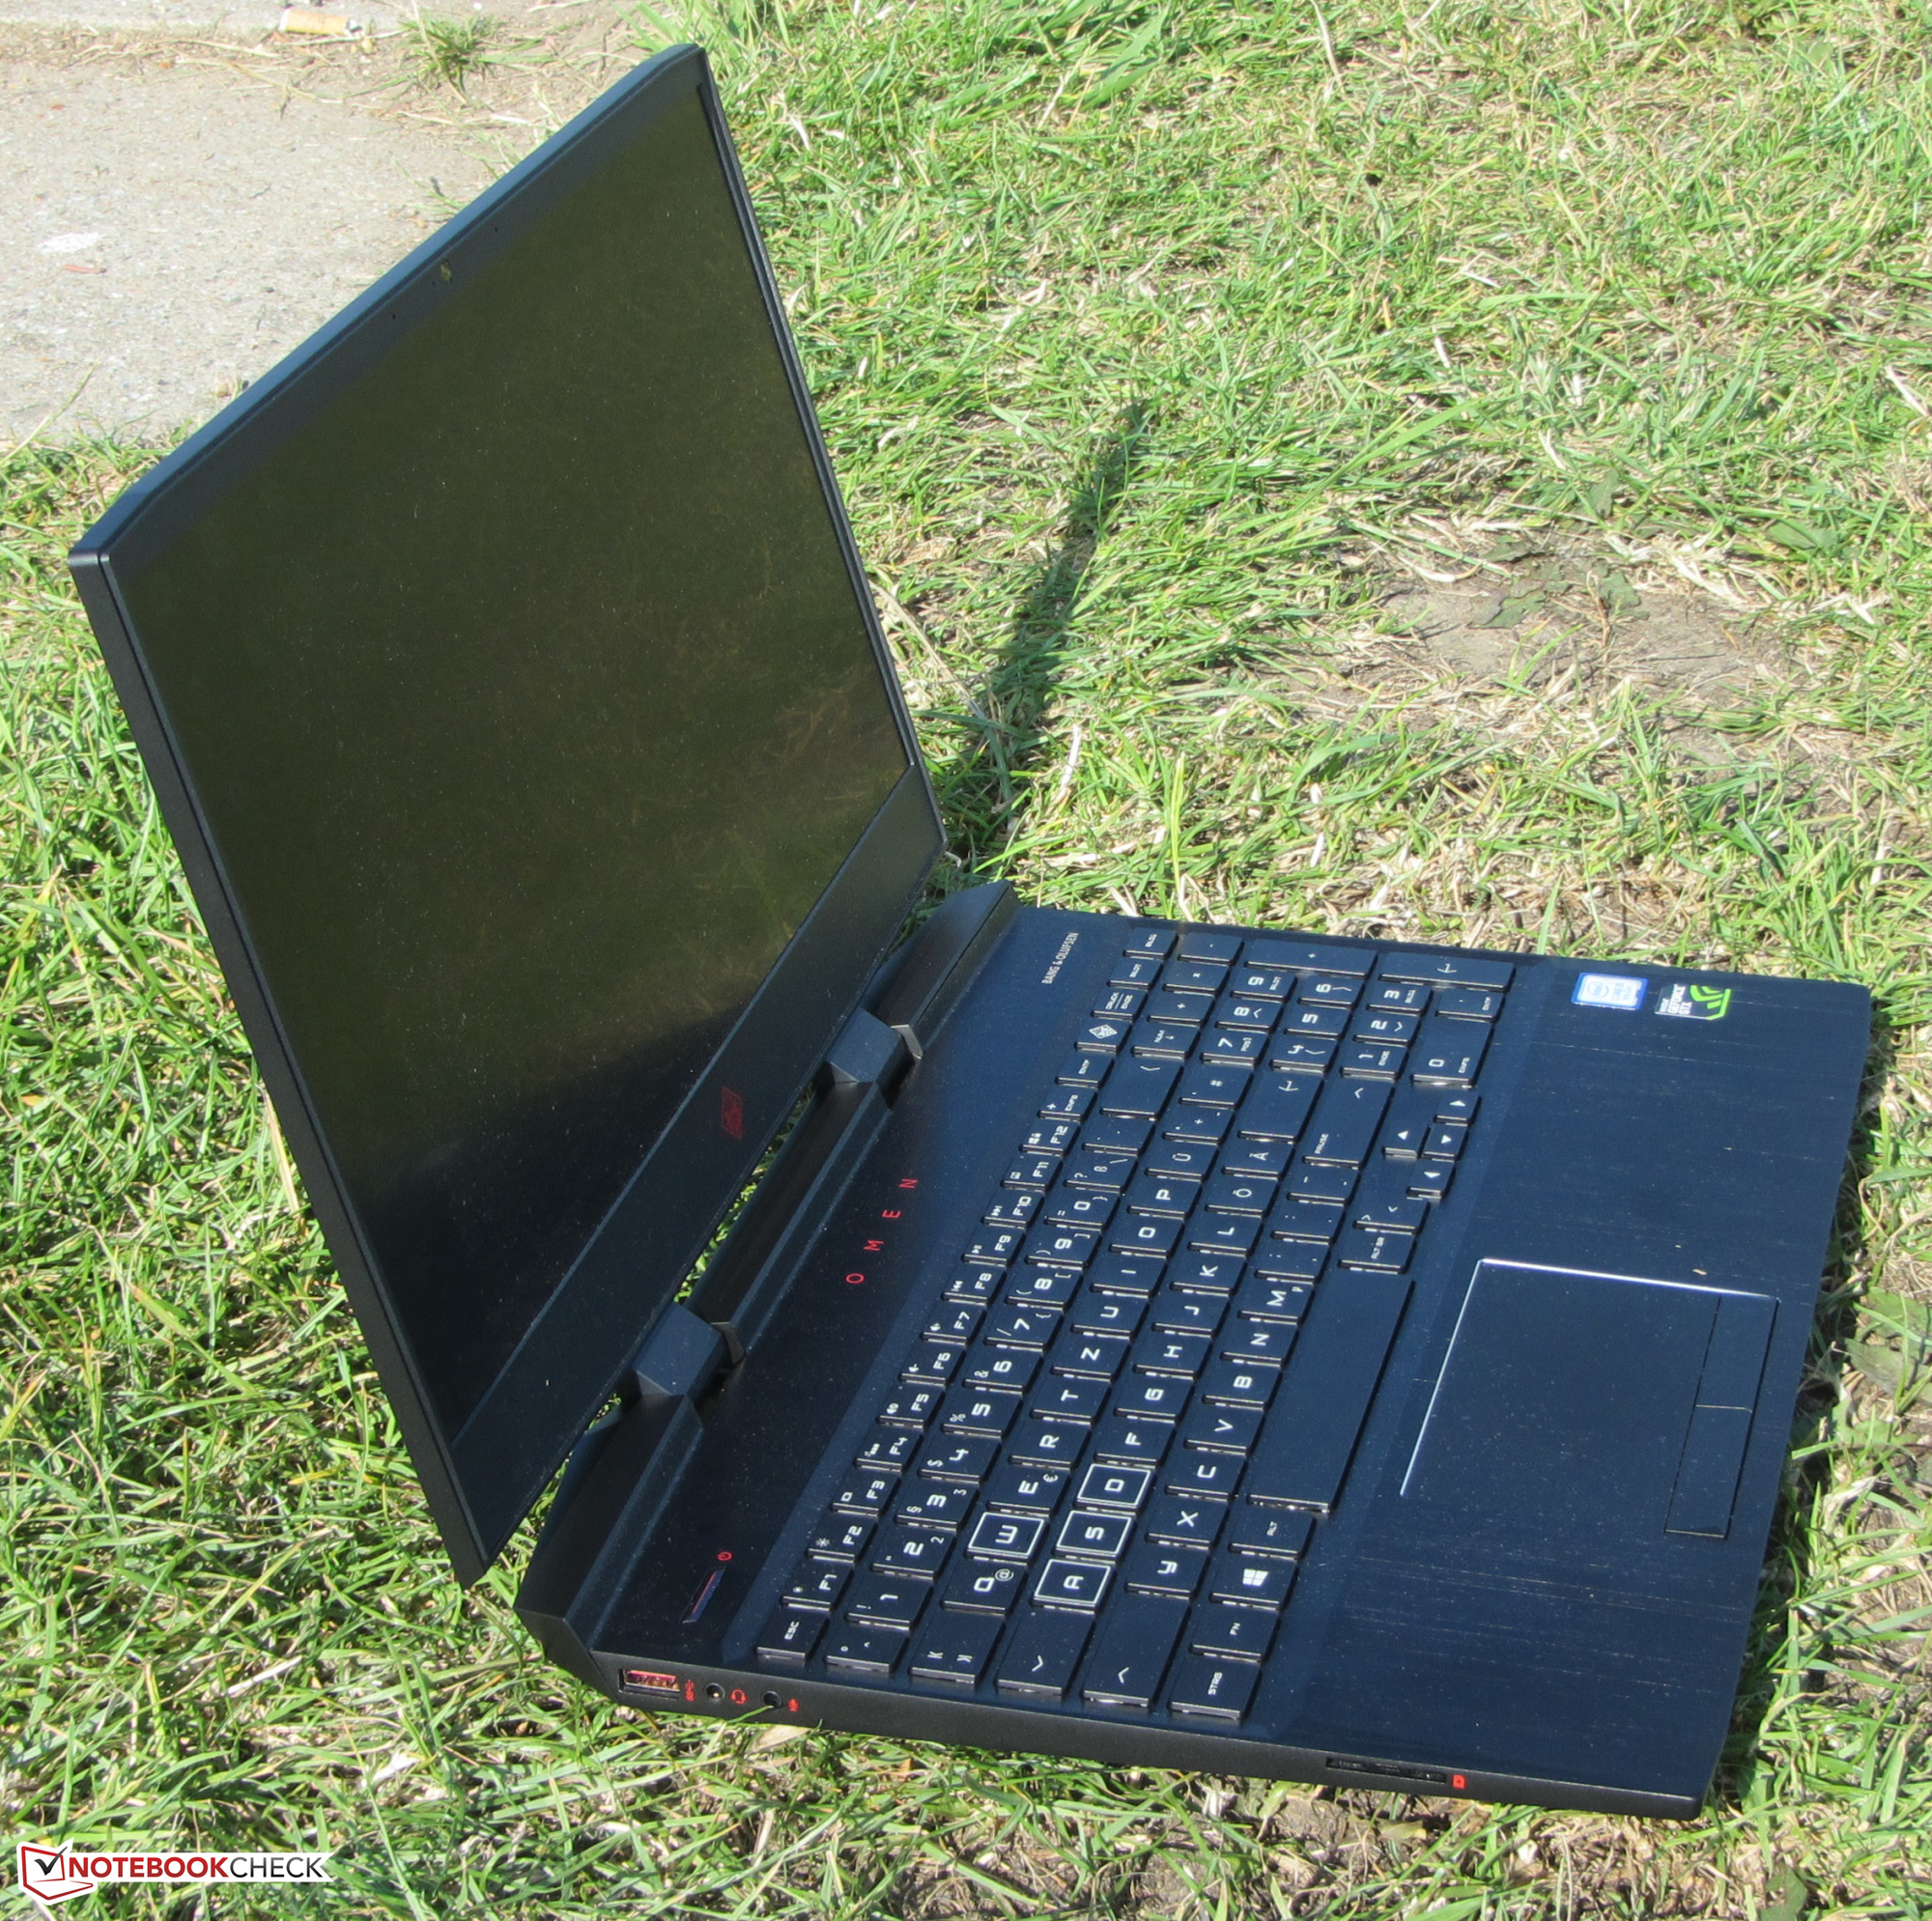
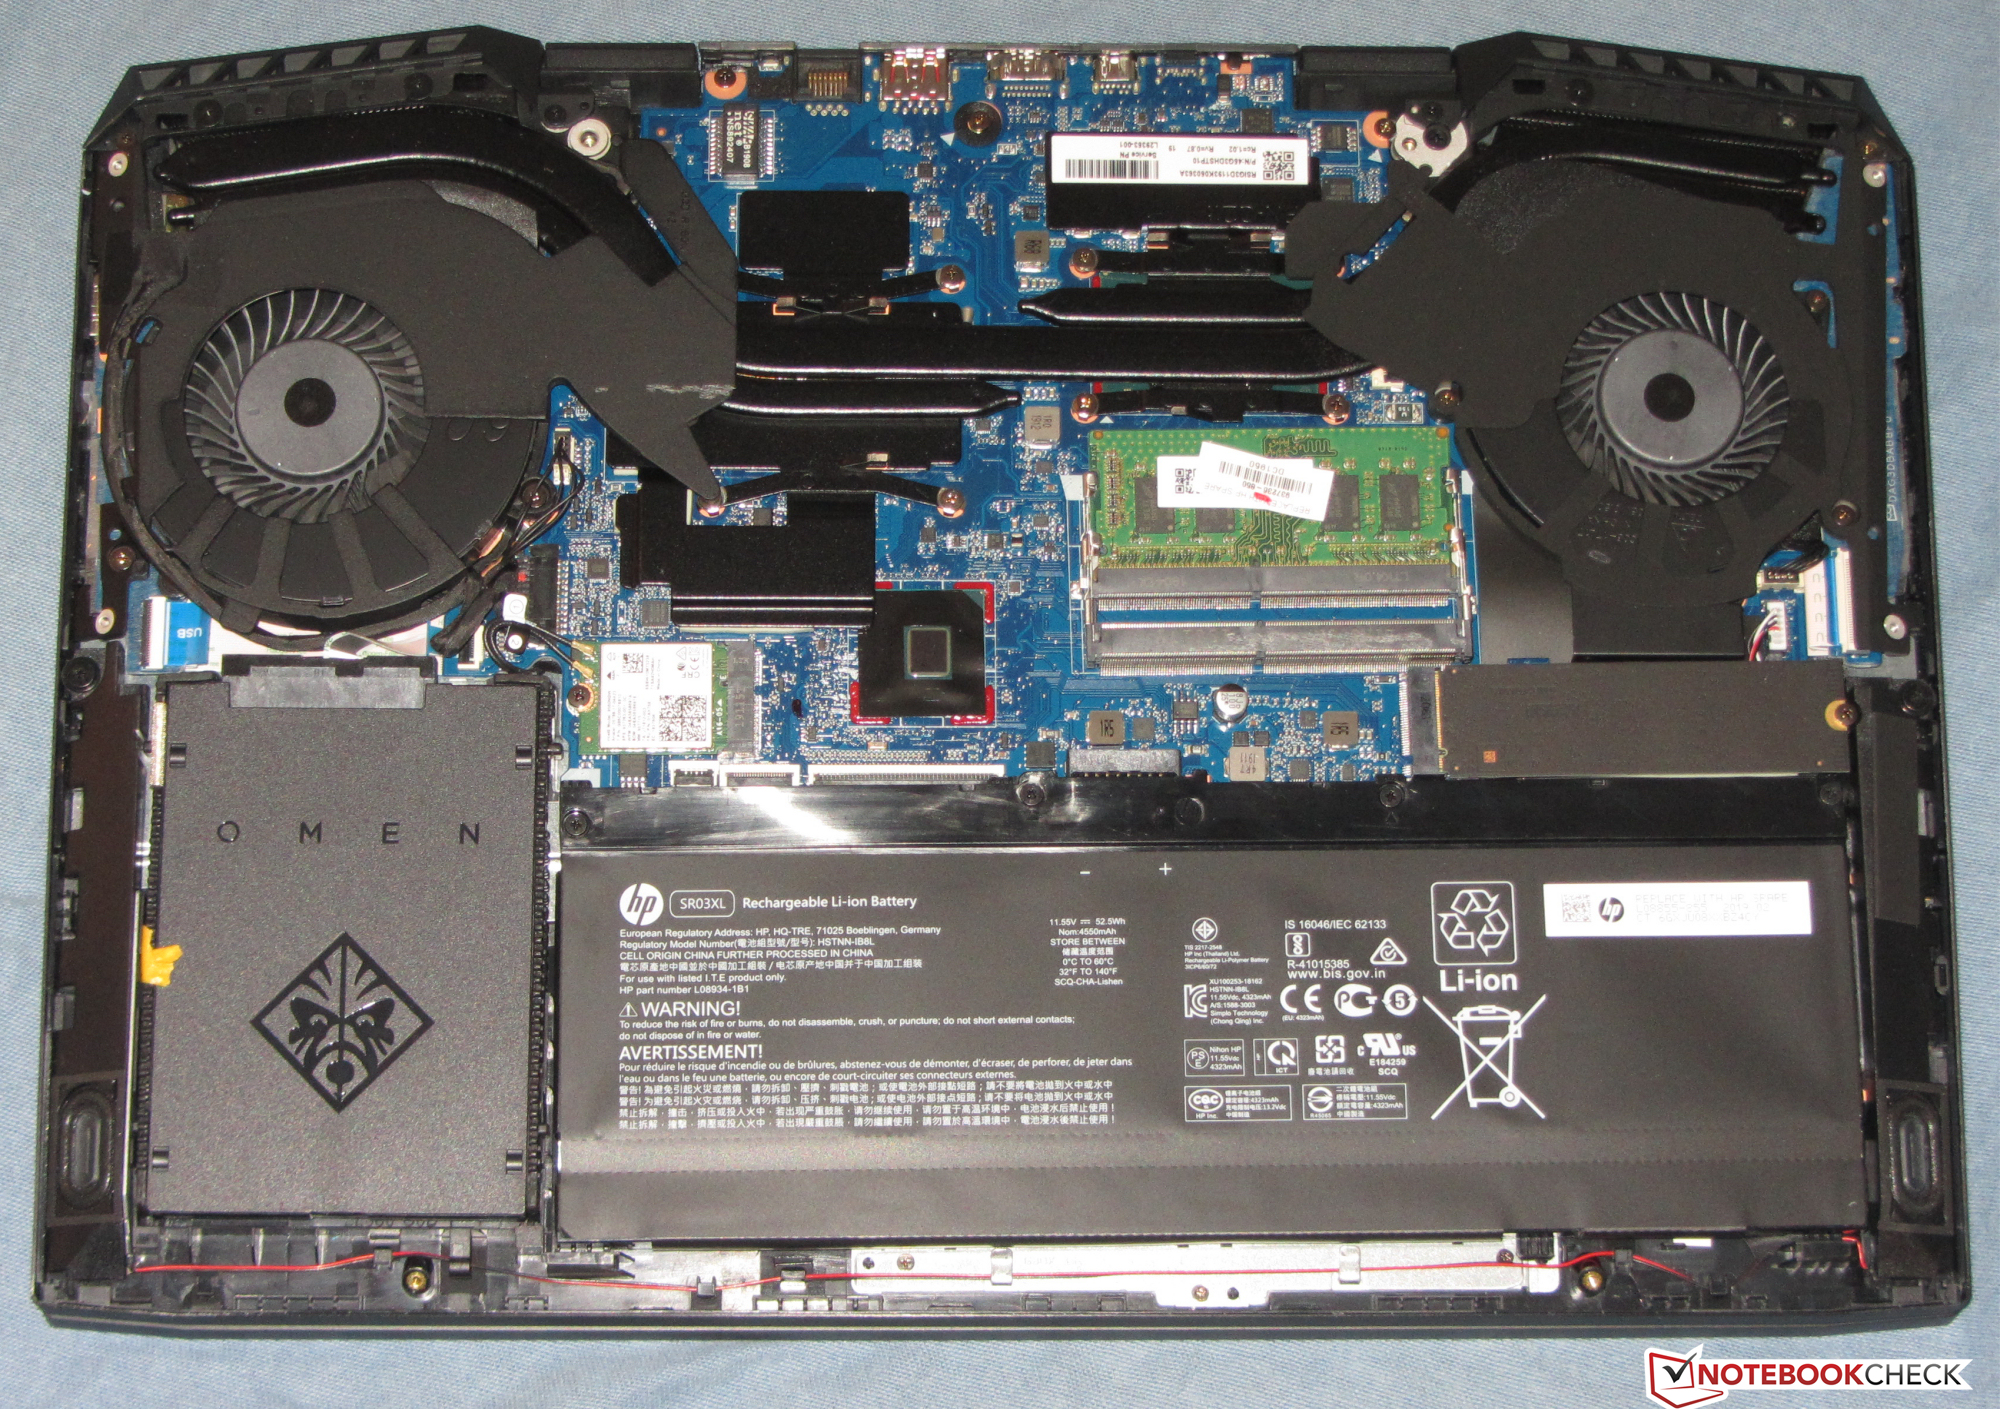
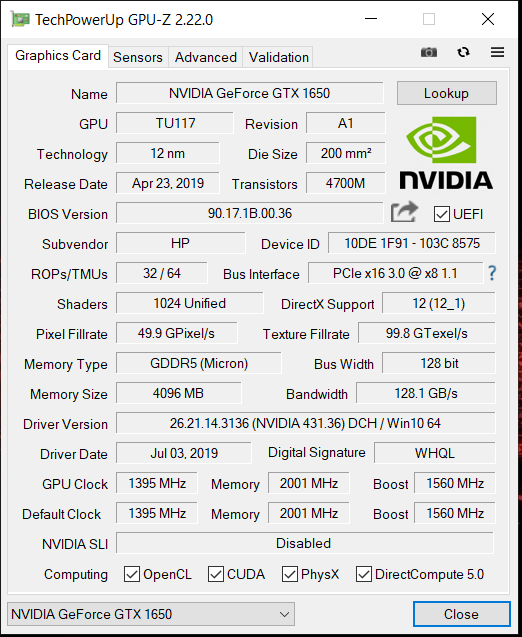
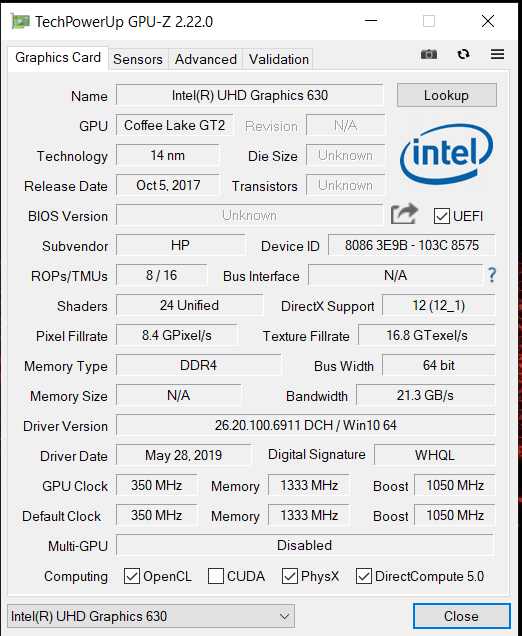
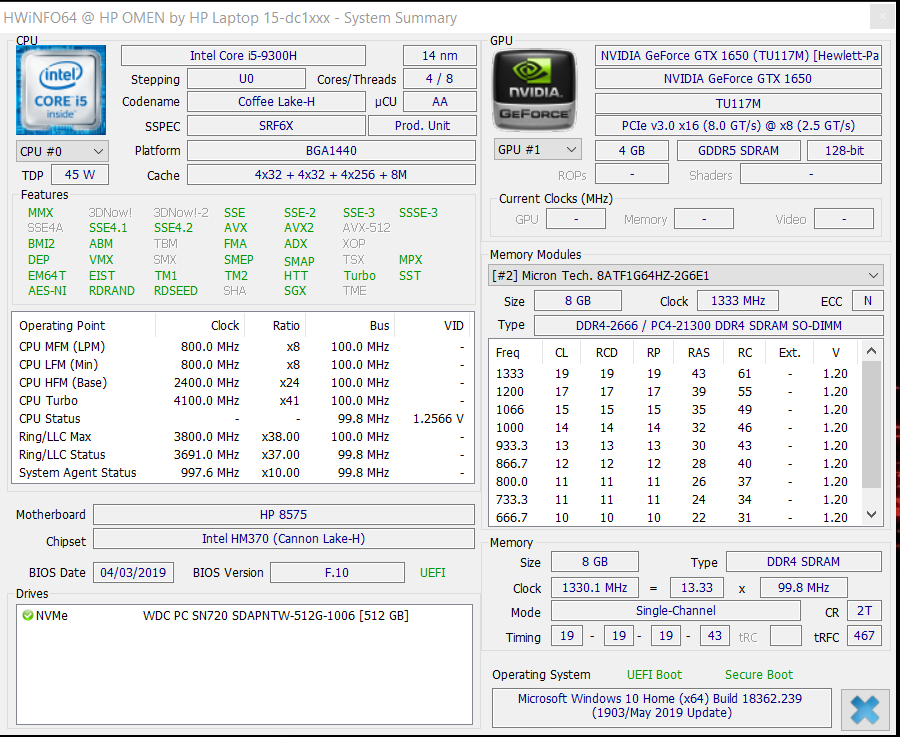
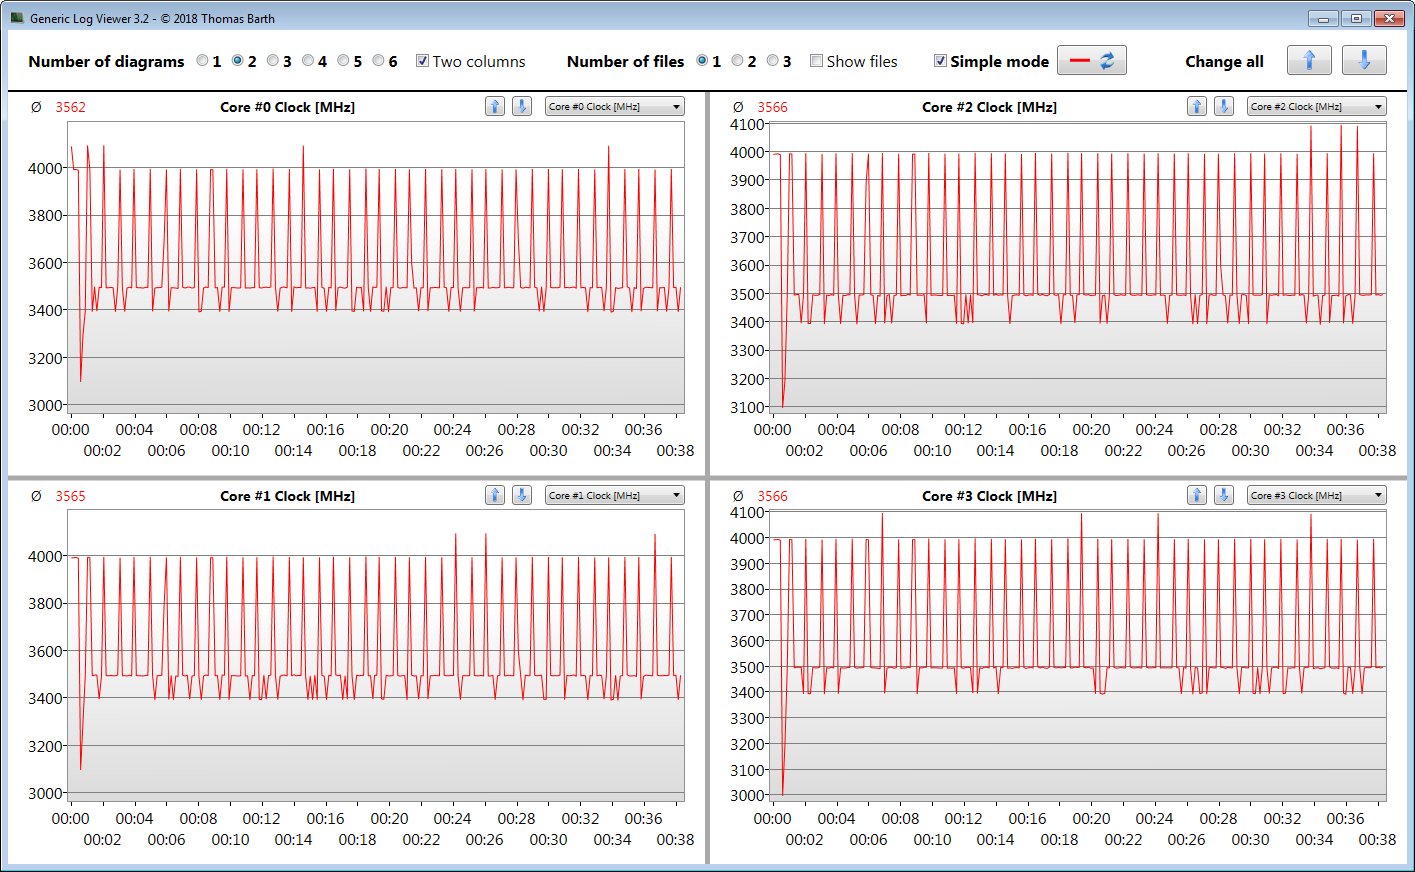
No momento deste artigo, o HP Omen 15-dc1020ng era o portátil Omen 15 mais acessível. Cerca de US $ 1.000 te dão um portátil para jogos Core i5-9300He GeForce GTX 1650 capaz de rodar todos os jogos atuais fluentemente em sua tela em resolução FHD e detalhes médios. Alguns jogos inclusive permitiram configurações e resoluções mais altas. Para obter o máximo do sistema, aconselhamos adicionar um segundo módulo de memória para ativar o modo de canal duplo.
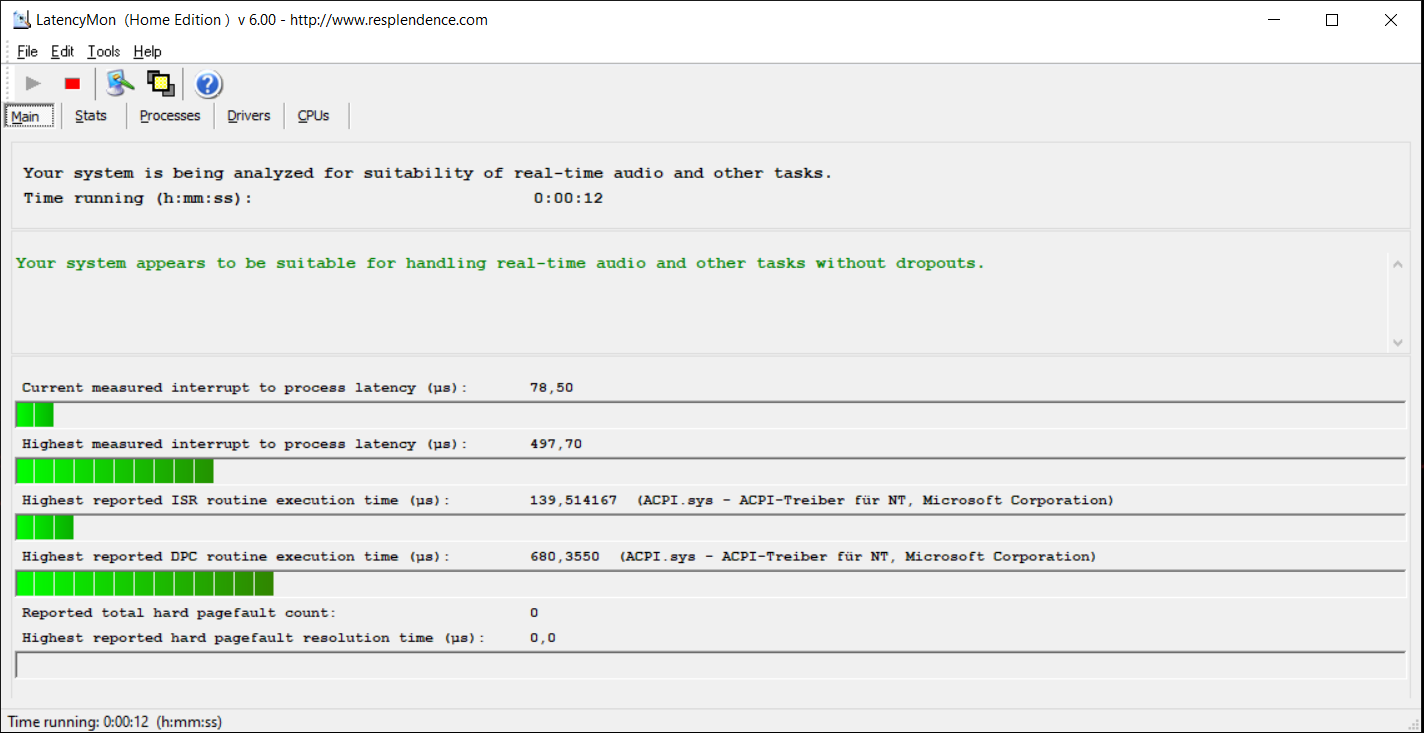
O dispositivo permanece razoavelmente frio e silencioso, independentemente da carga de trabalho, particularmente em casos de uso ocioso e de carga baixa a média. Também oferece uma duração de bateria decente de aproximadamente 6,5 horas ao navegar na Web ou 8 horas ao assistir a filmes.
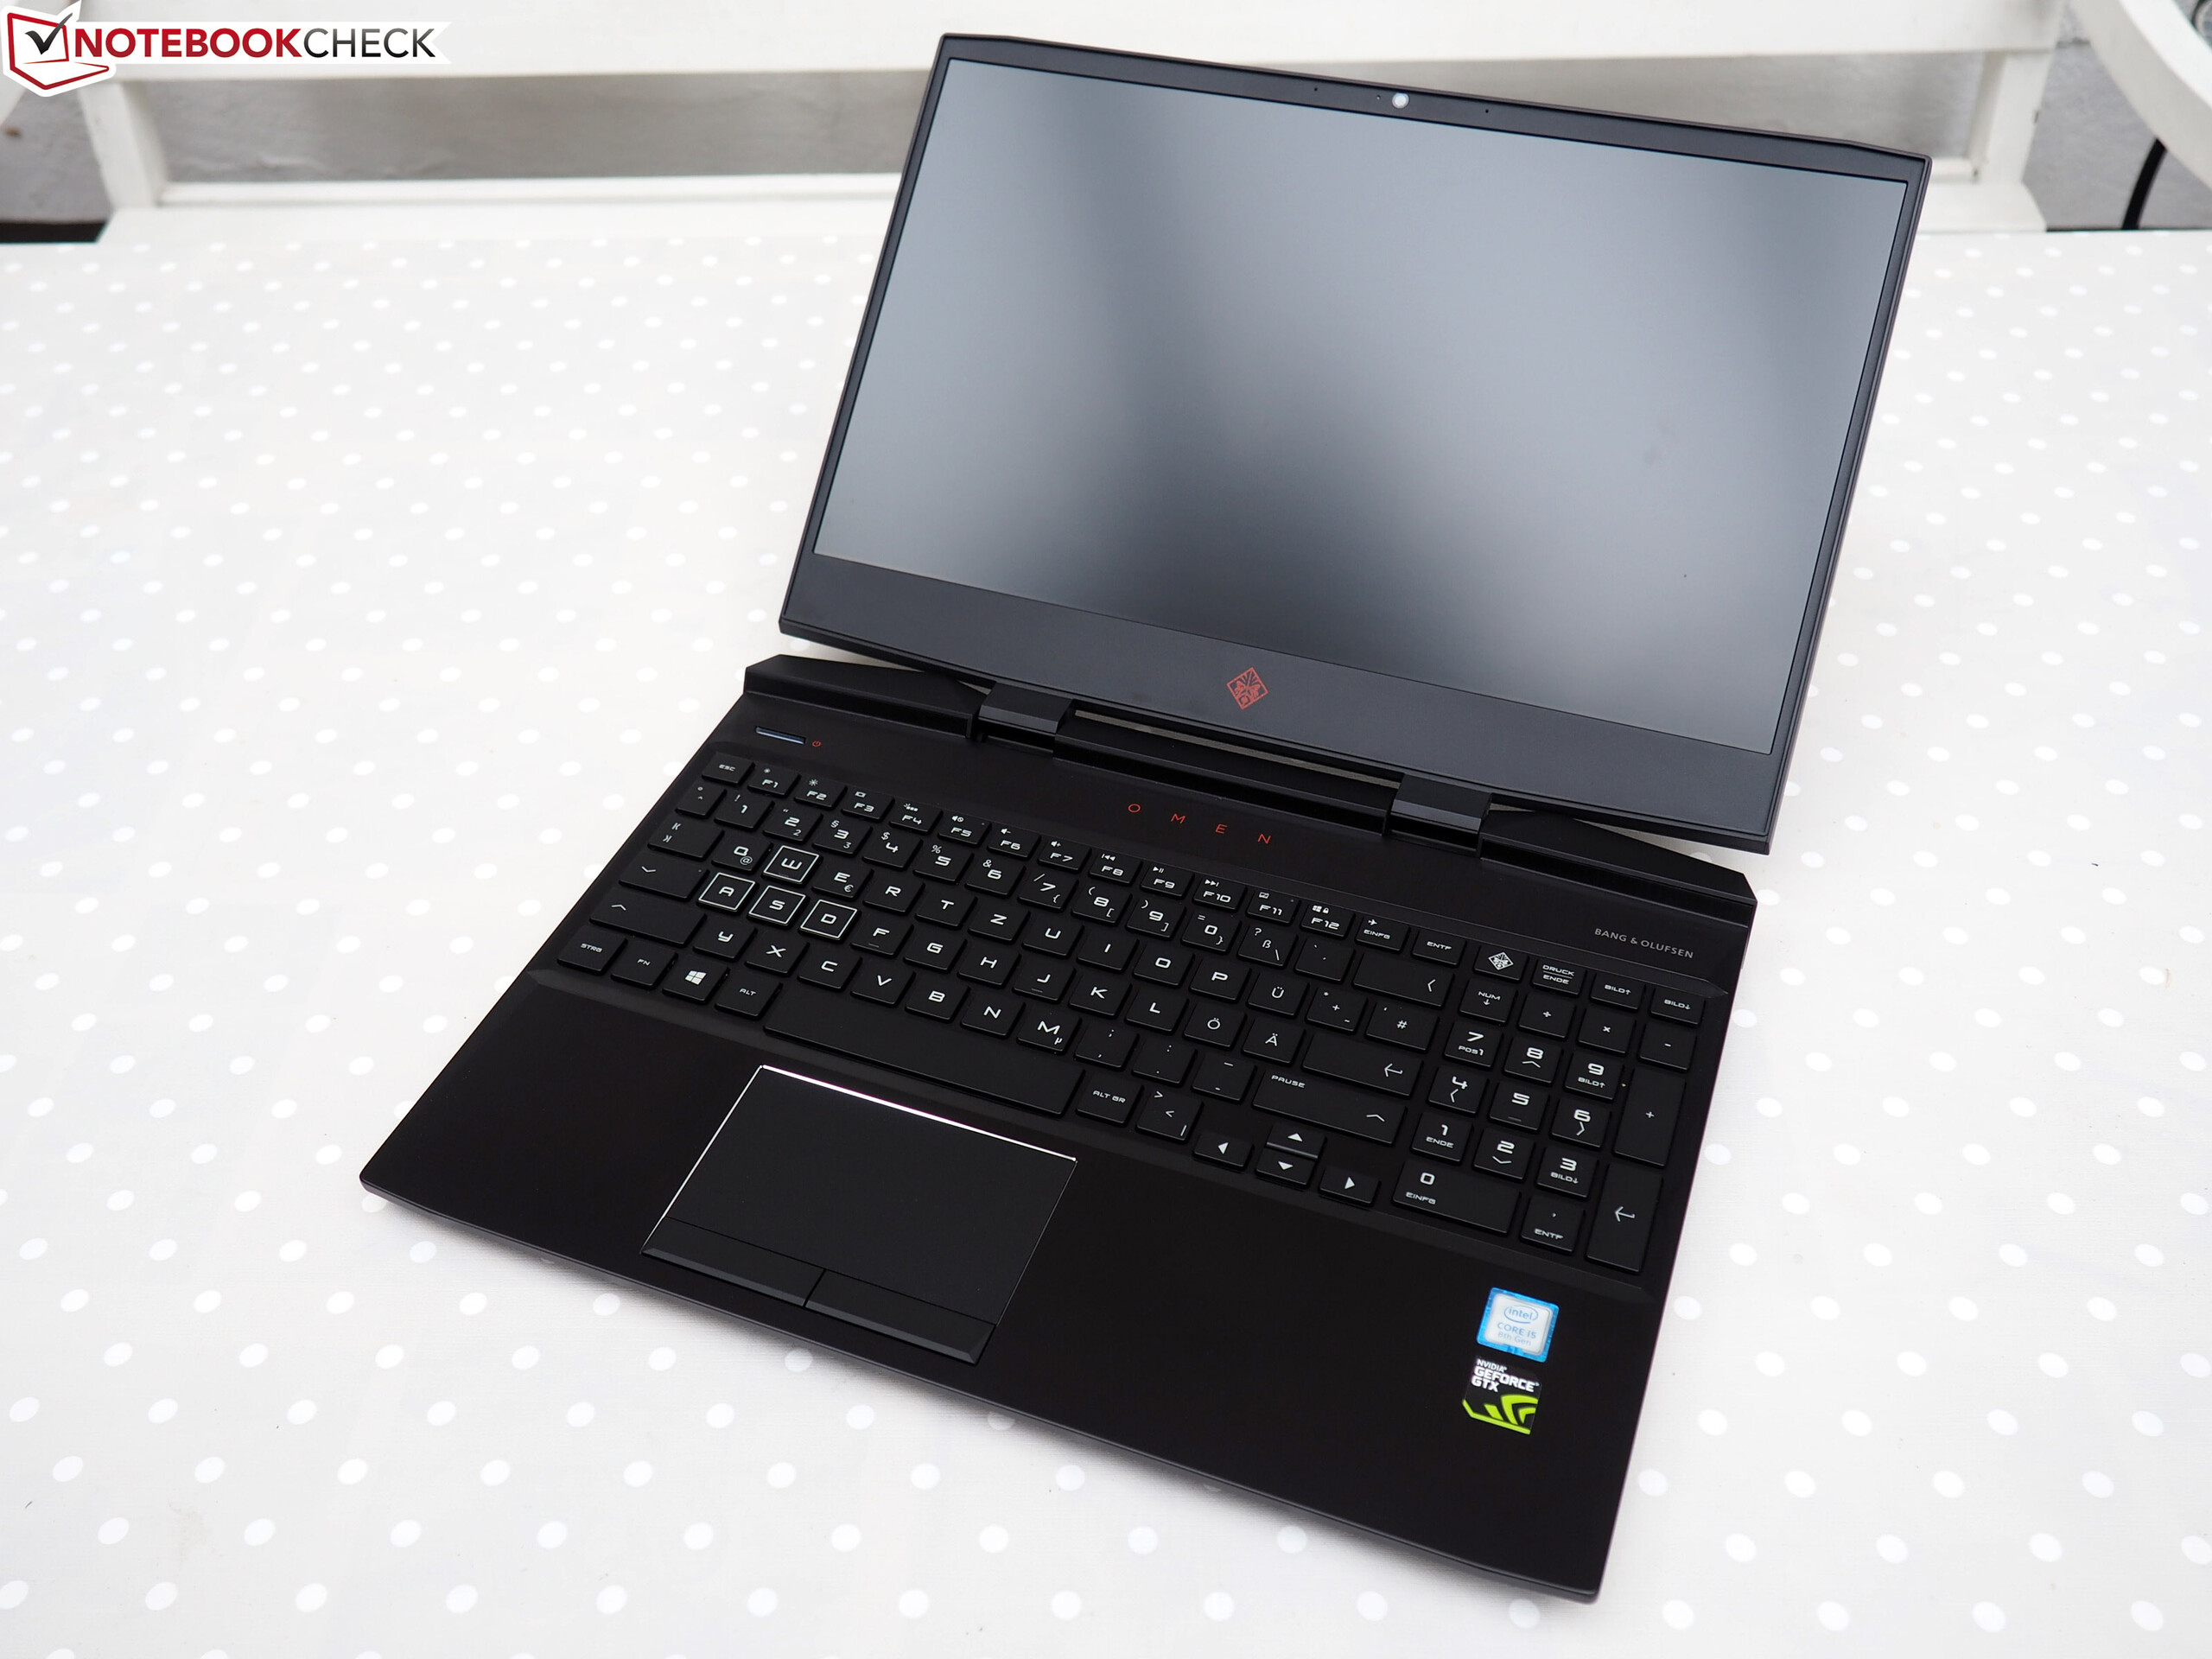
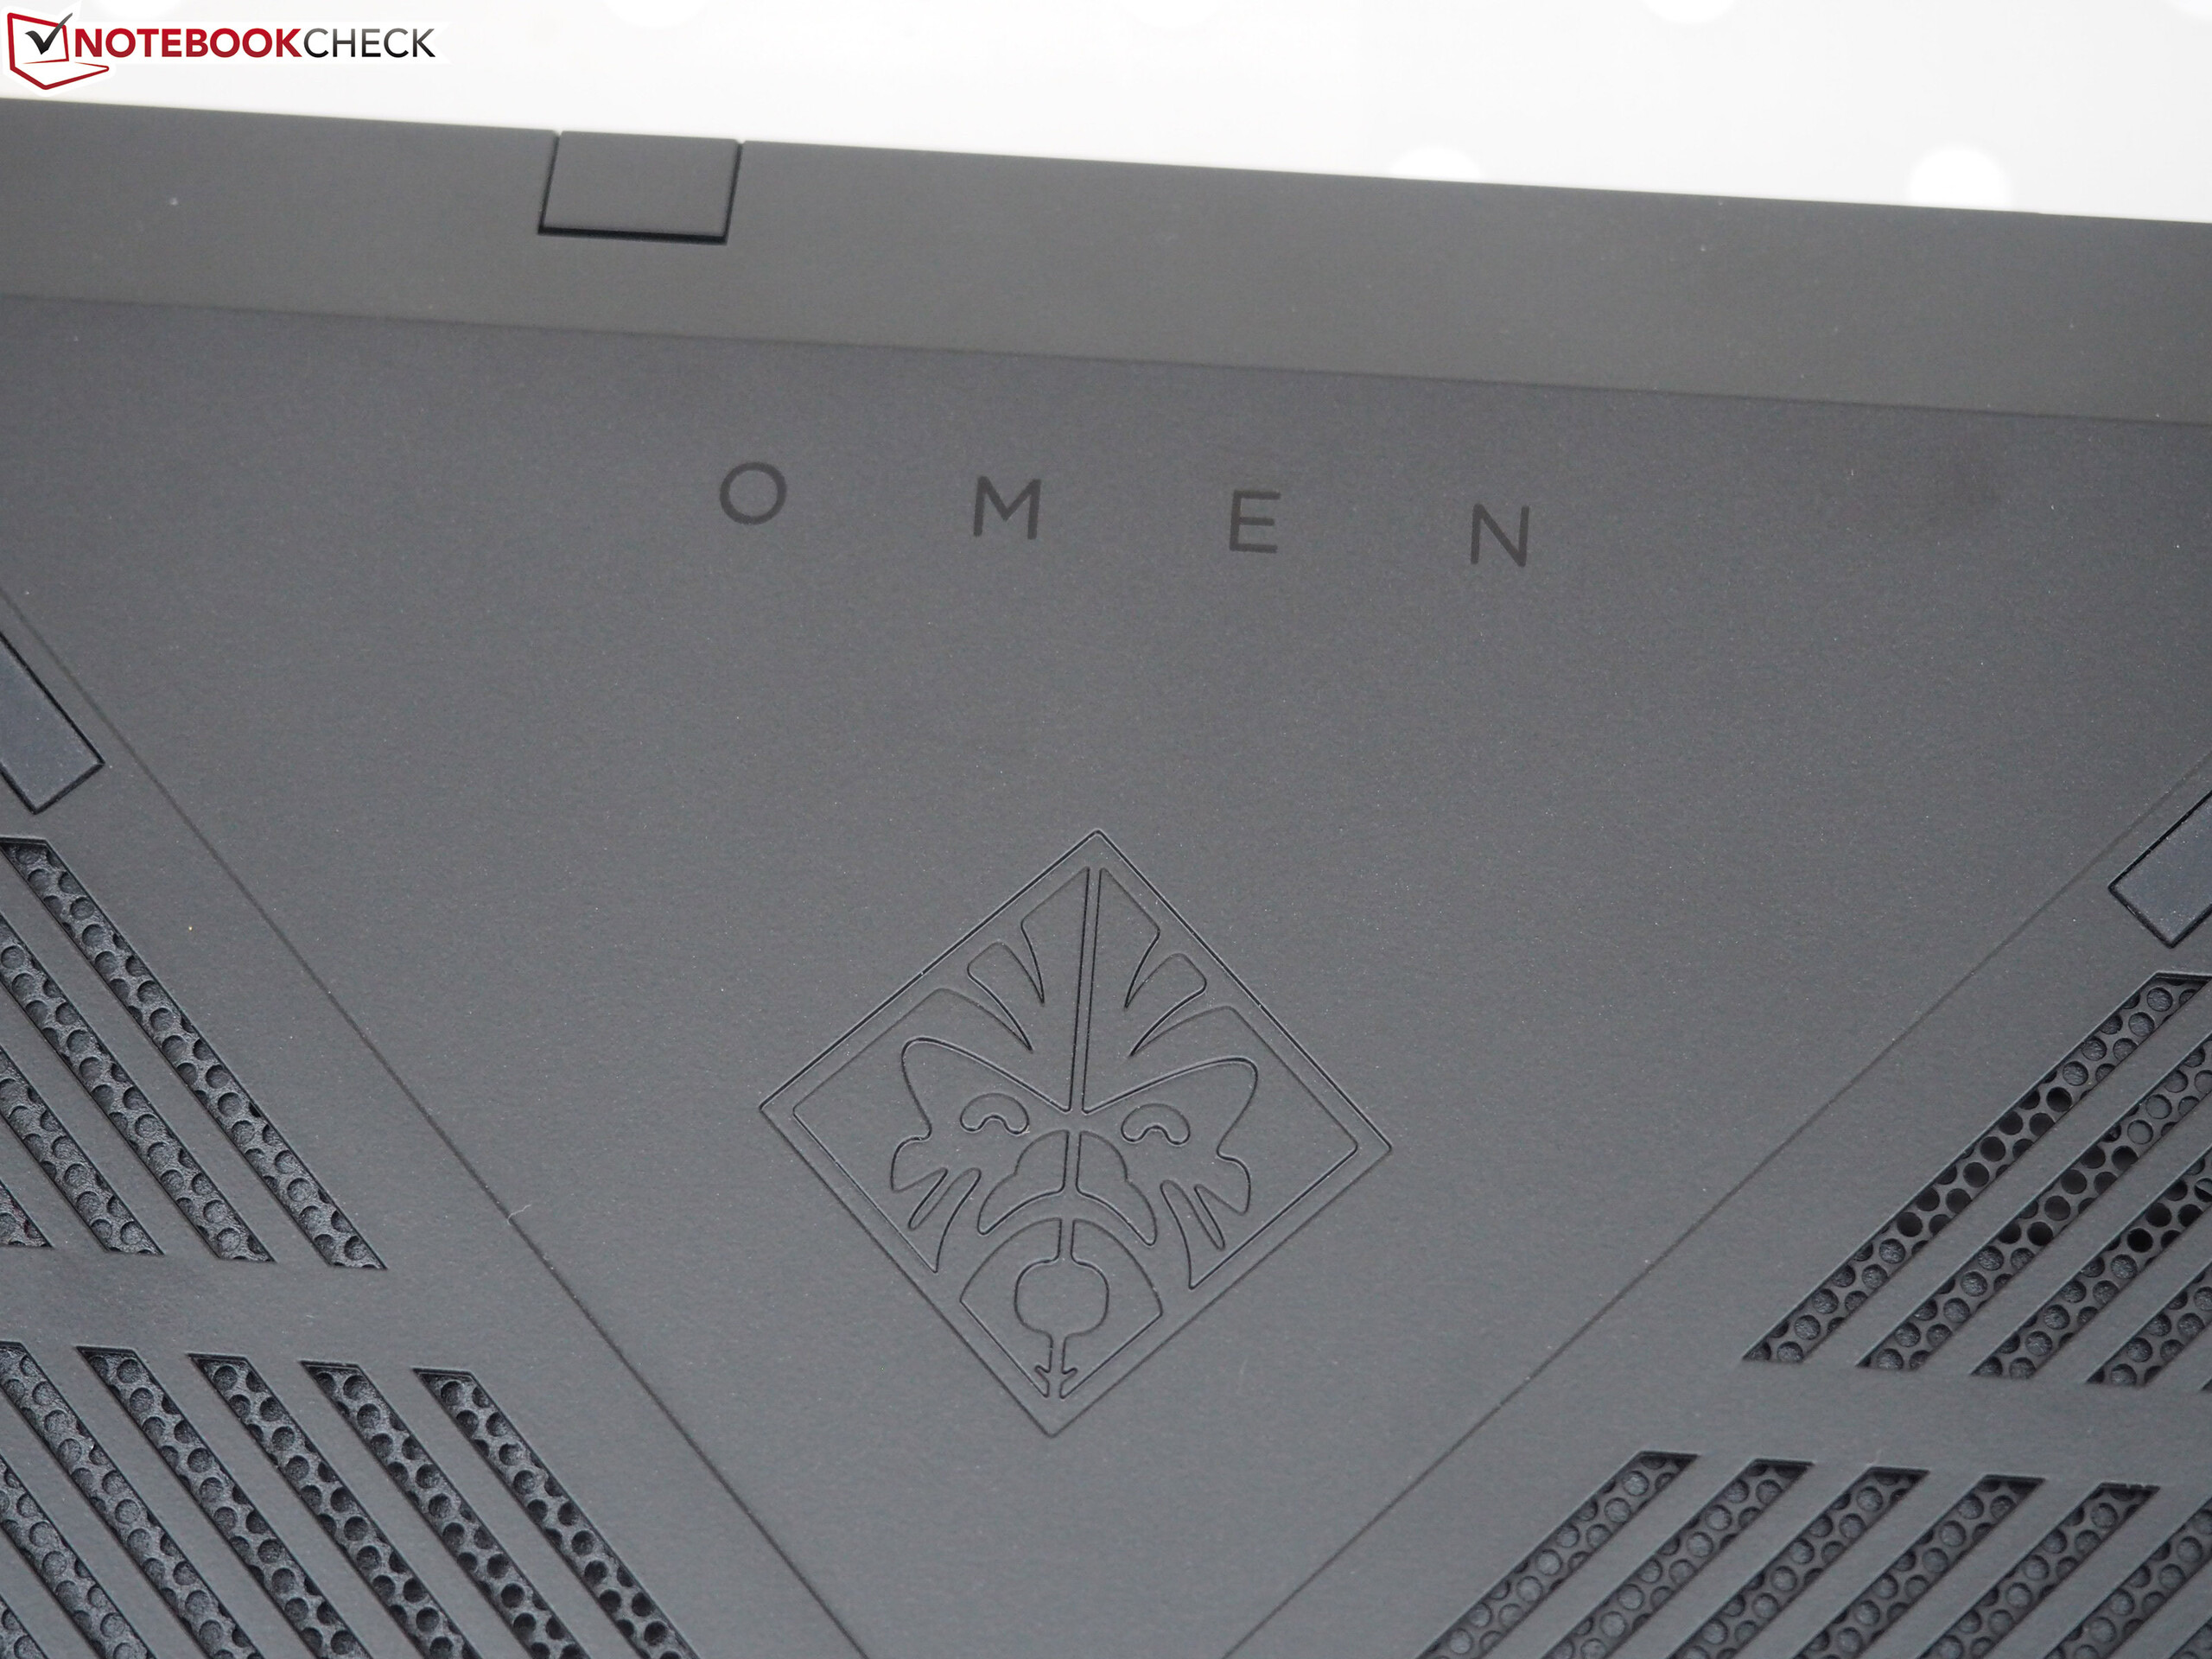
O atual modelo de nível básico da Hewlett Packard, o Omen 15, é um portátil para jogos bem equilibrado a um preço moderado.
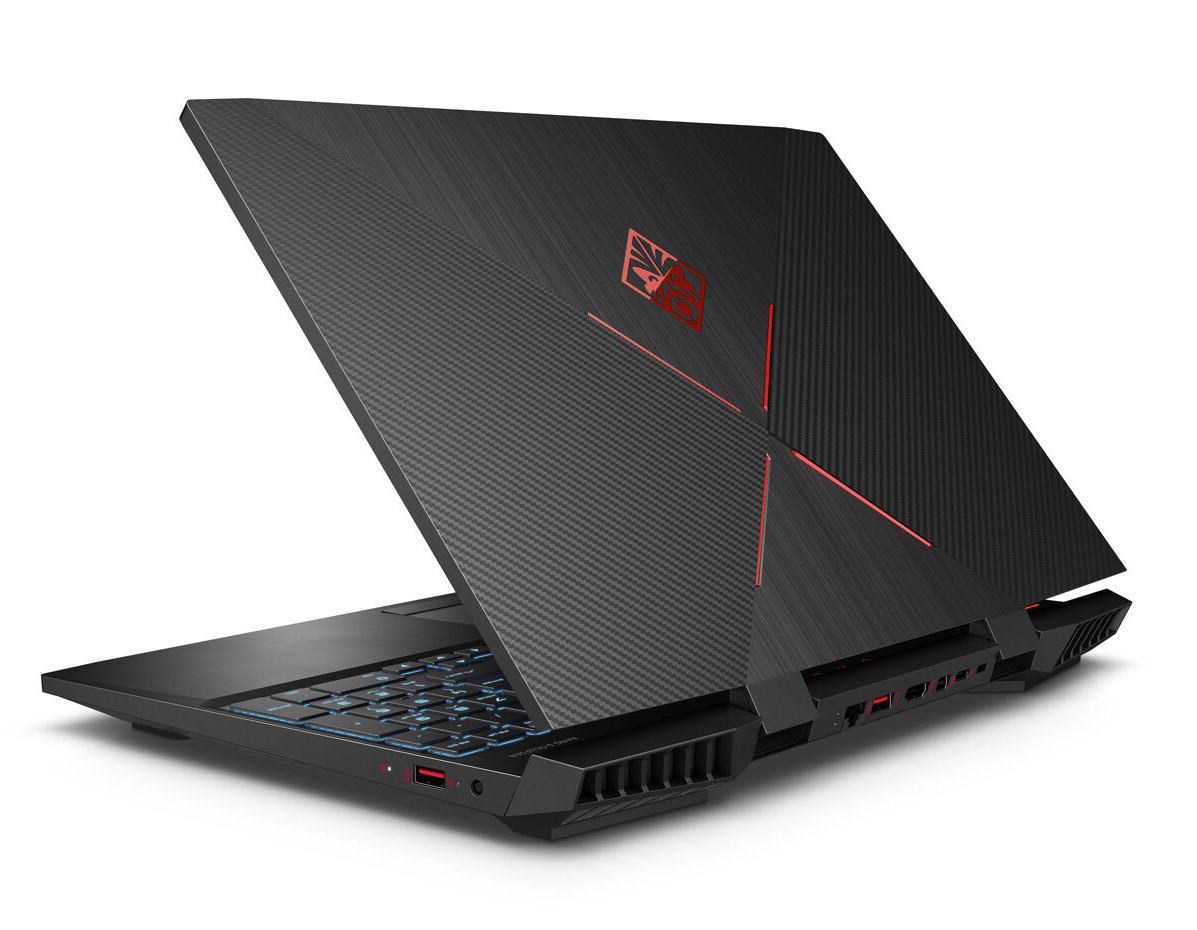
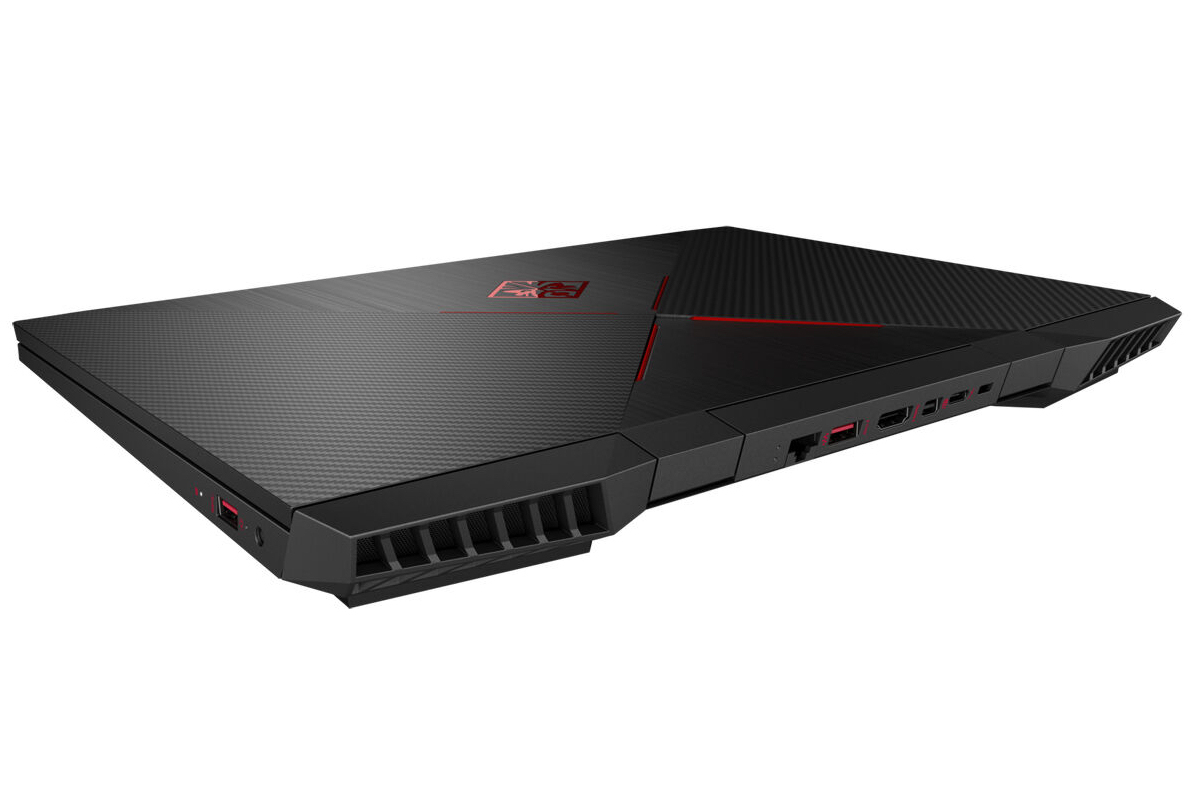
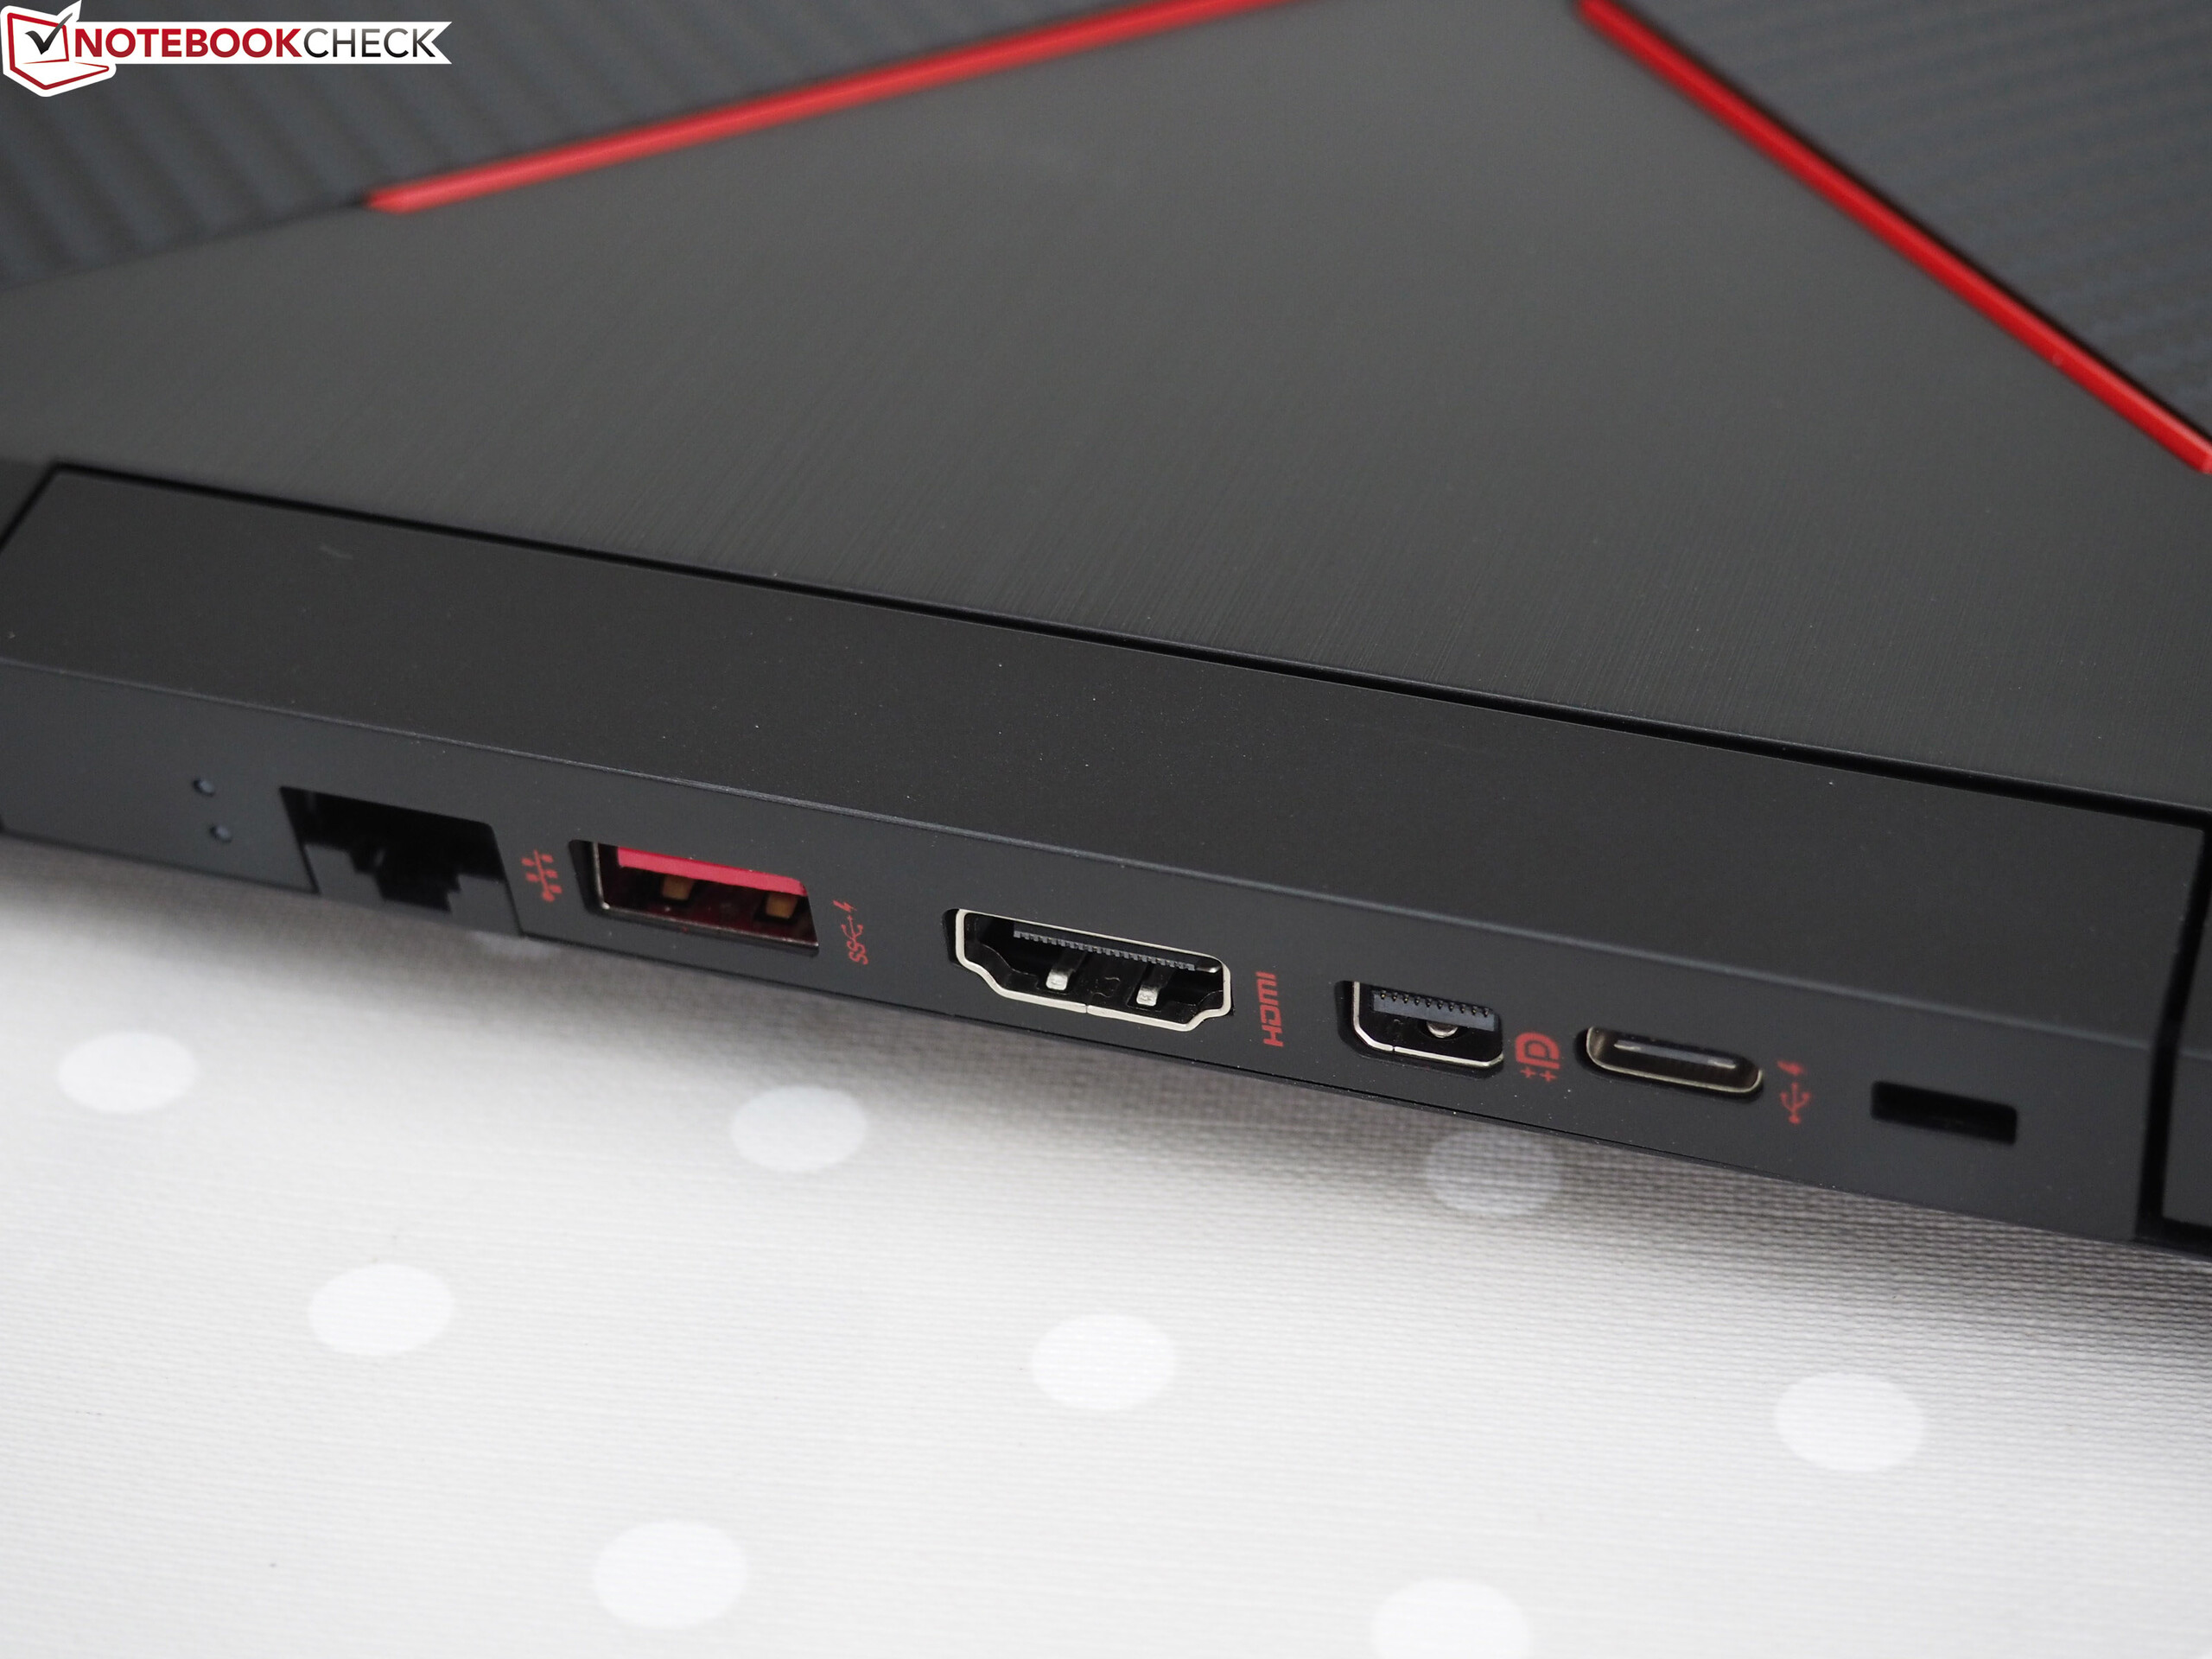
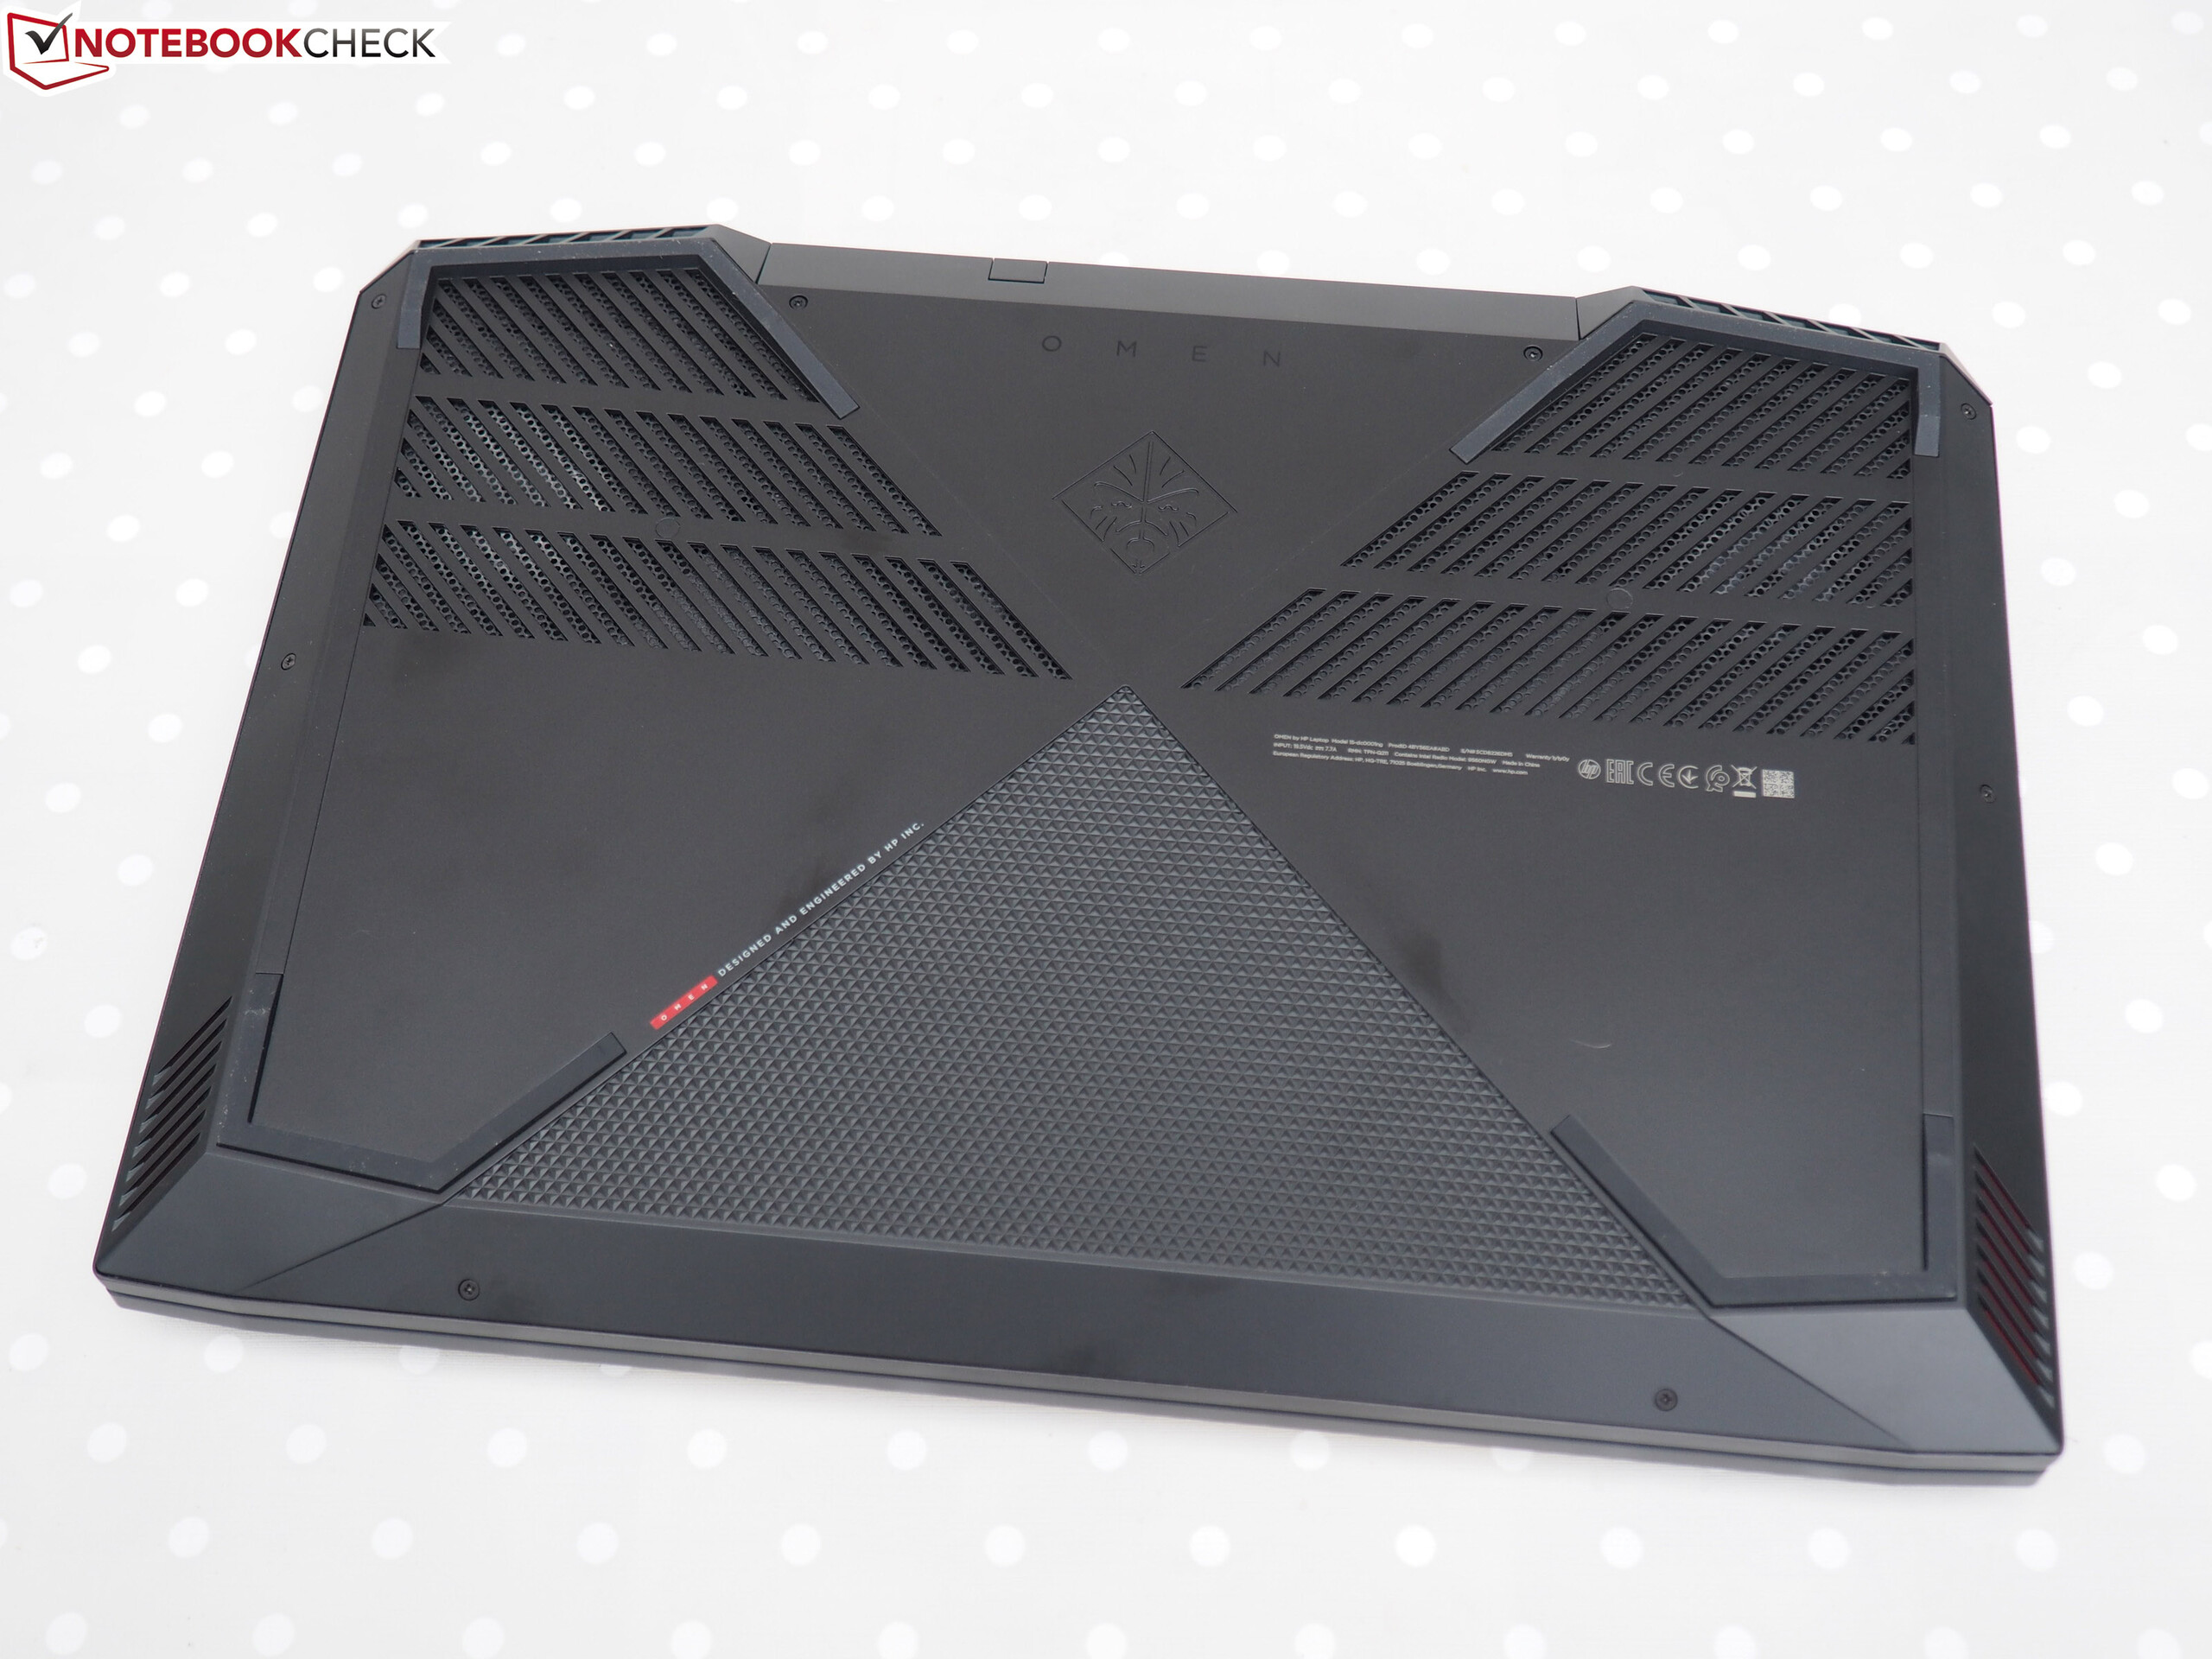
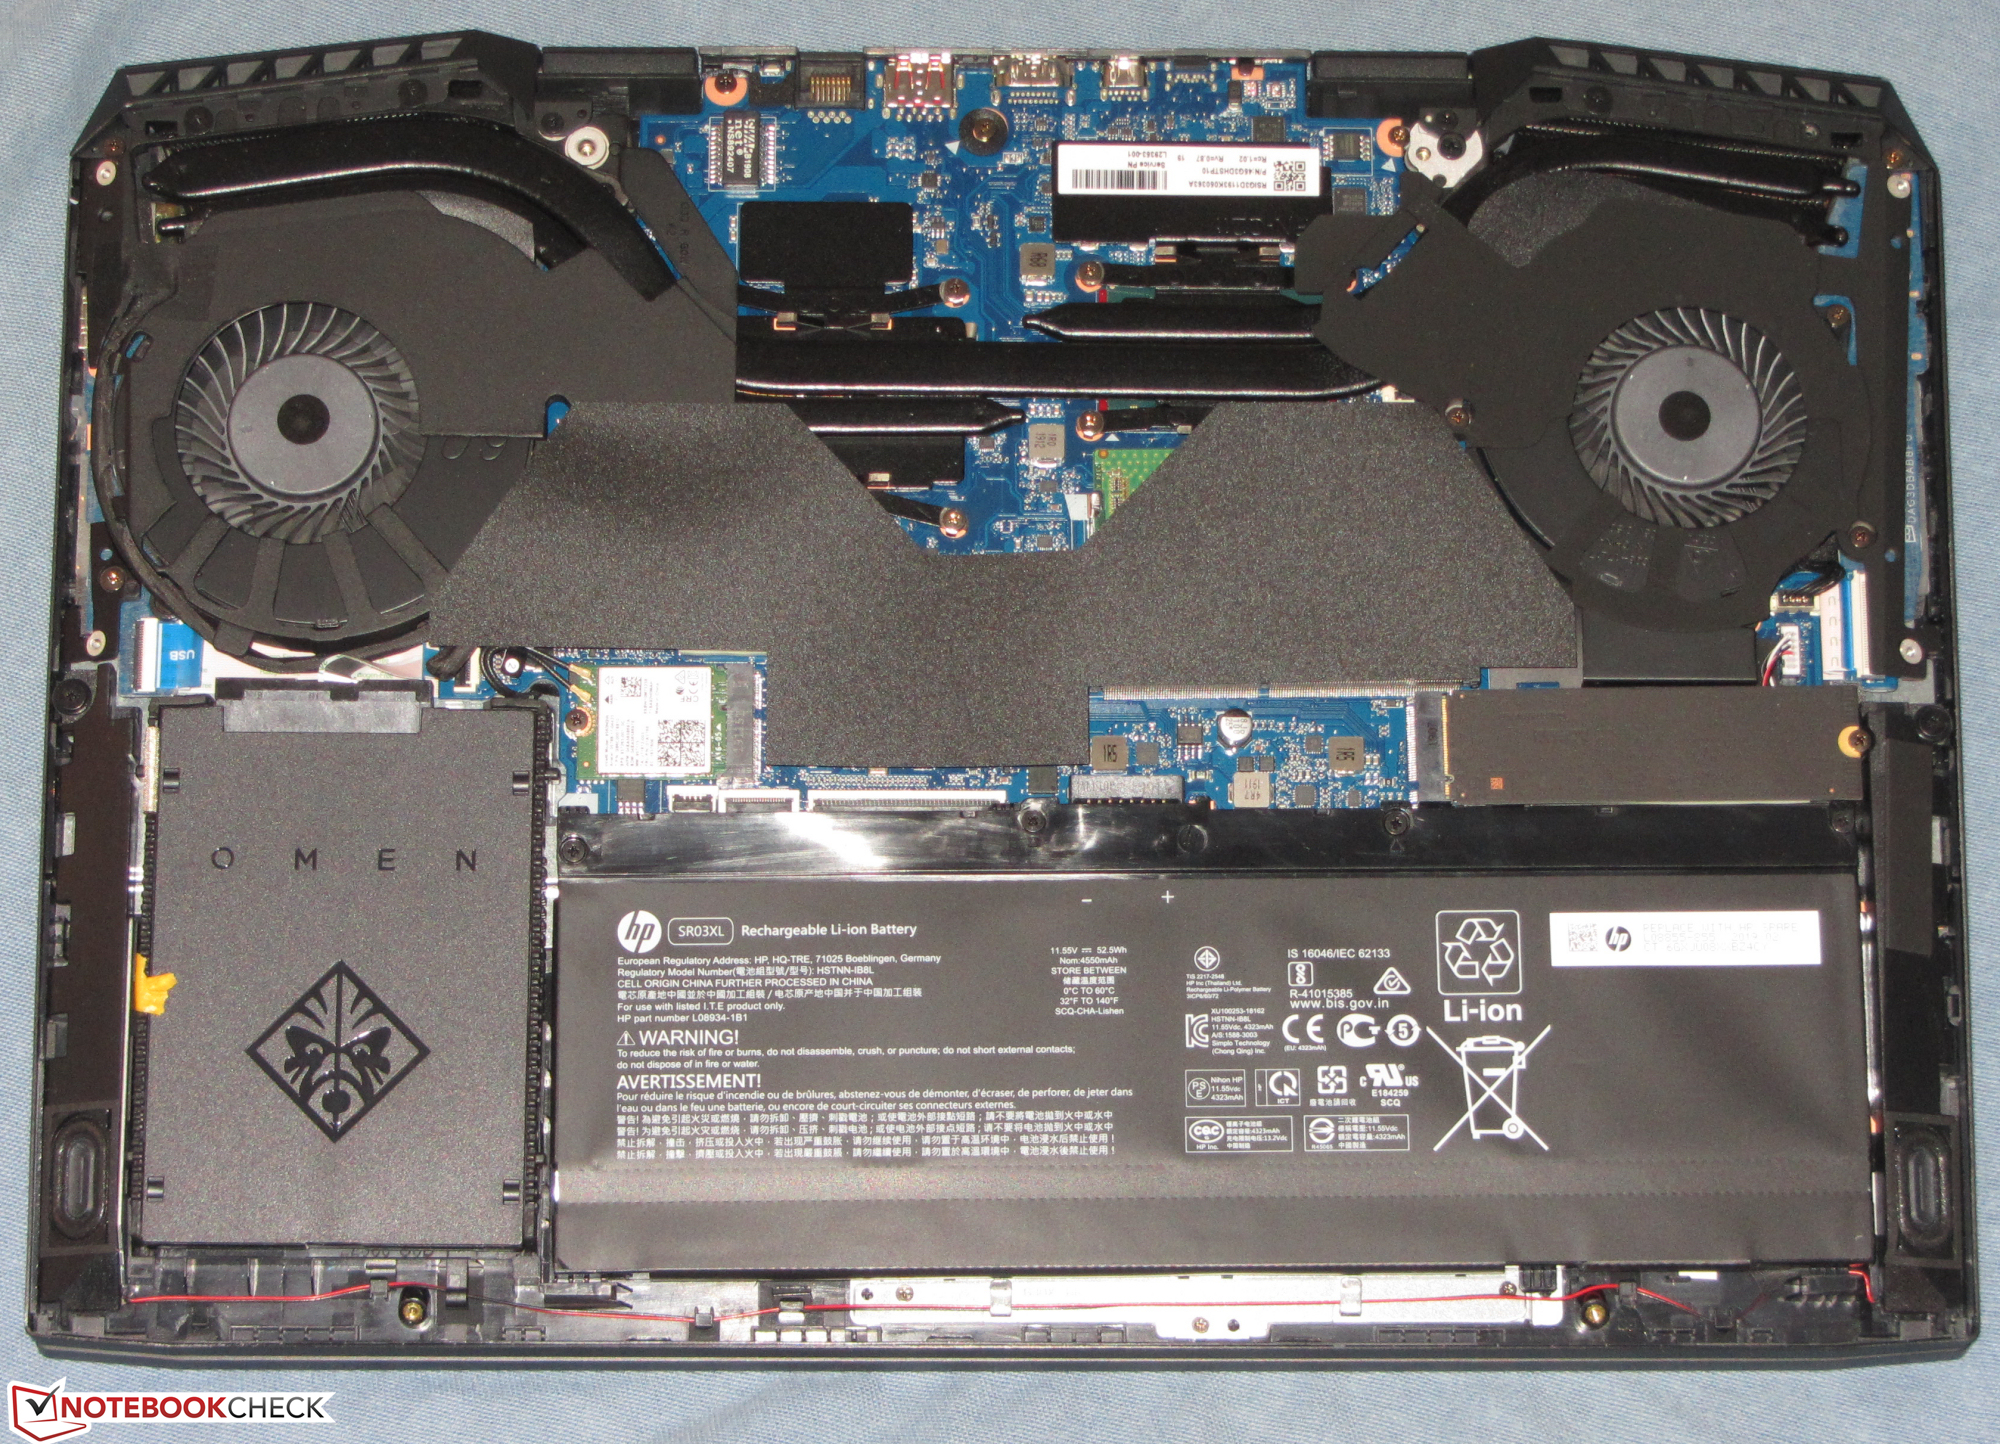
A HP também optou por um rápido SSD NVMe de 512 GB, que pode ser atualizado para um dispositivo de armazenamento mais espaçoso. Além disso, os usuários podem adicionar um SSD ou HD secundário de 2,5 polegadas. Um compartimento de armazenamento e um quadro de montagem estão incluídos por padrão.
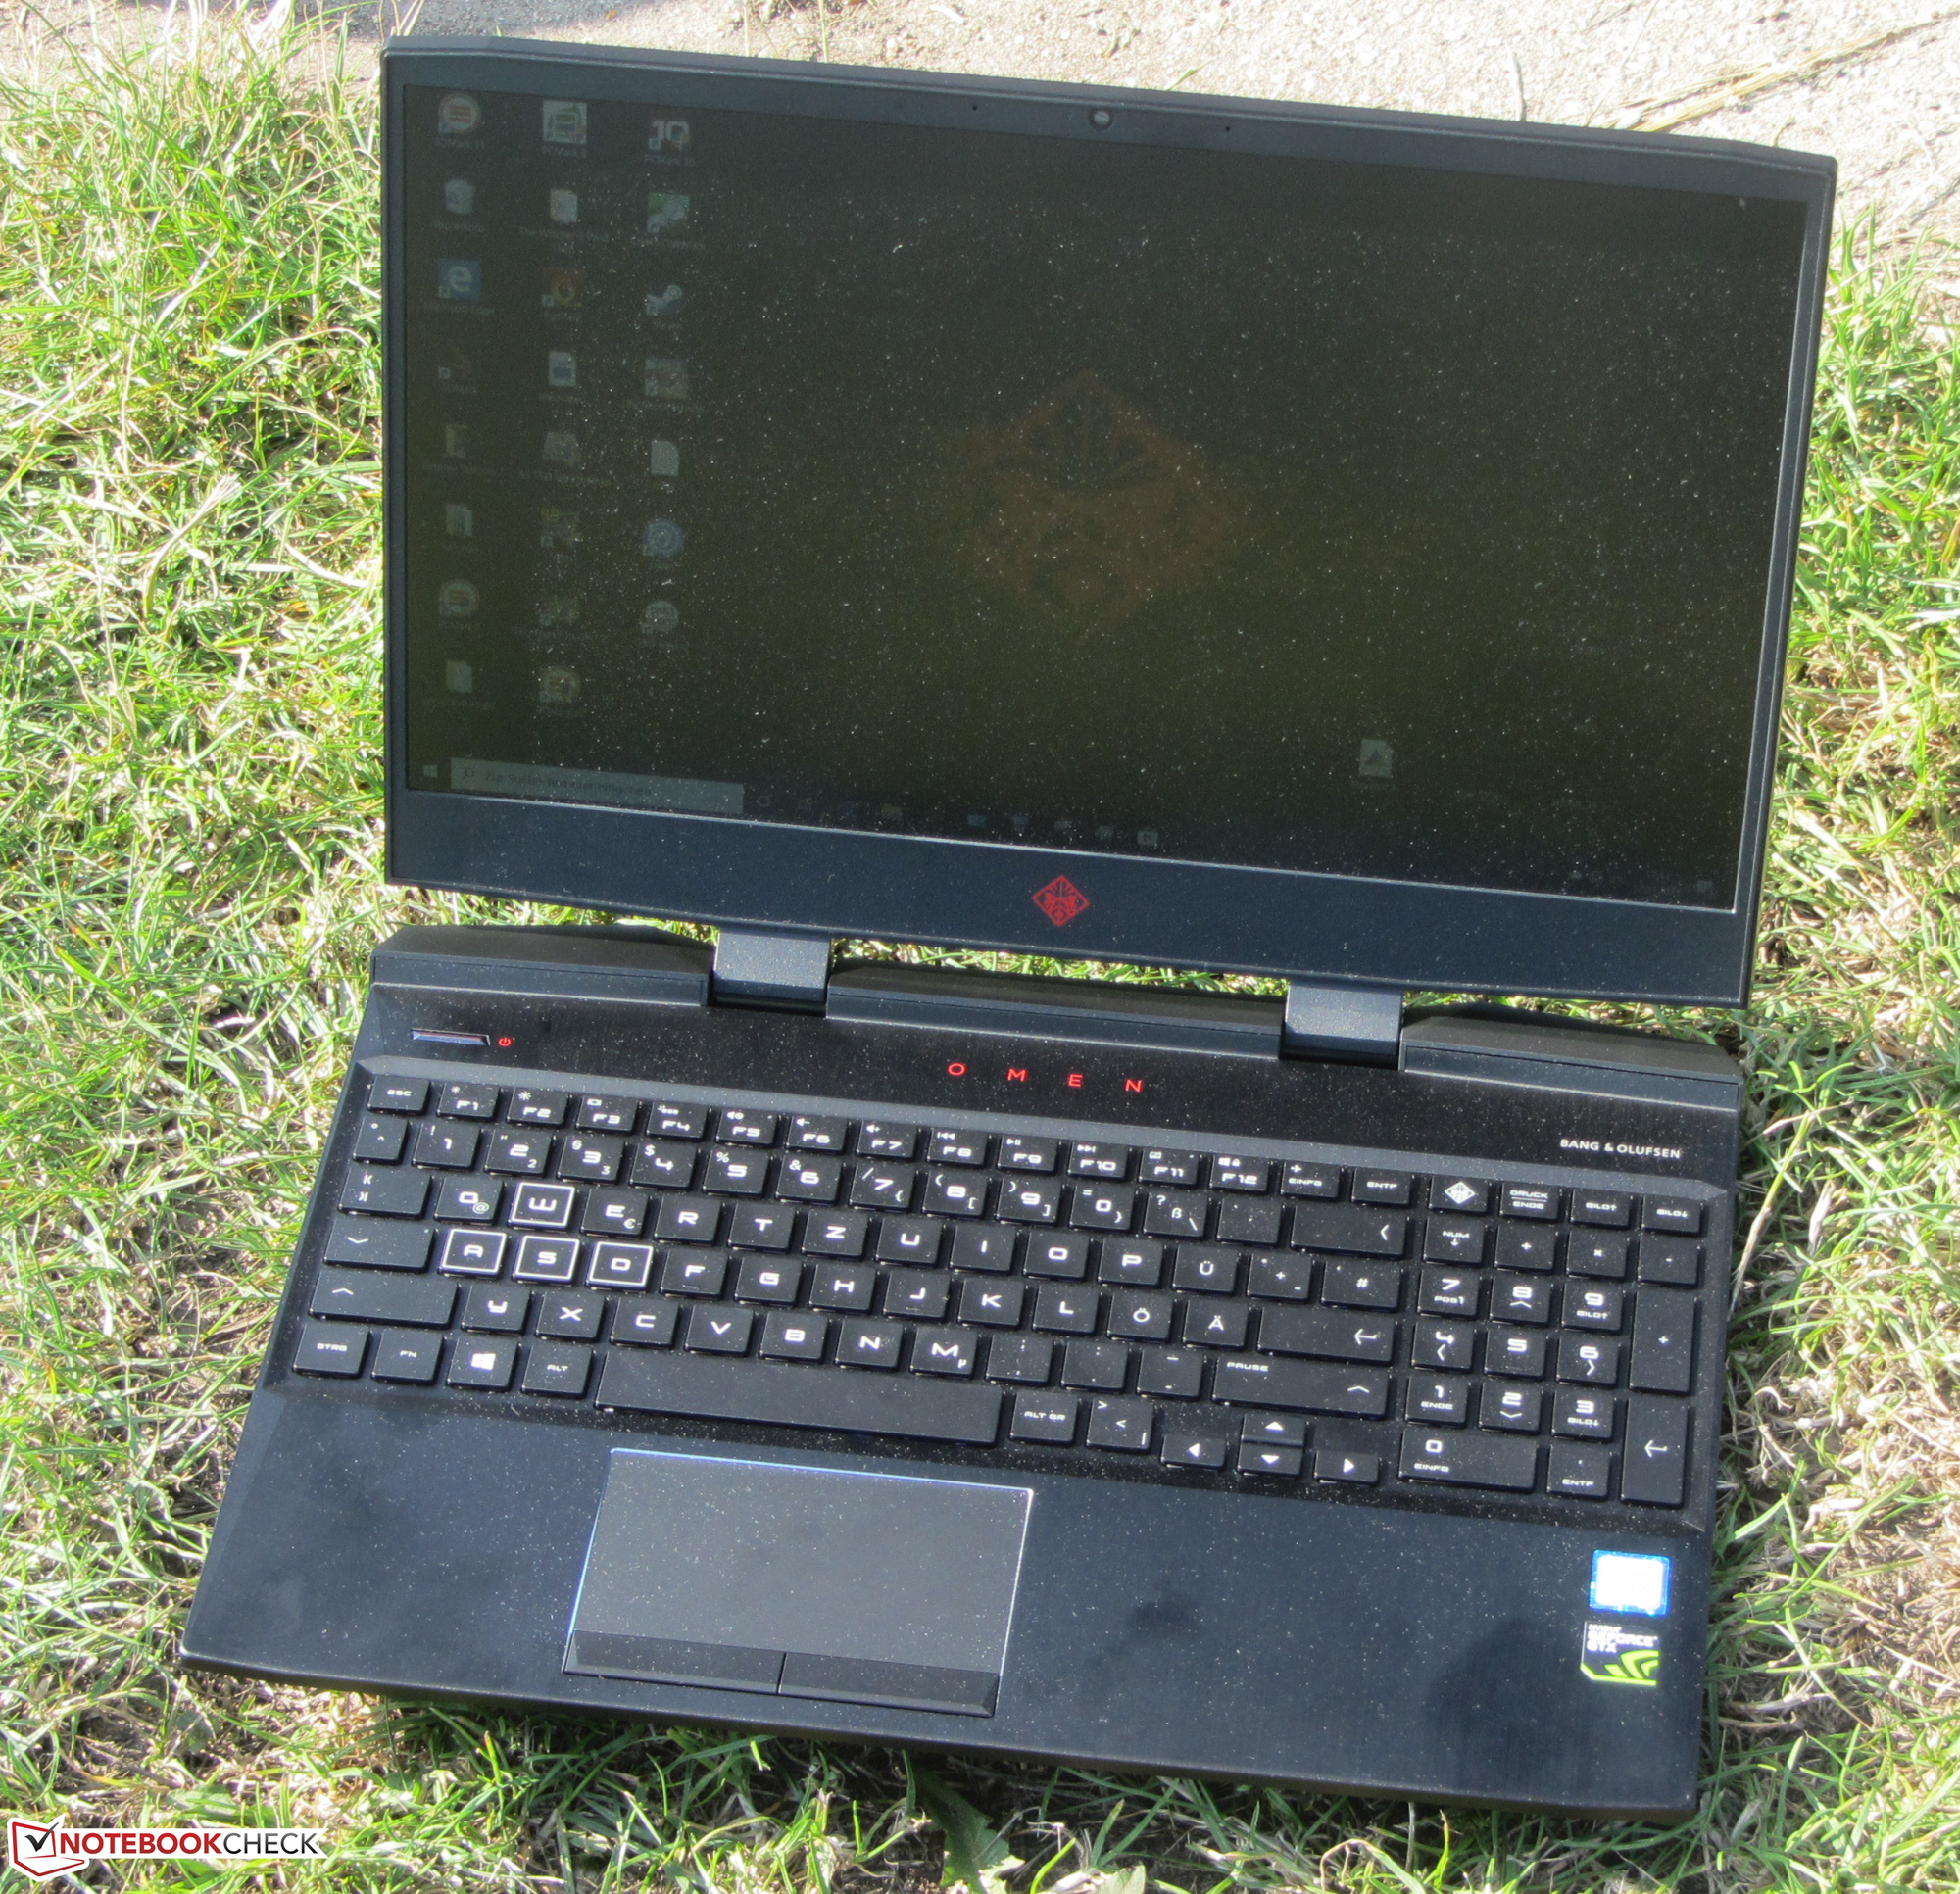
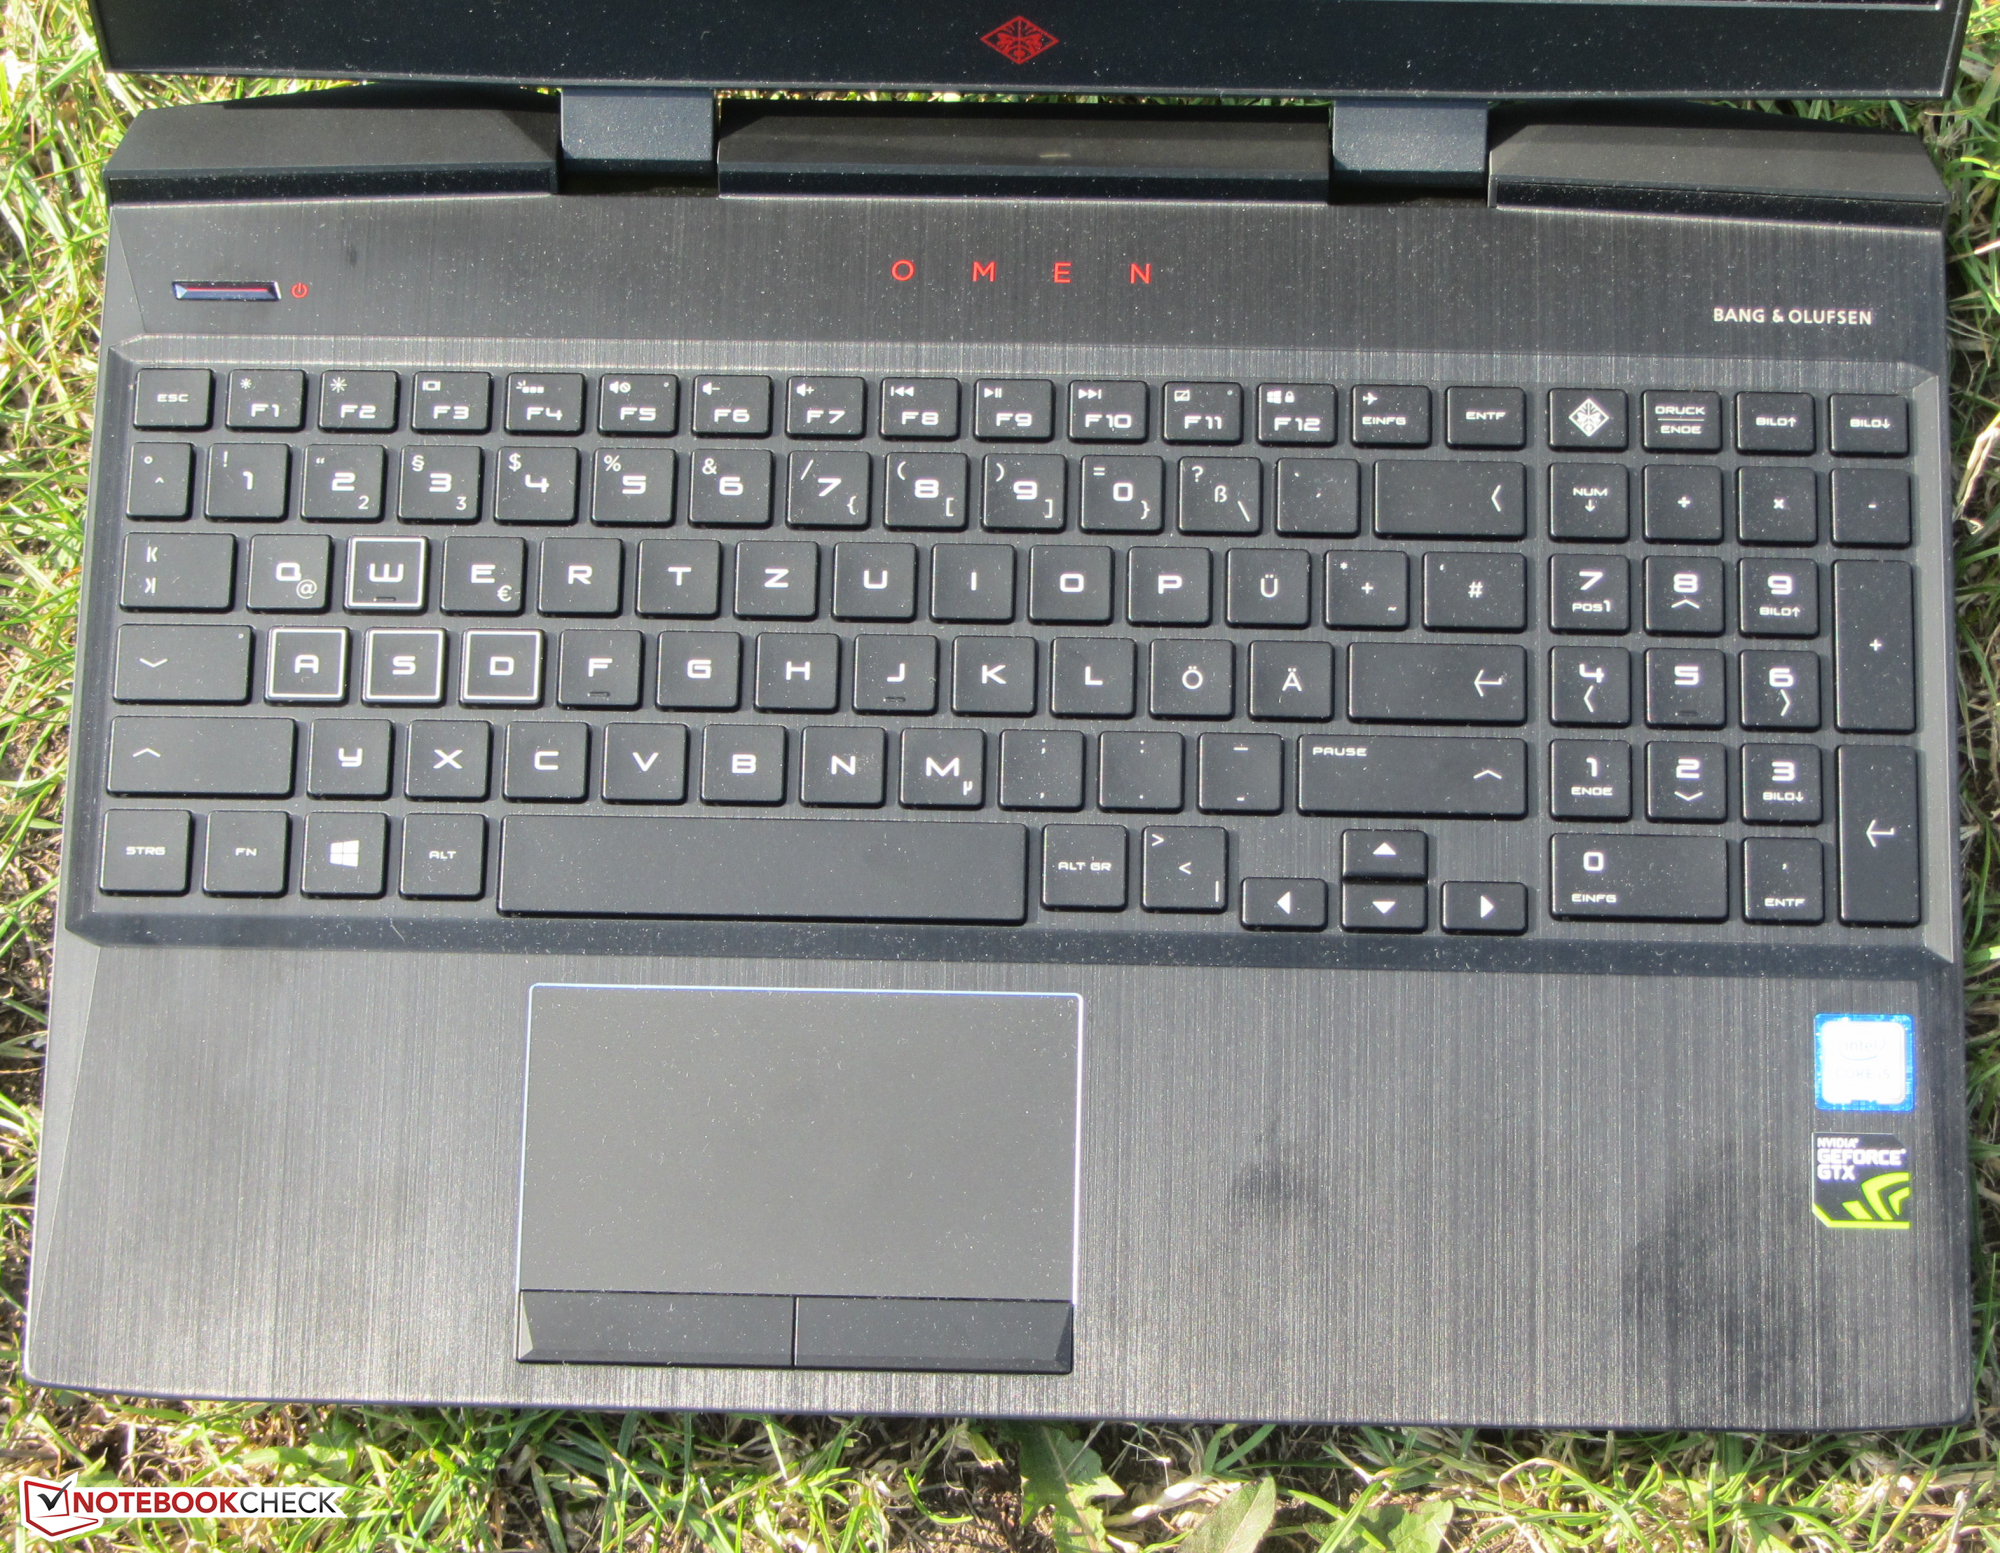
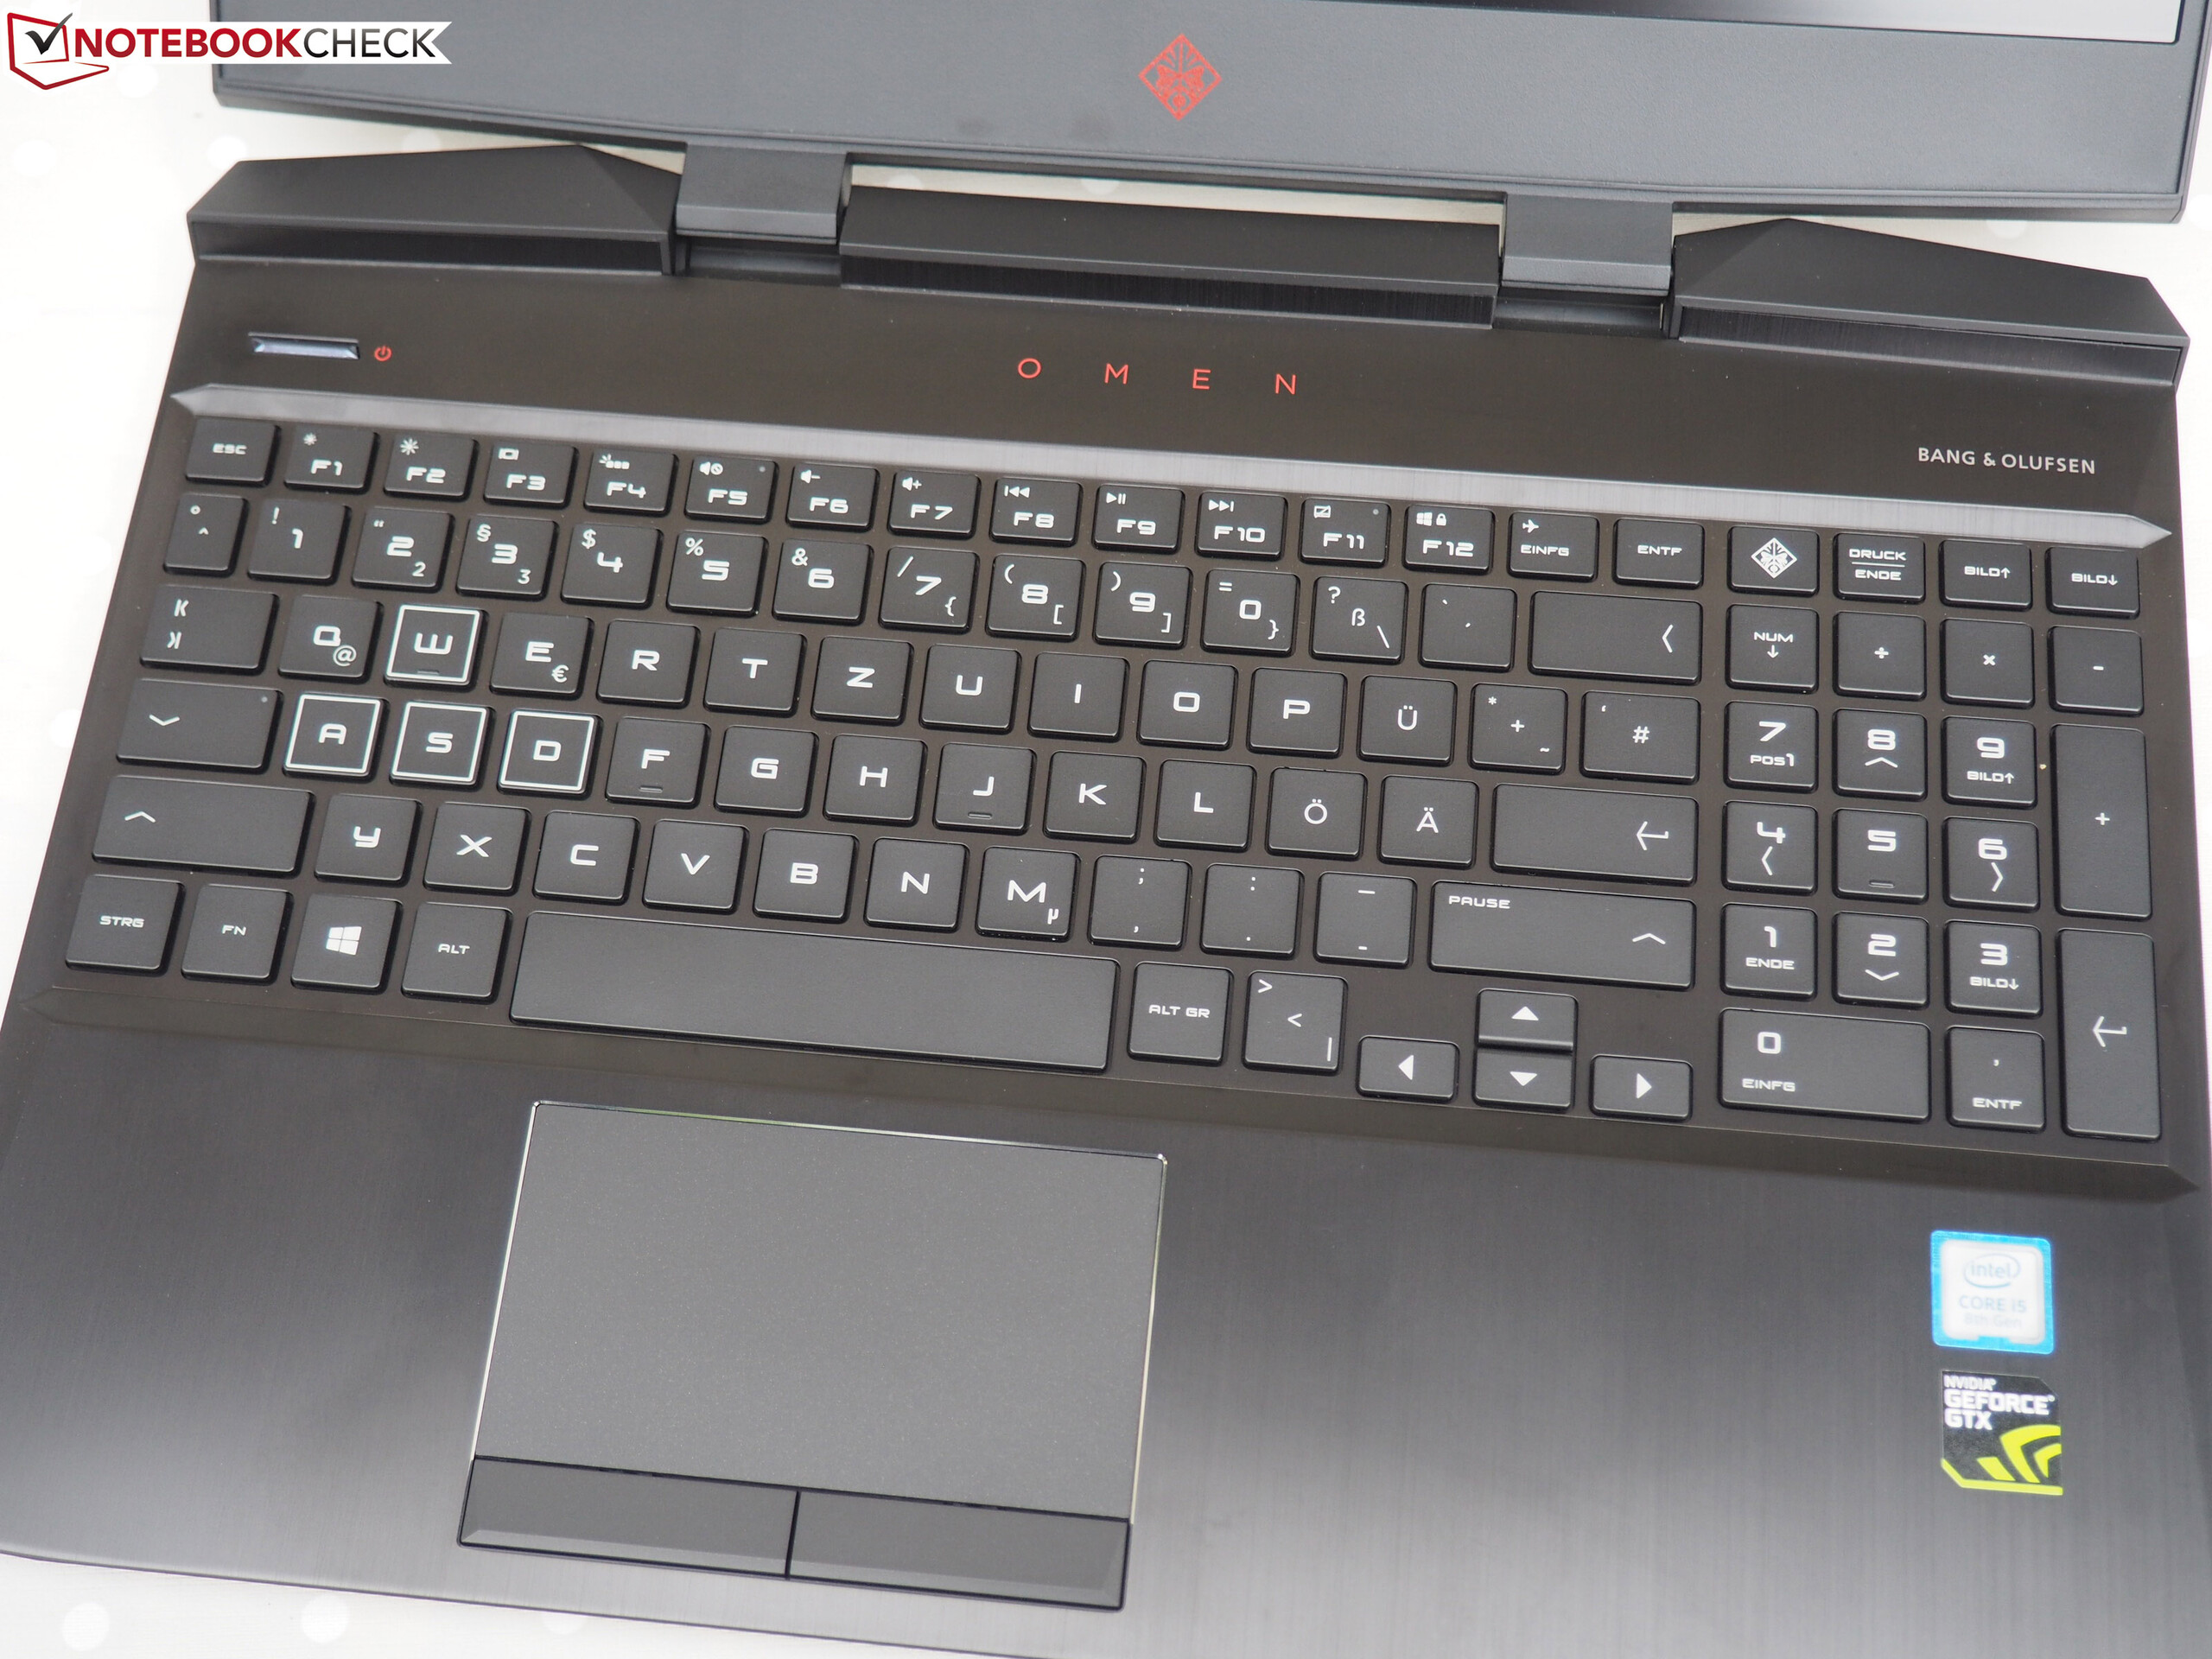
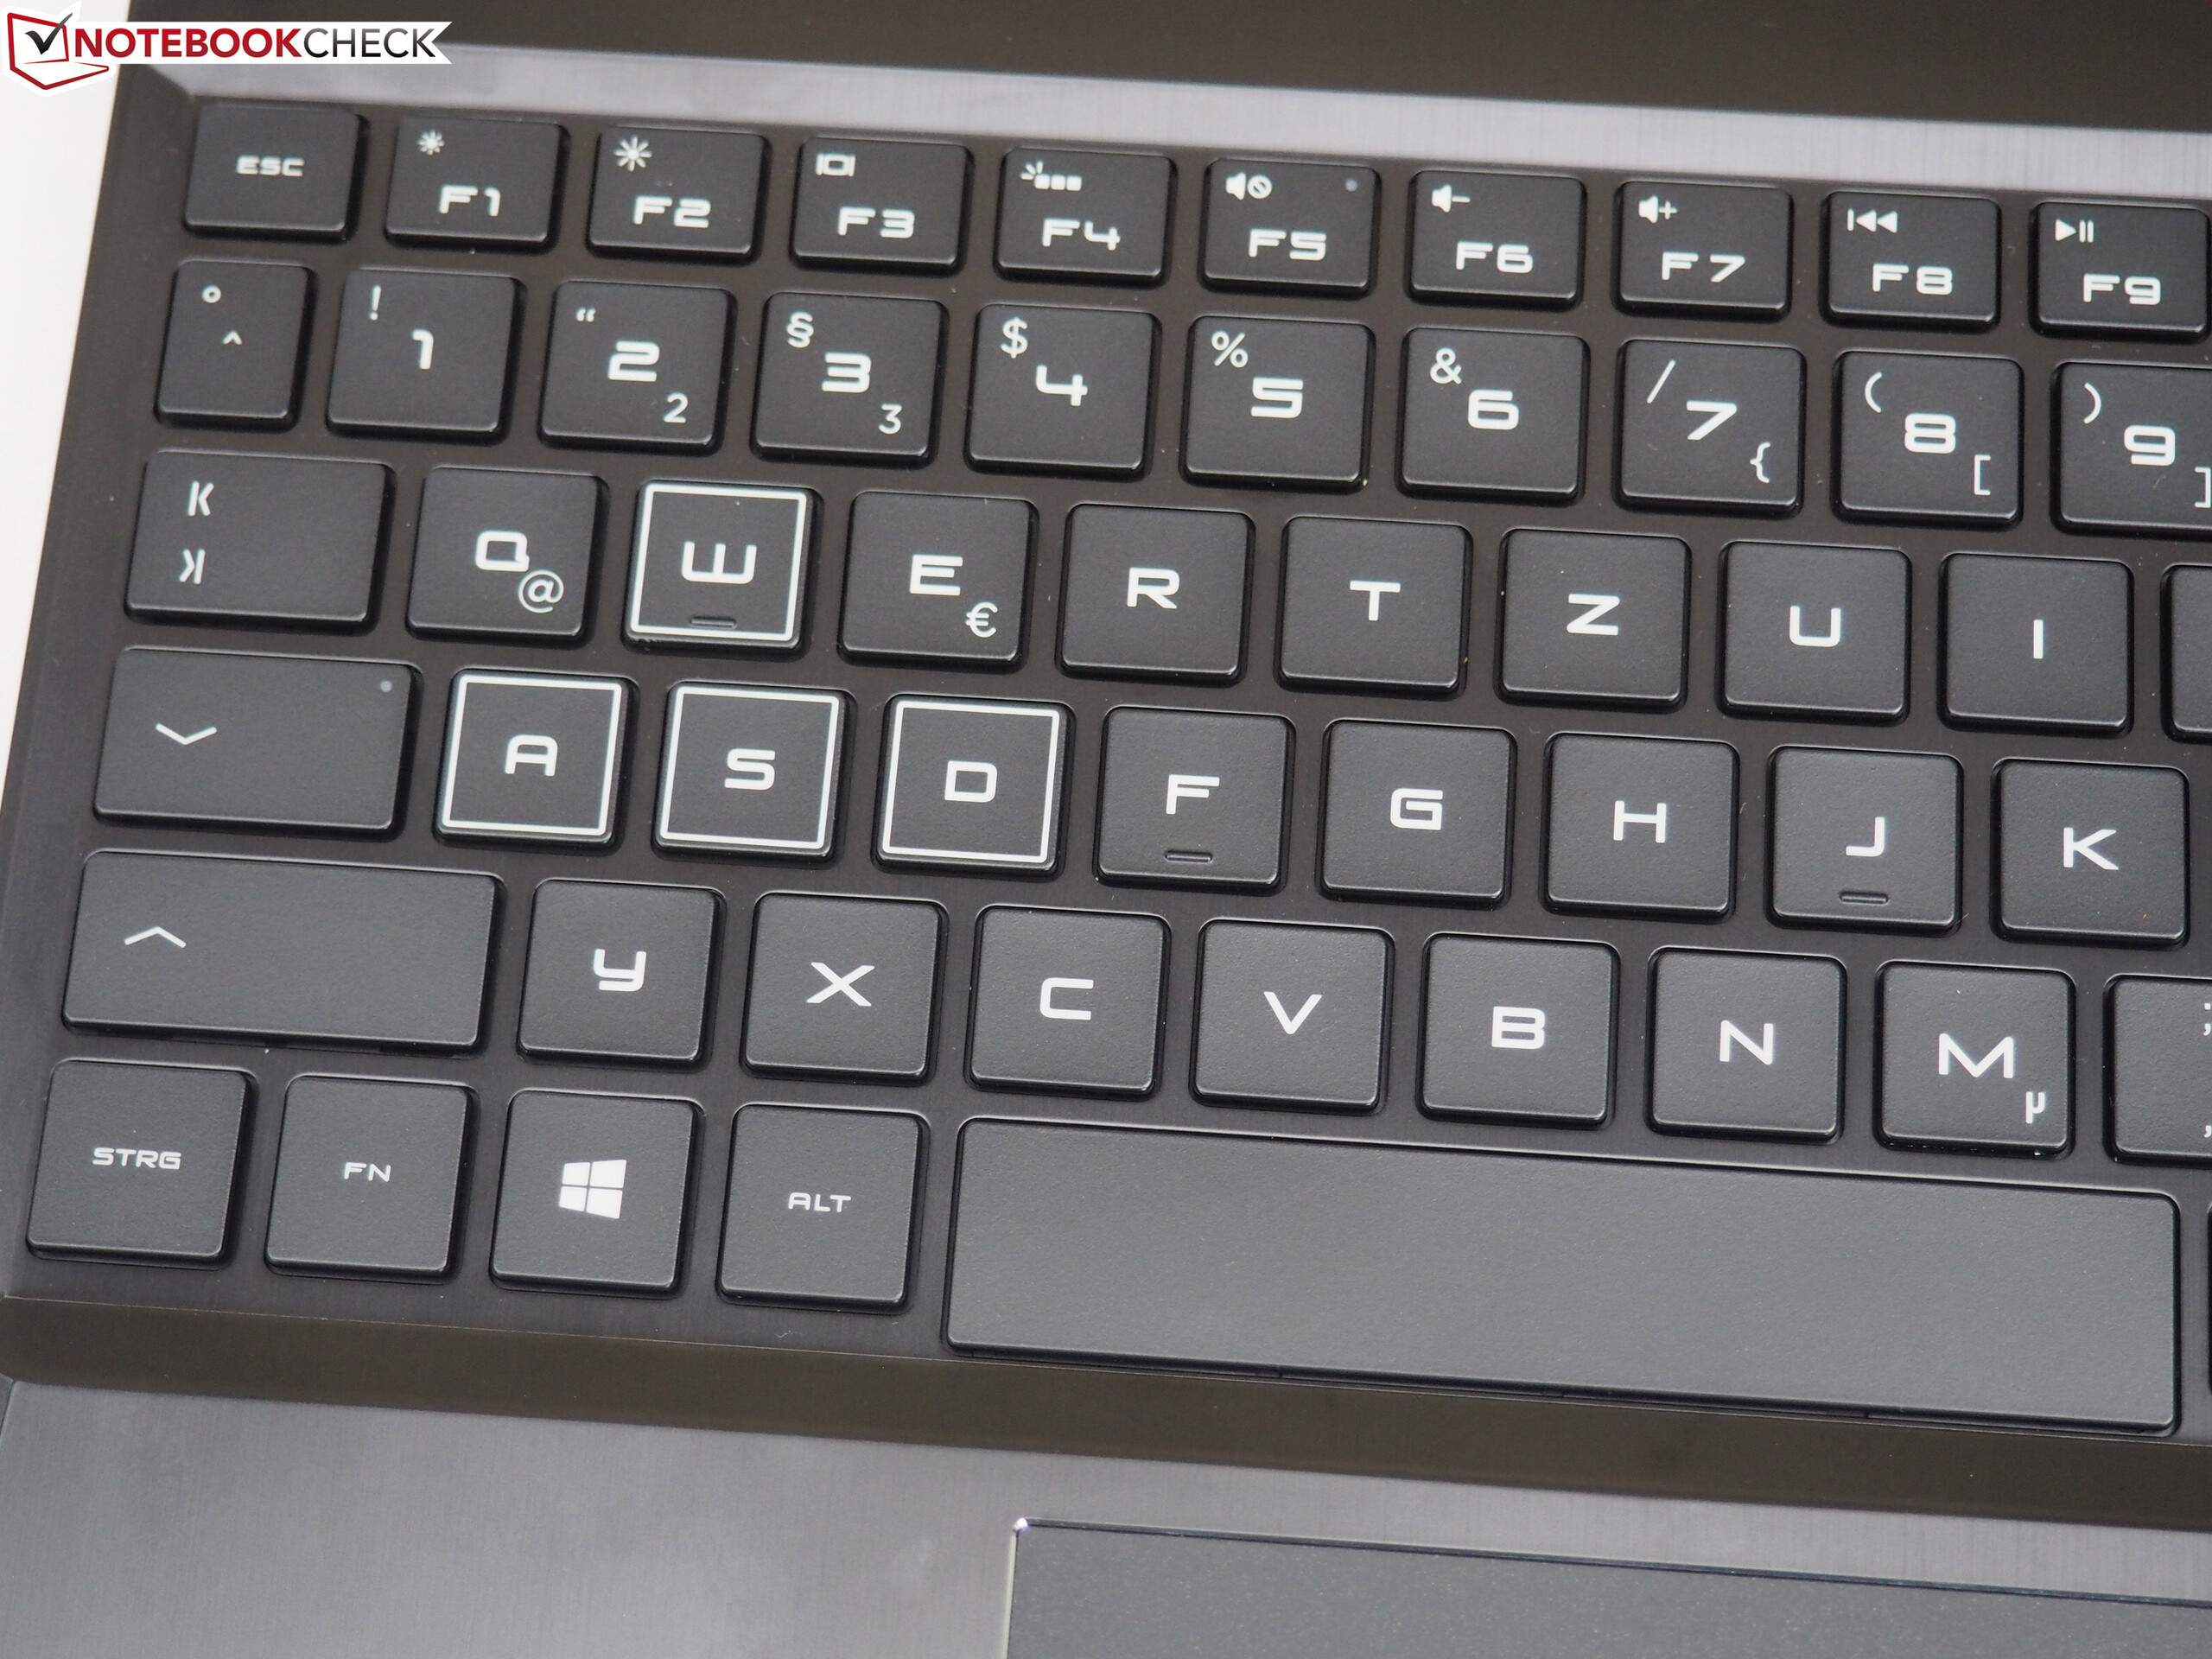
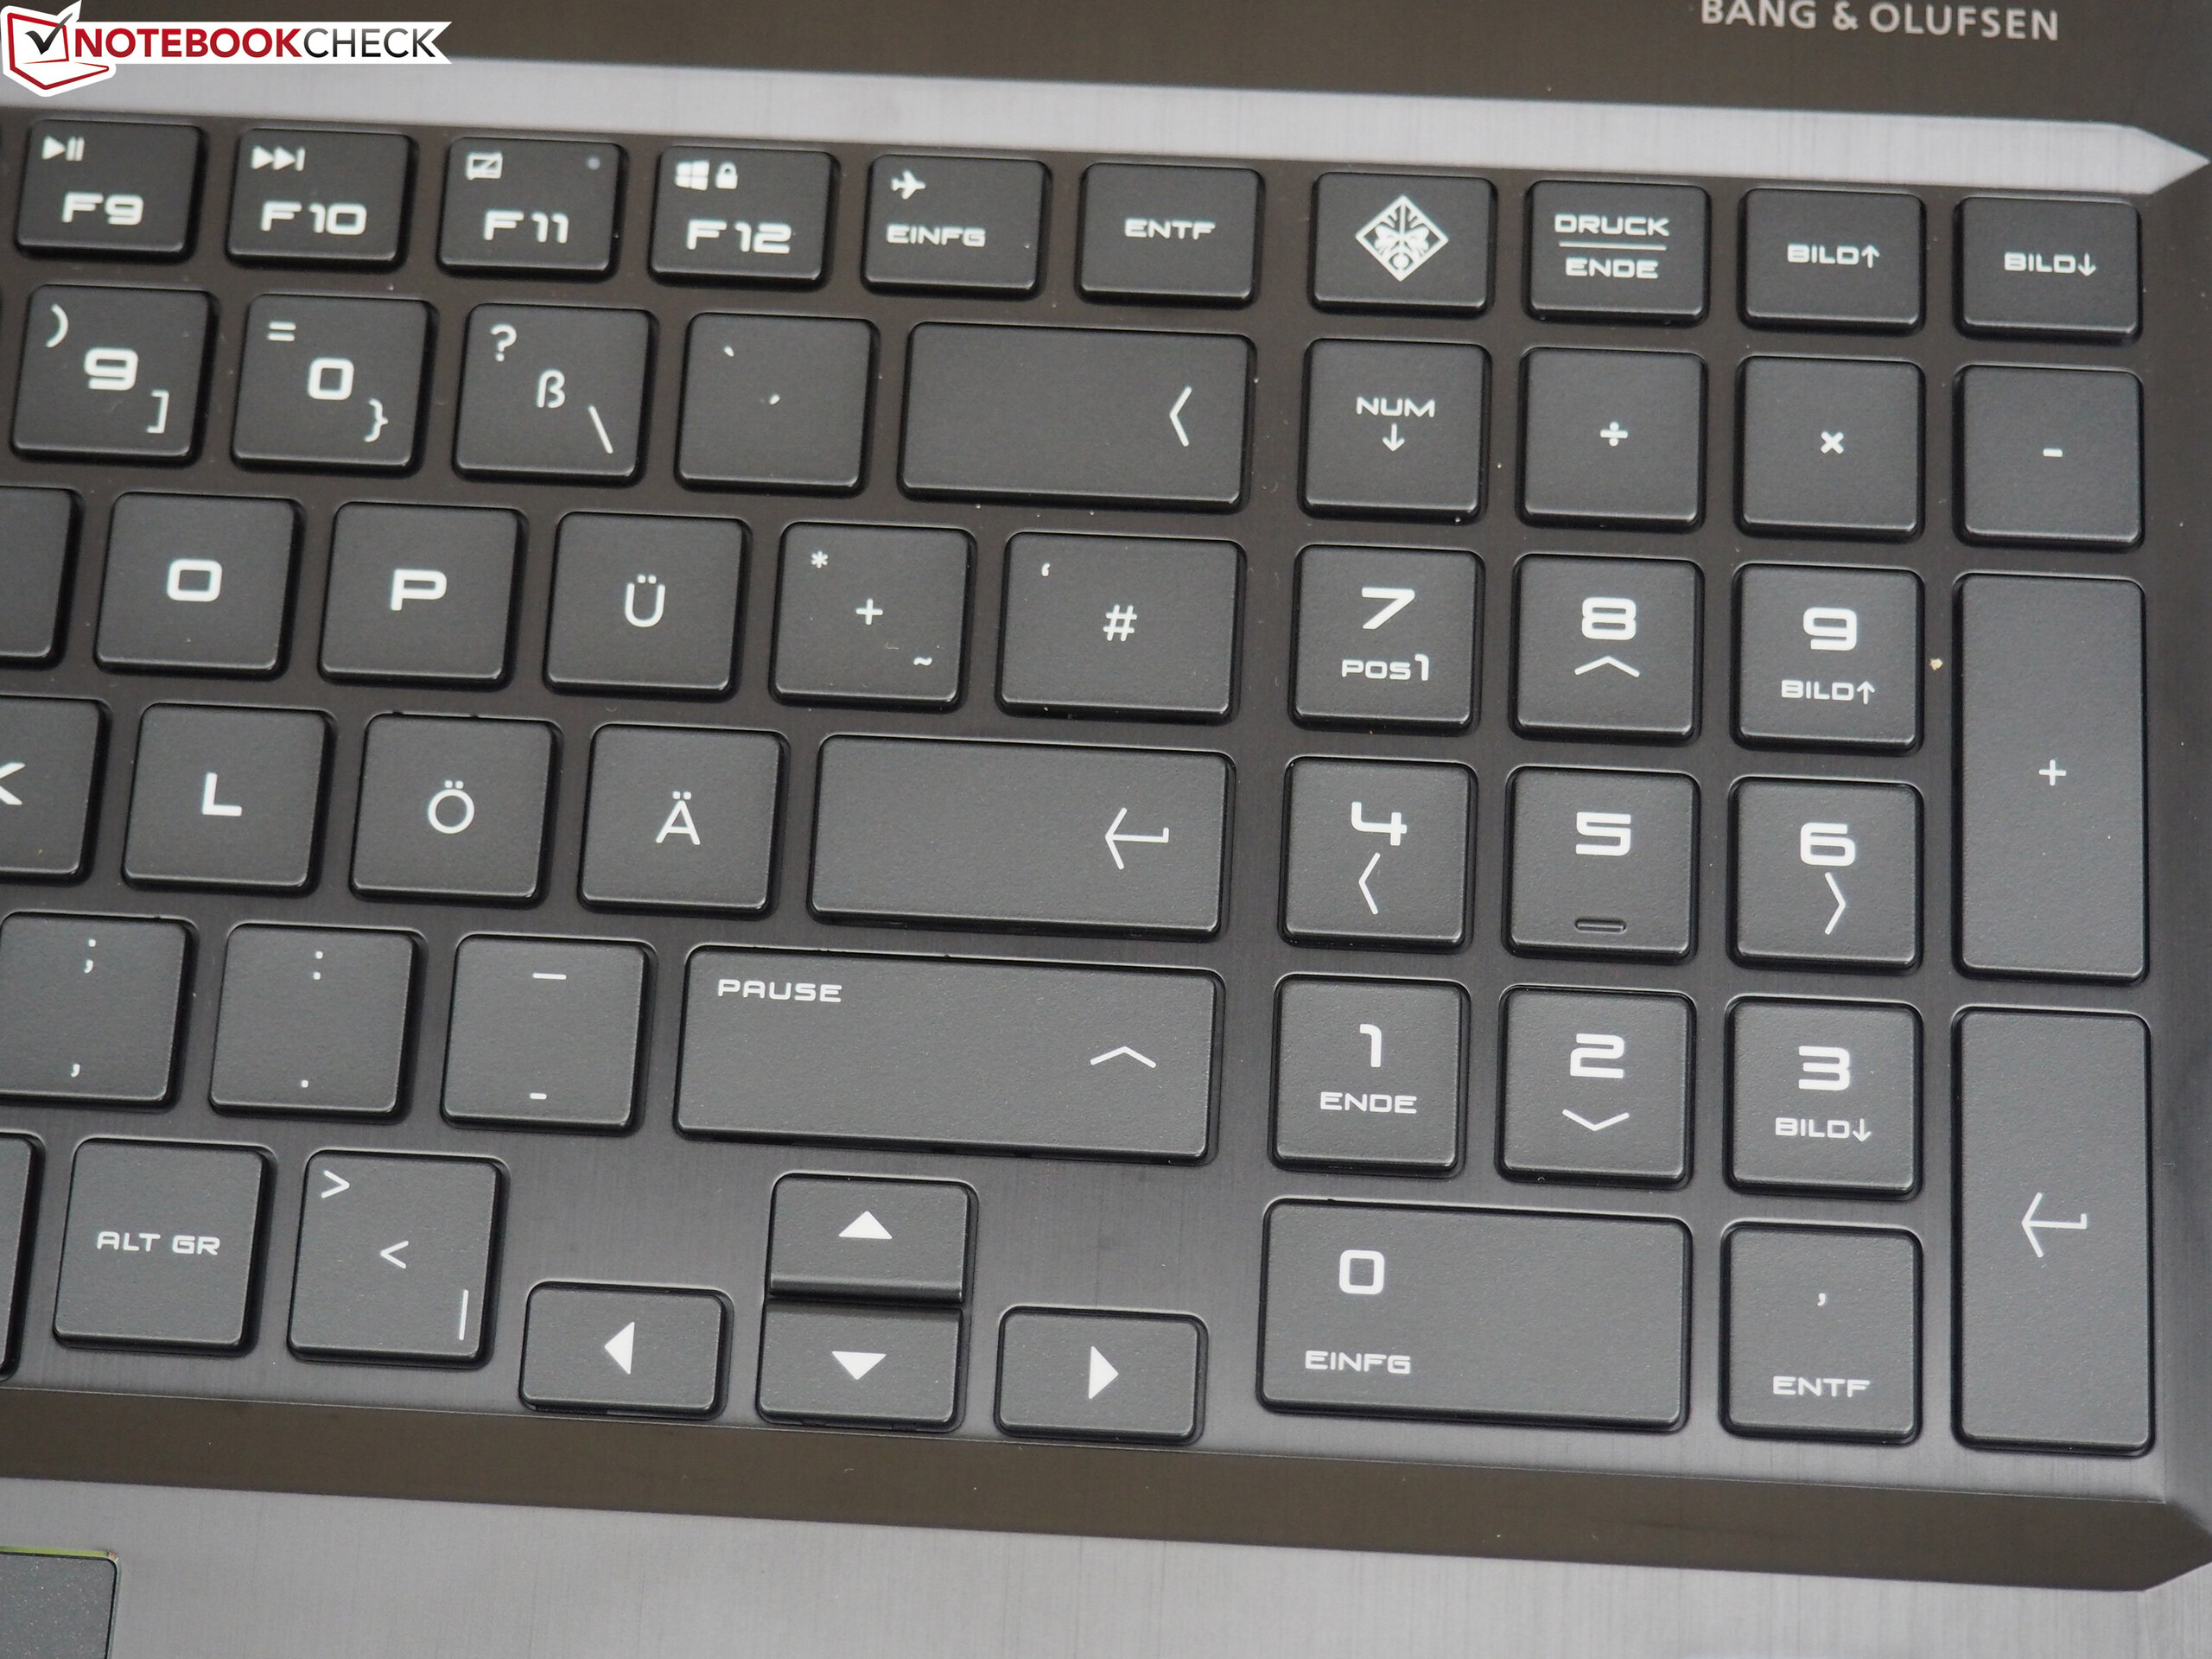
O painel IPS FHD mate oferece amplos ângulos de visão e uma relação de contraste decente. No entanto, seu brilho máximo é muito baixo e ainda mais reduzido com a bateria, e a cobertura do espaço de cores foi decepcionante, por dizer o mínimo. Esperamos mais de um portátil na faixa de preço do Omen 15. O teclado é utilizável e inclui uma luz de fundo. Infelizmente, o Omen 15 não possui o Thunderbolt 3, o que teria permitido o uso de uma GPU externa mais potente.
HP Omen 15-dc1020ng
- 09/20/2019 v7 (old)
Sascha Mölck
Price comparison
